Rutherfordton, NC Map & Demographics
Rutherfordton Map
Rutherfordton Overview
$31,631
PER CAPITA INCOME
$74,356
AVG FAMILY INCOME
$58,913
AVG HOUSEHOLD INCOME
20.9%
WAGE / INCOME GAP [ % ]
79.1¢/ $1
WAGE / INCOME GAP [ $ ]
0.47
INEQUALITY / GINI INDEX
3,671
TOTAL POPULATION
1,611
MALE POPULATION
2,060
FEMALE POPULATION
78.20
MALES / 100 FEMALES
127.87
FEMALES / 100 MALES
40.0
MEDIAN AGE
3.0
AVG FAMILY SIZE
2.4
AVG HOUSEHOLD SIZE
1,575
LABOR FORCE [ PEOPLE ]
54.1%
PERCENT IN LABOR FORCE
4.0%
UNEMPLOYMENT RATE
Rutherfordton Zip Codes
Rutherfordton Area Codes
Income in Rutherfordton
Income Overview in Rutherfordton
Per Capita Income in Rutherfordton is $31,631, while median incomes of families and households are $74,356 and $58,913 respectively.
| Characteristic | Number | Measure |
| Per Capita Income | 3,671 | $31,631 |
| Median Family Income | 876 | $74,356 |
| Mean Family Income | 876 | $99,935 |
| Median Household Income | 1,436 | $58,913 |
| Mean Household Income | 1,436 | $80,168 |
| Income Deficit | 876 | $0 |
| Wage / Income Gap (%) | 3,671 | 20.92% |
| Wage / Income Gap ($) | 3,671 | 79.08¢ per $1 |
| Gini / Inequality Index | 3,671 | 0.47 |
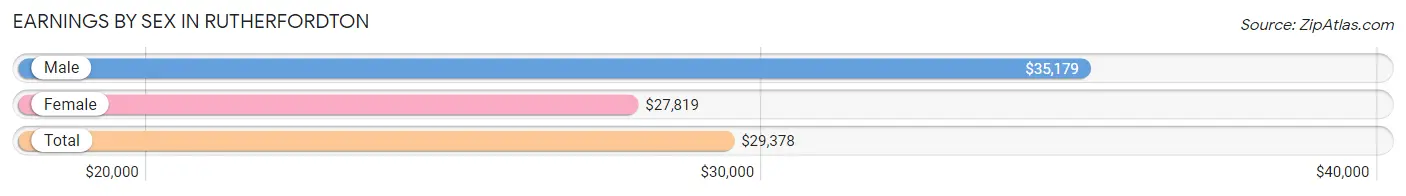
Earnings by Sex in Rutherfordton
Average Earnings in Rutherfordton are $29,378, $35,179 for men and $27,819 for women, a difference of 20.9%.
| Sex | Number | Average Earnings |
| Male | 907 (54.6%) | $35,179 |
| Female | 755 (45.4%) | $27,819 |
| Total | 1,662 (100.0%) | $29,378 |
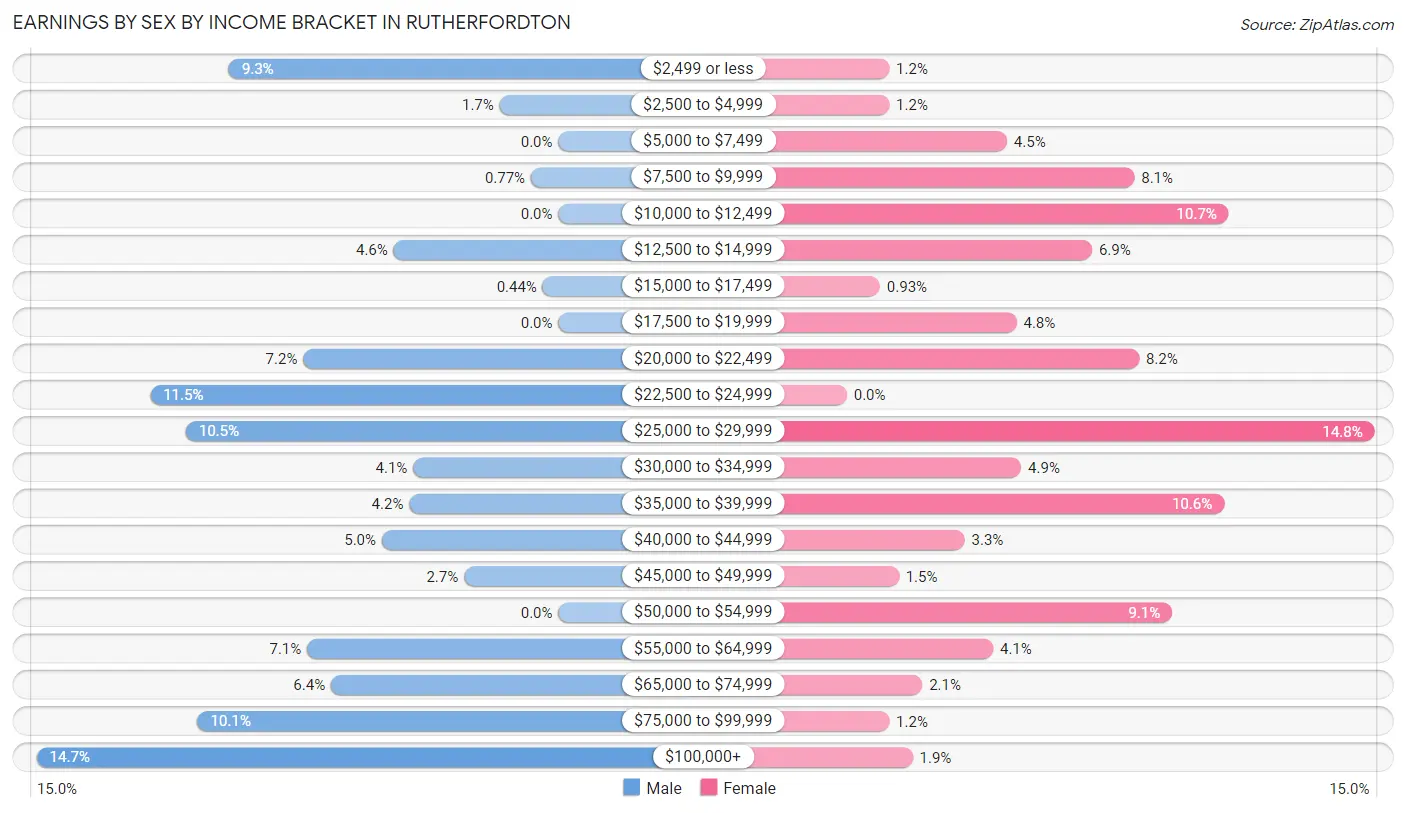
Earnings by Sex by Income Bracket in Rutherfordton
The most common earnings brackets in Rutherfordton are $100,000+ for men (133 | 14.7%) and $25,000 to $29,999 for women (112 | 14.8%).
| Income | Male | Female |
| $2,499 or less | 84 (9.3%) | 9 (1.2%) |
| $2,500 to $4,999 | 15 (1.7%) | 9 (1.2%) |
| $5,000 to $7,499 | 0 (0.0%) | 34 (4.5%) |
| $7,500 to $9,999 | 7 (0.8%) | 61 (8.1%) |
| $10,000 to $12,499 | 0 (0.0%) | 81 (10.7%) |
| $12,500 to $14,999 | 42 (4.6%) | 52 (6.9%) |
| $15,000 to $17,499 | 4 (0.4%) | 7 (0.9%) |
| $17,500 to $19,999 | 0 (0.0%) | 36 (4.8%) |
| $20,000 to $22,499 | 65 (7.2%) | 62 (8.2%) |
| $22,500 to $24,999 | 104 (11.5%) | 0 (0.0%) |
| $25,000 to $29,999 | 95 (10.5%) | 112 (14.8%) |
| $30,000 to $34,999 | 37 (4.1%) | 37 (4.9%) |
| $35,000 to $39,999 | 38 (4.2%) | 80 (10.6%) |
| $40,000 to $44,999 | 45 (5.0%) | 25 (3.3%) |
| $45,000 to $49,999 | 24 (2.6%) | 11 (1.5%) |
| $50,000 to $54,999 | 0 (0.0%) | 69 (9.1%) |
| $55,000 to $64,999 | 64 (7.1%) | 31 (4.1%) |
| $65,000 to $74,999 | 58 (6.4%) | 16 (2.1%) |
| $75,000 to $99,999 | 92 (10.1%) | 9 (1.2%) |
| $100,000+ | 133 (14.7%) | 14 (1.8%) |
| Total | 907 (100.0%) | 755 (100.0%) |
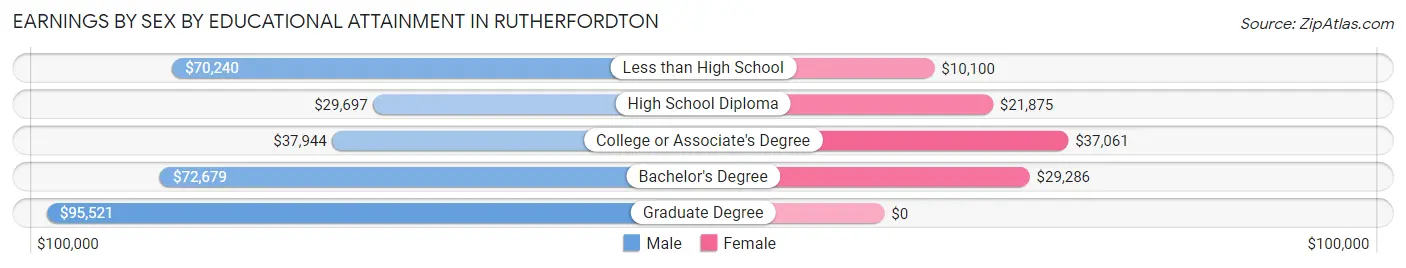
Earnings by Sex by Educational Attainment in Rutherfordton
Average earnings in Rutherfordton are $39,113 for men and $29,250 for women, a difference of 25.2%. Men with an educational attainment of graduate degree enjoy the highest average annual earnings of $95,521, while those with high school diploma education earn the least with $29,697. Women with an educational attainment of college or associate's degree earn the most with the average annual earnings of $37,061, while those with less than high school education have the smallest earnings of $10,100.
| Educational Attainment | Male Income | Female Income |
| Less than High School | $70,240 | $10,100 |
| High School Diploma | $29,697 | $21,875 |
| College or Associate's Degree | $37,944 | $37,061 |
| Bachelor's Degree | $72,679 | $29,286 |
| Graduate Degree | $95,521 | $0 |
| Total | $39,113 | $29,250 |
Family Income in Rutherfordton
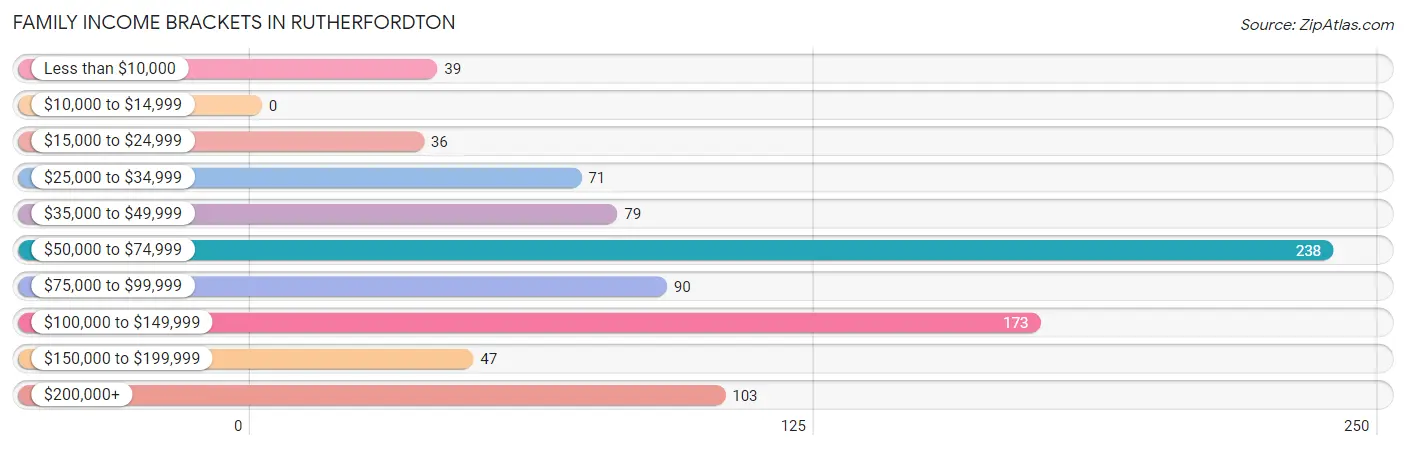
Family Income Brackets in Rutherfordton
According to the Rutherfordton family income data, there are 238 families falling into the $50,000 to $74,999 income range, which is the most common income bracket and makes up 27.2% of all families.
| Income Bracket | # Families | % Families |
| Less than $10,000 | 39 | 4.5% |
| $10,000 to $14,999 | 0 | 0.0% |
| $15,000 to $24,999 | 36 | 4.1% |
| $25,000 to $34,999 | 71 | 8.1% |
| $35,000 to $49,999 | 79 | 9.0% |
| $50,000 to $74,999 | 238 | 27.2% |
| $75,000 to $99,999 | 90 | 10.3% |
| $100,000 to $149,999 | 173 | 19.7% |
| $150,000 to $199,999 | 47 | 5.4% |
| $200,000+ | 103 | 11.8% |
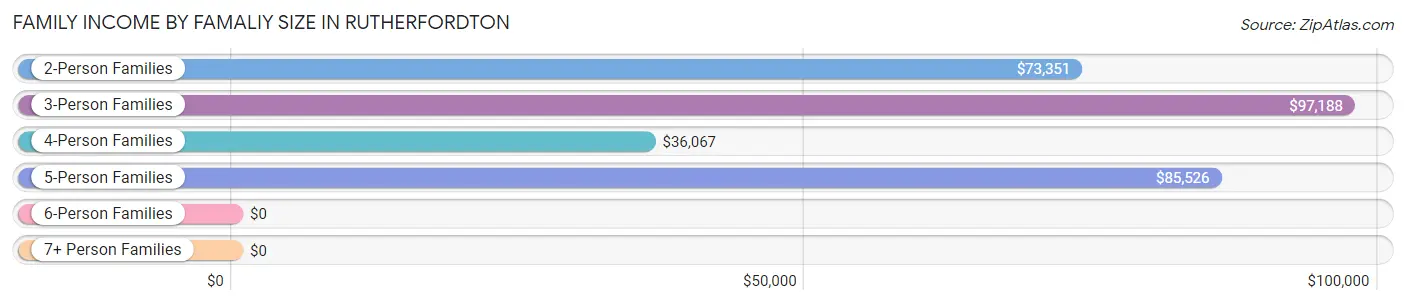
Family Income by Famaliy Size in Rutherfordton
3-person families (209 | 23.9%) account for the highest median family income in Rutherfordton with $97,188 per family, while 2-person families (472 | 53.9%) have the highest median income of $36,676 per family member.
| Income Bracket | # Families | Median Income |
| 2-Person Families | 472 (53.9%) | $73,351 |
| 3-Person Families | 209 (23.9%) | $97,188 |
| 4-Person Families | 139 (15.9%) | $36,067 |
| 5-Person Families | 30 (3.4%) | $85,526 |
| 6-Person Families | 26 (3.0%) | $0 |
| 7+ Person Families | 0 (0.0%) | $0 |
| Total | 876 (100.0%) | $74,356 |
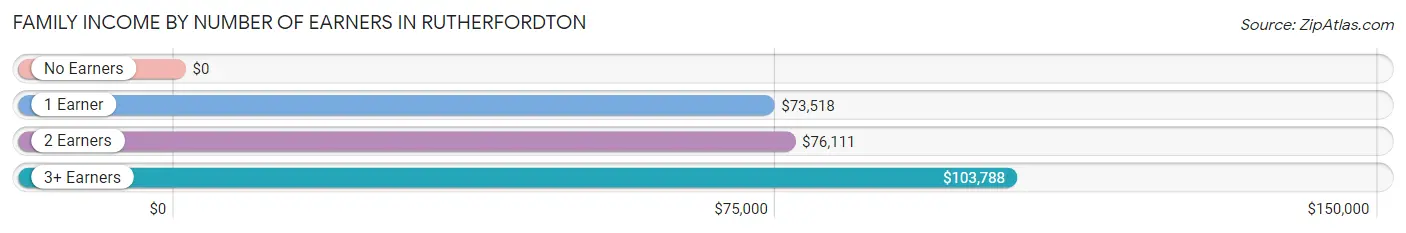
Family Income by Number of Earners in Rutherfordton
| Number of Earners | # Families | Median Income |
| No Earners | 119 (13.6%) | $0 |
| 1 Earner | 425 (48.5%) | $73,518 |
| 2 Earners | 248 (28.3%) | $76,111 |
| 3+ Earners | 84 (9.6%) | $103,788 |
| Total | 876 (100.0%) | $74,356 |
Household Income in Rutherfordton
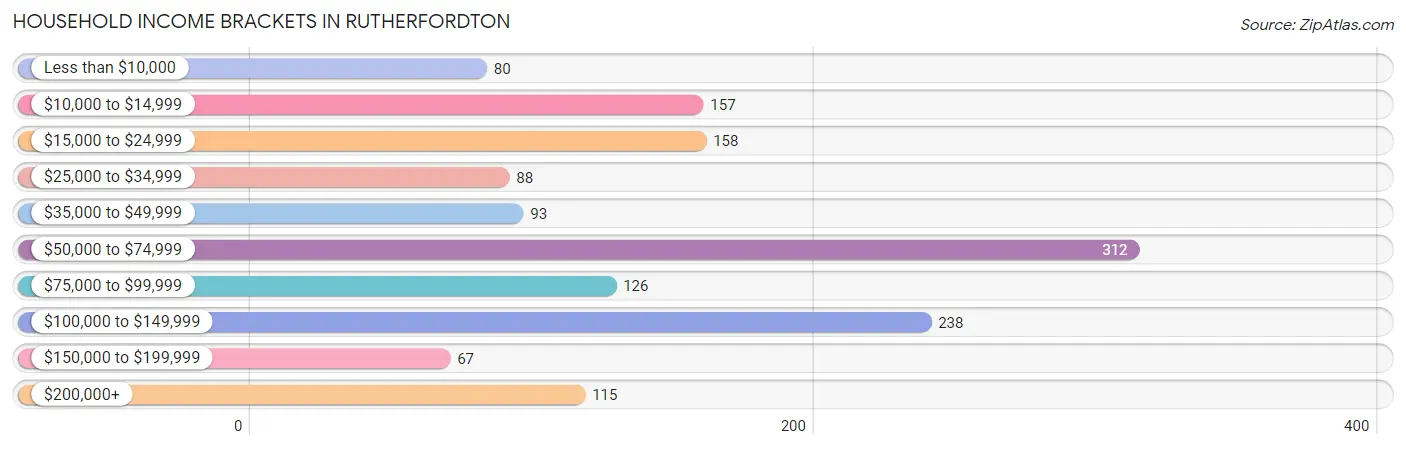
Household Income Brackets in Rutherfordton
With 312 households falling in the category, the $50,000 to $74,999 income range is the most frequent in Rutherfordton, accounting for 21.7% of all households. In contrast, only 67 households (4.7%) fall into the $150,000 to $199,999 income bracket, making it the least populous group.
| Income Bracket | # Households | % Households |
| Less than $10,000 | 80 | 5.6% |
| $10,000 to $14,999 | 157 | 10.9% |
| $15,000 to $24,999 | 158 | 11.0% |
| $25,000 to $34,999 | 88 | 6.1% |
| $35,000 to $49,999 | 93 | 6.5% |
| $50,000 to $74,999 | 312 | 21.7% |
| $75,000 to $99,999 | 126 | 8.8% |
| $100,000 to $149,999 | 238 | 16.6% |
| $150,000 to $199,999 | 67 | 4.7% |
| $200,000+ | 115 | 8.0% |
Household Income by Householder Age in Rutherfordton
The median household income in Rutherfordton is $58,913, with the highest median household income of $76,389 found in the 25 to 44 years age bracket for the primary householder. A total of 536 households (37.3%) fall into this category. Meanwhile, the 15 to 24 years age bracket for the primary householder has the lowest median household income of $0, with 12 households (0.8%) in this group.
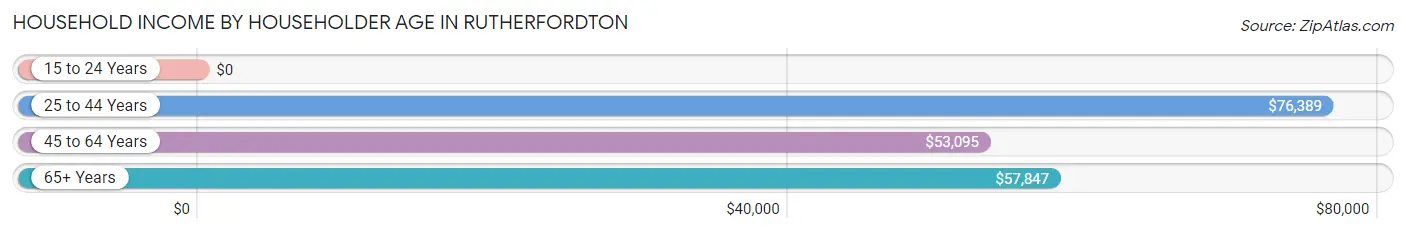
| Income Bracket | # Households | Median Income |
| 15 to 24 Years | 12 (0.8%) | $0 |
| 25 to 44 Years | 536 (37.3%) | $76,389 |
| 45 to 64 Years | 338 (23.5%) | $53,095 |
| 65+ Years | 550 (38.3%) | $57,847 |
| Total | 1,436 (100.0%) | $58,913 |
Poverty in Rutherfordton
Income Below Poverty by Sex and Age in Rutherfordton
With 13.9% poverty level for males and 18.8% for females among the residents of Rutherfordton, 16 and 17 year old males and 5 year old females are the most vulnerable to poverty, with 17 males (100.0%) and 55 females (100.0%) in their respective age groups living below the poverty level.
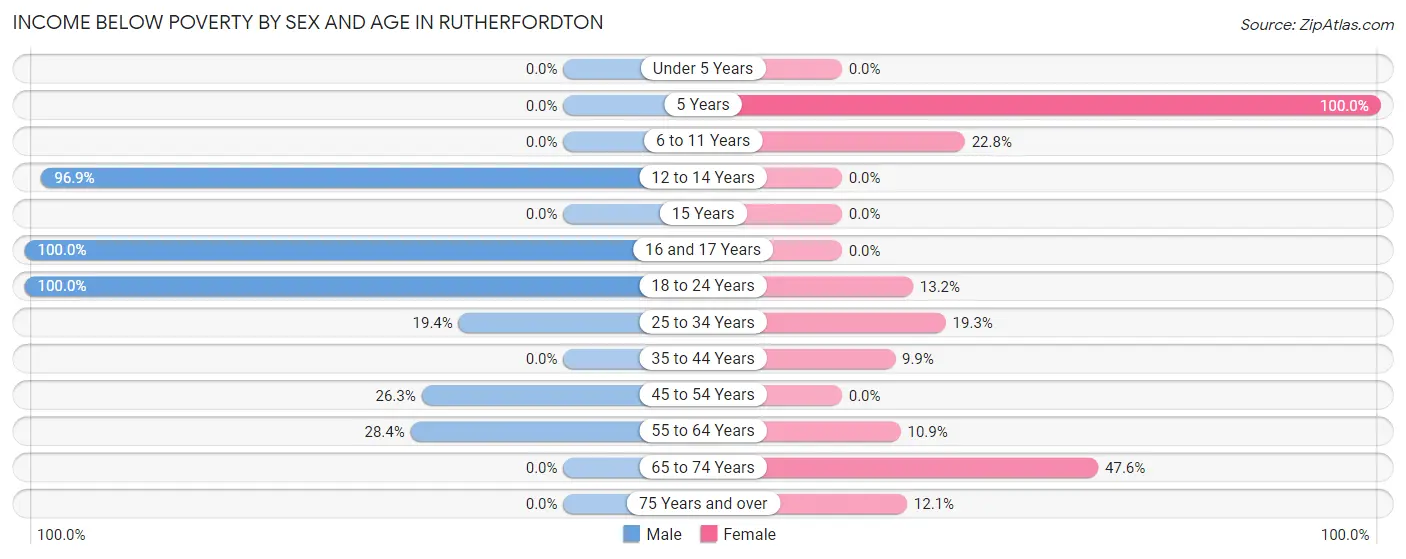
| Age Bracket | Male | Female |
| Under 5 Years | 0 (0.0%) | 0 (0.0%) |
| 5 Years | 0 (0.0%) | 55 (100.0%) |
| 6 to 11 Years | 0 (0.0%) | 55 (22.8%) |
| 12 to 14 Years | 31 (96.9%) | 0 (0.0%) |
| 15 Years | 0 (0.0%) | 0 (0.0%) |
| 16 and 17 Years | 17 (100.0%) | 0 (0.0%) |
| 18 to 24 Years | 36 (100.0%) | 19 (13.2%) |
| 25 to 34 Years | 42 (19.4%) | 59 (19.3%) |
| 35 to 44 Years | 0 (0.0%) | 16 (9.9%) |
| 45 to 54 Years | 10 (26.3%) | 0 (0.0%) |
| 55 to 64 Years | 61 (28.4%) | 35 (10.9%) |
| 65 to 74 Years | 0 (0.0%) | 108 (47.6%) |
| 75 Years and over | 0 (0.0%) | 33 (12.1%) |
| Total | 197 (13.9%) | 380 (18.8%) |
Income Above Poverty by Sex and Age in Rutherfordton
According to the poverty statistics in Rutherfordton, males aged under 5 years and females aged under 5 years are the age groups that are most secure financially, with 100.0% of males and 100.0% of females in these age groups living above the poverty line.
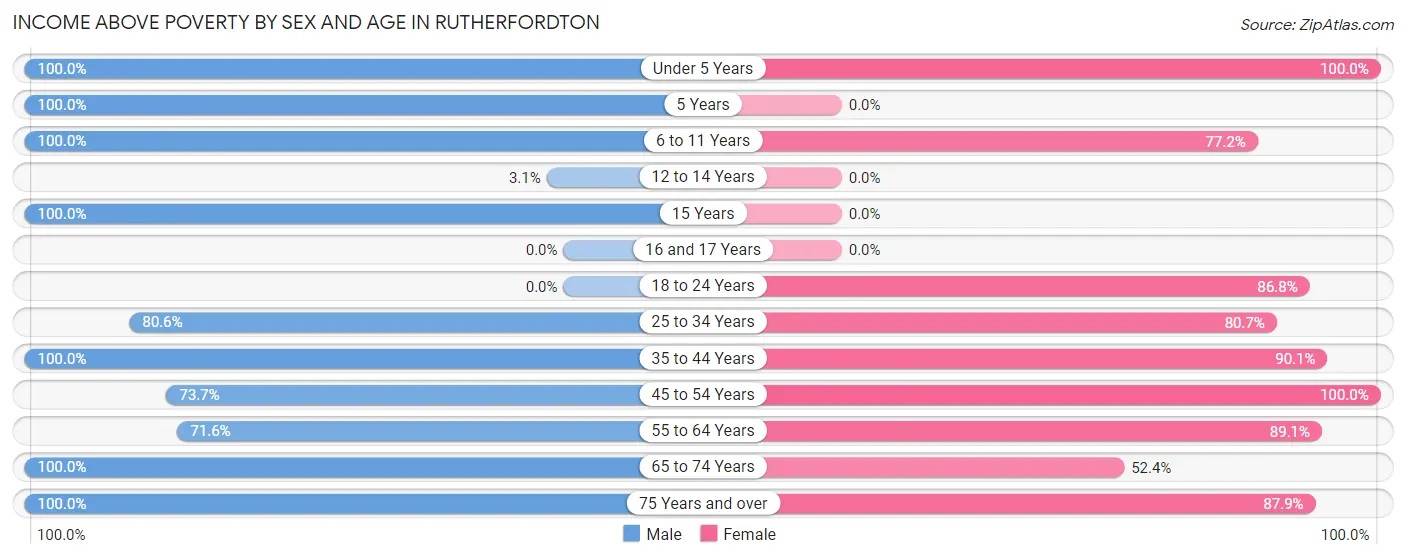
| Age Bracket | Male | Female |
| Under 5 Years | 48 (100.0%) | 216 (100.0%) |
| 5 Years | 20 (100.0%) | 0 (0.0%) |
| 6 to 11 Years | 115 (100.0%) | 186 (77.2%) |
| 12 to 14 Years | 1 (3.1%) | 0 (0.0%) |
| 15 Years | 33 (100.0%) | 0 (0.0%) |
| 16 and 17 Years | 0 (0.0%) | 0 (0.0%) |
| 18 to 24 Years | 0 (0.0%) | 125 (86.8%) |
| 25 to 34 Years | 174 (80.6%) | 247 (80.7%) |
| 35 to 44 Years | 254 (100.0%) | 146 (90.1%) |
| 45 to 54 Years | 28 (73.7%) | 77 (100.0%) |
| 55 to 64 Years | 154 (71.6%) | 286 (89.1%) |
| 65 to 74 Years | 240 (100.0%) | 119 (52.4%) |
| 75 Years and over | 153 (100.0%) | 240 (87.9%) |
| Total | 1,220 (86.1%) | 1,642 (81.2%) |
Income Below Poverty Among Married-Couple Families in Rutherfordton
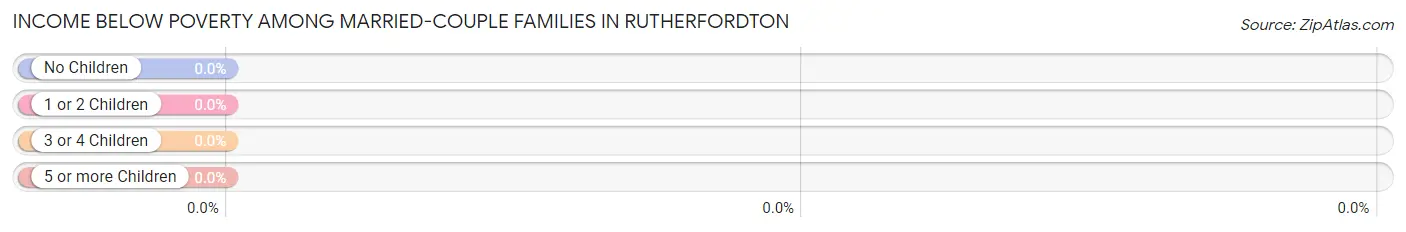
| Children | Above Poverty | Below Poverty |
| No Children | 428 (100.0%) | 0 (0.0%) |
| 1 or 2 Children | 197 (100.0%) | 0 (0.0%) |
| 3 or 4 Children | 20 (100.0%) | 0 (0.0%) |
| 5 or more Children | 0 (0.0%) | 0 (0.0%) |
| Total | 645 (100.0%) | 0 (0.0%) |
Income Below Poverty Among Single-Parent Households in Rutherfordton
According to the poverty data in Rutherfordton, 19.8% or 23 single-father households and 45.2% or 52 single-mother households are living below the poverty line. Among single-father households, those with no children have the highest poverty rate, with 23 households (39.0%) experiencing poverty. Likewise, among single-mother households, those with 3 or 4 children have the highest poverty rate, with 36 households (100.0%) falling below the poverty line.
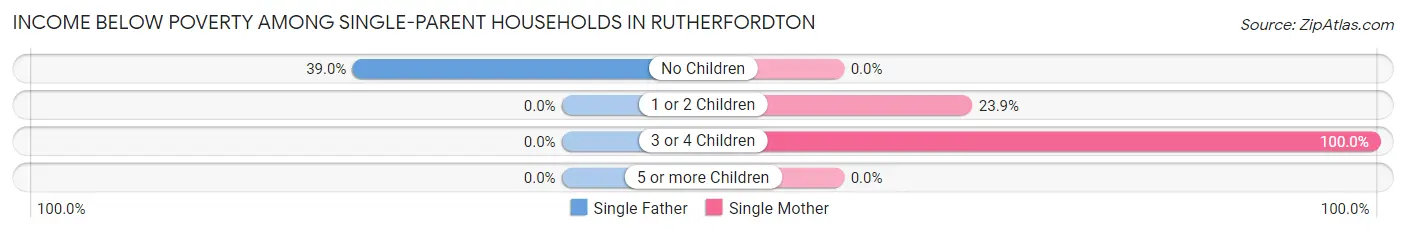
| Children | Single Father | Single Mother |
| No Children | 23 (39.0%) | 0 (0.0%) |
| 1 or 2 Children | 0 (0.0%) | 16 (23.9%) |
| 3 or 4 Children | 0 (0.0%) | 36 (100.0%) |
| 5 or more Children | 0 (0.0%) | 0 (0.0%) |
| Total | 23 (19.8%) | 52 (45.2%) |
Income Below Poverty Among Married-Couple vs Single-Parent Households in Rutherfordton
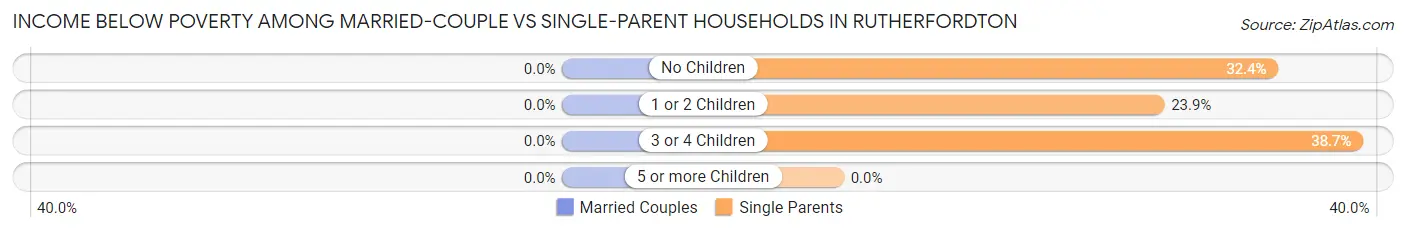
| Children | Married-Couple Families | Single-Parent Households |
| No Children | 0 (0.0%) | 23 (32.4%) |
| 1 or 2 Children | 0 (0.0%) | 16 (23.9%) |
| 3 or 4 Children | 0 (0.0%) | 36 (38.7%) |
| 5 or more Children | 0 (0.0%) | 0 (0.0%) |
| Total | 0 (0.0%) | 75 (32.5%) |
Race in Rutherfordton
The most populous races in Rutherfordton are White / Caucasian (2,807 | 76.5%), Hispanic or Latino (429 | 11.7%), and Two or more Races (400 | 10.9%).
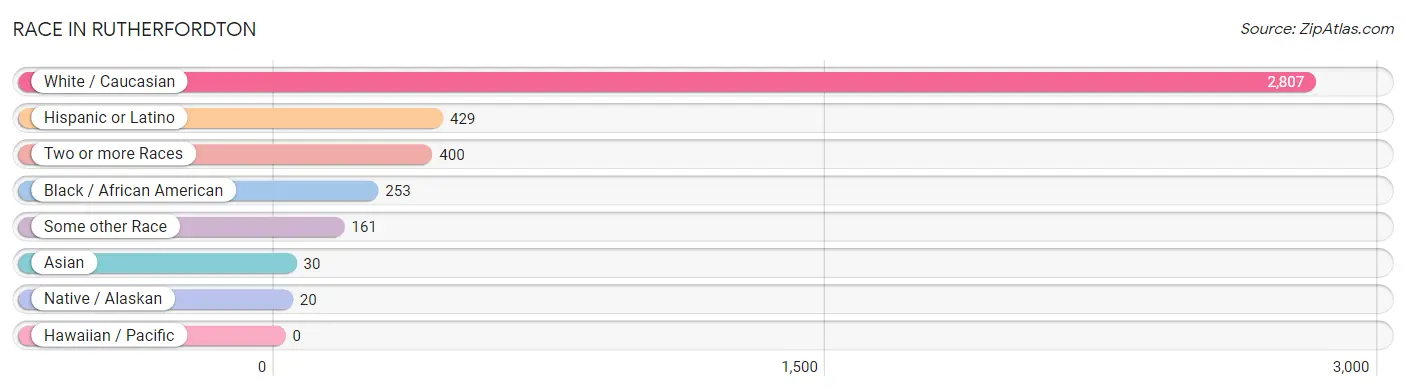
| Race | # Population | % Population |
| Asian | 30 | 0.8% |
| Black / African American | 253 | 6.9% |
| Hawaiian / Pacific | 0 | 0.0% |
| Hispanic or Latino | 429 | 11.7% |
| Native / Alaskan | 20 | 0.5% |
| White / Caucasian | 2,807 | 76.5% |
| Two or more Races | 400 | 10.9% |
| Some other Race | 161 | 4.4% |
| Total | 3,671 | 100.0% |
Ancestry in Rutherfordton
The most populous ancestries reported in Rutherfordton are English (573 | 15.6%), American (372 | 10.1%), Mexican (268 | 7.3%), Irish (262 | 7.1%), and Italian (219 | 6.0%), together accounting for 46.2% of all Rutherfordton residents.
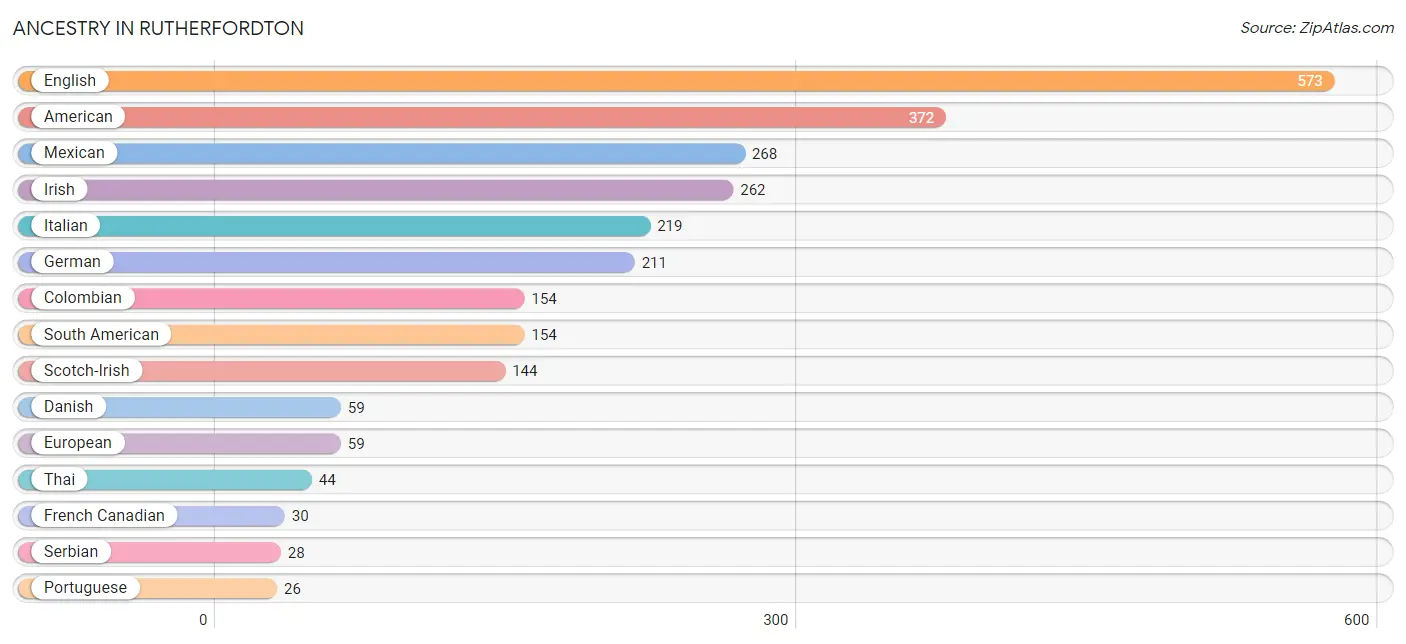
| Ancestry | # Population | % Population |
| American | 372 | 10.1% |
| Belgian | 19 | 0.5% |
| Brazilian | 12 | 0.3% |
| British | 5 | 0.1% |
| Colombian | 154 | 4.2% |
| Danish | 59 | 1.6% |
| Dutch | 18 | 0.5% |
| English | 573 | 15.6% |
| European | 59 | 1.6% |
| Finnish | 11 | 0.3% |
| French Canadian | 30 | 0.8% |
| German | 211 | 5.8% |
| Irish | 262 | 7.1% |
| Italian | 219 | 6.0% |
| Lumbee | 8 | 0.2% |
| Mexican | 268 | 7.3% |
| Polish | 14 | 0.4% |
| Portuguese | 26 | 0.7% |
| Russian | 18 | 0.5% |
| Scotch-Irish | 144 | 3.9% |
| Scottish | 22 | 0.6% |
| Serbian | 28 | 0.8% |
| South American | 154 | 4.2% |
| Thai | 44 | 1.2% | View All 24 Rows |
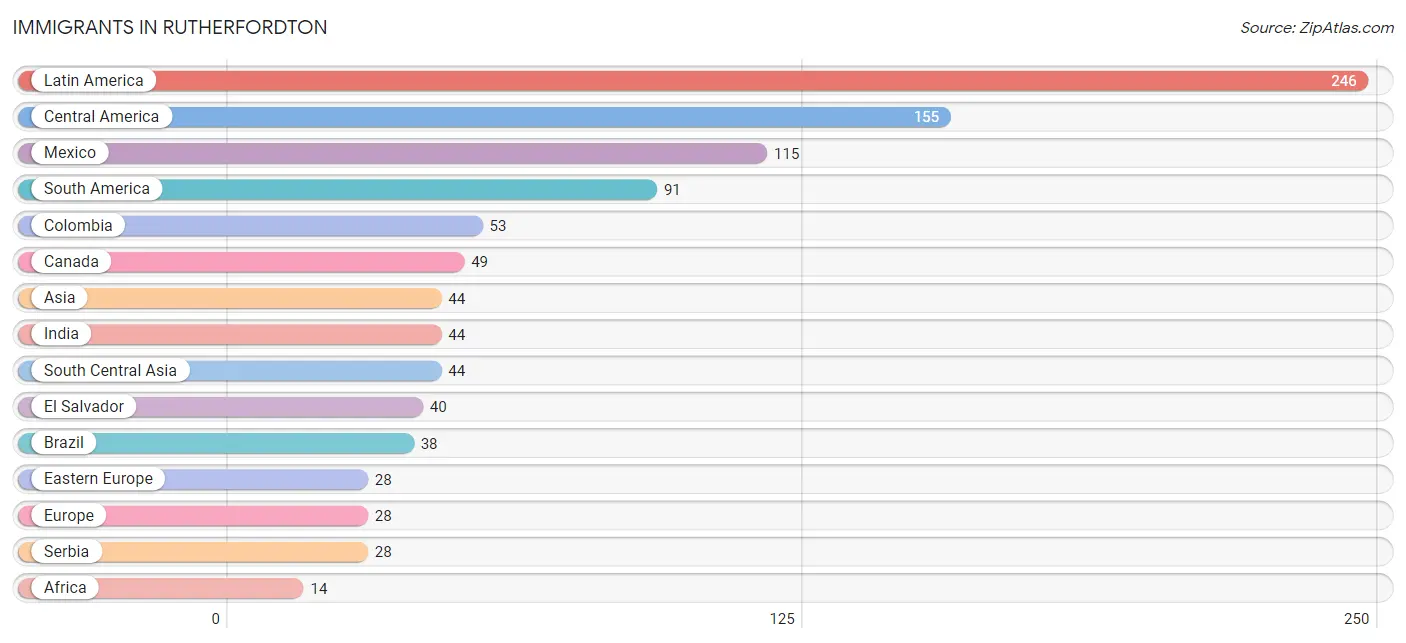
Immigrants in Rutherfordton
The most numerous immigrant groups reported in Rutherfordton came from Latin America (246 | 6.7%), Central America (155 | 4.2%), Mexico (115 | 3.1%), South America (91 | 2.5%), and Colombia (53 | 1.4%), together accounting for 18.0% of all Rutherfordton residents.
| Immigration Origin | # Population | % Population |
| Africa | 14 | 0.4% |
| Asia | 44 | 1.2% |
| Brazil | 38 | 1.0% |
| Canada | 49 | 1.3% |
| Central America | 155 | 4.2% |
| Colombia | 53 | 1.4% |
| Eastern Europe | 28 | 0.8% |
| El Salvador | 40 | 1.1% |
| Europe | 28 | 0.8% |
| India | 44 | 1.2% |
| Latin America | 246 | 6.7% |
| Mexico | 115 | 3.1% |
| Serbia | 28 | 0.8% |
| South Africa | 14 | 0.4% |
| South America | 91 | 2.5% |
| South Central Asia | 44 | 1.2% | View All 16 Rows |
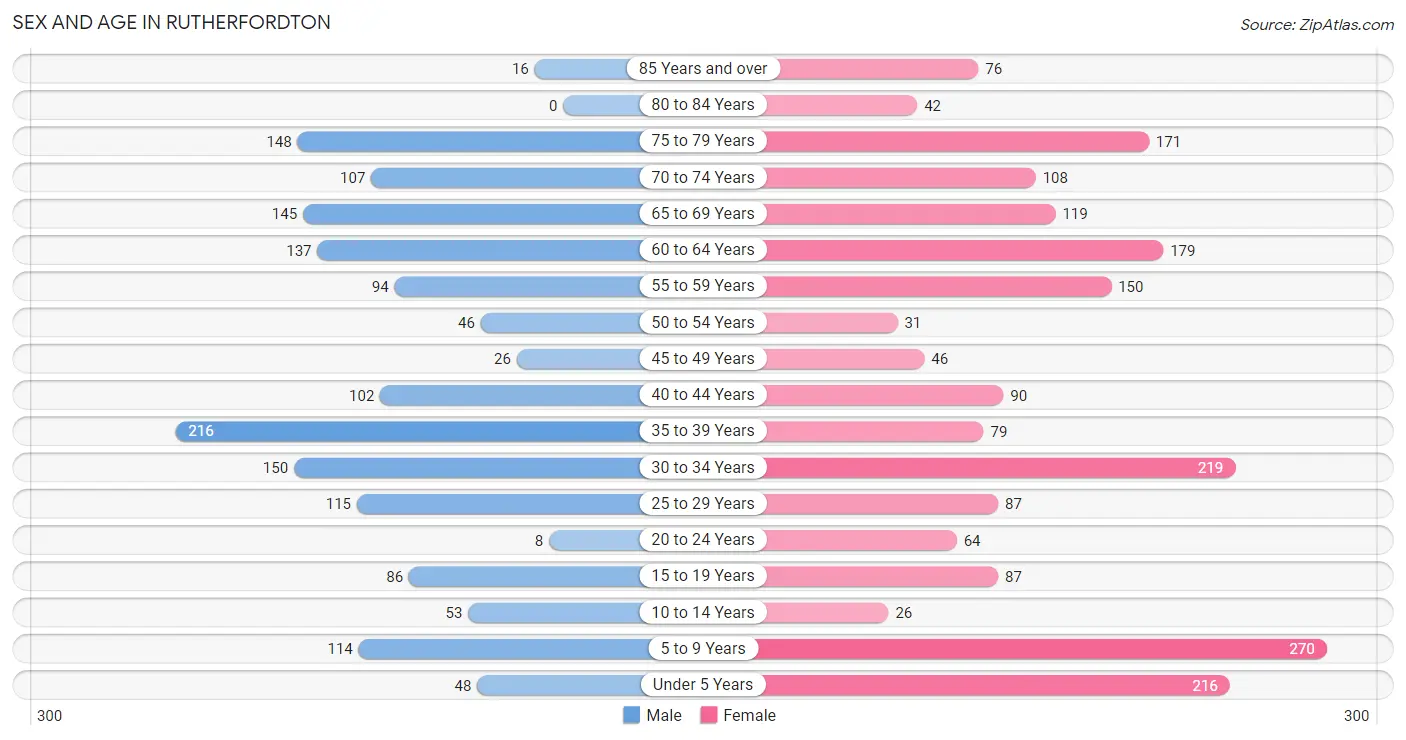
Sex and Age in Rutherfordton
Sex and Age in Rutherfordton
The most populous age groups in Rutherfordton are 35 to 39 Years (216 | 13.4%) for men and 5 to 9 Years (270 | 13.1%) for women.
| Age Bracket | Male | Female |
| Under 5 Years | 48 (3.0%) | 216 (10.5%) |
| 5 to 9 Years | 114 (7.1%) | 270 (13.1%) |
| 10 to 14 Years | 53 (3.3%) | 26 (1.3%) |
| 15 to 19 Years | 86 (5.3%) | 87 (4.2%) |
| 20 to 24 Years | 8 (0.5%) | 64 (3.1%) |
| 25 to 29 Years | 115 (7.1%) | 87 (4.2%) |
| 30 to 34 Years | 150 (9.3%) | 219 (10.6%) |
| 35 to 39 Years | 216 (13.4%) | 79 (3.8%) |
| 40 to 44 Years | 102 (6.3%) | 90 (4.4%) |
| 45 to 49 Years | 26 (1.6%) | 46 (2.2%) |
| 50 to 54 Years | 46 (2.9%) | 31 (1.5%) |
| 55 to 59 Years | 94 (5.8%) | 150 (7.3%) |
| 60 to 64 Years | 137 (8.5%) | 179 (8.7%) |
| 65 to 69 Years | 145 (9.0%) | 119 (5.8%) |
| 70 to 74 Years | 107 (6.6%) | 108 (5.2%) |
| 75 to 79 Years | 148 (9.2%) | 171 (8.3%) |
| 80 to 84 Years | 0 (0.0%) | 42 (2.0%) |
| 85 Years and over | 16 (1.0%) | 76 (3.7%) |
| Total | 1,611 (100.0%) | 2,060 (100.0%) |
Families and Households in Rutherfordton
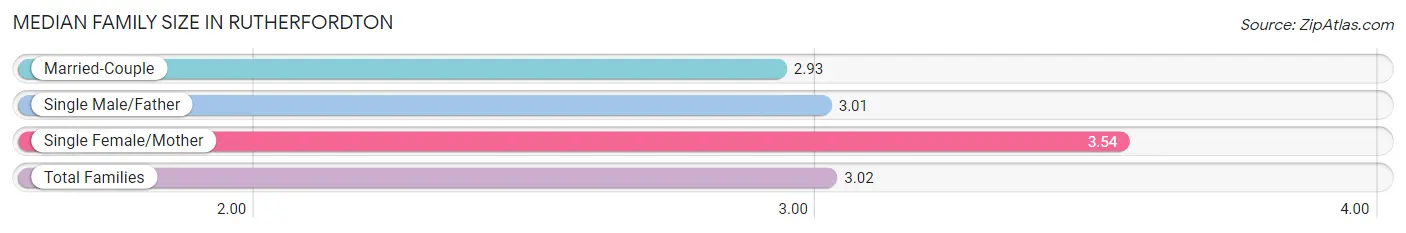
Median Family Size in Rutherfordton
The median family size in Rutherfordton is 3.02 persons per family, with single female/mother families (115 | 13.1%) accounting for the largest median family size of 3.54 persons per family. On the other hand, married-couple families (645 | 73.6%) represent the smallest median family size with 2.93 persons per family.
| Family Type | # Families | Family Size |
| Married-Couple | 645 (73.6%) | 2.93 |
| Single Male/Father | 116 (13.2%) | 3.01 |
| Single Female/Mother | 115 (13.1%) | 3.54 |
| Total Families | 876 (100.0%) | 3.02 |
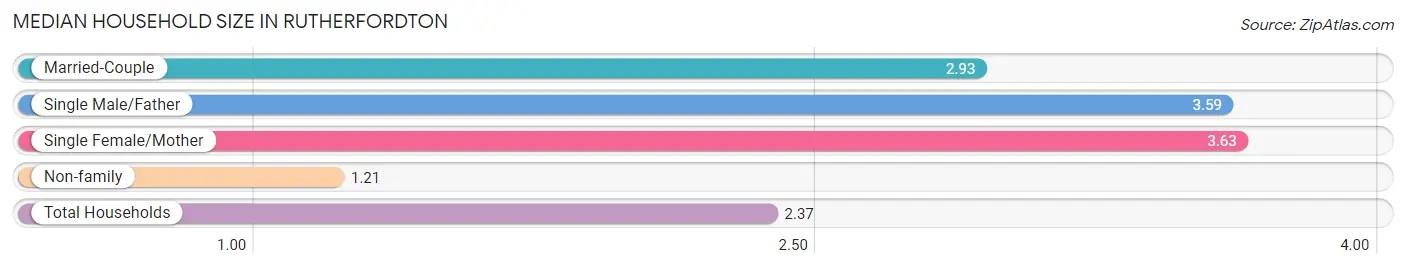
Median Household Size in Rutherfordton
The median household size in Rutherfordton is 2.37 persons per household, with single female/mother households (115 | 8.0%) accounting for the largest median household size of 3.63 persons per household. non-family households (560 | 39.0%) represent the smallest median household size with 1.21 persons per household.
| Household Type | # Households | Household Size |
| Married-Couple | 645 (44.9%) | 2.93 |
| Single Male/Father | 116 (8.1%) | 3.59 |
| Single Female/Mother | 115 (8.0%) | 3.63 |
| Non-family | 560 (39.0%) | 1.21 |
| Total Households | 1,436 (100.0%) | 2.37 |
Household Size by Marriage Status in Rutherfordton
Out of a total of 1,436 households in Rutherfordton, 876 (61.0%) are family households, while 560 (39.0%) are nonfamily households. The most numerous type of family households are 2-person households, comprising 457, and the most common type of nonfamily households are 1-person households, comprising 460.
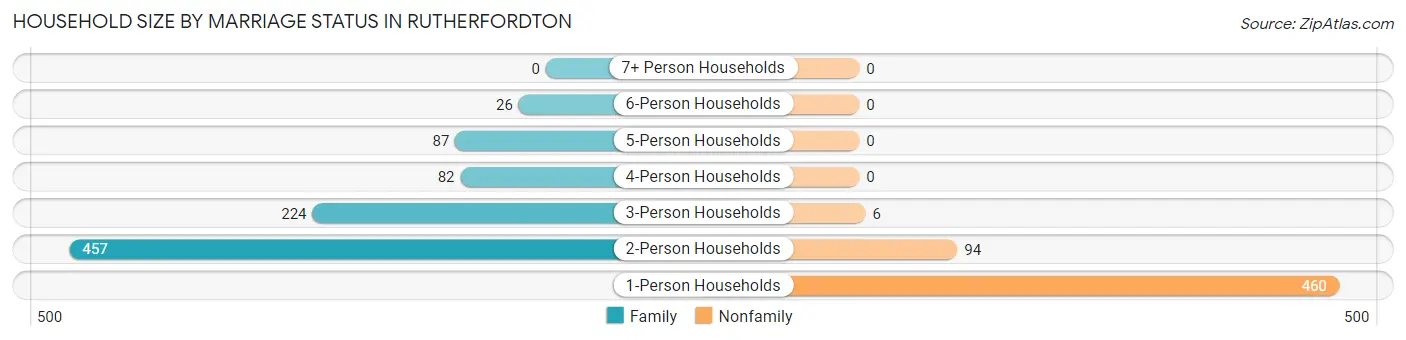
| Household Size | Family Households | Nonfamily Households |
| 1-Person Households | - | 460 (32.0%) |
| 2-Person Households | 457 (31.8%) | 94 (6.6%) |
| 3-Person Households | 224 (15.6%) | 6 (0.4%) |
| 4-Person Households | 82 (5.7%) | 0 (0.0%) |
| 5-Person Households | 87 (6.1%) | 0 (0.0%) |
| 6-Person Households | 26 (1.8%) | 0 (0.0%) |
| 7+ Person Households | 0 (0.0%) | 0 (0.0%) |
| Total | 876 (61.0%) | 560 (39.0%) |
Female Fertility in Rutherfordton
Fertility by Age in Rutherfordton
Average fertility rate in Rutherfordton is 32.0 births per 1,000 women. Women in the age bracket of 20 to 34 years have the highest fertility rate with 59.0 births per 1,000 women. Women in the age bracket of 20 to 34 years acount for 100.0% of all women with births.
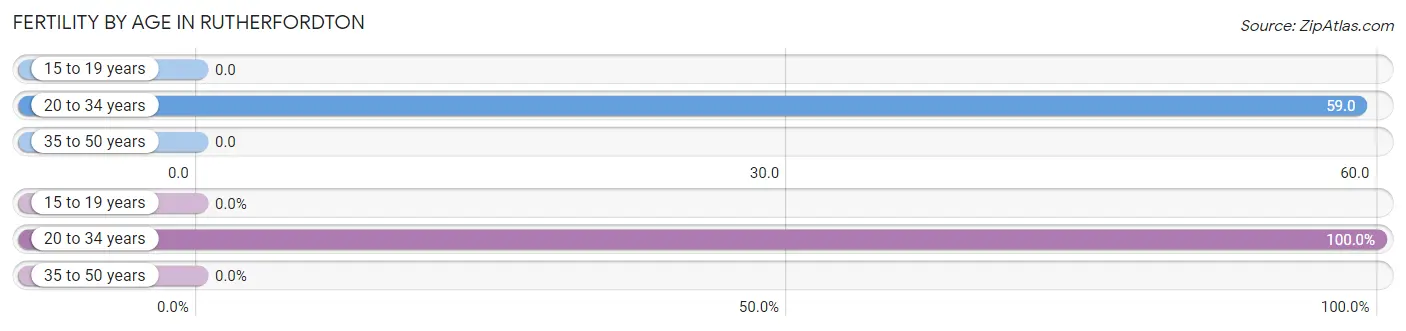
| Age Bracket | Women with Births | Births / 1,000 Women |
| 15 to 19 years | 0 (0.0%) | 0.0 |
| 20 to 34 years | 22 (100.0%) | 59.0 |
| 35 to 50 years | 0 (0.0%) | 0.0 |
| Total | 22 (100.0%) | 32.0 |
Fertility by Age by Marriage Status in Rutherfordton
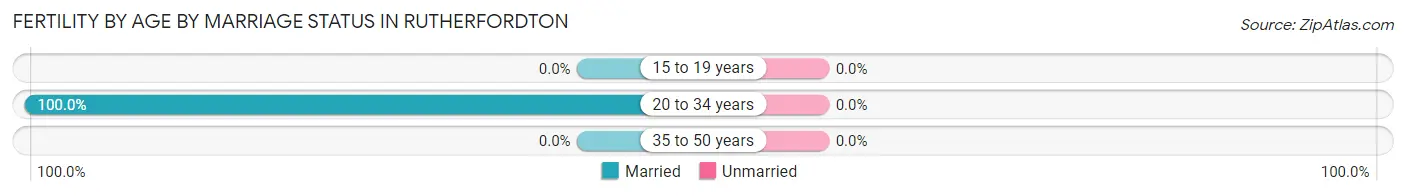
| Age Bracket | Married | Unmarried |
| 15 to 19 years | 0 (0.0%) | 0 (0.0%) |
| 20 to 34 years | 22 (100.0%) | 0 (0.0%) |
| 35 to 50 years | 0 (0.0%) | 0 (0.0%) |
| Total | 22 (100.0%) | 0 (0.0%) |
Fertility by Education in Rutherfordton
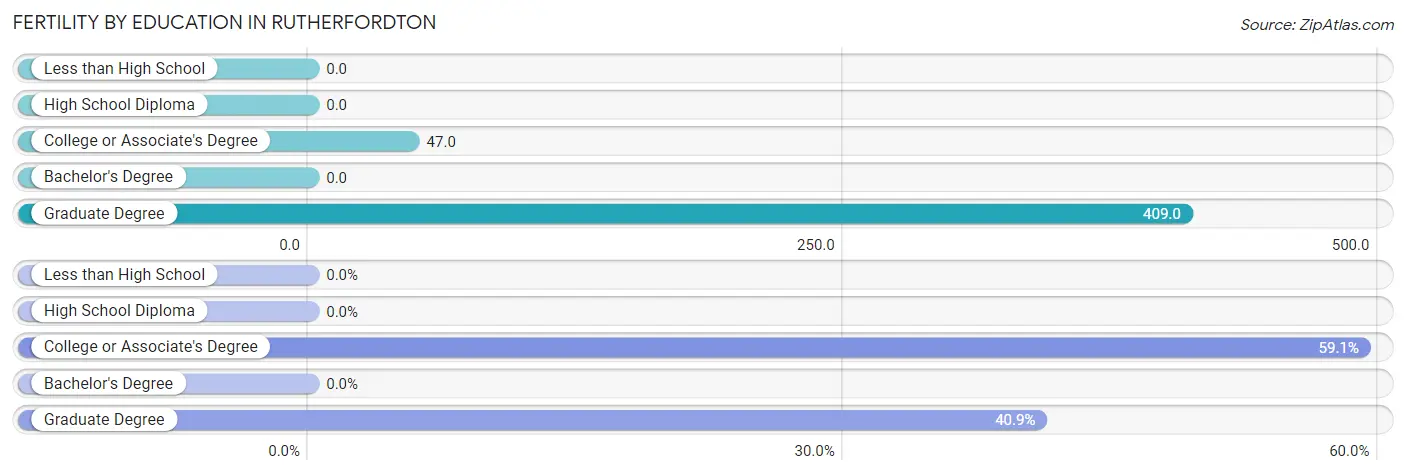
| Educational Attainment | Women with Births | Births / 1,000 Women |
| Less than High School | 0 (0.0%) | 0.0 |
| High School Diploma | 0 (0.0%) | 0.0 |
| College or Associate's Degree | 13 (59.1%) | 47.0 |
| Bachelor's Degree | 0 (0.0%) | 0.0 |
| Graduate Degree | 9 (40.9%) | 409.0 |
| Total | 22 (100.0%) | 32.0 |
Fertility by Education by Marriage Status in Rutherfordton
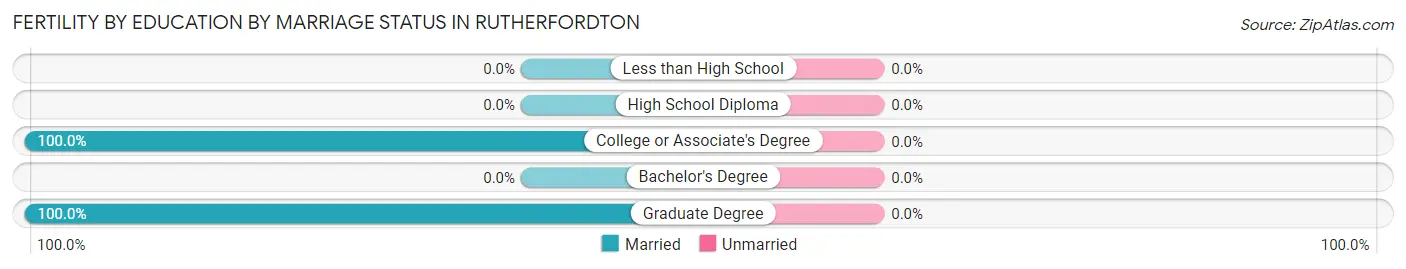
| Educational Attainment | Married | Unmarried |
| Less than High School | 0 (0.0%) | 0 (0.0%) |
| High School Diploma | 0 (0.0%) | 0 (0.0%) |
| College or Associate's Degree | 13 (100.0%) | 0 (0.0%) |
| Bachelor's Degree | 0 (0.0%) | 0 (0.0%) |
| Graduate Degree | 9 (100.0%) | 0 (0.0%) |
| Total | 22 (100.0%) | 0 (0.0%) |
Employment Characteristics in Rutherfordton
Employment by Class of Employer in Rutherfordton
Among the 1,443 employed individuals in Rutherfordton, private company employees (995 | 69.0%), not-for-profit organizations (107 | 7.4%), and self-employed (not incorporated) (97 | 6.7%) make up the most common classes of employment.
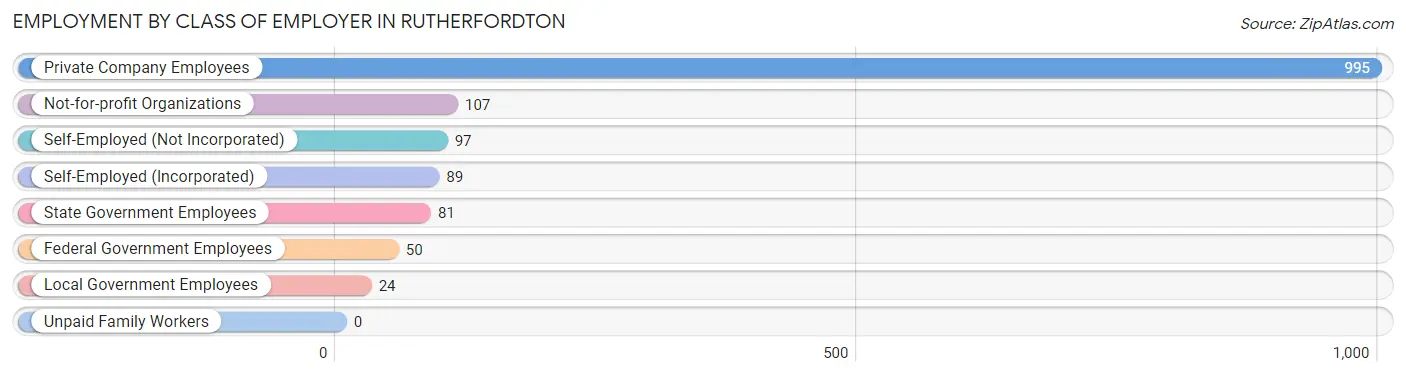
| Employer Class | # Employees | % Employees |
| Private Company Employees | 995 | 69.0% |
| Self-Employed (Incorporated) | 89 | 6.2% |
| Self-Employed (Not Incorporated) | 97 | 6.7% |
| Not-for-profit Organizations | 107 | 7.4% |
| Local Government Employees | 24 | 1.7% |
| State Government Employees | 81 | 5.6% |
| Federal Government Employees | 50 | 3.5% |
| Unpaid Family Workers | 0 | 0.0% |
| Total | 1,443 | 100.0% |
Employment Status by Age in Rutherfordton
According to the labor force statistics for Rutherfordton, out of the total population over 16 years of age (2,911), 54.1% or 1,575 individuals are in the labor force, with 4.0% or 63 of them unemployed. The age group with the highest labor force participation rate is 16 to 19 years, with 95.0% or 133 individuals in the labor force. Within the labor force, the 65 to 74 years age range has the highest percentage of unemployed individuals, with 32.7% or 35 of them being unemployed.
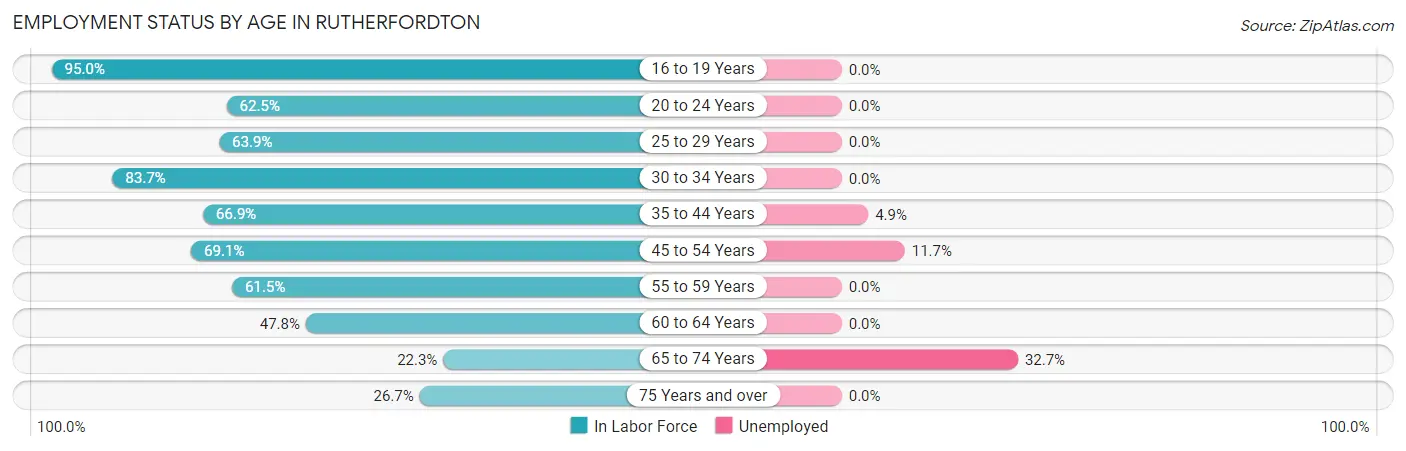
| Age Bracket | In Labor Force | Unemployed |
| 16 to 19 Years | 133 (95.0%) | 0 (0.0%) |
| 20 to 24 Years | 45 (62.5%) | 0 (0.0%) |
| 25 to 29 Years | 129 (63.9%) | 0 (0.0%) |
| 30 to 34 Years | 309 (83.7%) | 0 (0.0%) |
| 35 to 44 Years | 326 (66.9%) | 16 (4.9%) |
| 45 to 54 Years | 103 (69.1%) | 12 (11.7%) |
| 55 to 59 Years | 150 (61.5%) | 0 (0.0%) |
| 60 to 64 Years | 151 (47.8%) | 0 (0.0%) |
| 65 to 74 Years | 107 (22.3%) | 35 (32.7%) |
| 75 Years and over | 121 (26.7%) | 0 (0.0%) |
| Total | 1,575 (54.1%) | 63 (4.0%) |
Employment Status by Educational Attainment in Rutherfordton
According to labor force statistics for Rutherfordton, 66.1% of individuals (1,168) out of the total population between 25 and 64 years of age (1,767) are in the labor force, with 2.4% or 28 of them being unemployed. The group with the highest labor force participation rate are those with the educational attainment of college / associate degree, with 84.7% or 511 individuals in the labor force. Within the labor force, individuals with bachelor's degree or higher education have the highest percentage of unemployment, with 9.2% or 28 of them being unemployed.
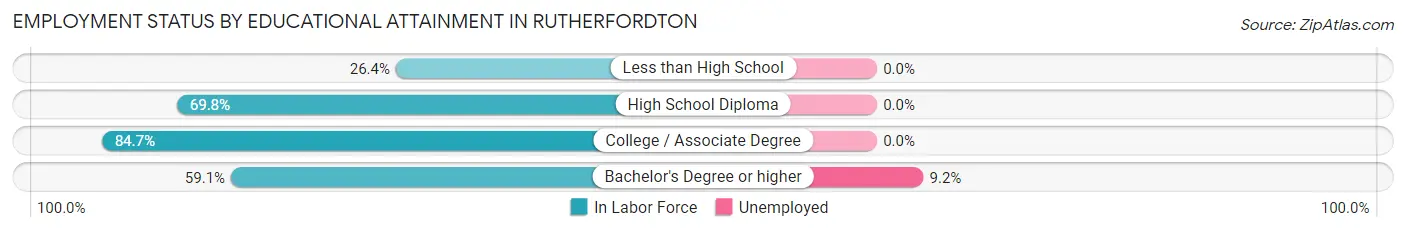
| Educational Attainment | In Labor Force | Unemployed |
| Less than High School | 61 (26.4%) | 0 (0.0%) |
| High School Diploma | 291 (69.8%) | 0 (0.0%) |
| College / Associate Degree | 511 (84.7%) | 0 (0.0%) |
| Bachelor's Degree or higher | 305 (59.1%) | 47 (9.2%) |
| Total | 1,168 (66.1%) | 42 (2.4%) |
Employment Occupations by Sex in Rutherfordton
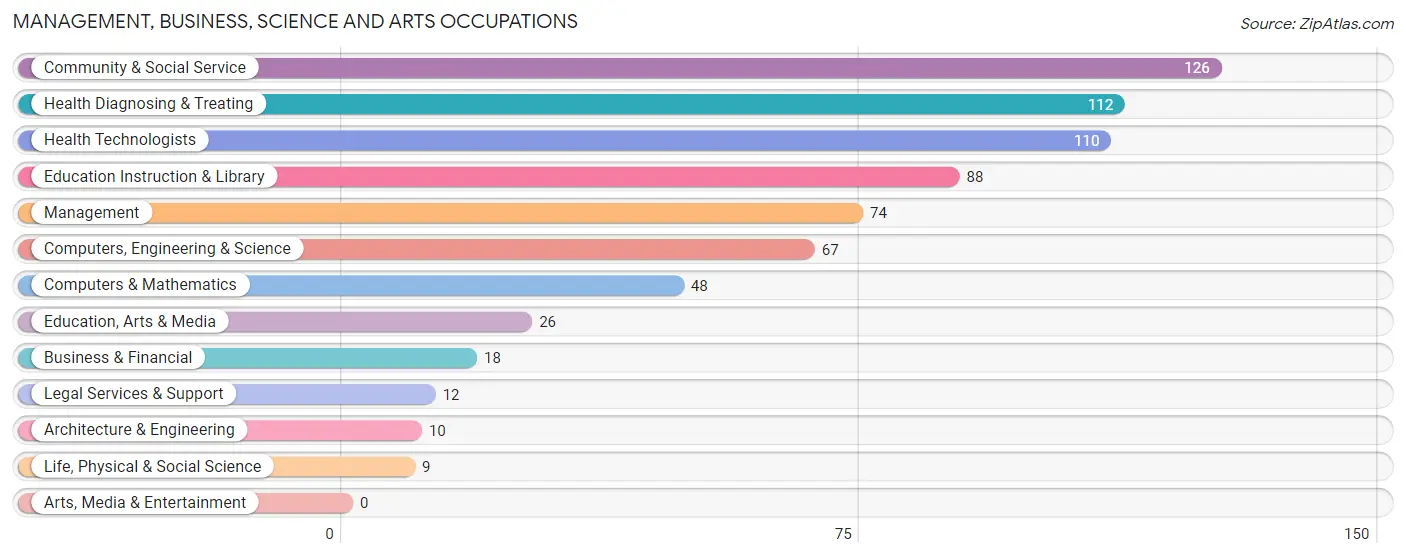
Management, Business, Science and Arts Occupations
The most common Management, Business, Science and Arts occupations in Rutherfordton are Community & Social Service (126 | 8.3%), Health Diagnosing & Treating (112 | 7.4%), Health Technologists (110 | 7.3%), Education Instruction & Library (88 | 5.8%), and Management (74 | 4.9%).
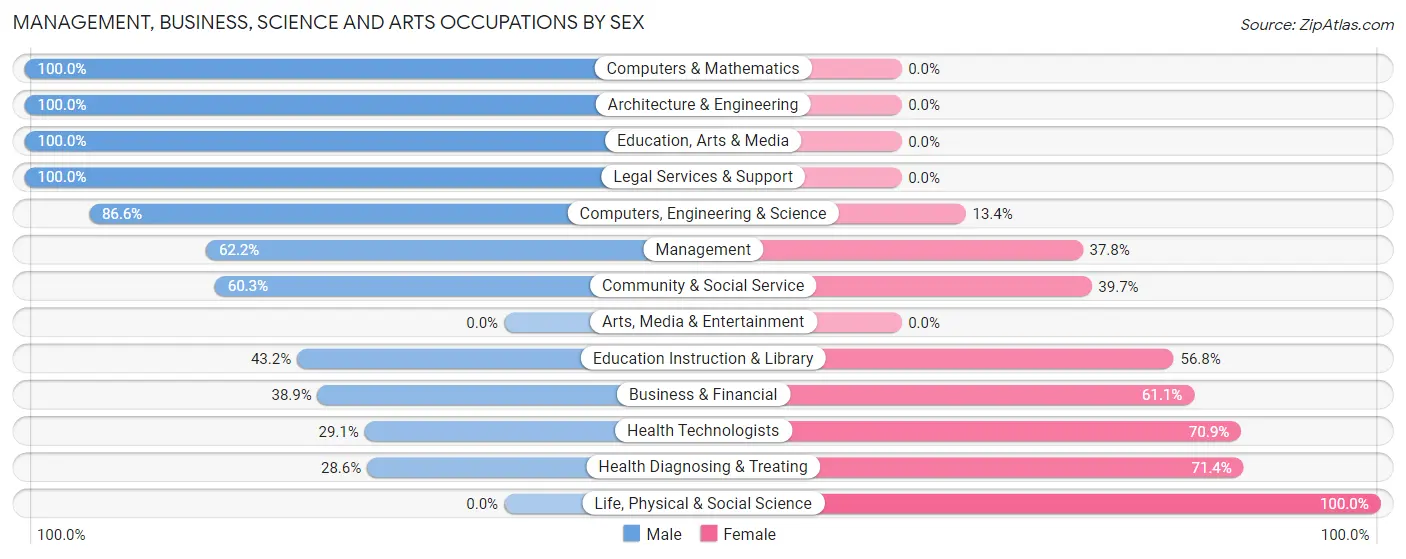
Management, Business, Science and Arts Occupations by Sex
Within the Management, Business, Science and Arts occupations in Rutherfordton, the most male-oriented occupations are Computers & Mathematics (100.0%), Architecture & Engineering (100.0%), and Education, Arts & Media (100.0%), while the most female-oriented occupations are Life, Physical & Social Science (100.0%), Health Diagnosing & Treating (71.4%), and Health Technologists (70.9%).
| Occupation | Male | Female |
| Management | 46 (62.2%) | 28 (37.8%) |
| Business & Financial | 7 (38.9%) | 11 (61.1%) |
| Computers, Engineering & Science | 58 (86.6%) | 9 (13.4%) |
| Computers & Mathematics | 48 (100.0%) | 0 (0.0%) |
| Architecture & Engineering | 10 (100.0%) | 0 (0.0%) |
| Life, Physical & Social Science | 0 (0.0%) | 9 (100.0%) |
| Community & Social Service | 76 (60.3%) | 50 (39.7%) |
| Education, Arts & Media | 26 (100.0%) | 0 (0.0%) |
| Legal Services & Support | 12 (100.0%) | 0 (0.0%) |
| Education Instruction & Library | 38 (43.2%) | 50 (56.8%) |
| Arts, Media & Entertainment | 0 (0.0%) | 0 (0.0%) |
| Health Diagnosing & Treating | 32 (28.6%) | 80 (71.4%) |
| Health Technologists | 32 (29.1%) | 78 (70.9%) |
| Total (Category) | 219 (55.2%) | 178 (44.8%) |
| Total (Overall) | 811 (53.7%) | 700 (46.3%) |
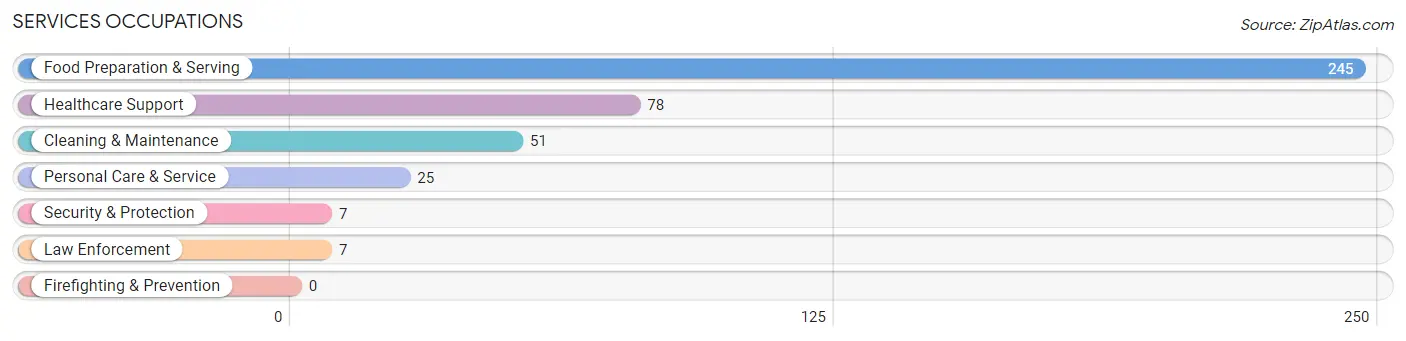
Services Occupations
The most common Services occupations in Rutherfordton are Food Preparation & Serving (245 | 16.2%), Healthcare Support (78 | 5.2%), Cleaning & Maintenance (51 | 3.4%), Personal Care & Service (25 | 1.7%), and Security & Protection (7 | 0.5%).
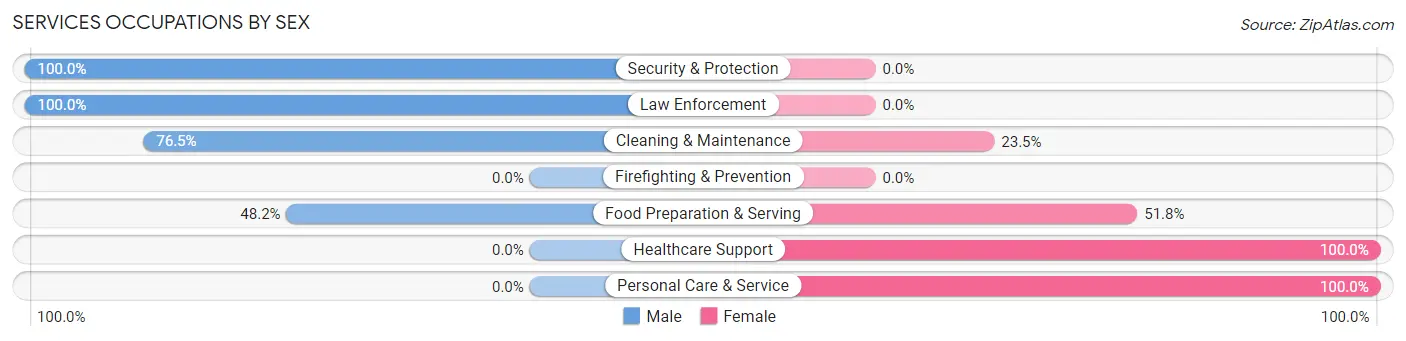
Services Occupations by Sex
Within the Services occupations in Rutherfordton, the most male-oriented occupations are Security & Protection (100.0%), Law Enforcement (100.0%), and Cleaning & Maintenance (76.5%), while the most female-oriented occupations are Healthcare Support (100.0%), Personal Care & Service (100.0%), and Food Preparation & Serving (51.8%).
| Occupation | Male | Female |
| Healthcare Support | 0 (0.0%) | 78 (100.0%) |
| Security & Protection | 7 (100.0%) | 0 (0.0%) |
| Firefighting & Prevention | 0 (0.0%) | 0 (0.0%) |
| Law Enforcement | 7 (100.0%) | 0 (0.0%) |
| Food Preparation & Serving | 118 (48.2%) | 127 (51.8%) |
| Cleaning & Maintenance | 39 (76.5%) | 12 (23.5%) |
| Personal Care & Service | 0 (0.0%) | 25 (100.0%) |
| Total (Category) | 164 (40.4%) | 242 (59.6%) |
| Total (Overall) | 811 (53.7%) | 700 (46.3%) |
Sales and Office Occupations
The most common Sales and Office occupations in Rutherfordton are Sales & Related (201 | 13.3%), and Office & Administration (156 | 10.3%).
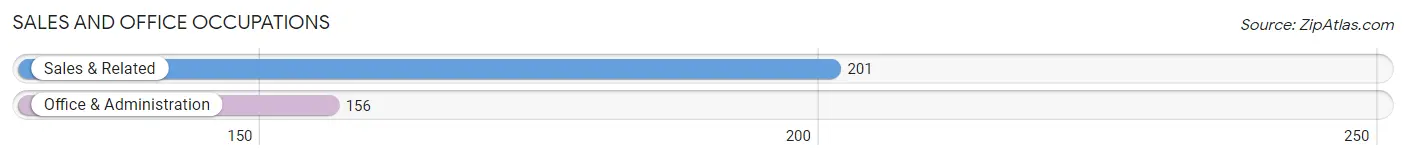
Sales and Office Occupations by Sex
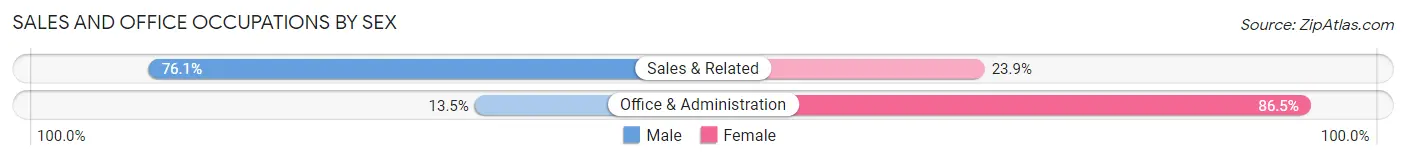
| Occupation | Male | Female |
| Sales & Related | 153 (76.1%) | 48 (23.9%) |
| Office & Administration | 21 (13.5%) | 135 (86.5%) |
| Total (Category) | 174 (48.7%) | 183 (51.3%) |
| Total (Overall) | 811 (53.7%) | 700 (46.3%) |
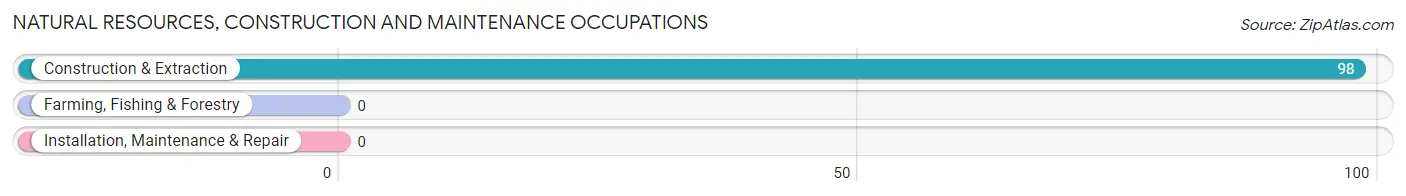
Natural Resources, Construction and Maintenance Occupations
The most common Natural Resources, Construction and Maintenance occupations in Rutherfordton are , and Construction & Extraction (98 | 6.5%).
Natural Resources, Construction and Maintenance Occupations by Sex
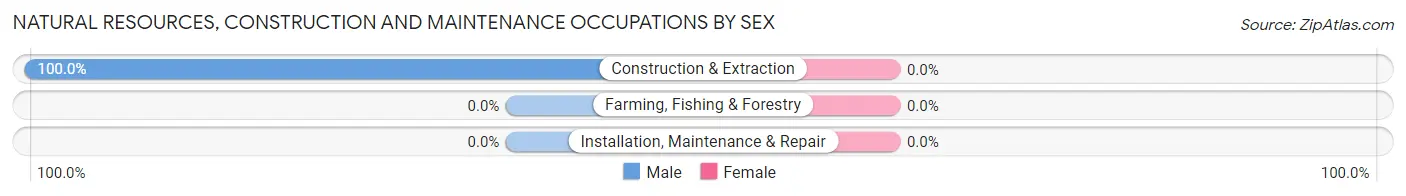
| Occupation | Male | Female |
| Farming, Fishing & Forestry | 0 (0.0%) | 0 (0.0%) |
| Construction & Extraction | 98 (100.0%) | 0 (0.0%) |
| Installation, Maintenance & Repair | 0 (0.0%) | 0 (0.0%) |
| Total (Category) | 98 (100.0%) | 0 (0.0%) |
| Total (Overall) | 811 (53.7%) | 700 (46.3%) |
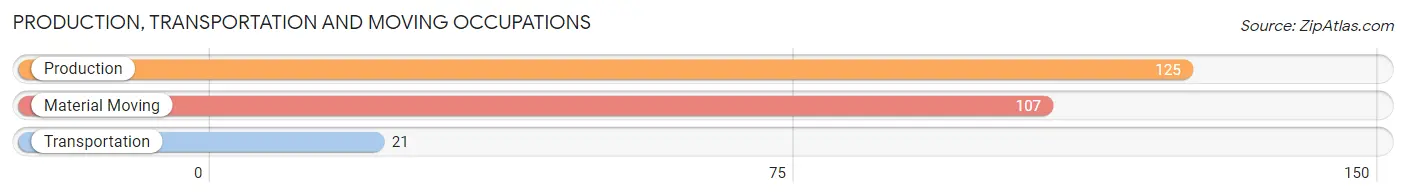
Production, Transportation and Moving Occupations
The most common Production, Transportation and Moving occupations in Rutherfordton are Production (125 | 8.3%), Material Moving (107 | 7.1%), and Transportation (21 | 1.4%).
Production, Transportation and Moving Occupations by Sex
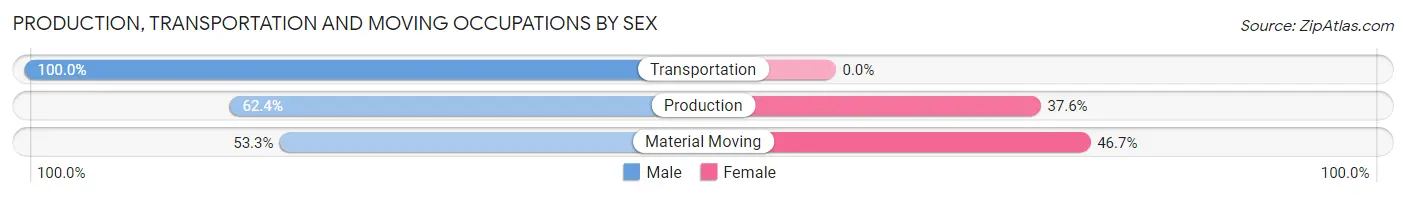
| Occupation | Male | Female |
| Production | 78 (62.4%) | 47 (37.6%) |
| Transportation | 21 (100.0%) | 0 (0.0%) |
| Material Moving | 57 (53.3%) | 50 (46.7%) |
| Total (Category) | 156 (61.7%) | 97 (38.3%) |
| Total (Overall) | 811 (53.7%) | 700 (46.3%) |
Employment Industries by Sex in Rutherfordton
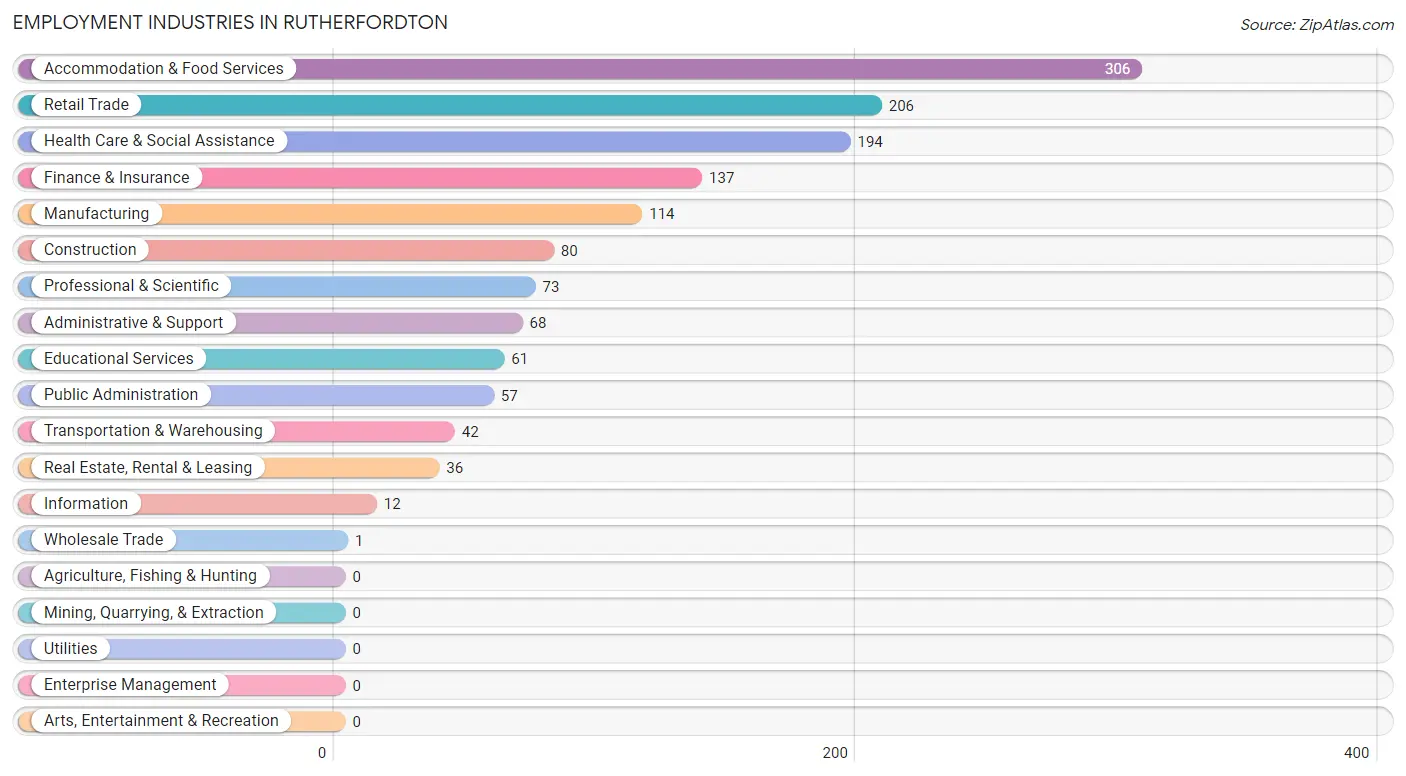
Employment Industries in Rutherfordton
The major employment industries in Rutherfordton include Accommodation & Food Services (306 | 20.3%), Retail Trade (206 | 13.6%), Health Care & Social Assistance (194 | 12.8%), Finance & Insurance (137 | 9.1%), and Manufacturing (114 | 7.5%).
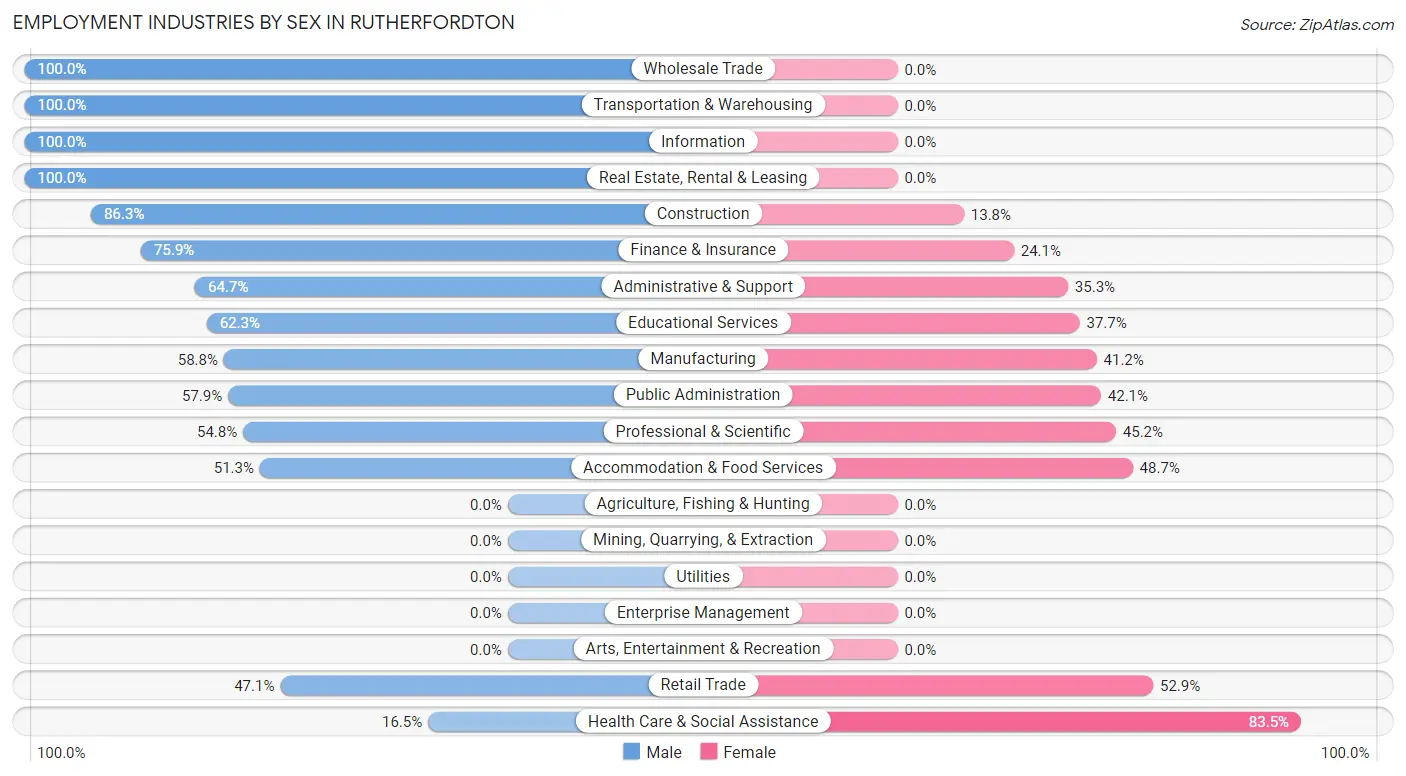
Employment Industries by Sex in Rutherfordton
The Rutherfordton industries that see more men than women are Wholesale Trade (100.0%), Transportation & Warehousing (100.0%), and Information (100.0%), whereas the industries that tend to have a higher number of women are Health Care & Social Assistance (83.5%), Retail Trade (52.9%), and Accommodation & Food Services (48.7%).
| Industry | Male | Female |
| Agriculture, Fishing & Hunting | 0 (0.0%) | 0 (0.0%) |
| Mining, Quarrying, & Extraction | 0 (0.0%) | 0 (0.0%) |
| Construction | 69 (86.3%) | 11 (13.8%) |
| Manufacturing | 67 (58.8%) | 47 (41.2%) |
| Wholesale Trade | 1 (100.0%) | 0 (0.0%) |
| Retail Trade | 97 (47.1%) | 109 (52.9%) |
| Transportation & Warehousing | 42 (100.0%) | 0 (0.0%) |
| Utilities | 0 (0.0%) | 0 (0.0%) |
| Information | 12 (100.0%) | 0 (0.0%) |
| Finance & Insurance | 104 (75.9%) | 33 (24.1%) |
| Real Estate, Rental & Leasing | 36 (100.0%) | 0 (0.0%) |
| Professional & Scientific | 40 (54.8%) | 33 (45.2%) |
| Enterprise Management | 0 (0.0%) | 0 (0.0%) |
| Administrative & Support | 44 (64.7%) | 24 (35.3%) |
| Educational Services | 38 (62.3%) | 23 (37.7%) |
| Health Care & Social Assistance | 32 (16.5%) | 162 (83.5%) |
| Arts, Entertainment & Recreation | 0 (0.0%) | 0 (0.0%) |
| Accommodation & Food Services | 157 (51.3%) | 149 (48.7%) |
| Public Administration | 33 (57.9%) | 24 (42.1%) |
| Total | 811 (53.7%) | 700 (46.3%) |
Education in Rutherfordton
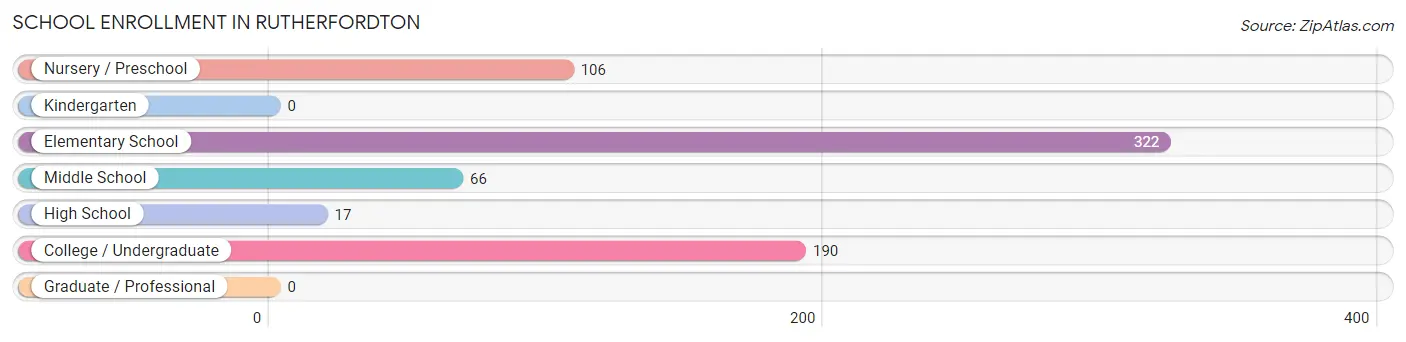
School Enrollment in Rutherfordton
The most common levels of schooling among the 701 students in Rutherfordton are elementary school (322 | 45.9%), college / undergraduate (190 | 27.1%), and nursery / preschool (106 | 15.1%).
| School Level | # Students | % Students |
| Nursery / Preschool | 106 | 15.1% |
| Kindergarten | 0 | 0.0% |
| Elementary School | 322 | 45.9% |
| Middle School | 66 | 9.4% |
| High School | 17 | 2.4% |
| College / Undergraduate | 190 | 27.1% |
| Graduate / Professional | 0 | 0.0% |
| Total | 701 | 100.0% |
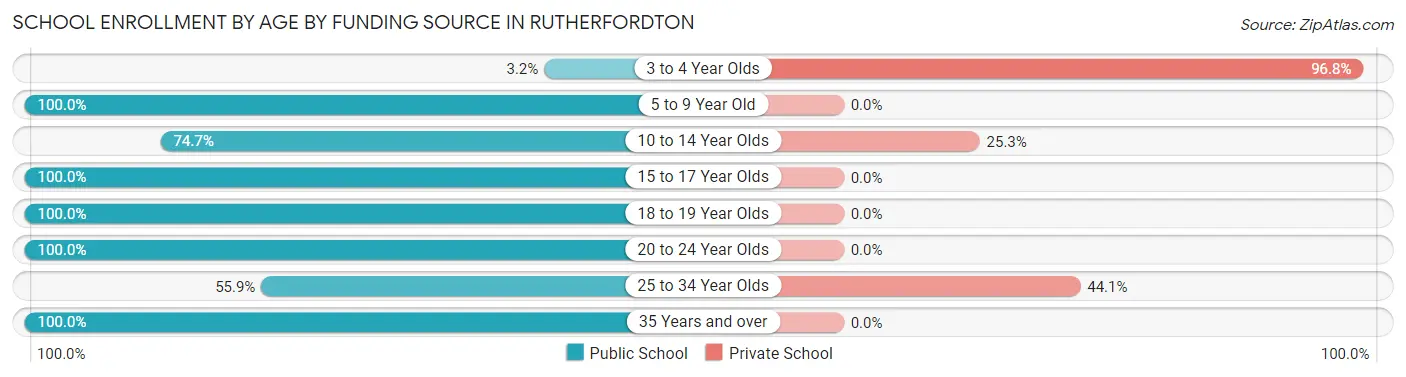
School Enrollment by Age by Funding Source in Rutherfordton
Out of a total of 701 students who are enrolled in schools in Rutherfordton, 76 (10.8%) attend a private institution, while the remaining 625 (89.2%) are enrolled in public schools. The age group of 3 to 4 year olds has the highest likelihood of being enrolled in private schools, with 30 (96.8% in the age bracket) enrolled. Conversely, the age group of 5 to 9 year old has the lowest likelihood of being enrolled in a private school, with 384 (100.0% in the age bracket) attending a public institution.
| Age Bracket | Public School | Private School |
| 3 to 4 Year Olds | 1 (3.2%) | 30 (96.8%) |
| 5 to 9 Year Old | 384 (100.0%) | 0 (0.0%) |
| 10 to 14 Year Olds | 59 (74.7%) | 20 (25.3%) |
| 15 to 17 Year Olds | 17 (100.0%) | 0 (0.0%) |
| 18 to 19 Year Olds | 50 (100.0%) | 0 (0.0%) |
| 20 to 24 Year Olds | 19 (100.0%) | 0 (0.0%) |
| 25 to 34 Year Olds | 33 (55.9%) | 26 (44.1%) |
| 35 Years and over | 62 (100.0%) | 0 (0.0%) |
| Total | 625 (89.2%) | 76 (10.8%) |
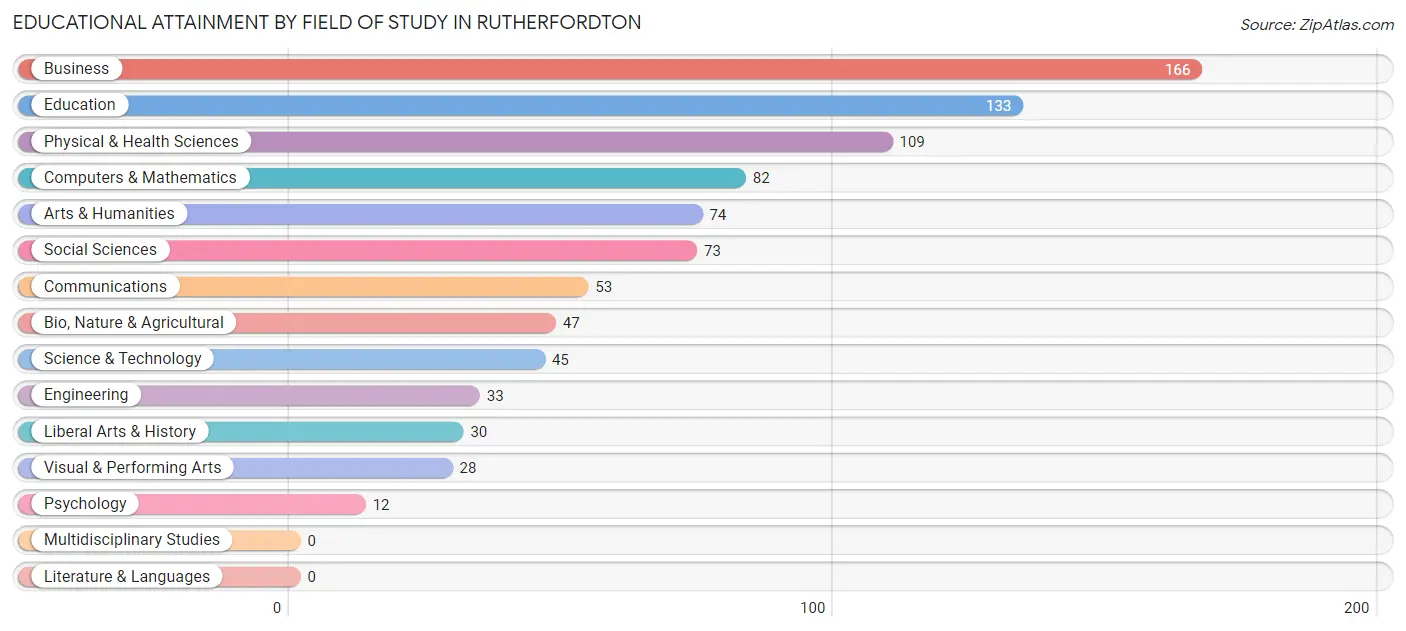
Educational Attainment by Field of Study in Rutherfordton
Business (166 | 18.8%), education (133 | 15.0%), physical & health sciences (109 | 12.3%), computers & mathematics (82 | 9.3%), and arts & humanities (74 | 8.4%) are the most common fields of study among 885 individuals in Rutherfordton who have obtained a bachelor's degree or higher.
| Field of Study | # Graduates | % Graduates |
| Computers & Mathematics | 82 | 9.3% |
| Bio, Nature & Agricultural | 47 | 5.3% |
| Physical & Health Sciences | 109 | 12.3% |
| Psychology | 12 | 1.4% |
| Social Sciences | 73 | 8.3% |
| Engineering | 33 | 3.7% |
| Multidisciplinary Studies | 0 | 0.0% |
| Science & Technology | 45 | 5.1% |
| Business | 166 | 18.8% |
| Education | 133 | 15.0% |
| Literature & Languages | 0 | 0.0% |
| Liberal Arts & History | 30 | 3.4% |
| Visual & Performing Arts | 28 | 3.2% |
| Communications | 53 | 6.0% |
| Arts & Humanities | 74 | 8.4% |
| Total | 885 | 100.0% |
Transportation & Commute in Rutherfordton
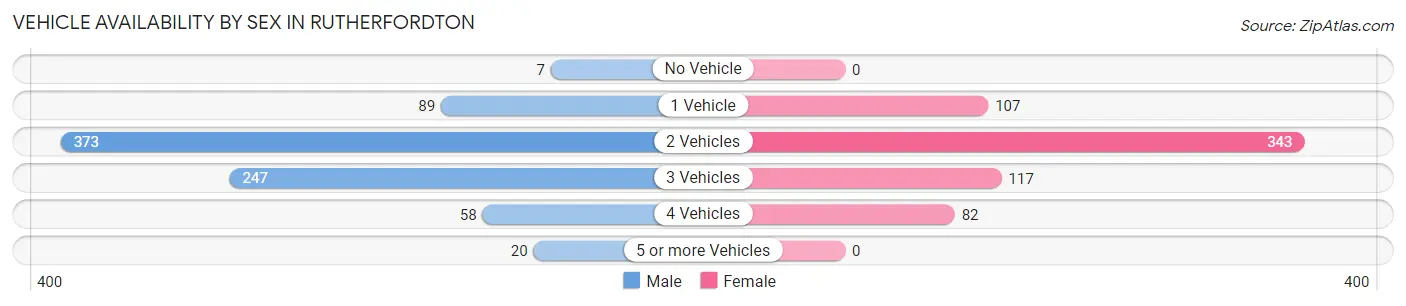
Vehicle Availability by Sex in Rutherfordton
The most prevalent vehicle ownership categories in Rutherfordton are males with 2 vehicles (373, accounting for 47.0%) and females with 2 vehicles (343, making up 57.5%).
| Vehicles Available | Male | Female |
| No Vehicle | 7 (0.9%) | 0 (0.0%) |
| 1 Vehicle | 89 (11.2%) | 107 (16.5%) |
| 2 Vehicles | 373 (47.0%) | 343 (52.8%) |
| 3 Vehicles | 247 (31.1%) | 117 (18.0%) |
| 4 Vehicles | 58 (7.3%) | 82 (12.6%) |
| 5 or more Vehicles | 20 (2.5%) | 0 (0.0%) |
| Total | 794 (100.0%) | 649 (100.0%) |
Commute Time in Rutherfordton
The most frequently occuring commute durations in Rutherfordton are 10 to 14 minutes (407 commuters, 29.2%), 15 to 19 minutes (245 commuters, 17.6%), and 5 to 9 minutes (183 commuters, 13.1%).
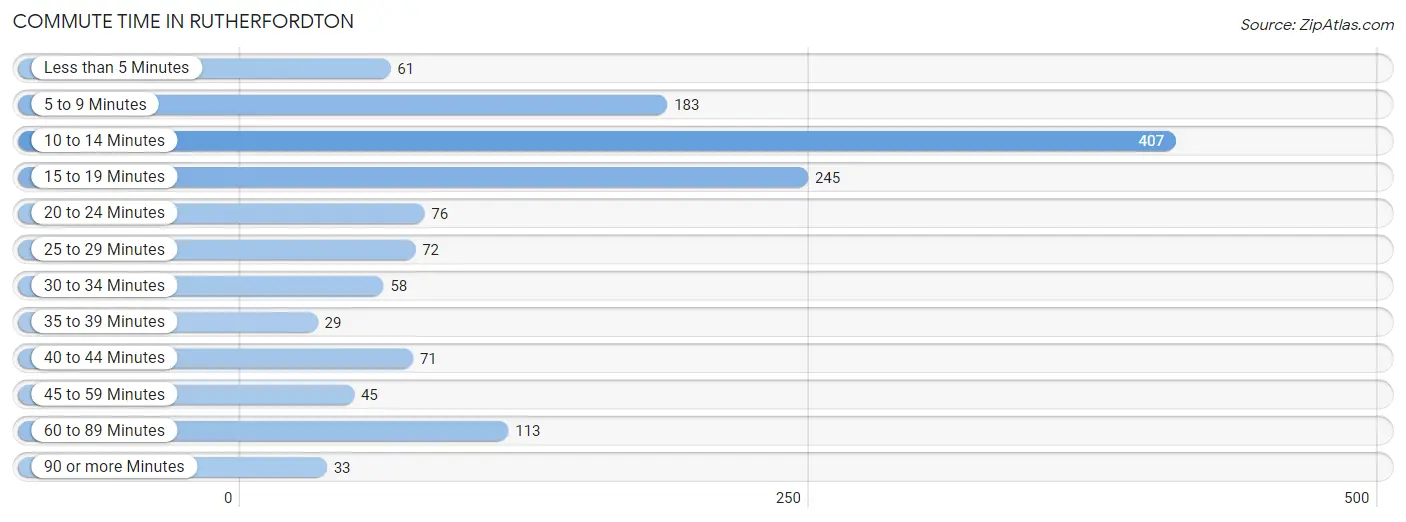
| Commute Time | # Commuters | % Commuters |
| Less than 5 Minutes | 61 | 4.4% |
| 5 to 9 Minutes | 183 | 13.1% |
| 10 to 14 Minutes | 407 | 29.2% |
| 15 to 19 Minutes | 245 | 17.6% |
| 20 to 24 Minutes | 76 | 5.5% |
| 25 to 29 Minutes | 72 | 5.2% |
| 30 to 34 Minutes | 58 | 4.2% |
| 35 to 39 Minutes | 29 | 2.1% |
| 40 to 44 Minutes | 71 | 5.1% |
| 45 to 59 Minutes | 45 | 3.2% |
| 60 to 89 Minutes | 113 | 8.1% |
| 90 or more Minutes | 33 | 2.4% |
Commute Time by Sex in Rutherfordton
The most common commute times in Rutherfordton are 10 to 14 minutes (199 commuters, 25.7%) for males and 10 to 14 minutes (208 commuters, 33.7%) for females.
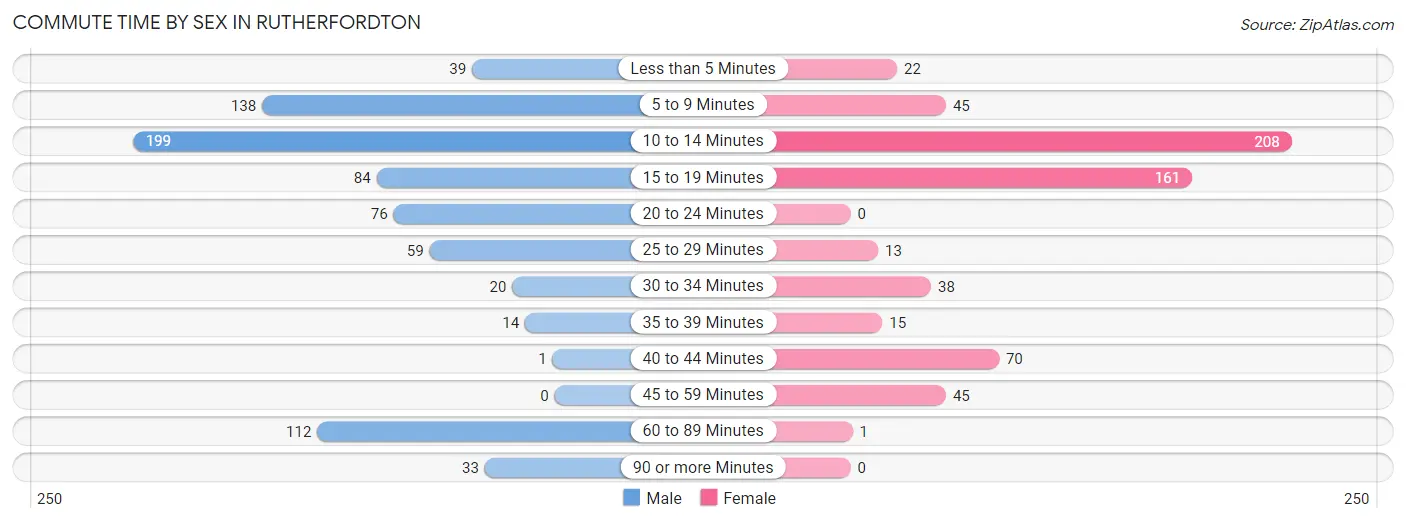
| Commute Time | Male | Female |
| Less than 5 Minutes | 39 (5.0%) | 22 (3.6%) |
| 5 to 9 Minutes | 138 (17.8%) | 45 (7.3%) |
| 10 to 14 Minutes | 199 (25.7%) | 208 (33.7%) |
| 15 to 19 Minutes | 84 (10.8%) | 161 (26.1%) |
| 20 to 24 Minutes | 76 (9.8%) | 0 (0.0%) |
| 25 to 29 Minutes | 59 (7.6%) | 13 (2.1%) |
| 30 to 34 Minutes | 20 (2.6%) | 38 (6.1%) |
| 35 to 39 Minutes | 14 (1.8%) | 15 (2.4%) |
| 40 to 44 Minutes | 1 (0.1%) | 70 (11.3%) |
| 45 to 59 Minutes | 0 (0.0%) | 45 (7.3%) |
| 60 to 89 Minutes | 112 (14.4%) | 1 (0.2%) |
| 90 or more Minutes | 33 (4.3%) | 0 (0.0%) |
Time of Departure to Work by Sex in Rutherfordton
The most frequent times of departure to work in Rutherfordton are 9:00 AM to 9:59 AM (172, 22.2%) for males and 8:30 AM to 8:59 AM (168, 27.2%) for females.
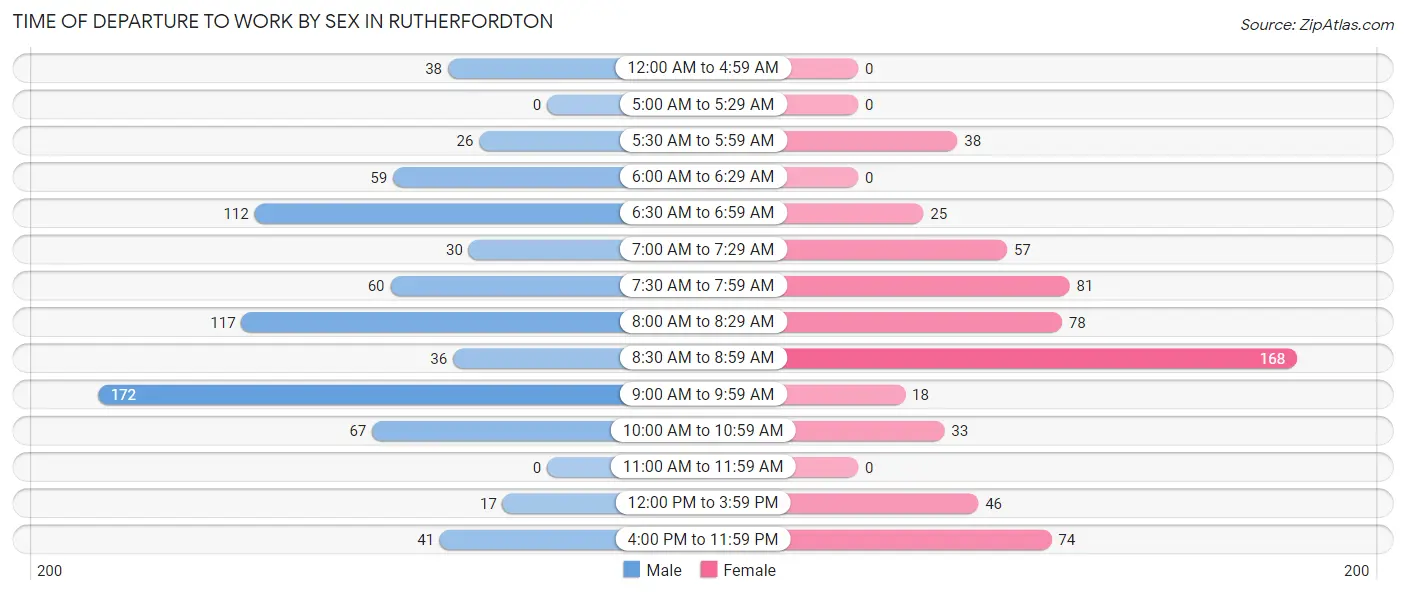
| Time of Departure | Male | Female |
| 12:00 AM to 4:59 AM | 38 (4.9%) | 0 (0.0%) |
| 5:00 AM to 5:29 AM | 0 (0.0%) | 0 (0.0%) |
| 5:30 AM to 5:59 AM | 26 (3.4%) | 38 (6.1%) |
| 6:00 AM to 6:29 AM | 59 (7.6%) | 0 (0.0%) |
| 6:30 AM to 6:59 AM | 112 (14.4%) | 25 (4.1%) |
| 7:00 AM to 7:29 AM | 30 (3.9%) | 57 (9.2%) |
| 7:30 AM to 7:59 AM | 60 (7.7%) | 81 (13.1%) |
| 8:00 AM to 8:29 AM | 117 (15.1%) | 78 (12.6%) |
| 8:30 AM to 8:59 AM | 36 (4.6%) | 168 (27.2%) |
| 9:00 AM to 9:59 AM | 172 (22.2%) | 18 (2.9%) |
| 10:00 AM to 10:59 AM | 67 (8.6%) | 33 (5.3%) |
| 11:00 AM to 11:59 AM | 0 (0.0%) | 0 (0.0%) |
| 12:00 PM to 3:59 PM | 17 (2.2%) | 46 (7.4%) |
| 4:00 PM to 11:59 PM | 41 (5.3%) | 74 (12.0%) |
| Total | 775 (100.0%) | 618 (100.0%) |
Housing Occupancy in Rutherfordton
Occupancy by Ownership in Rutherfordton
Of the total 1,436 dwellings in Rutherfordton, owner-occupied units account for 980 (68.2%), while renter-occupied units make up 456 (31.8%).
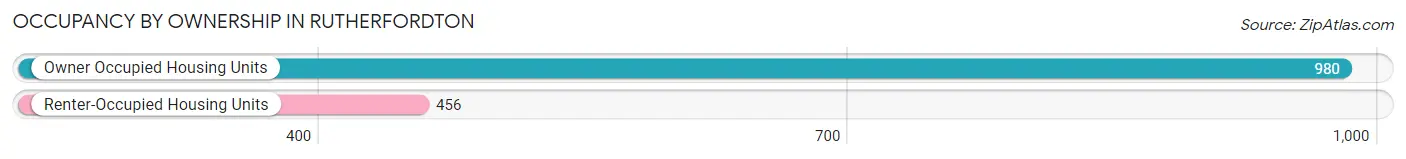
| Occupancy | # Housing Units | % Housing Units |
| Owner Occupied Housing Units | 980 | 68.2% |
| Renter-Occupied Housing Units | 456 | 31.8% |
| Total Occupied Housing Units | 1,436 | 100.0% |
Occupancy by Household Size in Rutherfordton
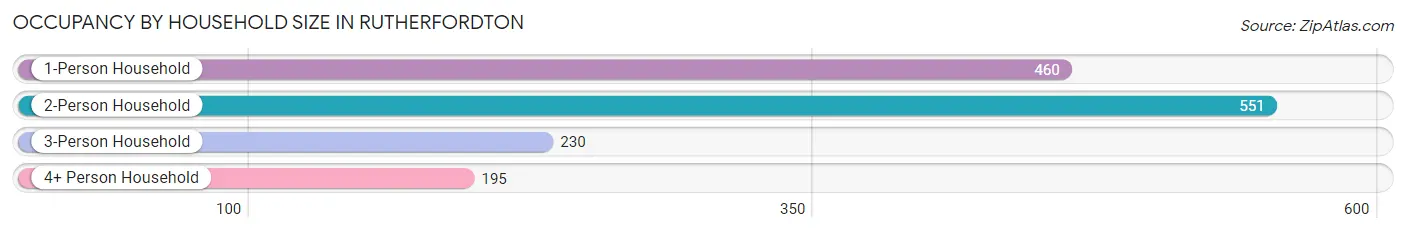
| Household Size | # Housing Units | % Housing Units |
| 1-Person Household | 460 | 32.0% |
| 2-Person Household | 551 | 38.4% |
| 3-Person Household | 230 | 16.0% |
| 4+ Person Household | 195 | 13.6% |
| Total Housing Units | 1,436 | 100.0% |
Occupancy by Ownership by Household Size in Rutherfordton
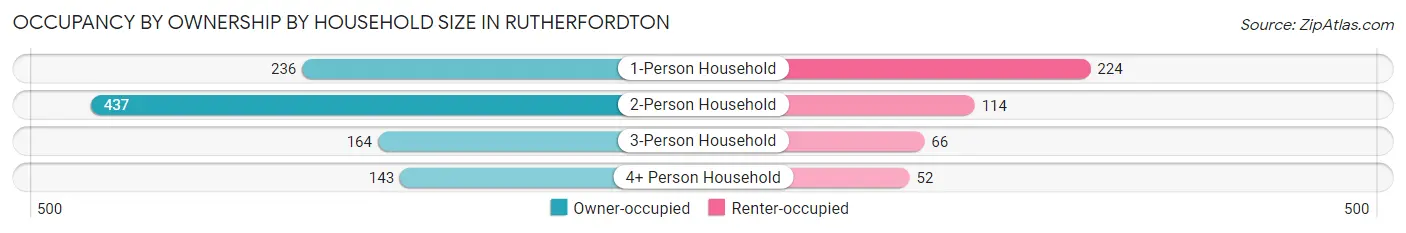
| Household Size | Owner-occupied | Renter-occupied |
| 1-Person Household | 236 (51.3%) | 224 (48.7%) |
| 2-Person Household | 437 (79.3%) | 114 (20.7%) |
| 3-Person Household | 164 (71.3%) | 66 (28.7%) |
| 4+ Person Household | 143 (73.3%) | 52 (26.7%) |
| Total Housing Units | 980 (68.2%) | 456 (31.8%) |
Occupancy by Educational Attainment in Rutherfordton
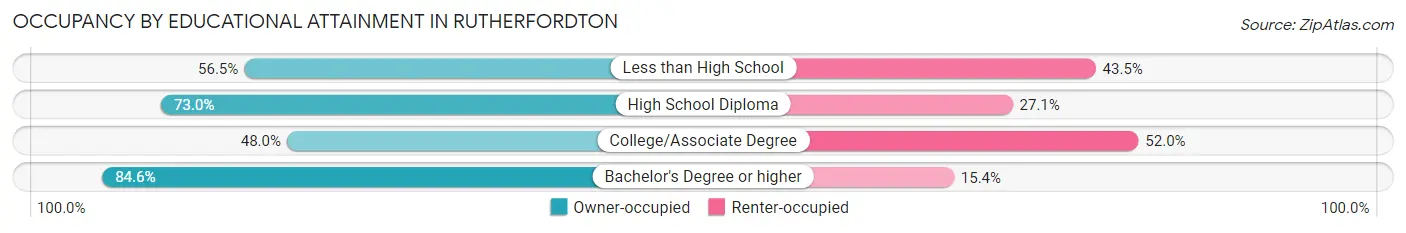
| Household Size | Owner-occupied | Renter-occupied |
| Less than High School | 61 (56.5%) | 47 (43.5%) |
| High School Diploma | 302 (73.0%) | 112 (27.1%) |
| College/Associate Degree | 205 (48.0%) | 222 (52.0%) |
| Bachelor's Degree or higher | 412 (84.6%) | 75 (15.4%) |
Occupancy by Age of Householder in Rutherfordton
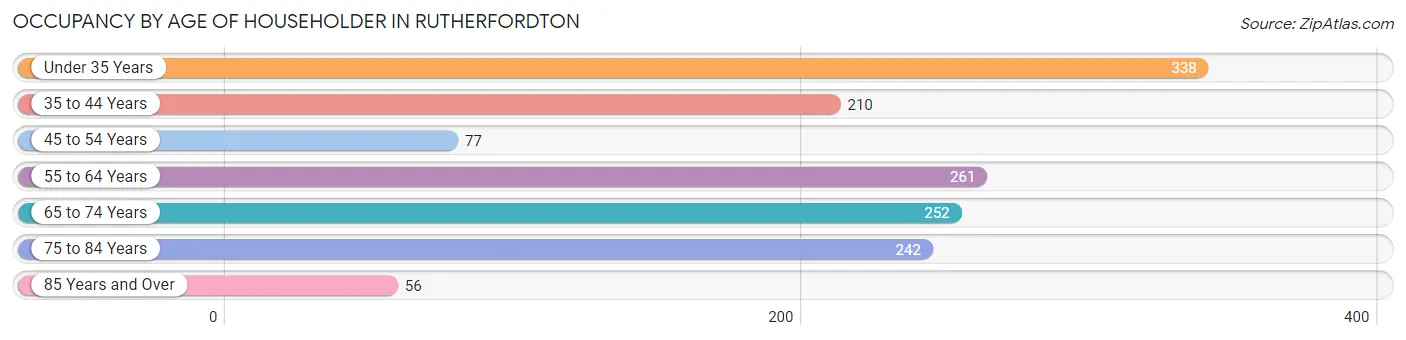
| Age Bracket | # Households | % Households |
| Under 35 Years | 338 | 23.5% |
| 35 to 44 Years | 210 | 14.6% |
| 45 to 54 Years | 77 | 5.4% |
| 55 to 64 Years | 261 | 18.2% |
| 65 to 74 Years | 252 | 17.5% |
| 75 to 84 Years | 242 | 16.9% |
| 85 Years and Over | 56 | 3.9% |
| Total | 1,436 | 100.0% |
Housing Finances in Rutherfordton
Median Income by Occupancy in Rutherfordton
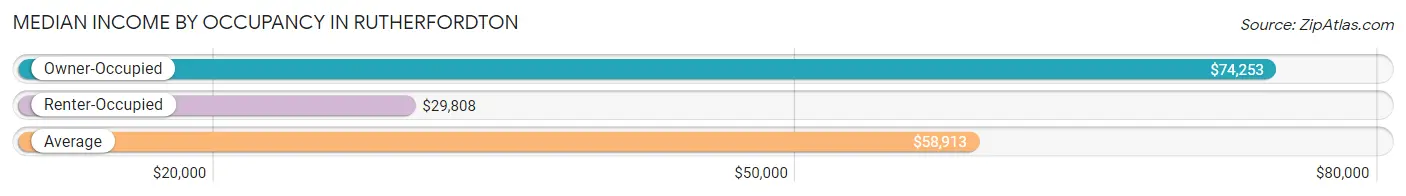
| Occupancy Type | # Households | Median Income |
| Owner-Occupied | 980 (68.2%) | $74,253 |
| Renter-Occupied | 456 (31.8%) | $29,808 |
| Average | 1,436 (100.0%) | $58,913 |
Occupancy by Householder Income Bracket in Rutherfordton
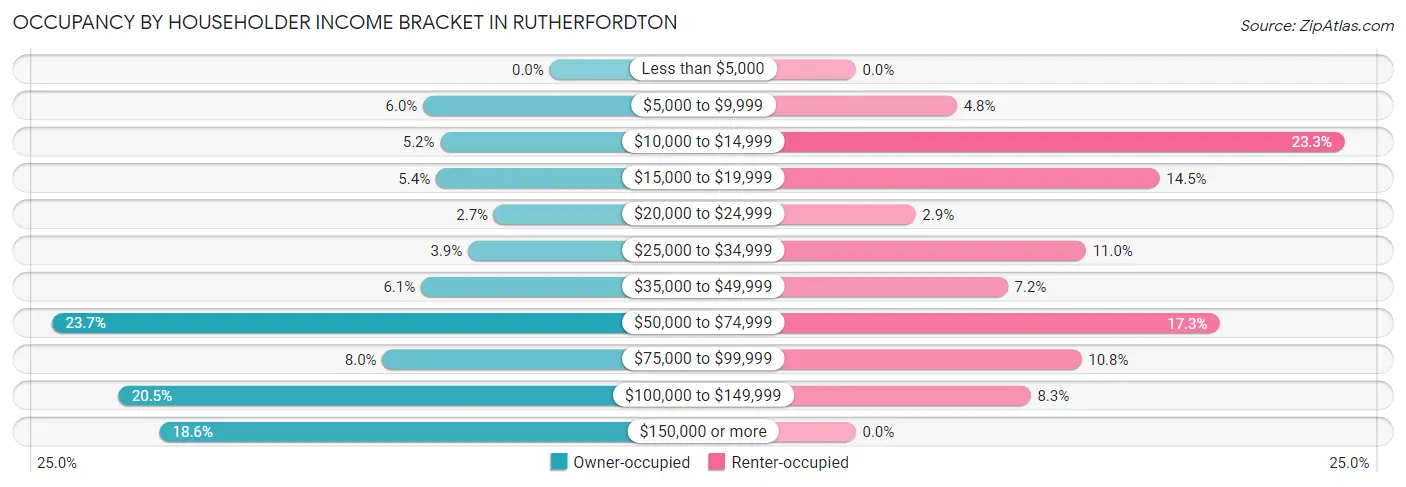
| Income Bracket | Owner-occupied | Renter-occupied |
| Less than $5,000 | 0 (0.0%) | 0 (0.0%) |
| $5,000 to $9,999 | 59 (6.0%) | 22 (4.8%) |
| $10,000 to $14,999 | 51 (5.2%) | 106 (23.3%) |
| $15,000 to $19,999 | 53 (5.4%) | 66 (14.5%) |
| $20,000 to $24,999 | 26 (2.6%) | 13 (2.9%) |
| $25,000 to $34,999 | 38 (3.9%) | 50 (11.0%) |
| $35,000 to $49,999 | 60 (6.1%) | 33 (7.2%) |
| $50,000 to $74,999 | 232 (23.7%) | 79 (17.3%) |
| $75,000 to $99,999 | 78 (8.0%) | 49 (10.7%) |
| $100,000 to $149,999 | 201 (20.5%) | 38 (8.3%) |
| $150,000 or more | 182 (18.6%) | 0 (0.0%) |
| Total | 980 (100.0%) | 456 (100.0%) |
Monthly Housing Cost Tiers in Rutherfordton
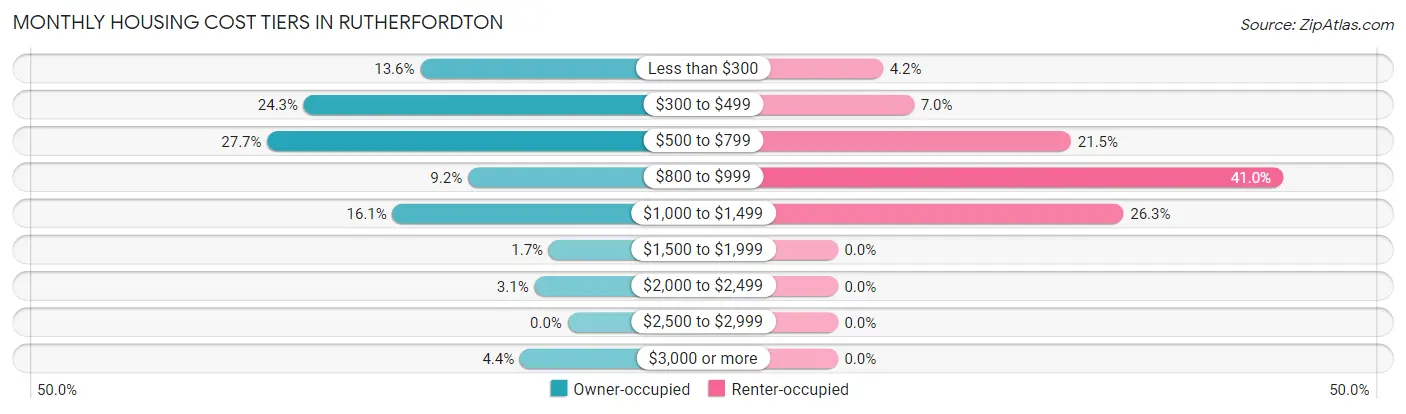
| Monthly Cost | Owner-occupied | Renter-occupied |
| Less than $300 | 133 (13.6%) | 19 (4.2%) |
| $300 to $499 | 238 (24.3%) | 32 (7.0%) |
| $500 to $799 | 271 (27.7%) | 98 (21.5%) |
| $800 to $999 | 90 (9.2%) | 187 (41.0%) |
| $1,000 to $1,499 | 158 (16.1%) | 120 (26.3%) |
| $1,500 to $1,999 | 17 (1.7%) | 0 (0.0%) |
| $2,000 to $2,499 | 30 (3.1%) | 0 (0.0%) |
| $2,500 to $2,999 | 0 (0.0%) | 0 (0.0%) |
| $3,000 or more | 43 (4.4%) | 0 (0.0%) |
| Total | 980 (100.0%) | 456 (100.0%) |
Physical Housing Characteristics in Rutherfordton
Housing Structures in Rutherfordton
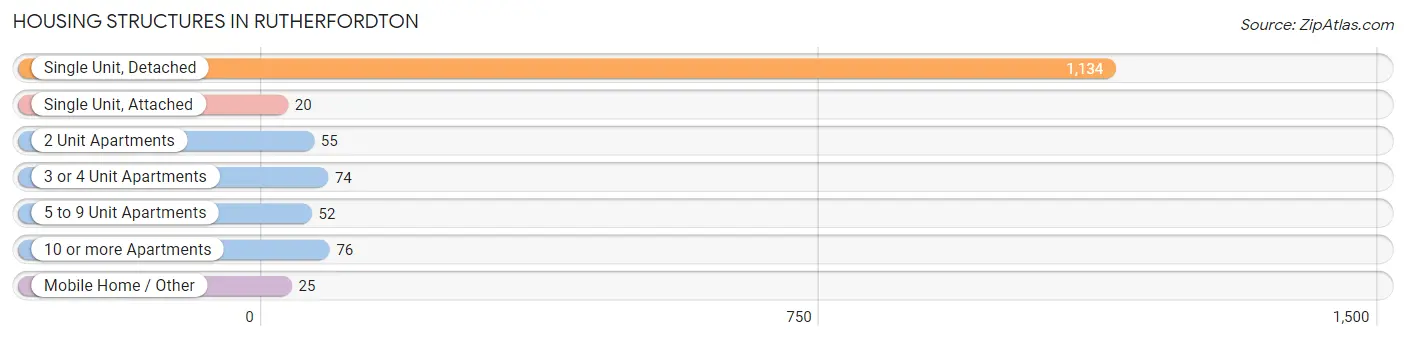
| Structure Type | # Housing Units | % Housing Units |
| Single Unit, Detached | 1,134 | 79.0% |
| Single Unit, Attached | 20 | 1.4% |
| 2 Unit Apartments | 55 | 3.8% |
| 3 or 4 Unit Apartments | 74 | 5.1% |
| 5 to 9 Unit Apartments | 52 | 3.6% |
| 10 or more Apartments | 76 | 5.3% |
| Mobile Home / Other | 25 | 1.7% |
| Total | 1,436 | 100.0% |
Housing Structures by Occupancy in Rutherfordton
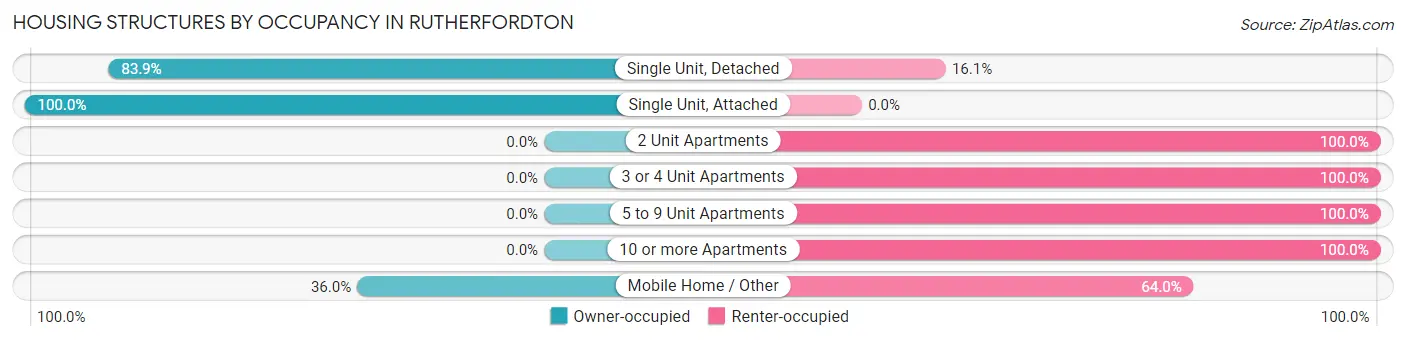
| Structure Type | Owner-occupied | Renter-occupied |
| Single Unit, Detached | 951 (83.9%) | 183 (16.1%) |
| Single Unit, Attached | 20 (100.0%) | 0 (0.0%) |
| 2 Unit Apartments | 0 (0.0%) | 55 (100.0%) |
| 3 or 4 Unit Apartments | 0 (0.0%) | 74 (100.0%) |
| 5 to 9 Unit Apartments | 0 (0.0%) | 52 (100.0%) |
| 10 or more Apartments | 0 (0.0%) | 76 (100.0%) |
| Mobile Home / Other | 9 (36.0%) | 16 (64.0%) |
| Total | 980 (68.2%) | 456 (31.8%) |
Housing Structures by Number of Rooms in Rutherfordton
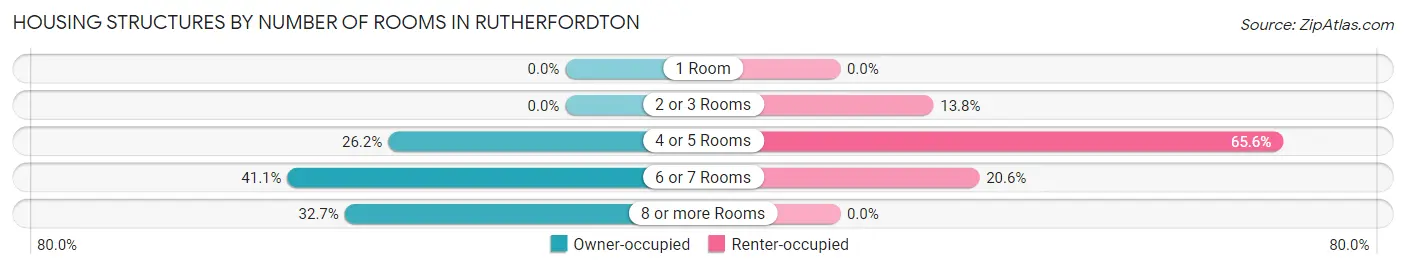
| Number of Rooms | Owner-occupied | Renter-occupied |
| 1 Room | 0 (0.0%) | 0 (0.0%) |
| 2 or 3 Rooms | 0 (0.0%) | 63 (13.8%) |
| 4 or 5 Rooms | 257 (26.2%) | 299 (65.6%) |
| 6 or 7 Rooms | 403 (41.1%) | 94 (20.6%) |
| 8 or more Rooms | 320 (32.7%) | 0 (0.0%) |
| Total | 980 (100.0%) | 456 (100.0%) |
Housing Structure by Heating Type in Rutherfordton
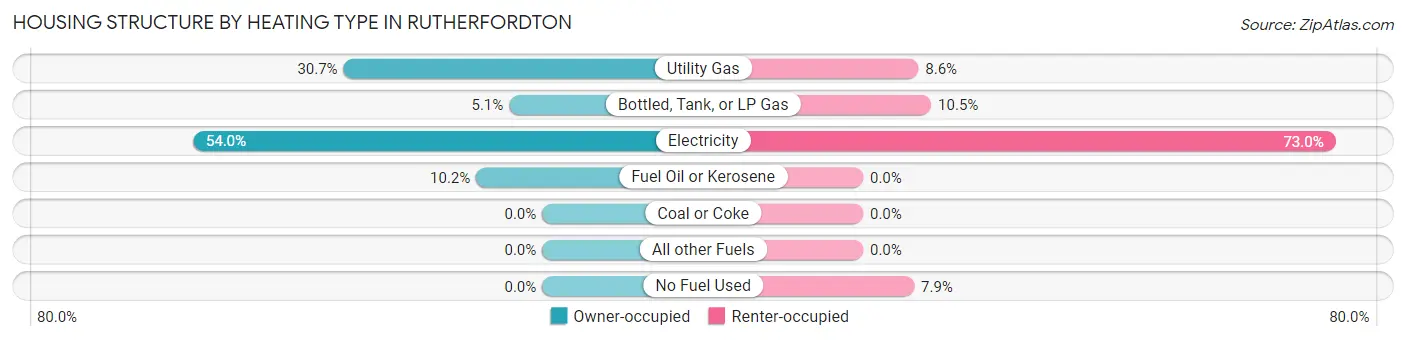
| Heating Type | Owner-occupied | Renter-occupied |
| Utility Gas | 301 (30.7%) | 39 (8.6%) |
| Bottled, Tank, or LP Gas | 50 (5.1%) | 48 (10.5%) |
| Electricity | 529 (54.0%) | 333 (73.0%) |
| Fuel Oil or Kerosene | 100 (10.2%) | 0 (0.0%) |
| Coal or Coke | 0 (0.0%) | 0 (0.0%) |
| All other Fuels | 0 (0.0%) | 0 (0.0%) |
| No Fuel Used | 0 (0.0%) | 36 (7.9%) |
| Total | 980 (100.0%) | 456 (100.0%) |
Household Vehicle Usage in Rutherfordton
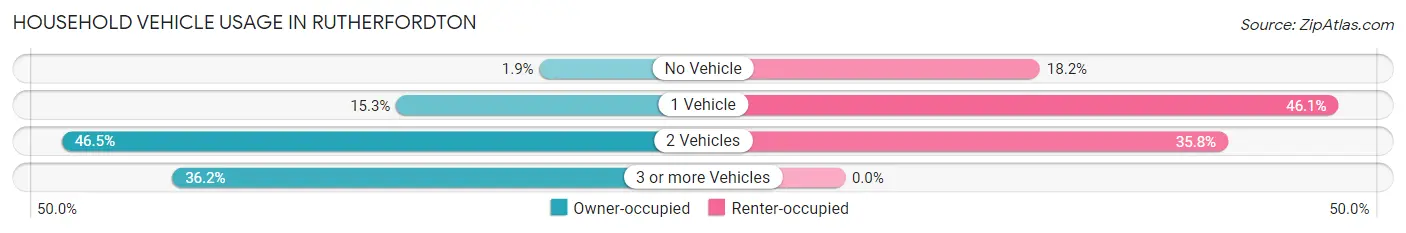
| Vehicles per Household | Owner-occupied | Renter-occupied |
| No Vehicle | 19 (1.9%) | 83 (18.2%) |
| 1 Vehicle | 150 (15.3%) | 210 (46.1%) |
| 2 Vehicles | 456 (46.5%) | 163 (35.7%) |
| 3 or more Vehicles | 355 (36.2%) | 0 (0.0%) |
| Total | 980 (100.0%) | 456 (100.0%) |
Real Estate & Mortgages in Rutherfordton
Real Estate and Mortgage Overview in Rutherfordton
| Characteristic | Without Mortgage | With Mortgage |
| Housing Units | 562 | 418 |
| Median Property Value | $188,400 | $214,800 |
| Median Household Income | $60,750 | $98 |
| Monthly Housing Costs | $459 | $43 |
| Real Estate Taxes | $2,263 | $0 |
Property Value by Mortgage Status in Rutherfordton
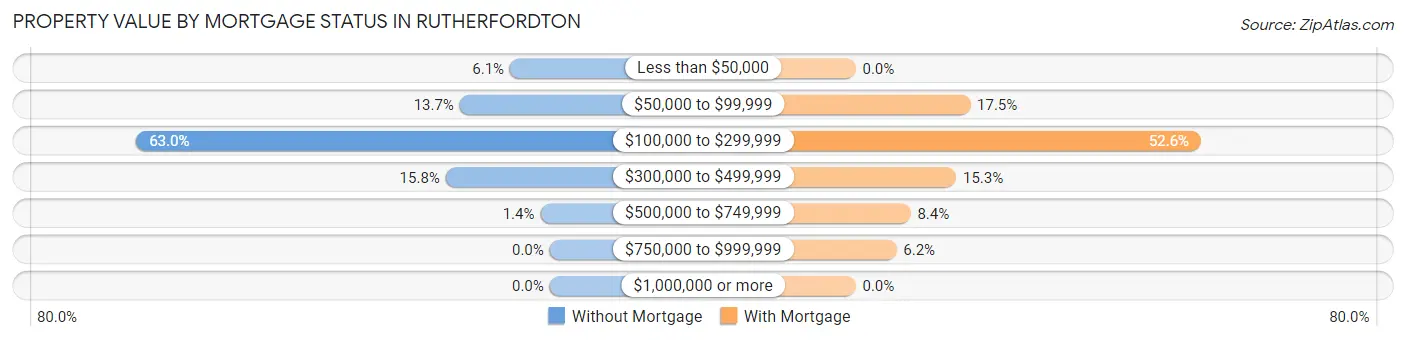
| Property Value | Without Mortgage | With Mortgage |
| Less than $50,000 | 34 (6.0%) | 0 (0.0%) |
| $50,000 to $99,999 | 77 (13.7%) | 73 (17.5%) |
| $100,000 to $299,999 | 354 (63.0%) | 220 (52.6%) |
| $300,000 to $499,999 | 89 (15.8%) | 64 (15.3%) |
| $500,000 to $749,999 | 8 (1.4%) | 35 (8.4%) |
| $750,000 to $999,999 | 0 (0.0%) | 26 (6.2%) |
| $1,000,000 or more | 0 (0.0%) | 0 (0.0%) |
| Total | 562 (100.0%) | 418 (100.0%) |
Household Income by Mortgage Status in Rutherfordton
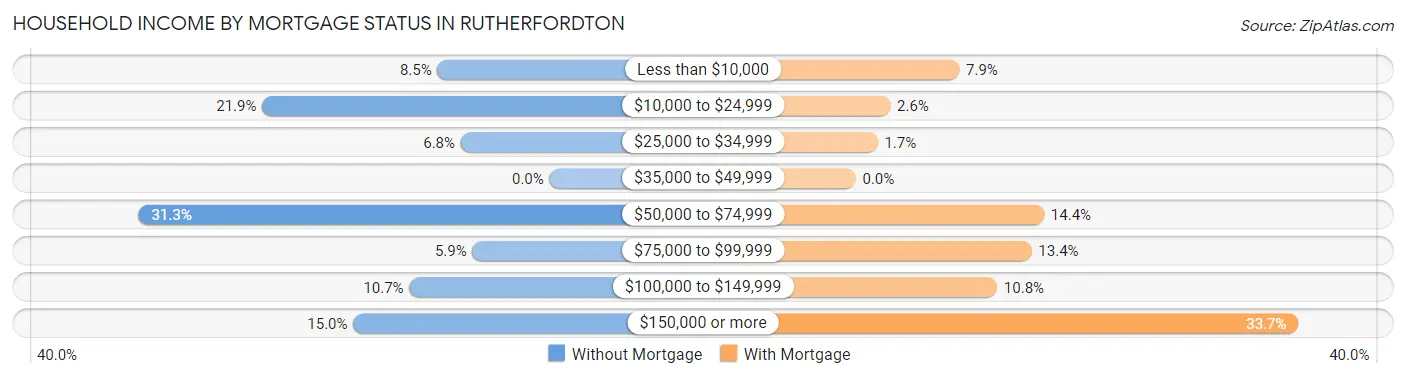
| Household Income | Without Mortgage | With Mortgage |
| Less than $10,000 | 48 (8.5%) | 33 (7.9%) |
| $10,000 to $24,999 | 123 (21.9%) | 11 (2.6%) |
| $25,000 to $34,999 | 38 (6.8%) | 7 (1.7%) |
| $35,000 to $49,999 | 0 (0.0%) | 0 (0.0%) |
| $50,000 to $74,999 | 176 (31.3%) | 60 (14.3%) |
| $75,000 to $99,999 | 33 (5.9%) | 56 (13.4%) |
| $100,000 to $149,999 | 60 (10.7%) | 45 (10.8%) |
| $150,000 or more | 84 (14.9%) | 141 (33.7%) |
| Total | 562 (100.0%) | 418 (100.0%) |
Property Value to Household Income Ratio in Rutherfordton
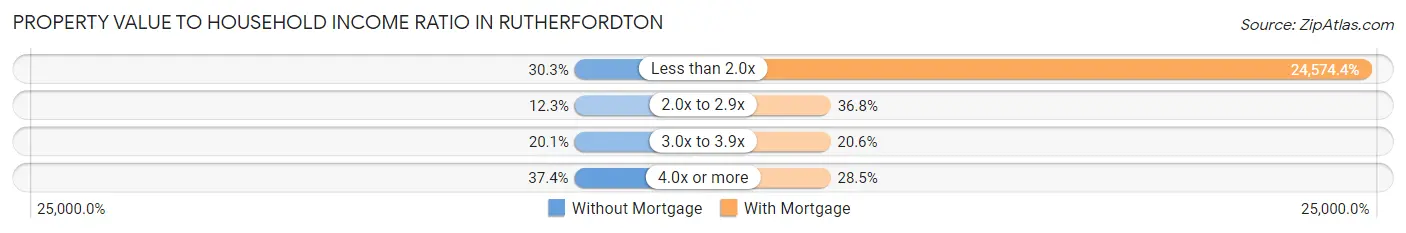
| Value-to-Income Ratio | Without Mortgage | With Mortgage |
| Less than 2.0x | 170 (30.2%) | 102,721 (24,574.4%) |
| 2.0x to 2.9x | 69 (12.3%) | 154 (36.8%) |
| 3.0x to 3.9x | 113 (20.1%) | 86 (20.6%) |
| 4.0x or more | 210 (37.4%) | 119 (28.5%) |
| Total | 562 (100.0%) | 418 (100.0%) |
Real Estate Taxes by Mortgage Status in Rutherfordton
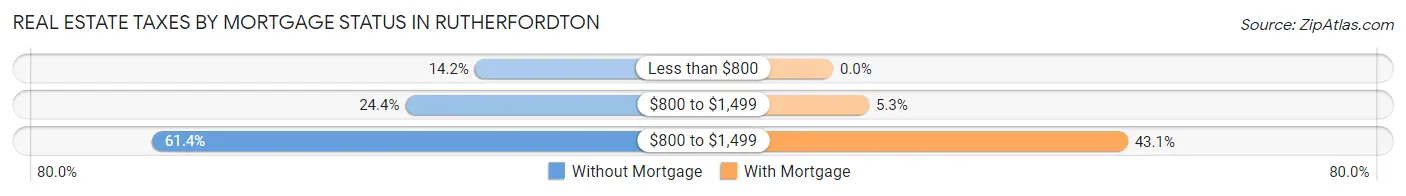
| Property Taxes | Without Mortgage | With Mortgage |
| Less than $800 | 80 (14.2%) | 0 (0.0%) |
| $800 to $1,499 | 137 (24.4%) | 22 (5.3%) |
| $800 to $1,499 | 345 (61.4%) | 180 (43.1%) |
| Total | 562 (100.0%) | 418 (100.0%) |
Health & Disability in Rutherfordton
Health Insurance Coverage by Age in Rutherfordton
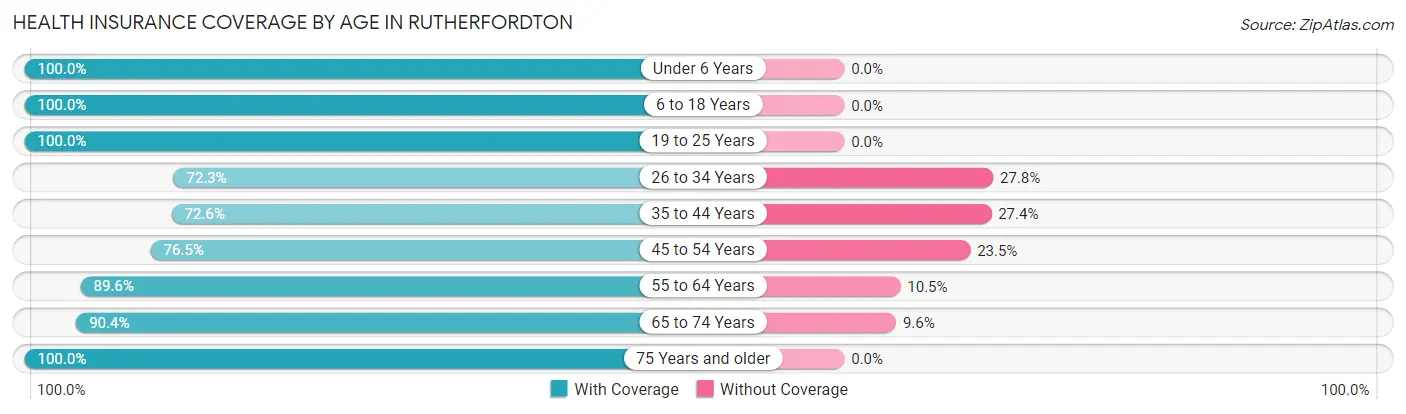
| Age Bracket | With Coverage | Without Coverage |
| Under 6 Years | 339 (100.0%) | 0 (0.0%) |
| 6 to 18 Years | 554 (100.0%) | 0 (0.0%) |
| 19 to 25 Years | 114 (100.0%) | 0 (0.0%) |
| 26 to 34 Years | 341 (72.3%) | 131 (27.8%) |
| 35 to 44 Years | 302 (72.6%) | 114 (27.4%) |
| 45 to 54 Years | 88 (76.5%) | 27 (23.5%) |
| 55 to 64 Years | 480 (89.5%) | 56 (10.4%) |
| 65 to 74 Years | 422 (90.4%) | 45 (9.6%) |
| 75 Years and older | 426 (100.0%) | 0 (0.0%) |
| Total | 3,066 (89.1%) | 373 (10.8%) |
Health Insurance Coverage by Citizenship Status in Rutherfordton
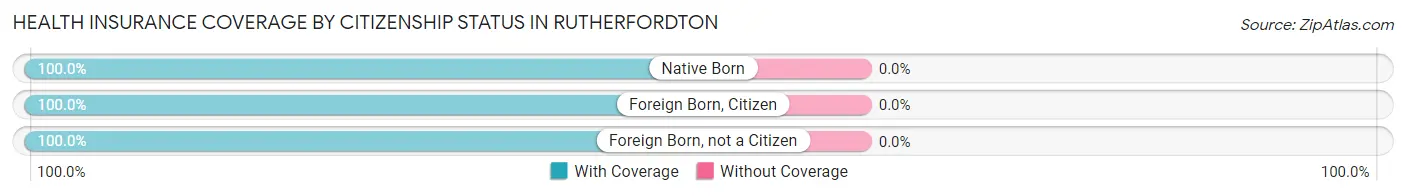
| Citizenship Status | With Coverage | Without Coverage |
| Native Born | 339 (100.0%) | 0 (0.0%) |
| Foreign Born, Citizen | 554 (100.0%) | 0 (0.0%) |
| Foreign Born, not a Citizen | 114 (100.0%) | 0 (0.0%) |
Health Insurance Coverage by Household Income in Rutherfordton
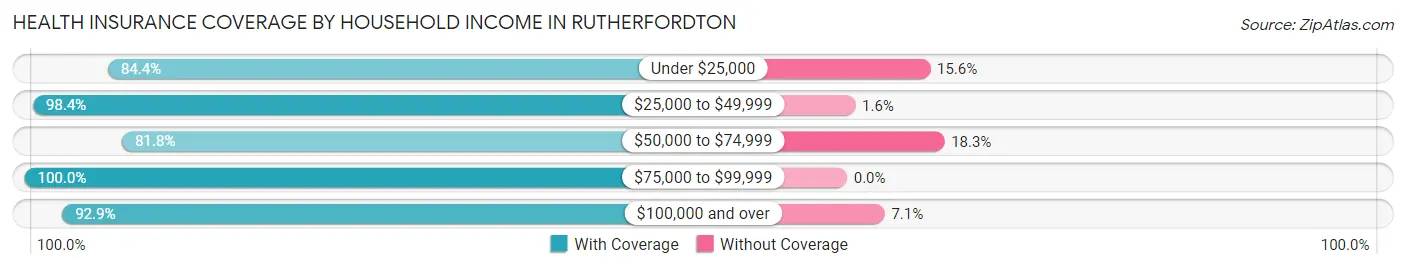
| Household Income | With Coverage | Without Coverage |
| Under $25,000 | 536 (84.4%) | 99 (15.6%) |
| $25,000 to $49,999 | 315 (98.4%) | 5 (1.6%) |
| $50,000 to $74,999 | 730 (81.8%) | 163 (18.2%) |
| $75,000 to $99,999 | 395 (100.0%) | 0 (0.0%) |
| $100,000 and over | 1,080 (92.9%) | 82 (7.1%) |
Public vs Private Health Insurance Coverage by Age in Rutherfordton
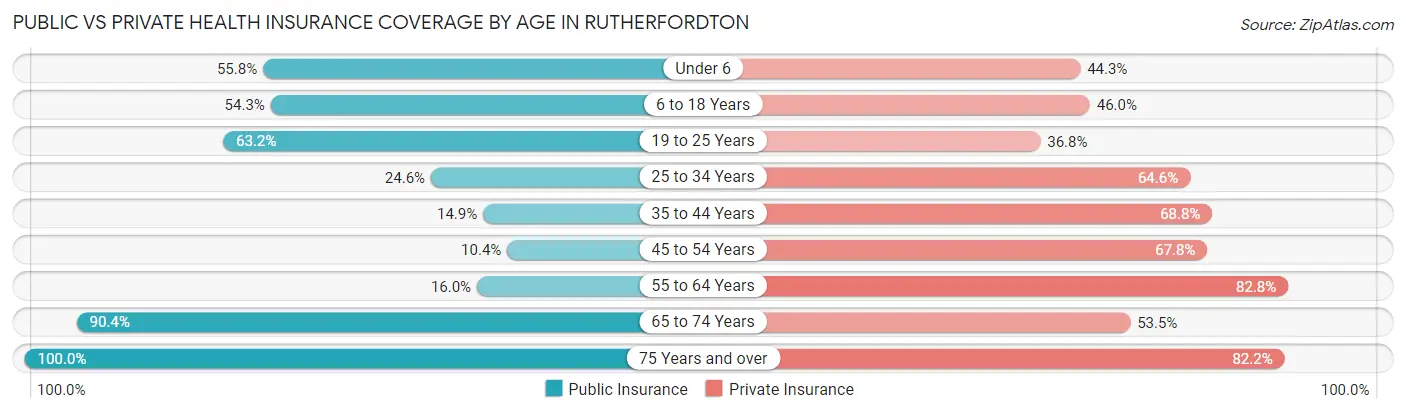
| Age Bracket | Public Insurance | Private Insurance |
| Under 6 | 189 (55.7%) | 150 (44.3%) |
| 6 to 18 Years | 301 (54.3%) | 255 (46.0%) |
| 19 to 25 Years | 72 (63.2%) | 42 (36.8%) |
| 25 to 34 Years | 116 (24.6%) | 305 (64.6%) |
| 35 to 44 Years | 62 (14.9%) | 286 (68.8%) |
| 45 to 54 Years | 12 (10.4%) | 78 (67.8%) |
| 55 to 64 Years | 86 (16.0%) | 444 (82.8%) |
| 65 to 74 Years | 422 (90.4%) | 250 (53.5%) |
| 75 Years and over | 426 (100.0%) | 350 (82.2%) |
| Total | 1,686 (49.0%) | 2,160 (62.8%) |
Disability Status by Sex by Age in Rutherfordton
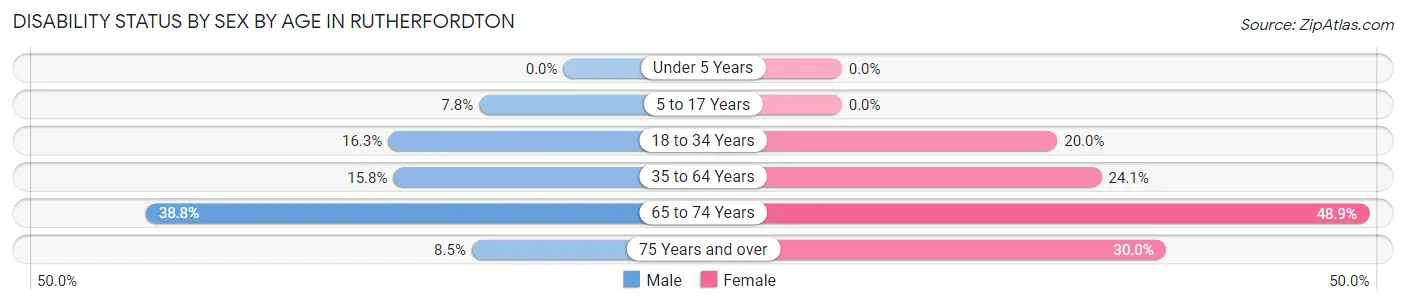
| Age Bracket | Male | Female |
| Under 5 Years | 0 (0.0%) | 0 (0.0%) |
| 5 to 17 Years | 17 (7.8%) | 0 (0.0%) |
| 18 to 34 Years | 41 (16.3%) | 90 (20.0%) |
| 35 to 64 Years | 80 (15.8%) | 135 (24.1%) |
| 65 to 74 Years | 93 (38.8%) | 111 (48.9%) |
| 75 Years and over | 13 (8.5%) | 82 (30.0%) |
Disability Class by Sex by Age in Rutherfordton
Disability Class: Hearing Difficulty
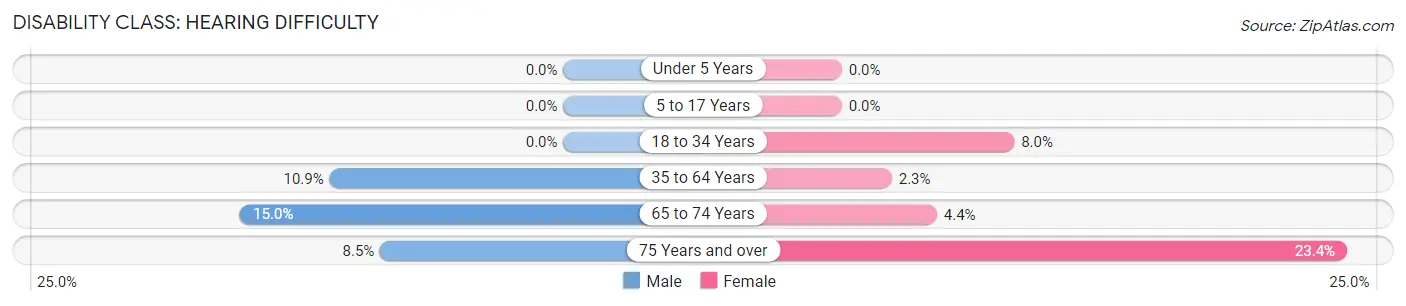
| Age Bracket | Male | Female |
| Under 5 Years | 0 (0.0%) | 0 (0.0%) |
| 5 to 17 Years | 0 (0.0%) | 0 (0.0%) |
| 18 to 34 Years | 0 (0.0%) | 36 (8.0%) |
| 35 to 64 Years | 55 (10.8%) | 13 (2.3%) |
| 65 to 74 Years | 36 (15.0%) | 10 (4.4%) |
| 75 Years and over | 13 (8.5%) | 64 (23.4%) |
Disability Class: Vision Difficulty
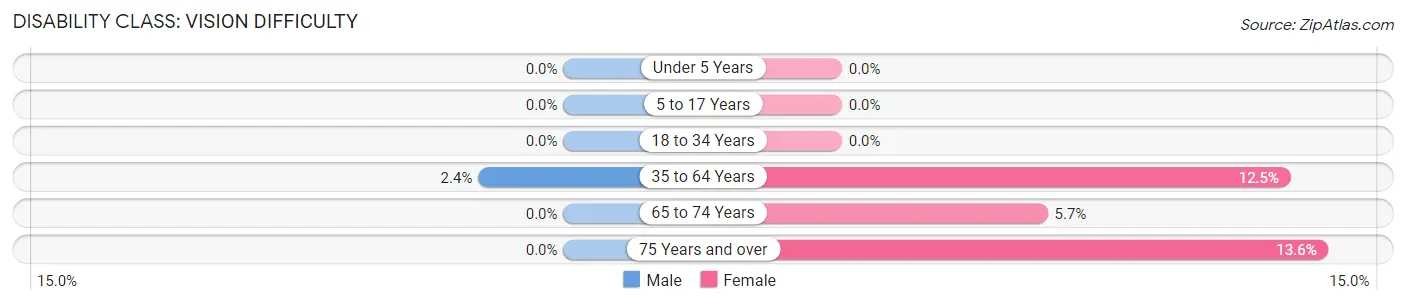
| Age Bracket | Male | Female |
| Under 5 Years | 0 (0.0%) | 0 (0.0%) |
| 5 to 17 Years | 0 (0.0%) | 0 (0.0%) |
| 18 to 34 Years | 0 (0.0%) | 0 (0.0%) |
| 35 to 64 Years | 12 (2.4%) | 70 (12.5%) |
| 65 to 74 Years | 0 (0.0%) | 13 (5.7%) |
| 75 Years and over | 0 (0.0%) | 37 (13.6%) |
Disability Class: Cognitive Difficulty
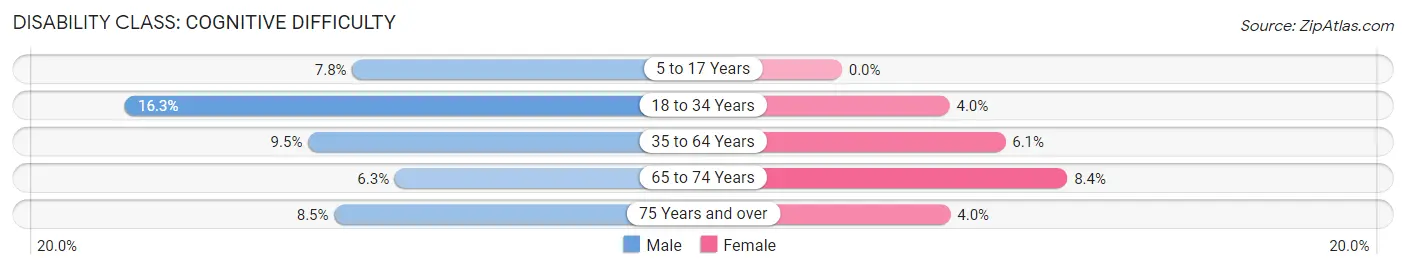
| Age Bracket | Male | Female |
| 5 to 17 Years | 17 (7.8%) | 0 (0.0%) |
| 18 to 34 Years | 41 (16.3%) | 18 (4.0%) |
| 35 to 64 Years | 48 (9.5%) | 34 (6.1%) |
| 65 to 74 Years | 15 (6.2%) | 19 (8.4%) |
| 75 Years and over | 13 (8.5%) | 11 (4.0%) |
Disability Class: Ambulatory Difficulty
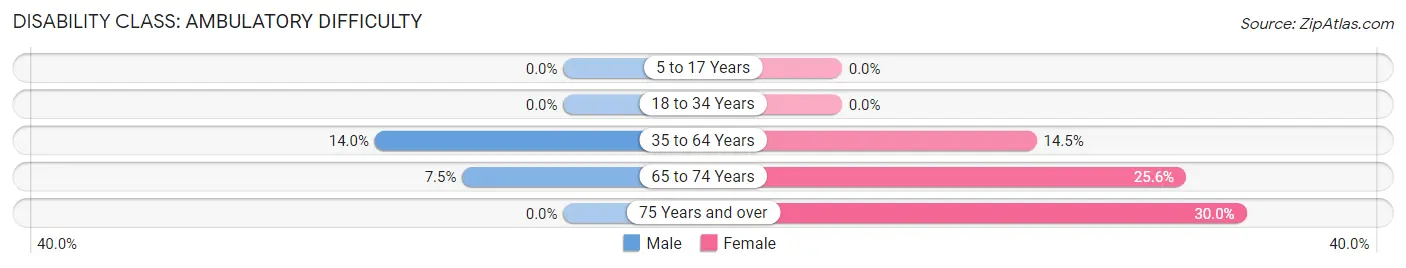
| Age Bracket | Male | Female |
| 5 to 17 Years | 0 (0.0%) | 0 (0.0%) |
| 18 to 34 Years | 0 (0.0%) | 0 (0.0%) |
| 35 to 64 Years | 71 (14.0%) | 81 (14.5%) |
| 65 to 74 Years | 18 (7.5%) | 58 (25.6%) |
| 75 Years and over | 0 (0.0%) | 82 (30.0%) |
Disability Class: Self-Care Difficulty
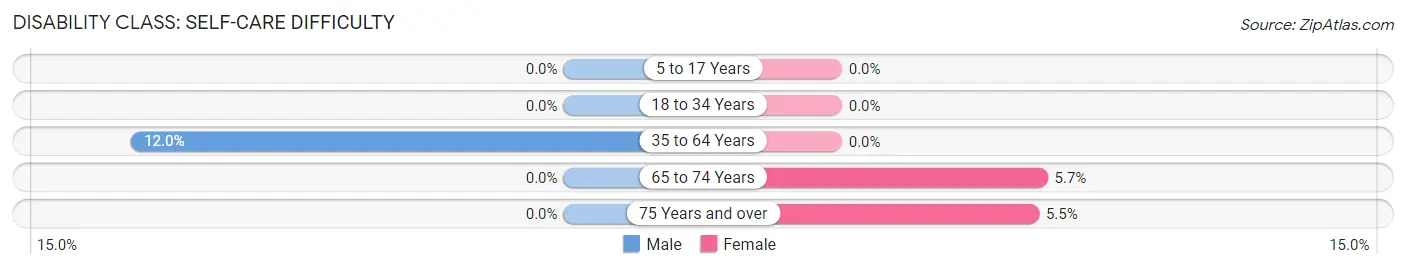
| Age Bracket | Male | Female |
| 5 to 17 Years | 0 (0.0%) | 0 (0.0%) |
| 18 to 34 Years | 0 (0.0%) | 0 (0.0%) |
| 35 to 64 Years | 61 (12.0%) | 0 (0.0%) |
| 65 to 74 Years | 0 (0.0%) | 13 (5.7%) |
| 75 Years and over | 0 (0.0%) | 15 (5.5%) |
Technology Access in Rutherfordton
Computing Device Access in Rutherfordton
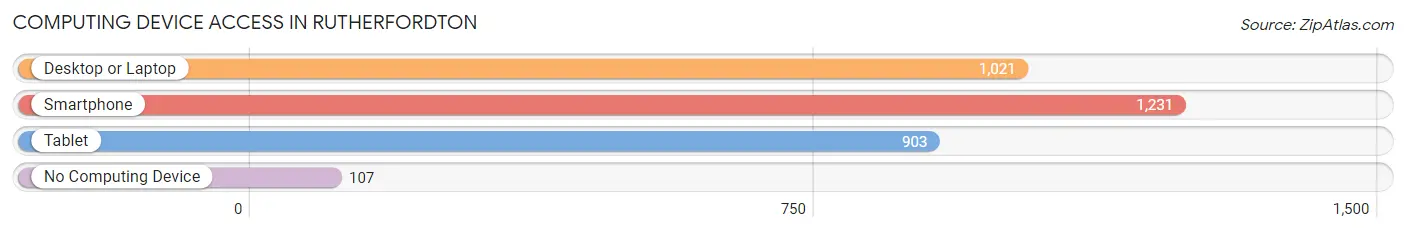
| Device Type | # Households | % Households |
| Desktop or Laptop | 1,021 | 71.1% |
| Smartphone | 1,231 | 85.7% |
| Tablet | 903 | 62.9% |
| No Computing Device | 107 | 7.4% |
| Total | 1,436 | 100.0% |
Internet Access in Rutherfordton
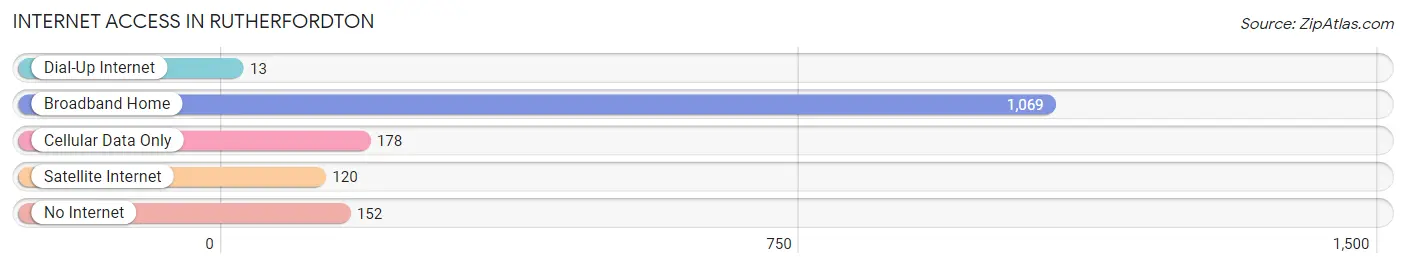
| Internet Type | # Households | % Households |
| Dial-Up Internet | 13 | 0.9% |
| Broadband Home | 1,069 | 74.4% |
| Cellular Data Only | 178 | 12.4% |
| Satellite Internet | 120 | 8.4% |
| No Internet | 152 | 10.6% |
| Total | 1,436 | 100.0% |
Rutherfordton Summary
Rutherfordton is a town located in Rutherford County, North Carolina, United States. It is the county seat of Rutherford County and is located in the foothills of the Blue Ridge Mountains. The population was 4,213 at the 2010 census.
History
Rutherfordton was founded in 1787 and named for General Griffith Rutherford, a Revolutionary War hero. The town was incorporated in 1841 and has been the county seat of Rutherford County since its formation in 1779.
Rutherfordton was an important center of commerce in the 19th century, with a number of stores, hotels, and other businesses. The town was also home to several mills, including a cotton mill, a woolen mill, and a paper mill.
The town was also the site of the Rutherfordton Riot of 1868, a violent confrontation between white and black citizens that resulted in the death of one man. The incident was a result of racial tensions in the area and was one of the first instances of racial violence in the post-Civil War South.
Geography
Rutherfordton is located at 35°21'25" North, 81°56'45" West (35.356944, -81.945278). The town is situated in the foothills of the Blue Ridge Mountains, about 25 miles southeast of Asheville.
The town is located at the intersection of U.S. Route 221 and North Carolina Highway 108. It is also served by the Rutherford County Airport, located just outside of town.
Economy
Rutherfordton is the economic center of Rutherford County. The town is home to a number of businesses, including manufacturing, retail, and service industries.
The town is also home to a number of agricultural operations, including poultry farms, cattle farms, and apple orchards. The town is also home to a number of wineries and vineyards.
Demographics
As of the 2010 census, there were 4,213 people, 1,717 households, and 1,093 families residing in the town. The population density was 1,093.3 people per square mile (422.2/km2). There were 1,902 housing units at an average density of 498.3 per square mile (192.3/km2). The racial makeup of the town was 81.2% White, 15.3% African American, 0.3% Native American, 0.5% Asian, 0.1% Pacific Islander, 1.2% from other races, and 1.4% from two or more races. Hispanic or Latino of any race were 2.7% of the population.
There were 1,717 households, out of which 28.2% had children under the age of 18 living with them, 43.2% were married couples living together, 16.2% had a female householder with no husband present, and 36.2% were non-families. 32.2% of all households were made up of individuals, and 14.7% had someone living alone who was 65 years of age or older. The average household size was 2.35 and the average family size was 2.94.
In the town, the population was spread out, with 24.2% under the age of 18, 8.2% from 18 to 24, 27.2% from 25 to 44, 22.7% from 45 to 64, and 17.7% who were 65 years of age or older. The median age was 38 years. For every 100 females, there were 87.3 males. For every 100 females age 18 and over, there were 82.2 males.
The median income for a household in the town was $30,938, and the median income for a family was $37,917. Males had a median income of $30,000 versus $21,964 for females. The per capita income for the town was $17,845. About 13.2% of families and 16.2% of the population were below the poverty line, including 22.2% of those under age 18 and 16.2% of those age 65 or over.
Common Questions
What is Per Capita Income in Rutherfordton?
Per Capita income in Rutherfordton is $31,631.
What is the Median Family Income in Rutherfordton?
Median Family Income in Rutherfordton is $74,356.
What is the Median Household income in Rutherfordton?
Median Household Income in Rutherfordton is $58,913.
What is Income or Wage Gap in Rutherfordton?
Income or Wage Gap in Rutherfordton is 20.9%.
Women in Rutherfordton earn 79.1 cents for every dollar earned by a man.
What is Inequality or Gini Index in Rutherfordton?
Inequality or Gini Index in Rutherfordton is 0.47.
What is the Total Population of Rutherfordton?
Total Population of Rutherfordton is 3,671.
What is the Total Male Population of Rutherfordton?
Total Male Population of Rutherfordton is 1,611.
What is the Total Female Population of Rutherfordton?
Total Female Population of Rutherfordton is 2,060.
What is the Ratio of Males per 100 Females in Rutherfordton?
There are 78.20 Males per 100 Females in Rutherfordton.
What is the Ratio of Females per 100 Males in Rutherfordton?
There are 127.87 Females per 100 Males in Rutherfordton.
What is the Median Population Age in Rutherfordton?
Median Population Age in Rutherfordton is 40.0 Years.
What is the Average Family Size in Rutherfordton
Average Family Size in Rutherfordton is 3.0 People.
What is the Average Household Size in Rutherfordton
Average Household Size in Rutherfordton is 2.4 People.
How Large is the Labor Force in Rutherfordton?
There are 1,575 People in the Labor Forcein in Rutherfordton.
What is the Percentage of People in the Labor Force in Rutherfordton?
54.1% of People are in the Labor Force in Rutherfordton.
What is the Unemployment Rate in Rutherfordton?
Unemployment Rate in Rutherfordton is 4.0%.