Lexington, NC Map & Demographics
Lexington Map
Lexington Overview
$21,934
PER CAPITA INCOME
$41,044
AVG FAMILY INCOME
$36,868
AVG HOUSEHOLD INCOME
7.2%
WAGE / INCOME GAP [ % ]
92.8¢/ $1
WAGE / INCOME GAP [ $ ]
$11,950
FAMILY INCOME DEFICIT
0.45
INEQUALITY / GINI INDEX
19,595
TOTAL POPULATION
9,700
MALE POPULATION
9,895
FEMALE POPULATION
98.03
MALES / 100 FEMALES
102.01
FEMALES / 100 MALES
38.6
MEDIAN AGE
2.9
AVG FAMILY SIZE
2.4
AVG HOUSEHOLD SIZE
8,575
LABOR FORCE [ PEOPLE ]
54.9%
PERCENT IN LABOR FORCE
6.6%
UNEMPLOYMENT RATE
Lexington Area Codes
Income in Lexington
Income Overview in Lexington
Per Capita Income in Lexington is $21,934, while median incomes of families and households are $41,044 and $36,868 respectively.
| Characteristic | Number | Measure |
| Per Capita Income | 19,595 | $21,934 |
| Median Family Income | 5,165 | $41,044 |
| Mean Family Income | 5,165 | $60,718 |
| Median Household Income | 7,751 | $36,868 |
| Mean Household Income | 7,751 | $54,058 |
| Income Deficit | 5,165 | $11,950 |
| Wage / Income Gap (%) | 19,595 | 7.19% |
| Wage / Income Gap ($) | 19,595 | 92.81¢ per $1 |
| Gini / Inequality Index | 19,595 | 0.45 |
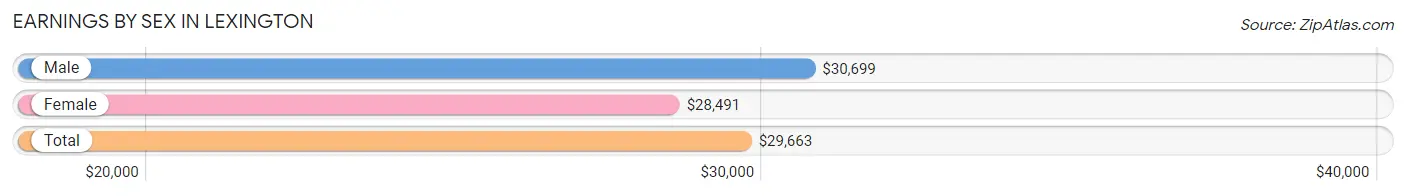
Earnings by Sex in Lexington
Average Earnings in Lexington are $29,663, $30,699 for men and $28,491 for women, a difference of 7.2%.
| Sex | Number | Average Earnings |
| Male | 5,034 (55.8%) | $30,699 |
| Female | 3,994 (44.2%) | $28,491 |
| Total | 9,028 (100.0%) | $29,663 |
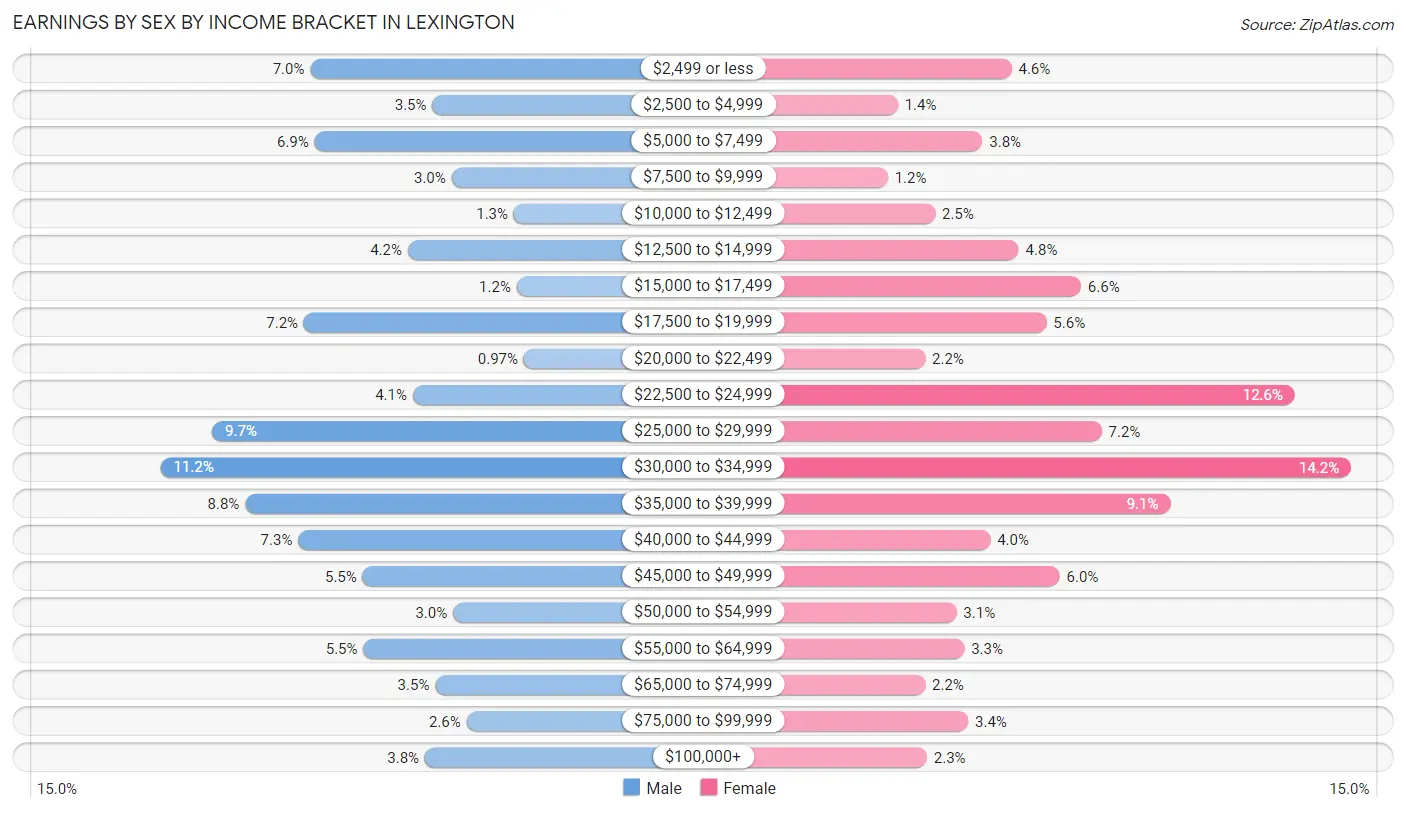
Earnings by Sex by Income Bracket in Lexington
The most common earnings brackets in Lexington are $30,000 to $34,999 for men (563 | 11.2%) and $30,000 to $34,999 for women (566 | 14.2%).
| Income | Male | Female |
| $2,499 or less | 351 (7.0%) | 185 (4.6%) |
| $2,500 to $4,999 | 178 (3.5%) | 57 (1.4%) |
| $5,000 to $7,499 | 345 (6.9%) | 152 (3.8%) |
| $7,500 to $9,999 | 151 (3.0%) | 46 (1.1%) |
| $10,000 to $12,499 | 63 (1.3%) | 99 (2.5%) |
| $12,500 to $14,999 | 213 (4.2%) | 193 (4.8%) |
| $15,000 to $17,499 | 59 (1.2%) | 263 (6.6%) |
| $17,500 to $19,999 | 360 (7.1%) | 224 (5.6%) |
| $20,000 to $22,499 | 49 (1.0%) | 88 (2.2%) |
| $22,500 to $24,999 | 206 (4.1%) | 503 (12.6%) |
| $25,000 to $29,999 | 490 (9.7%) | 286 (7.2%) |
| $30,000 to $34,999 | 563 (11.2%) | 566 (14.2%) |
| $35,000 to $39,999 | 443 (8.8%) | 363 (9.1%) |
| $40,000 to $44,999 | 368 (7.3%) | 161 (4.0%) |
| $45,000 to $49,999 | 277 (5.5%) | 239 (6.0%) |
| $50,000 to $54,999 | 149 (3.0%) | 123 (3.1%) |
| $55,000 to $64,999 | 276 (5.5%) | 132 (3.3%) |
| $65,000 to $74,999 | 174 (3.5%) | 88 (2.2%) |
| $75,000 to $99,999 | 130 (2.6%) | 136 (3.4%) |
| $100,000+ | 189 (3.7%) | 90 (2.2%) |
| Total | 5,034 (100.0%) | 3,994 (100.0%) |
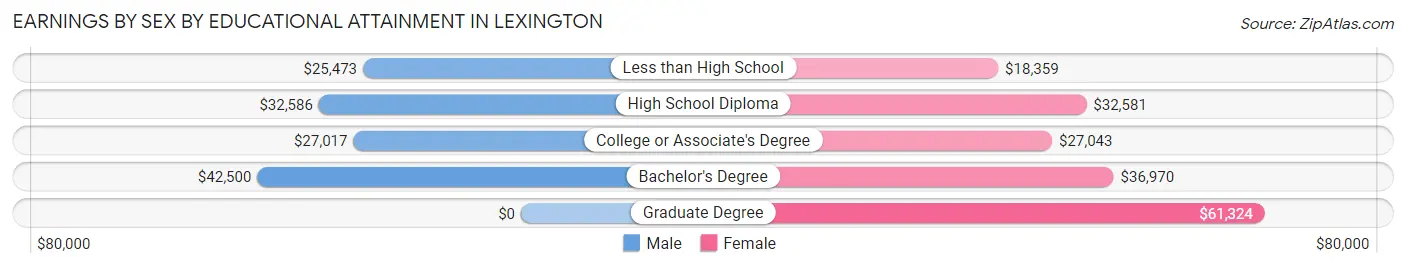
Earnings by Sex by Educational Attainment in Lexington
Average earnings in Lexington are $31,332 for men and $30,135 for women, a difference of 3.8%. Men with an educational attainment of bachelor's degree enjoy the highest average annual earnings of $42,500, while those with less than high school education earn the least with $25,473. Women with an educational attainment of graduate degree earn the most with the average annual earnings of $61,324, while those with less than high school education have the smallest earnings of $18,359.
| Educational Attainment | Male Income | Female Income |
| Less than High School | $25,473 | $18,359 |
| High School Diploma | $32,586 | $32,581 |
| College or Associate's Degree | $27,017 | $27,043 |
| Bachelor's Degree | $42,500 | $36,970 |
| Graduate Degree | - | - |
| Total | $31,332 | $30,135 |
Family Income in Lexington
Family Income Brackets in Lexington
According to the Lexington family income data, there are 1,126 families falling into the $25,000 to $34,999 income range, which is the most common income bracket and makes up 21.8% of all families. Conversely, the $150,000 to $199,999 income bracket is the least frequent group with only 103 families (2.0%) belonging to this category.
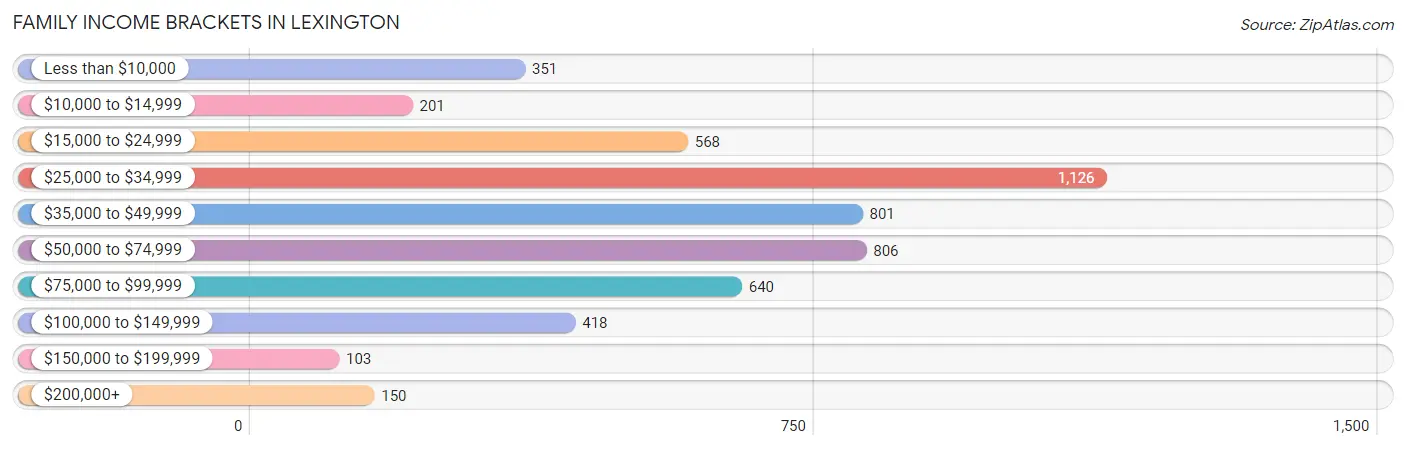
| Income Bracket | # Families | % Families |
| Less than $10,000 | 351 | 6.8% |
| $10,000 to $14,999 | 201 | 3.9% |
| $15,000 to $24,999 | 568 | 11.0% |
| $25,000 to $34,999 | 1,126 | 21.8% |
| $35,000 to $49,999 | 801 | 15.5% |
| $50,000 to $74,999 | 806 | 15.6% |
| $75,000 to $99,999 | 640 | 12.4% |
| $100,000 to $149,999 | 418 | 8.1% |
| $150,000 to $199,999 | 103 | 2.0% |
| $200,000+ | 150 | 2.9% |
Family Income by Famaliy Size in Lexington
5-person families (150 | 2.9%) account for the highest median family income in Lexington with $77,661 per family, while 2-person families (2,762 | 53.5%) have the highest median income of $16,838 per family member.
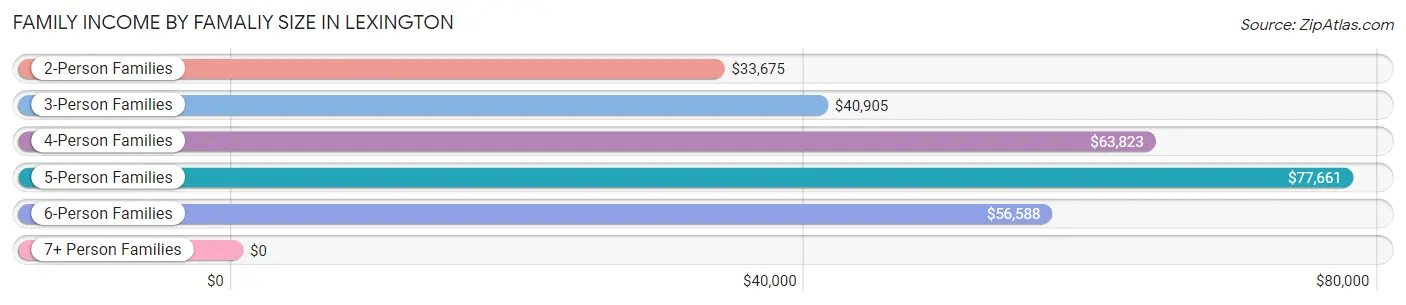
| Income Bracket | # Families | Median Income |
| 2-Person Families | 2,762 (53.5%) | $33,675 |
| 3-Person Families | 1,129 (21.9%) | $40,905 |
| 4-Person Families | 881 (17.1%) | $63,823 |
| 5-Person Families | 150 (2.9%) | $77,661 |
| 6-Person Families | 217 (4.2%) | $56,588 |
| 7+ Person Families | 26 (0.5%) | $0 |
| Total | 5,165 (100.0%) | $41,044 |
Family Income by Number of Earners in Lexington
The median family income in Lexington is $41,044, with families comprising 3+ earners (376) having the highest median family income of $110,903, while families with no earners (1,054) have the lowest median family income of $27,250, accounting for 7.3% and 20.4% of families, respectively.
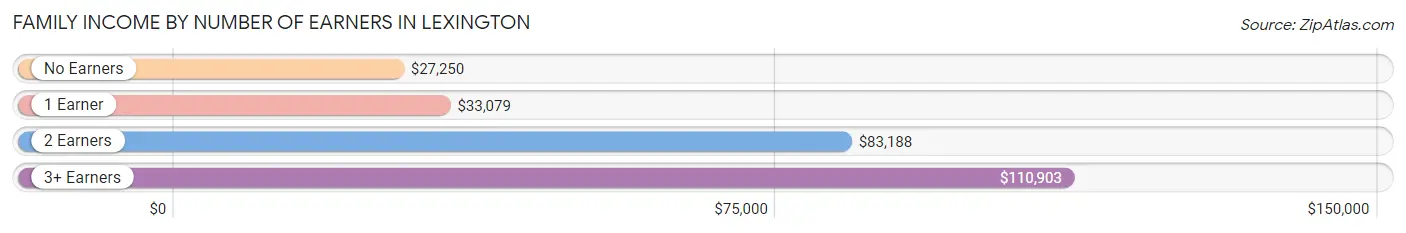
| Number of Earners | # Families | Median Income |
| No Earners | 1,054 (20.4%) | $27,250 |
| 1 Earner | 2,353 (45.6%) | $33,079 |
| 2 Earners | 1,382 (26.8%) | $83,188 |
| 3+ Earners | 376 (7.3%) | $110,903 |
| Total | 5,165 (100.0%) | $41,044 |
Household Income in Lexington
Household Income Brackets in Lexington
With 1,511 households falling in the category, the $25,000 to $34,999 income range is the most frequent in Lexington, accounting for 19.5% of all households. In contrast, only 147 households (1.9%) fall into the $150,000 to $199,999 income bracket, making it the least populous group.
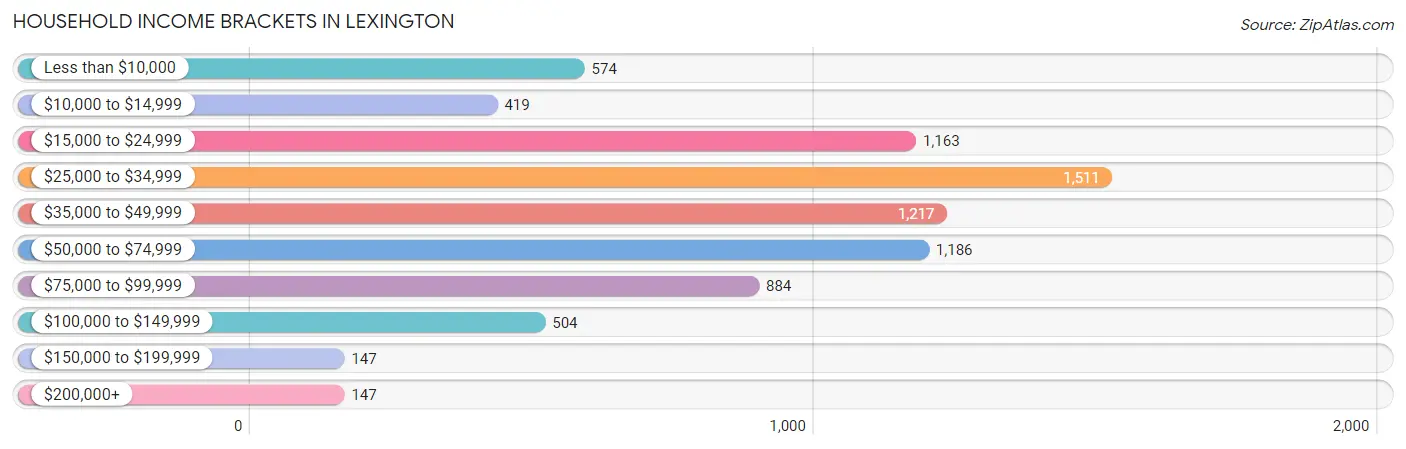
| Income Bracket | # Households | % Households |
| Less than $10,000 | 574 | 7.4% |
| $10,000 to $14,999 | 419 | 5.4% |
| $15,000 to $24,999 | 1,163 | 15.0% |
| $25,000 to $34,999 | 1,511 | 19.5% |
| $35,000 to $49,999 | 1,217 | 15.7% |
| $50,000 to $74,999 | 1,186 | 15.3% |
| $75,000 to $99,999 | 884 | 11.4% |
| $100,000 to $149,999 | 504 | 6.5% |
| $150,000 to $199,999 | 147 | 1.9% |
| $200,000+ | 147 | 1.9% |
Household Income by Householder Age in Lexington
The median household income in Lexington is $36,868, with the highest median household income of $40,560 found in the 65+ years age bracket for the primary householder. A total of 1,837 households (23.7%) fall into this category. Meanwhile, the 15 to 24 years age bracket for the primary householder has the lowest median household income of $35,474, with 355 households (4.6%) in this group.
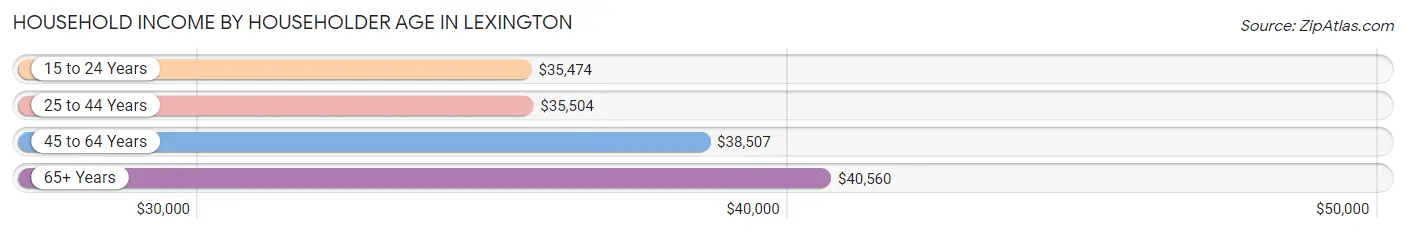
| Income Bracket | # Households | Median Income |
| 15 to 24 Years | 355 (4.6%) | $35,474 |
| 25 to 44 Years | 2,412 (31.1%) | $35,504 |
| 45 to 64 Years | 3,147 (40.6%) | $38,507 |
| 65+ Years | 1,837 (23.7%) | $40,560 |
| Total | 7,751 (100.0%) | $36,868 |
Poverty in Lexington
Income Below Poverty by Sex and Age in Lexington
With 19.2% poverty level for males and 22.7% for females among the residents of Lexington, 5 year old males and under 5 year old females are the most vulnerable to poverty, with 87 males (69.6%) and 259 females (44.0%) in their respective age groups living below the poverty level.
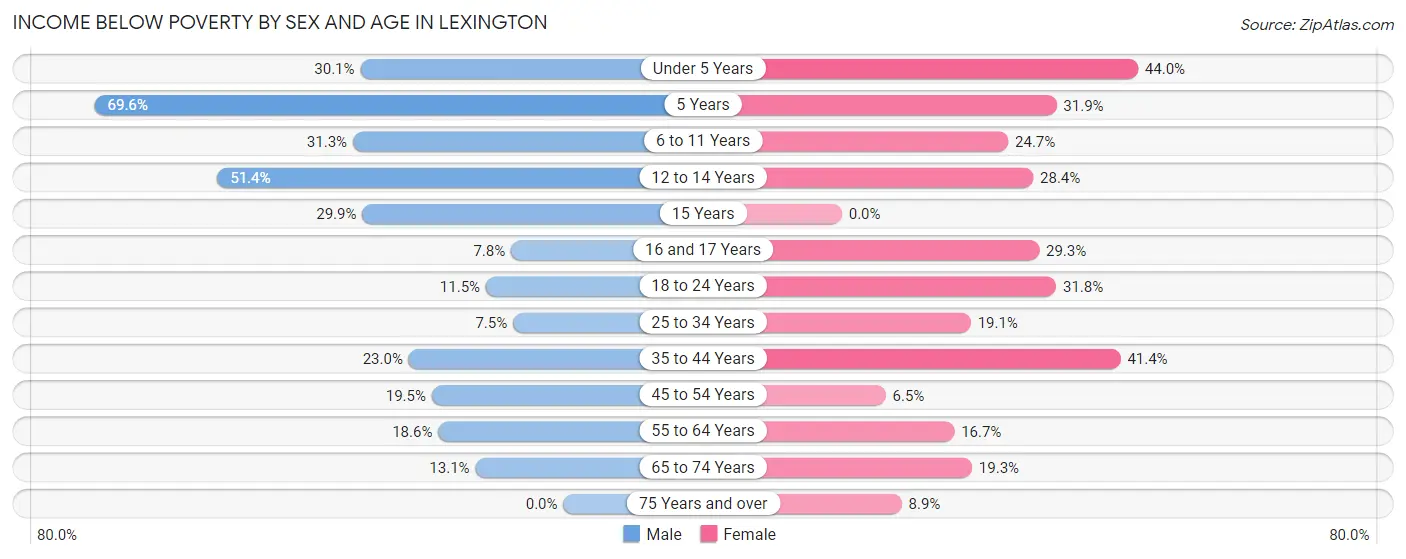
| Age Bracket | Male | Female |
| Under 5 Years | 223 (30.1%) | 259 (44.0%) |
| 5 Years | 87 (69.6%) | 58 (31.9%) |
| 6 to 11 Years | 205 (31.2%) | 162 (24.7%) |
| 12 to 14 Years | 112 (51.4%) | 127 (28.4%) |
| 15 Years | 60 (29.8%) | 0 (0.0%) |
| 16 and 17 Years | 16 (7.8%) | 70 (29.3%) |
| 18 to 24 Years | 65 (11.5%) | 232 (31.8%) |
| 25 to 34 Years | 94 (7.5%) | 337 (19.1%) |
| 35 to 44 Years | 281 (23.0%) | 437 (41.4%) |
| 45 to 54 Years | 212 (19.5%) | 75 (6.5%) |
| 55 to 64 Years | 296 (18.6%) | 211 (16.7%) |
| 65 to 74 Years | 97 (13.1%) | 165 (19.3%) |
| 75 Years and over | 0 (0.0%) | 54 (8.9%) |
| Total | 1,748 (19.2%) | 2,187 (22.7%) |
Income Above Poverty by Sex and Age in Lexington
According to the poverty statistics in Lexington, males aged 75 years and over and females aged 15 years are the age groups that are most secure financially, with 100.0% of males and 100.0% of females in these age groups living above the poverty line.
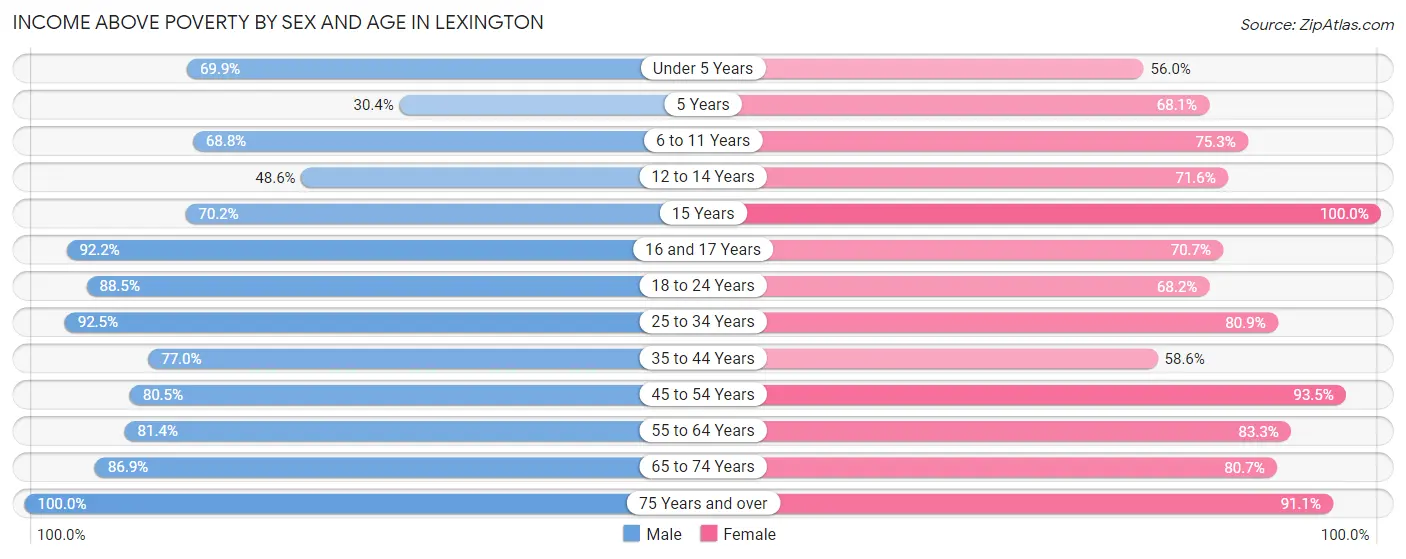
| Age Bracket | Male | Female |
| Under 5 Years | 517 (69.9%) | 330 (56.0%) |
| 5 Years | 38 (30.4%) | 124 (68.1%) |
| 6 to 11 Years | 451 (68.8%) | 494 (75.3%) |
| 12 to 14 Years | 106 (48.6%) | 320 (71.6%) |
| 15 Years | 141 (70.2%) | 106 (100.0%) |
| 16 and 17 Years | 190 (92.2%) | 169 (70.7%) |
| 18 to 24 Years | 500 (88.5%) | 497 (68.2%) |
| 25 to 34 Years | 1,164 (92.5%) | 1,424 (80.9%) |
| 35 to 44 Years | 943 (77.0%) | 619 (58.6%) |
| 45 to 54 Years | 873 (80.5%) | 1,079 (93.5%) |
| 55 to 64 Years | 1,297 (81.4%) | 1,053 (83.3%) |
| 65 to 74 Years | 646 (86.9%) | 689 (80.7%) |
| 75 Years and over | 472 (100.0%) | 554 (91.1%) |
| Total | 7,338 (80.8%) | 7,458 (77.3%) |
Income Below Poverty Among Married-Couple Families in Lexington
The poverty statistics for married-couple families in Lexington show that 8.2% or 218 of the total 2,668 families live below the poverty line. Families with 5 or more children have the highest poverty rate of 50.0%, comprising of 9 families. On the other hand, families with no children have the lowest poverty rate of 3.8%, which includes 68 families.
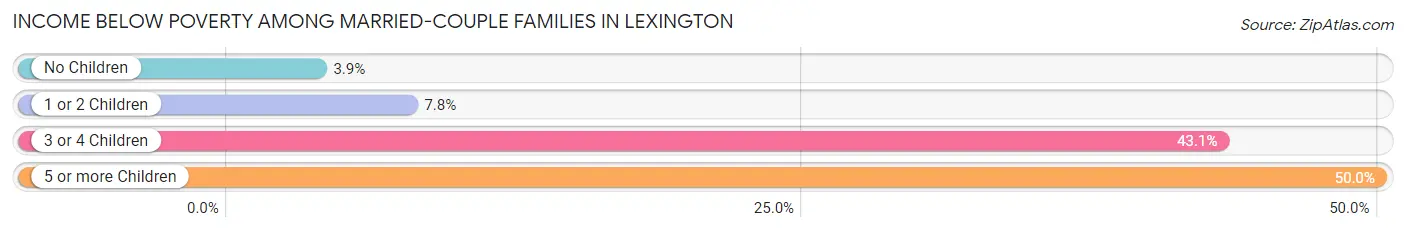
| Children | Above Poverty | Below Poverty |
| No Children | 1,699 (96.2%) | 68 (3.8%) |
| 1 or 2 Children | 626 (92.2%) | 53 (7.8%) |
| 3 or 4 Children | 116 (56.9%) | 88 (43.1%) |
| 5 or more Children | 9 (50.0%) | 9 (50.0%) |
| Total | 2,450 (91.8%) | 218 (8.2%) |
Income Below Poverty Among Single-Parent Households in Lexington
According to the poverty data in Lexington, 16.6% or 107 single-father households and 30.8% or 570 single-mother households are living below the poverty line. Among single-father households, those with 3 or 4 children have the highest poverty rate, with 12 households (100.0%) experiencing poverty. Likewise, among single-mother households, those with 3 or 4 children have the highest poverty rate, with 124 households (62.3%) falling below the poverty line.
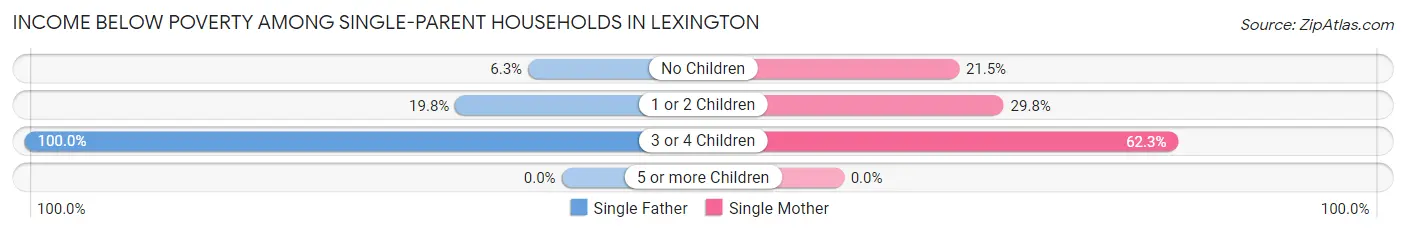
| Children | Single Father | Single Mother |
| No Children | 14 (6.2%) | 120 (21.5%) |
| 1 or 2 Children | 81 (19.8%) | 326 (29.8%) |
| 3 or 4 Children | 12 (100.0%) | 124 (62.3%) |
| 5 or more Children | 0 (0.0%) | 0 (0.0%) |
| Total | 107 (16.6%) | 570 (30.8%) |
Income Below Poverty Among Married-Couple vs Single-Parent Households in Lexington
The poverty data for Lexington shows that 218 of the married-couple family households (8.2%) and 677 of the single-parent households (27.1%) are living below the poverty level. Within the married-couple family households, those with 5 or more children have the highest poverty rate, with 9 households (50.0%) falling below the poverty line. Among the single-parent households, those with 3 or 4 children have the highest poverty rate, with 136 household (64.4%) living below poverty.
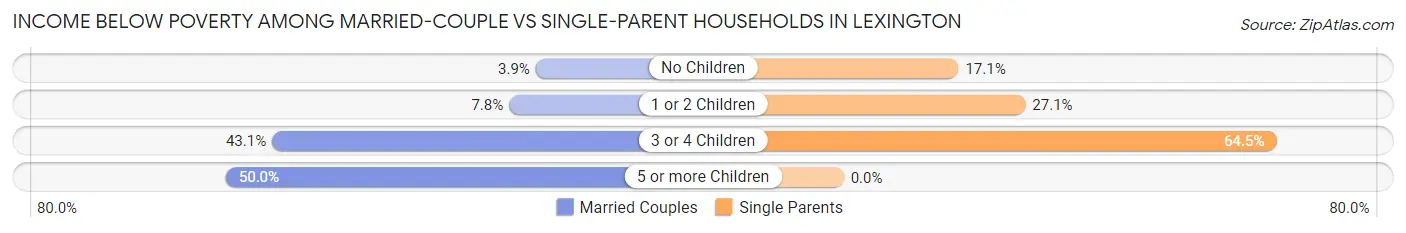
| Children | Married-Couple Families | Single-Parent Households |
| No Children | 68 (3.8%) | 134 (17.1%) |
| 1 or 2 Children | 53 (7.8%) | 407 (27.1%) |
| 3 or 4 Children | 88 (43.1%) | 136 (64.4%) |
| 5 or more Children | 9 (50.0%) | 0 (0.0%) |
| Total | 218 (8.2%) | 677 (27.1%) |
Race in Lexington
The most populous races in Lexington are White / Caucasian (9,611 | 49.0%), Black / African American (6,090 | 31.1%), and Hispanic or Latino (3,212 | 16.4%).

| Race | # Population | % Population |
| Asian | 697 | 3.6% |
| Black / African American | 6,090 | 31.1% |
| Hawaiian / Pacific | 4 | 0.0% |
| Hispanic or Latino | 3,212 | 16.4% |
| Native / Alaskan | 25 | 0.1% |
| White / Caucasian | 9,611 | 49.0% |
| Two or more Races | 2,174 | 11.1% |
| Some other Race | 994 | 5.1% |
| Total | 19,595 | 100.0% |
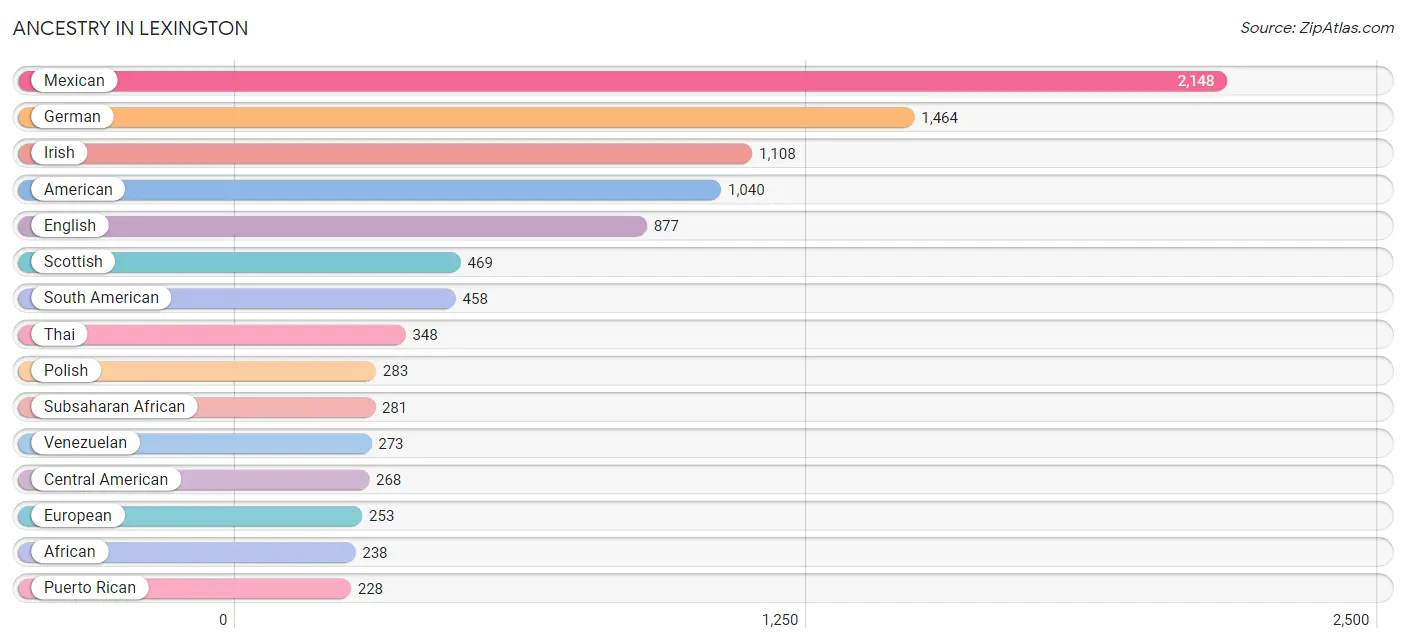
Ancestry in Lexington
The most populous ancestries reported in Lexington are Mexican (2,148 | 11.0%), German (1,464 | 7.5%), Irish (1,108 | 5.7%), American (1,040 | 5.3%), and English (877 | 4.5%), together accounting for 33.9% of all Lexington residents.
| Ancestry | # Population | % Population |
| African | 238 | 1.2% |
| Albanian | 12 | 0.1% |
| American | 1,040 | 5.3% |
| Apache | 21 | 0.1% |
| Arab | 12 | 0.1% |
| Bangladeshi | 11 | 0.1% |
| Bhutanese | 28 | 0.1% |
| Bolivian | 9 | 0.1% |
| British | 11 | 0.1% |
| Central American | 268 | 1.4% |
| Cherokee | 218 | 1.1% |
| Choctaw | 20 | 0.1% |
| Colombian | 176 | 0.9% |
| Cuban | 64 | 0.3% |
| Danish | 12 | 0.1% |
| Dutch | 71 | 0.4% |
| Eastern European | 7 | 0.0% |
| English | 877 | 4.5% |
| European | 253 | 1.3% |
| French | 105 | 0.5% |
| French Canadian | 60 | 0.3% |
| German | 1,464 | 7.5% |
| Guatemalan | 130 | 0.7% |
| Guyanese | 31 | 0.2% |
| Honduran | 110 | 0.6% |
| Indian (Asian) | 11 | 0.1% |
| Irish | 1,108 | 5.7% |
| Italian | 174 | 0.9% |
| Jamaican | 32 | 0.2% |
| Japanese | 126 | 0.6% |
| Korean | 32 | 0.2% |
| Lebanese | 12 | 0.1% |
| Lumbee | 31 | 0.2% |
| Malaysian | 126 | 0.6% |
| Mexican | 2,148 | 11.0% |
| Mexican American Indian | 6 | 0.0% |
| Native Hawaiian | 18 | 0.1% |
| Nigerian | 43 | 0.2% |
| Norwegian | 103 | 0.5% |
| Pennsylvania German | 119 | 0.6% |
| Polish | 283 | 1.4% |
| Portuguese | 7 | 0.0% |
| Puerto Rican | 228 | 1.2% |
| Russian | 17 | 0.1% |
| Salvadoran | 28 | 0.1% |
| Scandinavian | 17 | 0.1% |
| Scotch-Irish | 192 | 1.0% |
| Scottish | 469 | 2.4% |
| Slavic | 12 | 0.1% |
| South American | 458 | 2.3% |
| Sri Lankan | 158 | 0.8% |
| Subsaharan African | 281 | 1.4% |
| Swedish | 21 | 0.1% |
| Swiss | 45 | 0.2% |
| Syrian | 3 | 0.0% |
| Thai | 348 | 1.8% |
| Venezuelan | 273 | 1.4% |
| Welsh | 13 | 0.1% |
| West Indian | 14 | 0.1% | View All 59 Rows |
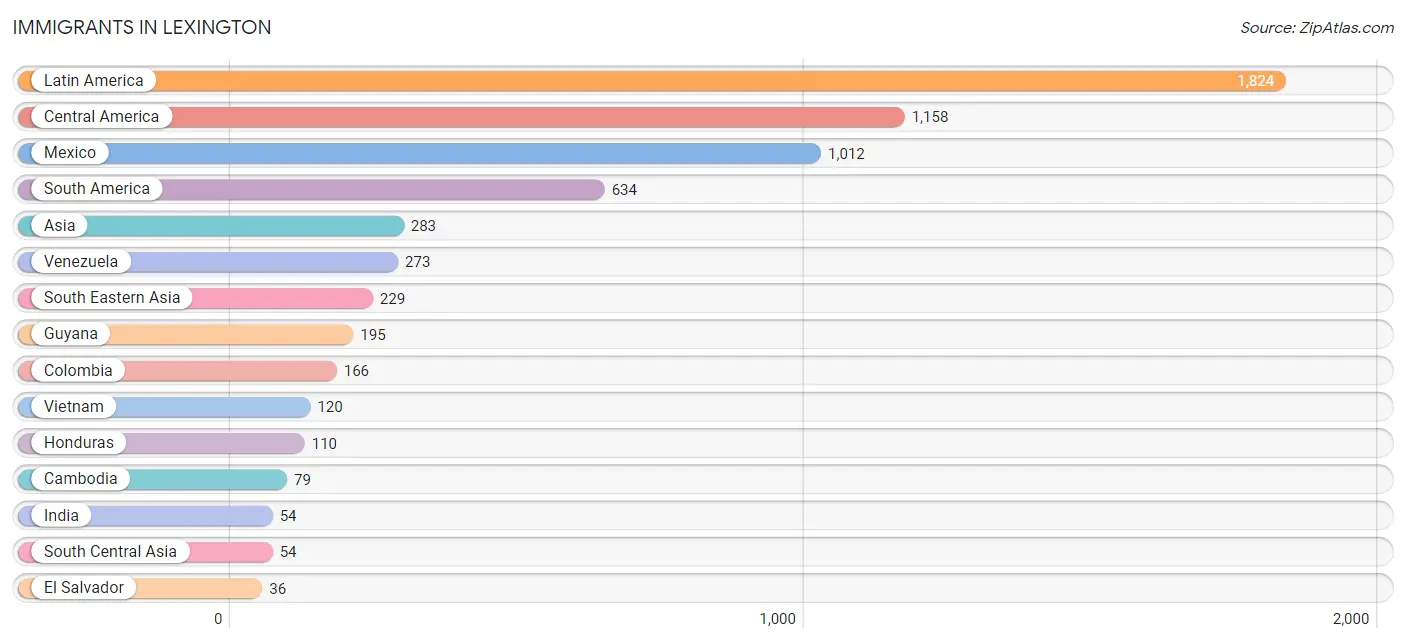
Immigrants in Lexington
The most numerous immigrant groups reported in Lexington came from Latin America (1,824 | 9.3%), Central America (1,158 | 5.9%), Mexico (1,012 | 5.2%), South America (634 | 3.2%), and Asia (283 | 1.4%), together accounting for 25.1% of all Lexington residents.
| Immigration Origin | # Population | % Population |
| Albania | 12 | 0.1% |
| Asia | 283 | 1.4% |
| Cambodia | 79 | 0.4% |
| Caribbean | 32 | 0.2% |
| Central America | 1,158 | 5.9% |
| Colombia | 166 | 0.9% |
| Eastern Europe | 12 | 0.1% |
| El Salvador | 36 | 0.2% |
| Europe | 20 | 0.1% |
| Germany | 8 | 0.0% |
| Guyana | 195 | 1.0% |
| Honduras | 110 | 0.6% |
| India | 54 | 0.3% |
| Jamaica | 32 | 0.2% |
| Latin America | 1,824 | 9.3% |
| Mexico | 1,012 | 5.2% |
| South America | 634 | 3.2% |
| South Central Asia | 54 | 0.3% |
| South Eastern Asia | 229 | 1.2% |
| Thailand | 30 | 0.2% |
| Venezuela | 273 | 1.4% |
| Vietnam | 120 | 0.6% |
| Western Europe | 8 | 0.0% | View All 23 Rows |
Sex and Age in Lexington
Sex and Age in Lexington
The most populous age groups in Lexington are 55 to 59 Years (968 | 10.0%) for men and 25 to 29 Years (1,094 | 11.1%) for women.
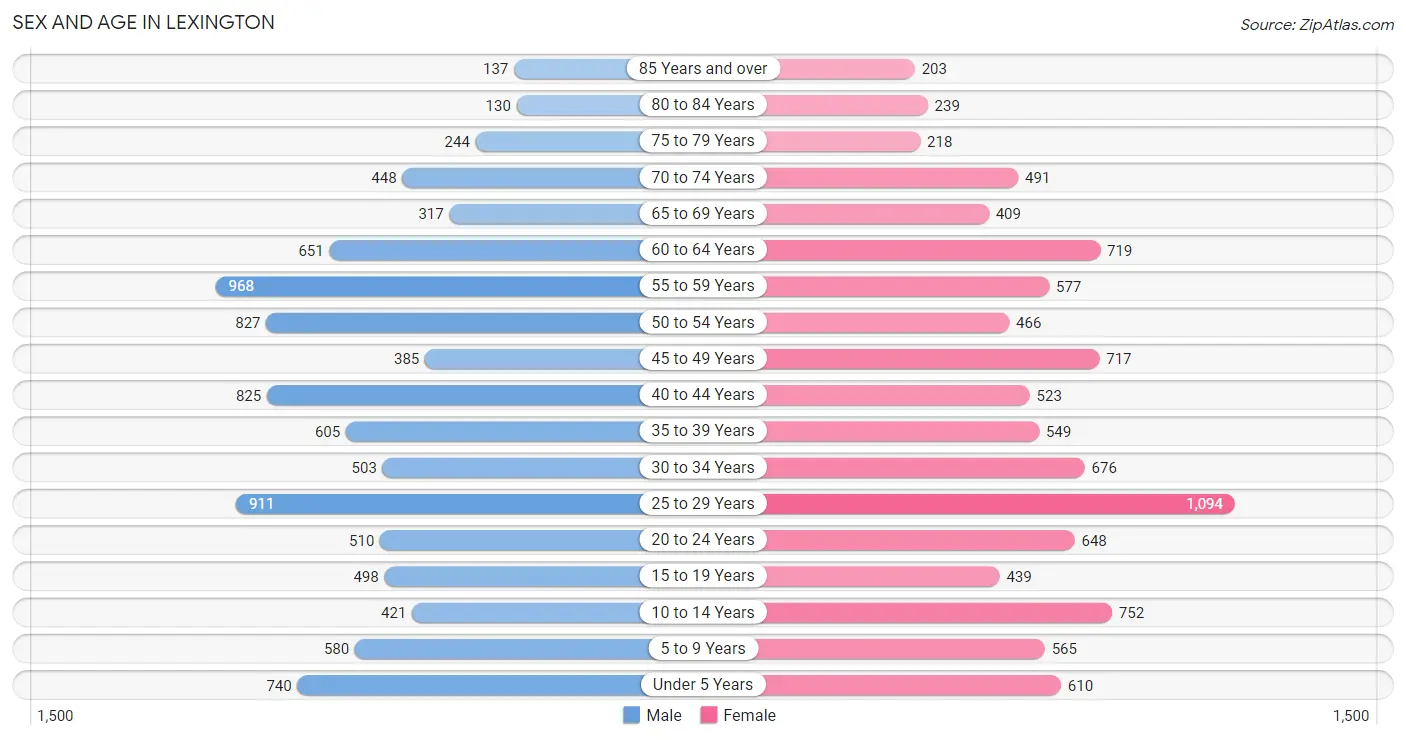
| Age Bracket | Male | Female |
| Under 5 Years | 740 (7.6%) | 610 (6.2%) |
| 5 to 9 Years | 580 (6.0%) | 565 (5.7%) |
| 10 to 14 Years | 421 (4.3%) | 752 (7.6%) |
| 15 to 19 Years | 498 (5.1%) | 439 (4.4%) |
| 20 to 24 Years | 510 (5.3%) | 648 (6.6%) |
| 25 to 29 Years | 911 (9.4%) | 1,094 (11.1%) |
| 30 to 34 Years | 503 (5.2%) | 676 (6.8%) |
| 35 to 39 Years | 605 (6.2%) | 549 (5.6%) |
| 40 to 44 Years | 825 (8.5%) | 523 (5.3%) |
| 45 to 49 Years | 385 (4.0%) | 717 (7.2%) |
| 50 to 54 Years | 827 (8.5%) | 466 (4.7%) |
| 55 to 59 Years | 968 (10.0%) | 577 (5.8%) |
| 60 to 64 Years | 651 (6.7%) | 719 (7.3%) |
| 65 to 69 Years | 317 (3.3%) | 409 (4.1%) |
| 70 to 74 Years | 448 (4.6%) | 491 (5.0%) |
| 75 to 79 Years | 244 (2.5%) | 218 (2.2%) |
| 80 to 84 Years | 130 (1.3%) | 239 (2.4%) |
| 85 Years and over | 137 (1.4%) | 203 (2.1%) |
| Total | 9,700 (100.0%) | 9,895 (100.0%) |
Families and Households in Lexington
Median Family Size in Lexington
The median family size in Lexington is 2.91 persons per family, with married-couple families (2,668 | 51.7%) accounting for the largest median family size of 2.99 persons per family. On the other hand, single male/father families (645 | 12.5%) represent the smallest median family size with 2.71 persons per family.
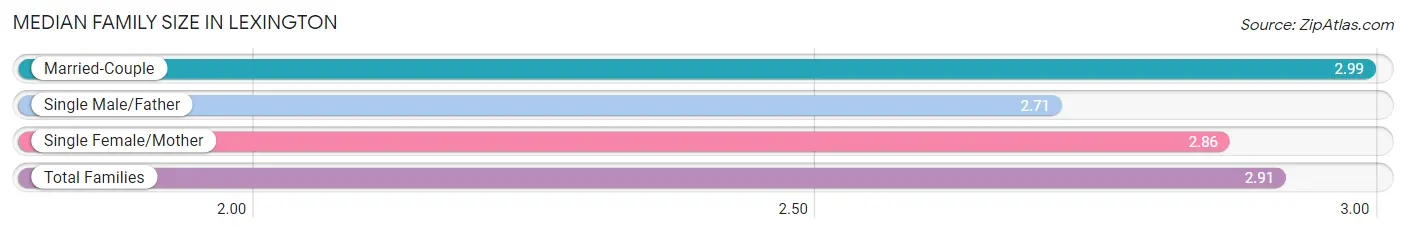
| Family Type | # Families | Family Size |
| Married-Couple | 2,668 (51.7%) | 2.99 |
| Single Male/Father | 645 (12.5%) | 2.71 |
| Single Female/Mother | 1,852 (35.9%) | 2.86 |
| Total Families | 5,165 (100.0%) | 2.91 |
Median Household Size in Lexington
The median household size in Lexington is 2.41 persons per household, with married-couple households (2,668 | 34.4%) accounting for the largest median household size of 3.01 persons per household. non-family households (2,586 | 33.4%) represent the smallest median household size with 1.25 persons per household.
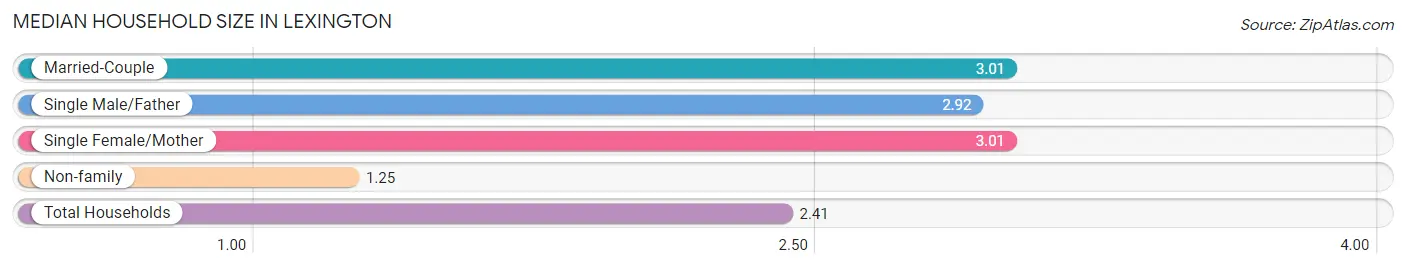
| Household Type | # Households | Household Size |
| Married-Couple | 2,668 (34.4%) | 3.01 |
| Single Male/Father | 645 (8.3%) | 2.92 |
| Single Female/Mother | 1,852 (23.9%) | 3.01 |
| Non-family | 2,586 (33.4%) | 1.25 |
| Total Households | 7,751 (100.0%) | 2.41 |
Household Size by Marriage Status in Lexington
Out of a total of 7,751 households in Lexington, 5,165 (66.6%) are family households, while 2,586 (33.4%) are nonfamily households. The most numerous type of family households are 2-person households, comprising 2,638, and the most common type of nonfamily households are 1-person households, comprising 1,976.
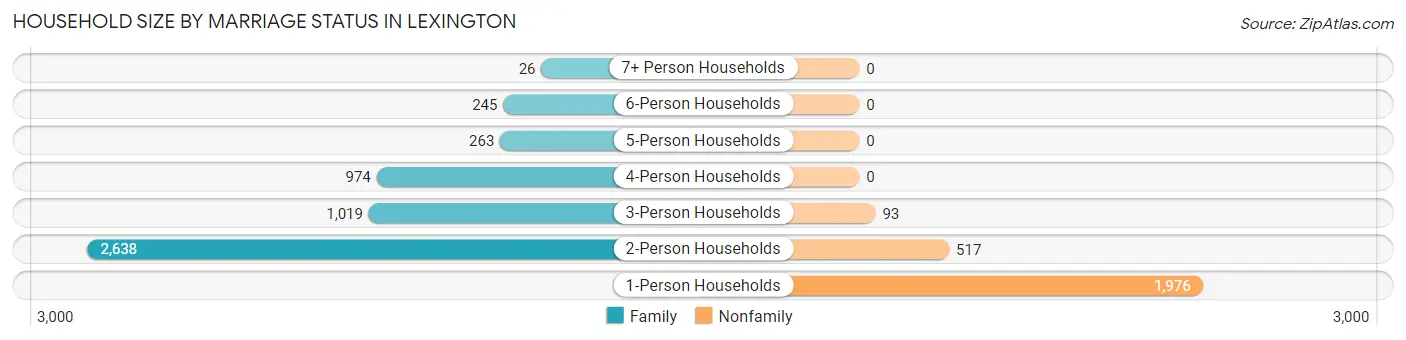
| Household Size | Family Households | Nonfamily Households |
| 1-Person Households | - | 1,976 (25.5%) |
| 2-Person Households | 2,638 (34.0%) | 517 (6.7%) |
| 3-Person Households | 1,019 (13.2%) | 93 (1.2%) |
| 4-Person Households | 974 (12.6%) | 0 (0.0%) |
| 5-Person Households | 263 (3.4%) | 0 (0.0%) |
| 6-Person Households | 245 (3.2%) | 0 (0.0%) |
| 7+ Person Households | 26 (0.3%) | 0 (0.0%) |
| Total | 5,165 (66.6%) | 2,586 (33.4%) |
Female Fertility in Lexington
Fertility by Age in Lexington
Average fertility rate in Lexington is 105.0 births per 1,000 women. Women in the age bracket of 20 to 34 years have the highest fertility rate with 177.0 births per 1,000 women. Women in the age bracket of 20 to 34 years acount for 86.7% of all women with births.
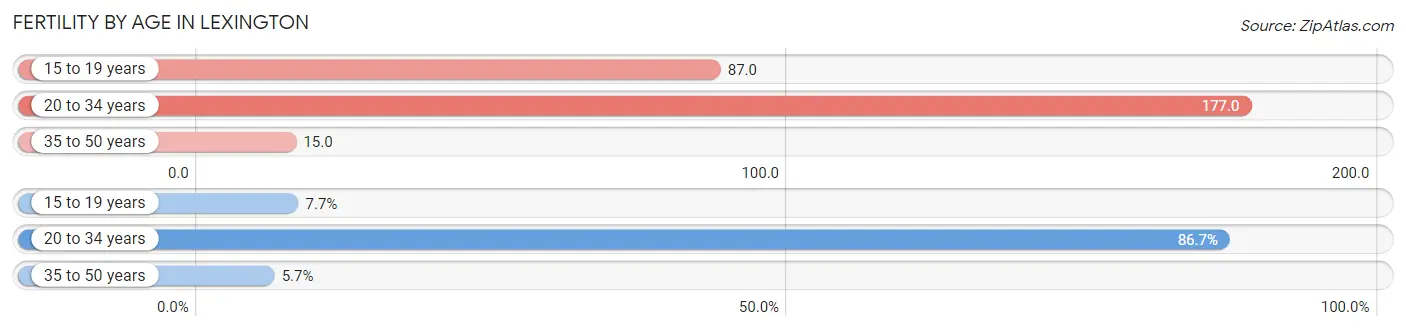
| Age Bracket | Women with Births | Births / 1,000 Women |
| 15 to 19 years | 38 (7.7%) | 87.0 |
| 20 to 34 years | 429 (86.7%) | 177.0 |
| 35 to 50 years | 28 (5.7%) | 15.0 |
| Total | 495 (100.0%) | 105.0 |
Fertility by Age by Marriage Status in Lexington
35.6% of women with births (495) in Lexington are married. The highest percentage of unmarried women with births falls into 15 to 19 years age bracket with 100.0% of them unmarried at the time of birth, while the lowest percentage of unmarried women with births belong to 35 to 50 years age bracket with 46.4% of them unmarried.
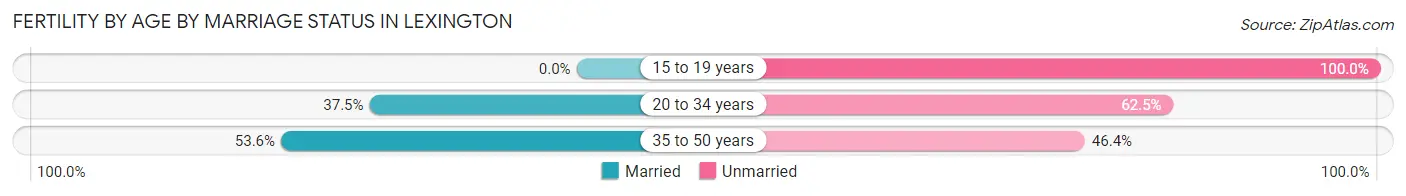
| Age Bracket | Married | Unmarried |
| 15 to 19 years | 0 (0.0%) | 38 (100.0%) |
| 20 to 34 years | 161 (37.5%) | 268 (62.5%) |
| 35 to 50 years | 15 (53.6%) | 13 (46.4%) |
| Total | 176 (35.6%) | 319 (64.4%) |
Fertility by Education in Lexington
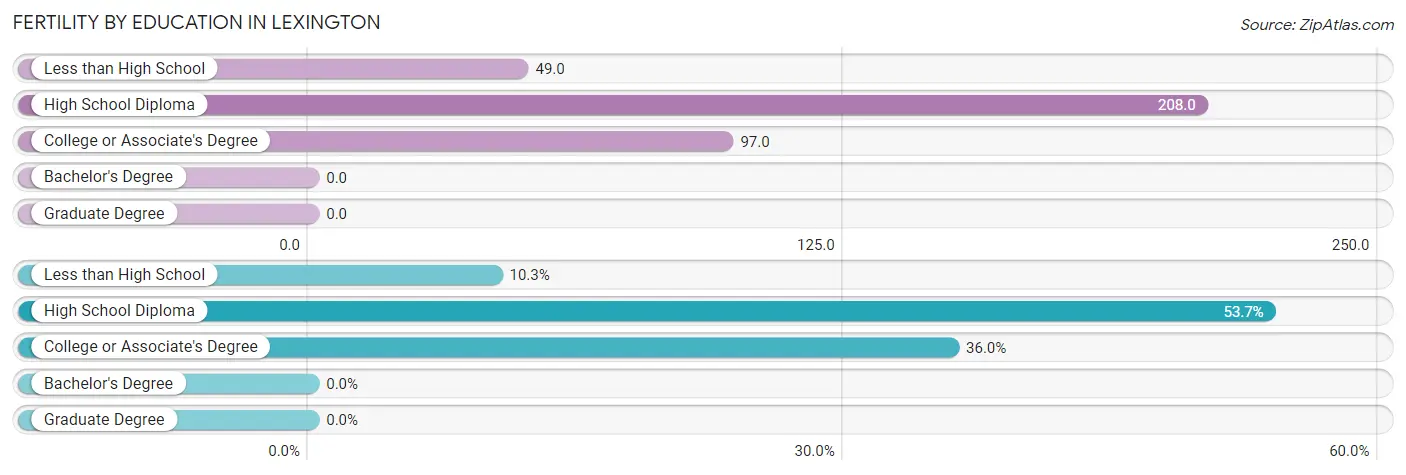
| Educational Attainment | Women with Births | Births / 1,000 Women |
| Less than High School | 51 (10.3%) | 49.0 |
| High School Diploma | 266 (53.7%) | 208.0 |
| College or Associate's Degree | 178 (36.0%) | 97.0 |
| Bachelor's Degree | 0 (0.0%) | 0.0 |
| Graduate Degree | 0 (0.0%) | 0.0 |
| Total | 495 (100.0%) | 105.0 |
Fertility by Education by Marriage Status in Lexington
64.4% of women with births in Lexington are unmarried. Women with the educational attainment of college or associate's degree are most likely to be married with 51.1% of them married at childbirth, while women with the educational attainment of less than high school are least likely to be married with 74.5% of them unmarried at childbirth.
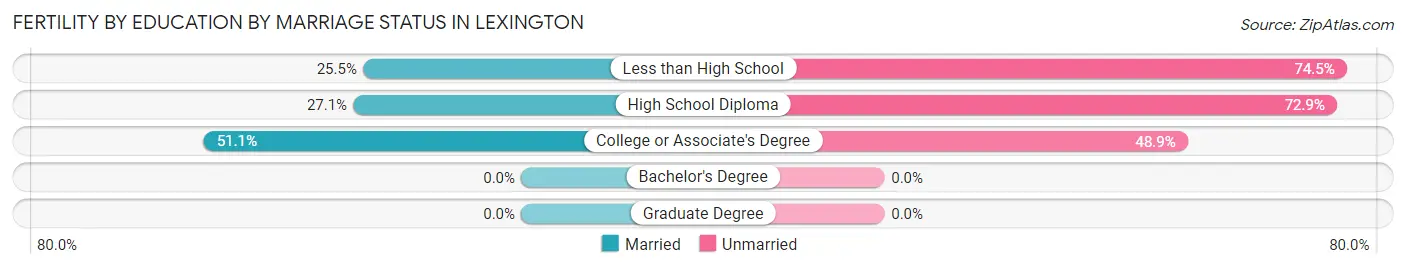
| Educational Attainment | Married | Unmarried |
| Less than High School | 13 (25.5%) | 38 (74.5%) |
| High School Diploma | 72 (27.1%) | 194 (72.9%) |
| College or Associate's Degree | 91 (51.1%) | 87 (48.9%) |
| Bachelor's Degree | 0 (0.0%) | 0 (0.0%) |
| Graduate Degree | 0 (0.0%) | 0 (0.0%) |
| Total | 176 (35.6%) | 319 (64.4%) |
Employment Characteristics in Lexington
Employment by Class of Employer in Lexington
Among the 7,608 employed individuals in Lexington, private company employees (6,112 | 80.3%), not-for-profit organizations (531 | 7.0%), and local government employees (266 | 3.5%) make up the most common classes of employment.
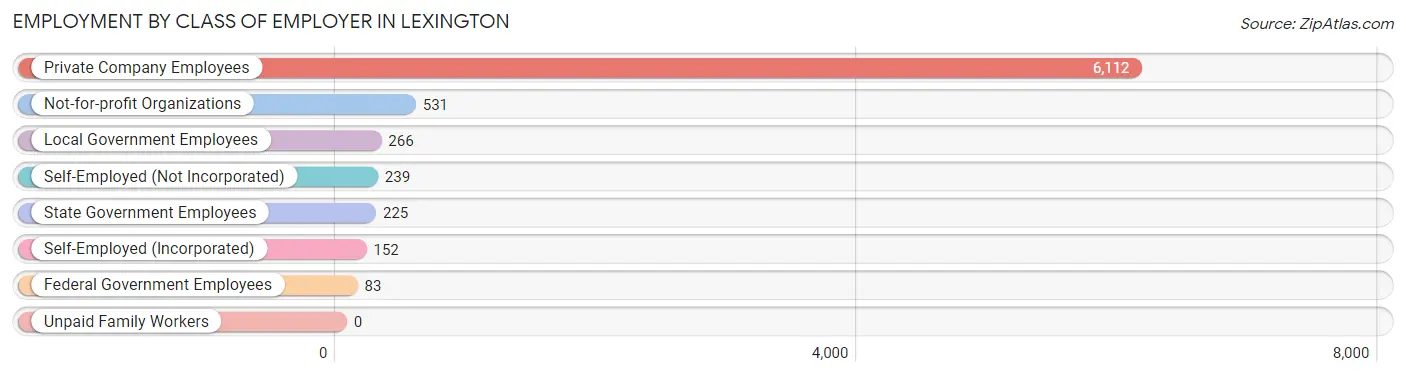
| Employer Class | # Employees | % Employees |
| Private Company Employees | 6,112 | 80.3% |
| Self-Employed (Incorporated) | 152 | 2.0% |
| Self-Employed (Not Incorporated) | 239 | 3.1% |
| Not-for-profit Organizations | 531 | 7.0% |
| Local Government Employees | 266 | 3.5% |
| State Government Employees | 225 | 3.0% |
| Federal Government Employees | 83 | 1.1% |
| Unpaid Family Workers | 0 | 0.0% |
| Total | 7,608 | 100.0% |
Employment Status by Age in Lexington
According to the labor force statistics for Lexington, out of the total population over 16 years of age (15,619), 54.9% or 8,575 individuals are in the labor force, with 6.6% or 566 of them unemployed. The age group with the highest labor force participation rate is 30 to 34 years, with 78.9% or 930 individuals in the labor force. Within the labor force, the 35 to 44 years age range has the highest percentage of unemployed individuals, with 18.3% or 314 of them being unemployed.
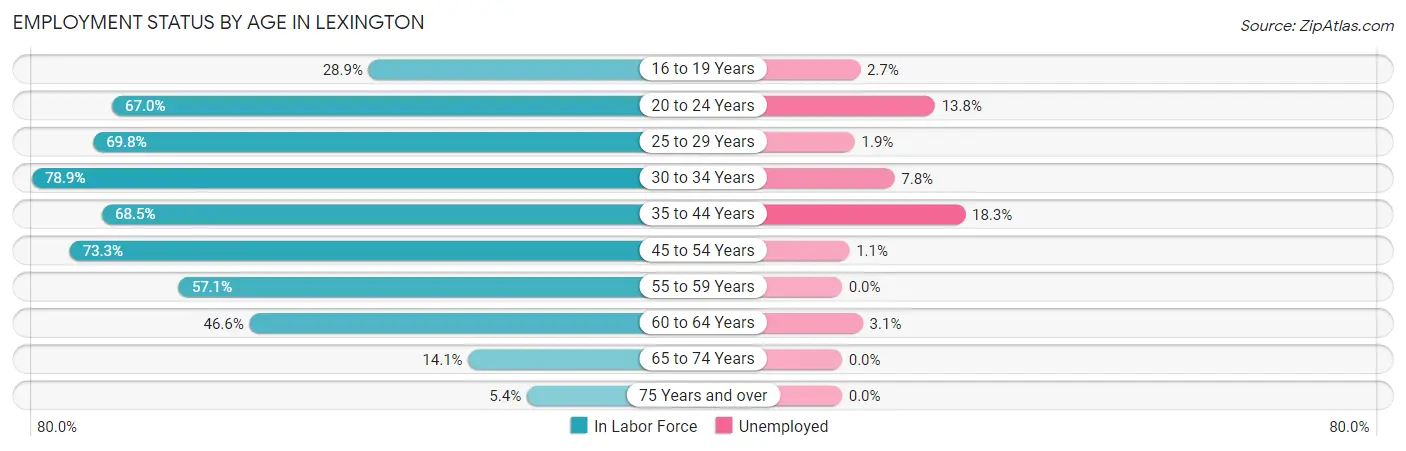
| Age Bracket | In Labor Force | Unemployed |
| 16 to 19 Years | 182 (28.9%) | 5 (2.7%) |
| 20 to 24 Years | 776 (67.0%) | 107 (13.8%) |
| 25 to 29 Years | 1,399 (69.8%) | 27 (1.9%) |
| 30 to 34 Years | 930 (78.9%) | 73 (7.8%) |
| 35 to 44 Years | 1,714 (68.5%) | 314 (18.3%) |
| 45 to 54 Years | 1,756 (73.3%) | 19 (1.1%) |
| 55 to 59 Years | 882 (57.1%) | 0 (0.0%) |
| 60 to 64 Years | 638 (46.6%) | 20 (3.1%) |
| 65 to 74 Years | 235 (14.1%) | 0 (0.0%) |
| 75 Years and over | 63 (5.4%) | 0 (0.0%) |
| Total | 8,575 (54.9%) | 566 (6.6%) |
Employment Status by Educational Attainment in Lexington
According to labor force statistics for Lexington, 66.6% of individuals (7,323) out of the total population between 25 and 64 years of age (10,996) are in the labor force, with 6.2% or 454 of them being unemployed. The group with the highest labor force participation rate are those with the educational attainment of bachelor's degree or higher, with 89.9% or 1,283 individuals in the labor force. Within the labor force, individuals with less than high school education have the highest percentage of unemployment, with 12.3% or 145 of them being unemployed.
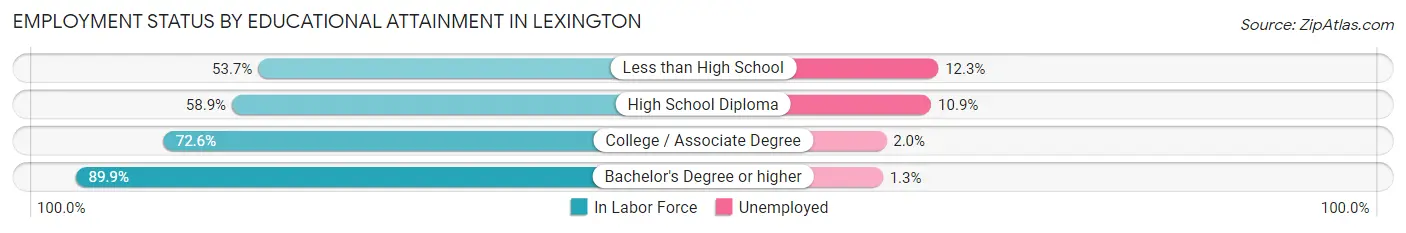
| Educational Attainment | In Labor Force | Unemployed |
| Less than High School | 1,181 (53.7%) | 271 (12.3%) |
| High School Diploma | 2,113 (58.9%) | 391 (10.9%) |
| College / Associate Degree | 2,745 (72.6%) | 76 (2.0%) |
| Bachelor's Degree or higher | 1,283 (89.9%) | 19 (1.3%) |
| Total | 7,323 (66.6%) | 682 (6.2%) |
Employment Occupations by Sex in Lexington
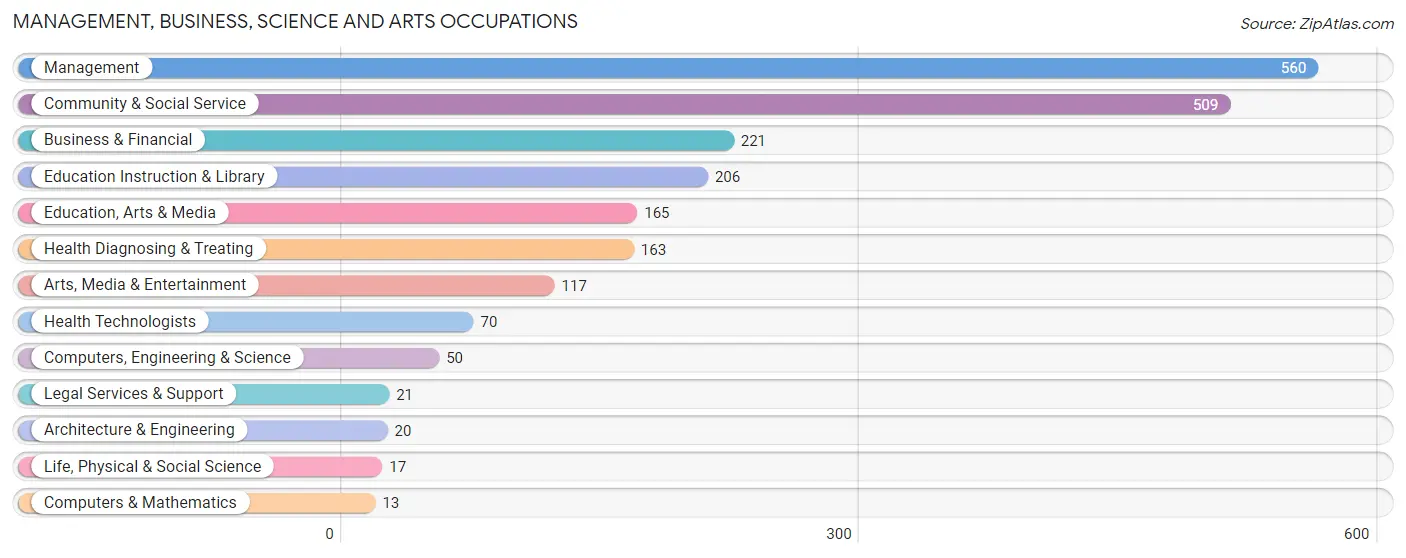
Management, Business, Science and Arts Occupations
The most common Management, Business, Science and Arts occupations in Lexington are Management (560 | 7.0%), Community & Social Service (509 | 6.4%), Business & Financial (221 | 2.8%), Education Instruction & Library (206 | 2.6%), and Education, Arts & Media (165 | 2.1%).
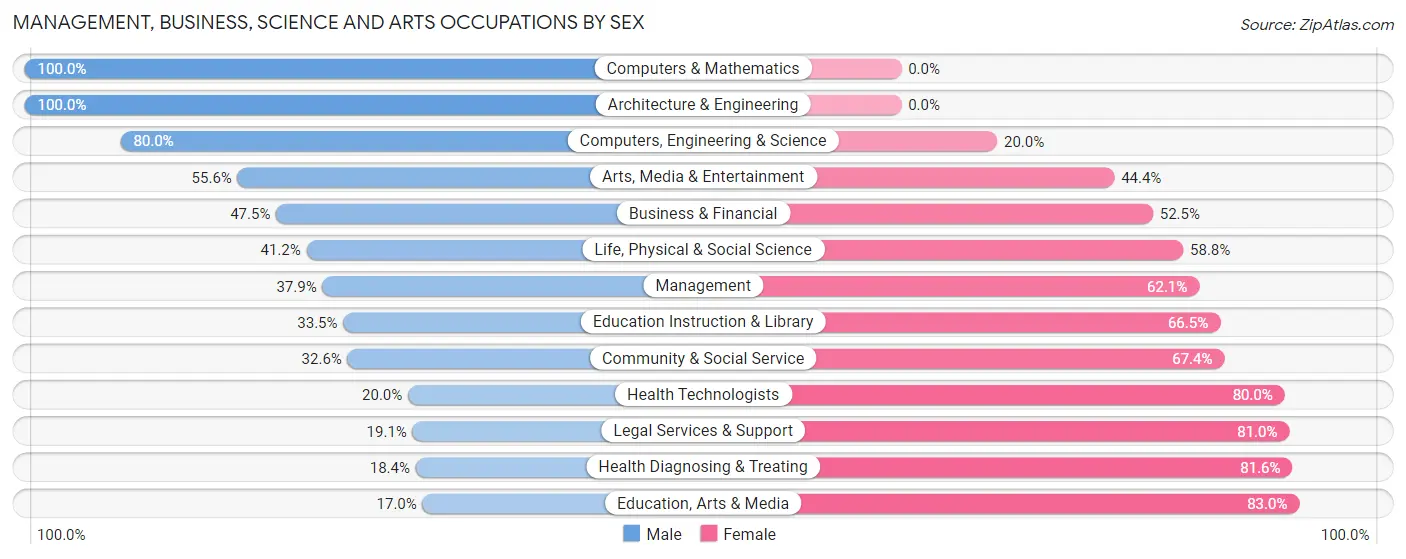
Management, Business, Science and Arts Occupations by Sex
Within the Management, Business, Science and Arts occupations in Lexington, the most male-oriented occupations are Computers & Mathematics (100.0%), Architecture & Engineering (100.0%), and Computers, Engineering & Science (80.0%), while the most female-oriented occupations are Education, Arts & Media (83.0%), Health Diagnosing & Treating (81.6%), and Legal Services & Support (80.9%).
| Occupation | Male | Female |
| Management | 212 (37.9%) | 348 (62.1%) |
| Business & Financial | 105 (47.5%) | 116 (52.5%) |
| Computers, Engineering & Science | 40 (80.0%) | 10 (20.0%) |
| Computers & Mathematics | 13 (100.0%) | 0 (0.0%) |
| Architecture & Engineering | 20 (100.0%) | 0 (0.0%) |
| Life, Physical & Social Science | 7 (41.2%) | 10 (58.8%) |
| Community & Social Service | 166 (32.6%) | 343 (67.4%) |
| Education, Arts & Media | 28 (17.0%) | 137 (83.0%) |
| Legal Services & Support | 4 (19.1%) | 17 (80.9%) |
| Education Instruction & Library | 69 (33.5%) | 137 (66.5%) |
| Arts, Media & Entertainment | 65 (55.6%) | 52 (44.4%) |
| Health Diagnosing & Treating | 30 (18.4%) | 133 (81.6%) |
| Health Technologists | 14 (20.0%) | 56 (80.0%) |
| Total (Category) | 553 (36.8%) | 950 (63.2%) |
| Total (Overall) | 4,248 (53.4%) | 3,699 (46.6%) |
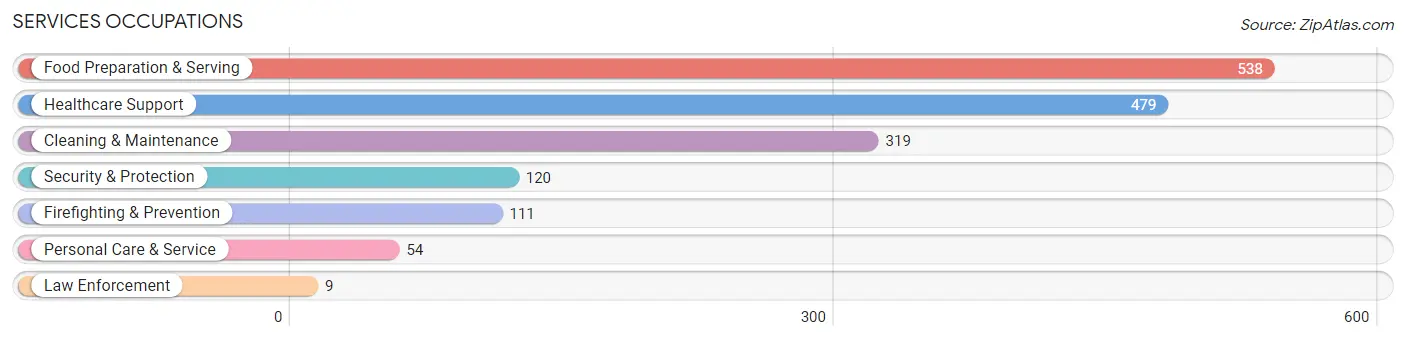
Services Occupations
The most common Services occupations in Lexington are Food Preparation & Serving (538 | 6.8%), Healthcare Support (479 | 6.0%), Cleaning & Maintenance (319 | 4.0%), Security & Protection (120 | 1.5%), and Firefighting & Prevention (111 | 1.4%).
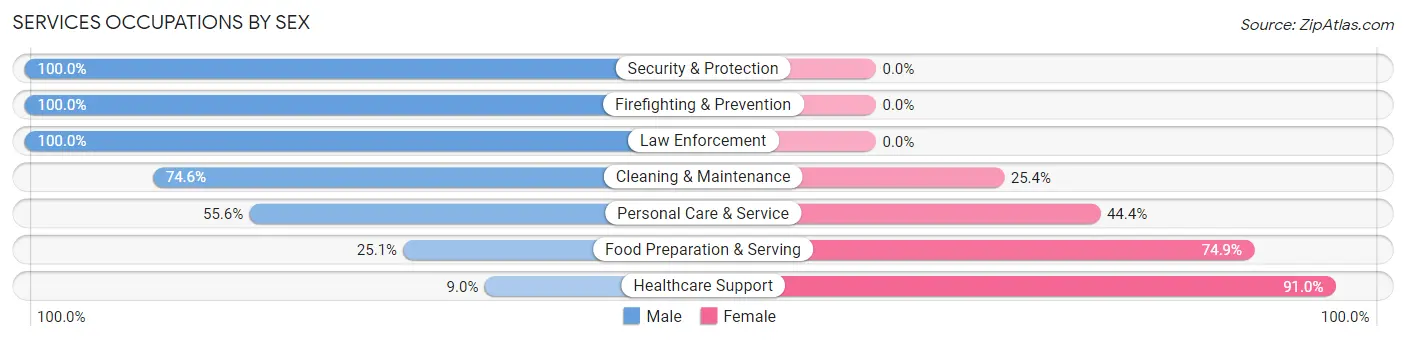
Services Occupations by Sex
Within the Services occupations in Lexington, the most male-oriented occupations are Security & Protection (100.0%), Firefighting & Prevention (100.0%), and Law Enforcement (100.0%), while the most female-oriented occupations are Healthcare Support (91.0%), Food Preparation & Serving (74.9%), and Personal Care & Service (44.4%).
| Occupation | Male | Female |
| Healthcare Support | 43 (9.0%) | 436 (91.0%) |
| Security & Protection | 120 (100.0%) | 0 (0.0%) |
| Firefighting & Prevention | 111 (100.0%) | 0 (0.0%) |
| Law Enforcement | 9 (100.0%) | 0 (0.0%) |
| Food Preparation & Serving | 135 (25.1%) | 403 (74.9%) |
| Cleaning & Maintenance | 238 (74.6%) | 81 (25.4%) |
| Personal Care & Service | 30 (55.6%) | 24 (44.4%) |
| Total (Category) | 566 (37.5%) | 944 (62.5%) |
| Total (Overall) | 4,248 (53.4%) | 3,699 (46.6%) |
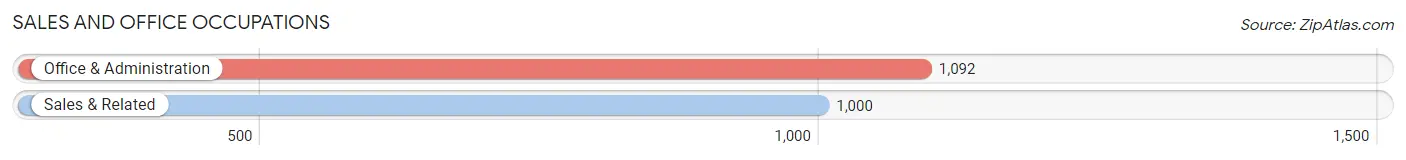
Sales and Office Occupations
The most common Sales and Office occupations in Lexington are Office & Administration (1,092 | 13.7%), and Sales & Related (1,000 | 12.6%).
Sales and Office Occupations by Sex
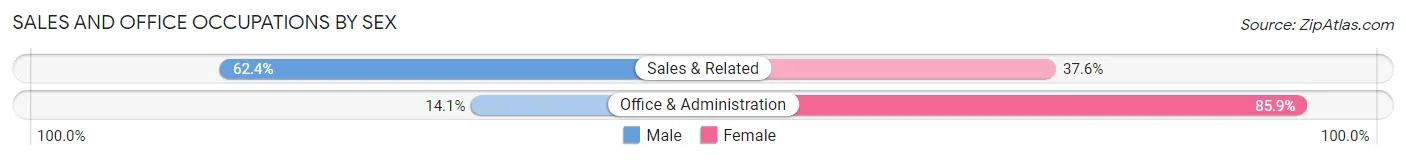
| Occupation | Male | Female |
| Sales & Related | 624 (62.4%) | 376 (37.6%) |
| Office & Administration | 154 (14.1%) | 938 (85.9%) |
| Total (Category) | 778 (37.2%) | 1,314 (62.8%) |
| Total (Overall) | 4,248 (53.4%) | 3,699 (46.6%) |
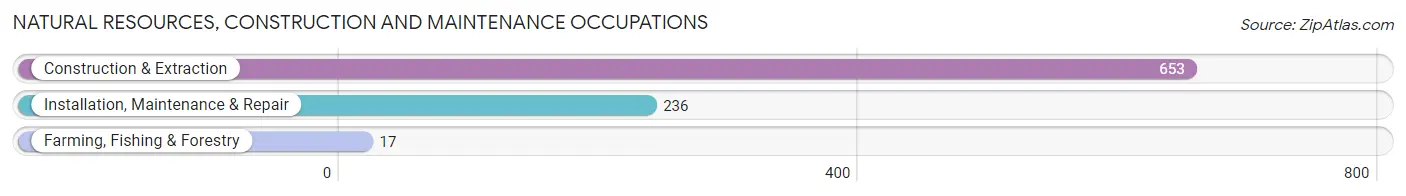
Natural Resources, Construction and Maintenance Occupations
The most common Natural Resources, Construction and Maintenance occupations in Lexington are Construction & Extraction (653 | 8.2%), Installation, Maintenance & Repair (236 | 3.0%), and Farming, Fishing & Forestry (17 | 0.2%).
Natural Resources, Construction and Maintenance Occupations by Sex
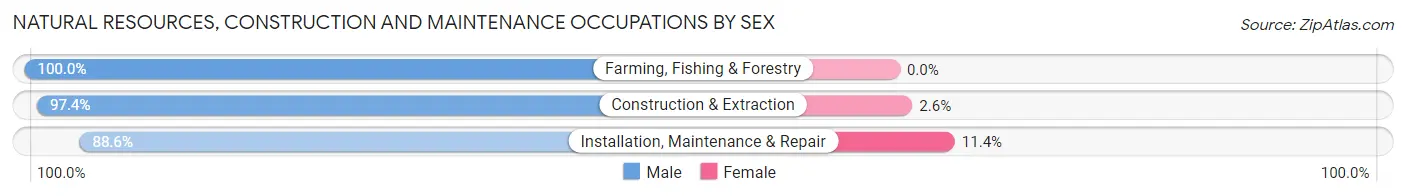
| Occupation | Male | Female |
| Farming, Fishing & Forestry | 17 (100.0%) | 0 (0.0%) |
| Construction & Extraction | 636 (97.4%) | 17 (2.6%) |
| Installation, Maintenance & Repair | 209 (88.6%) | 27 (11.4%) |
| Total (Category) | 862 (95.1%) | 44 (4.9%) |
| Total (Overall) | 4,248 (53.4%) | 3,699 (46.6%) |
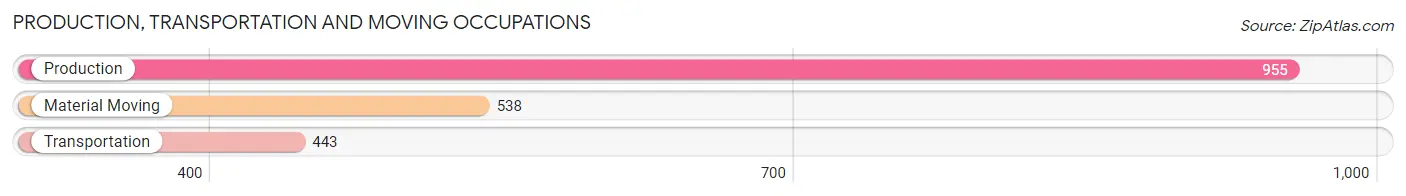
Production, Transportation and Moving Occupations
The most common Production, Transportation and Moving occupations in Lexington are Production (955 | 12.0%), Material Moving (538 | 6.8%), and Transportation (443 | 5.6%).
Production, Transportation and Moving Occupations by Sex
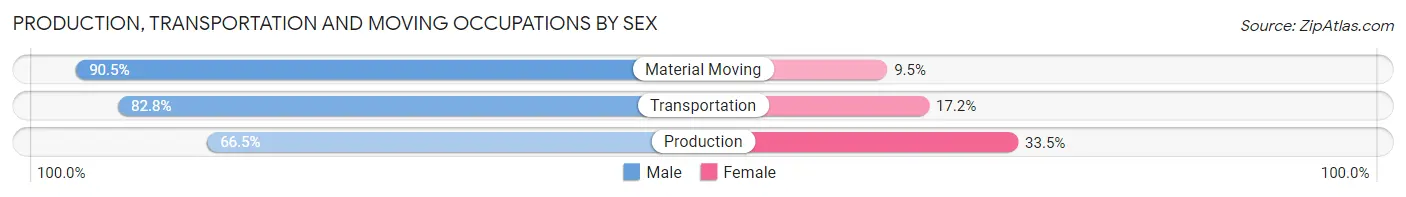
| Occupation | Male | Female |
| Production | 635 (66.5%) | 320 (33.5%) |
| Transportation | 367 (82.8%) | 76 (17.2%) |
| Material Moving | 487 (90.5%) | 51 (9.5%) |
| Total (Category) | 1,489 (76.9%) | 447 (23.1%) |
| Total (Overall) | 4,248 (53.4%) | 3,699 (46.6%) |
Employment Industries by Sex in Lexington
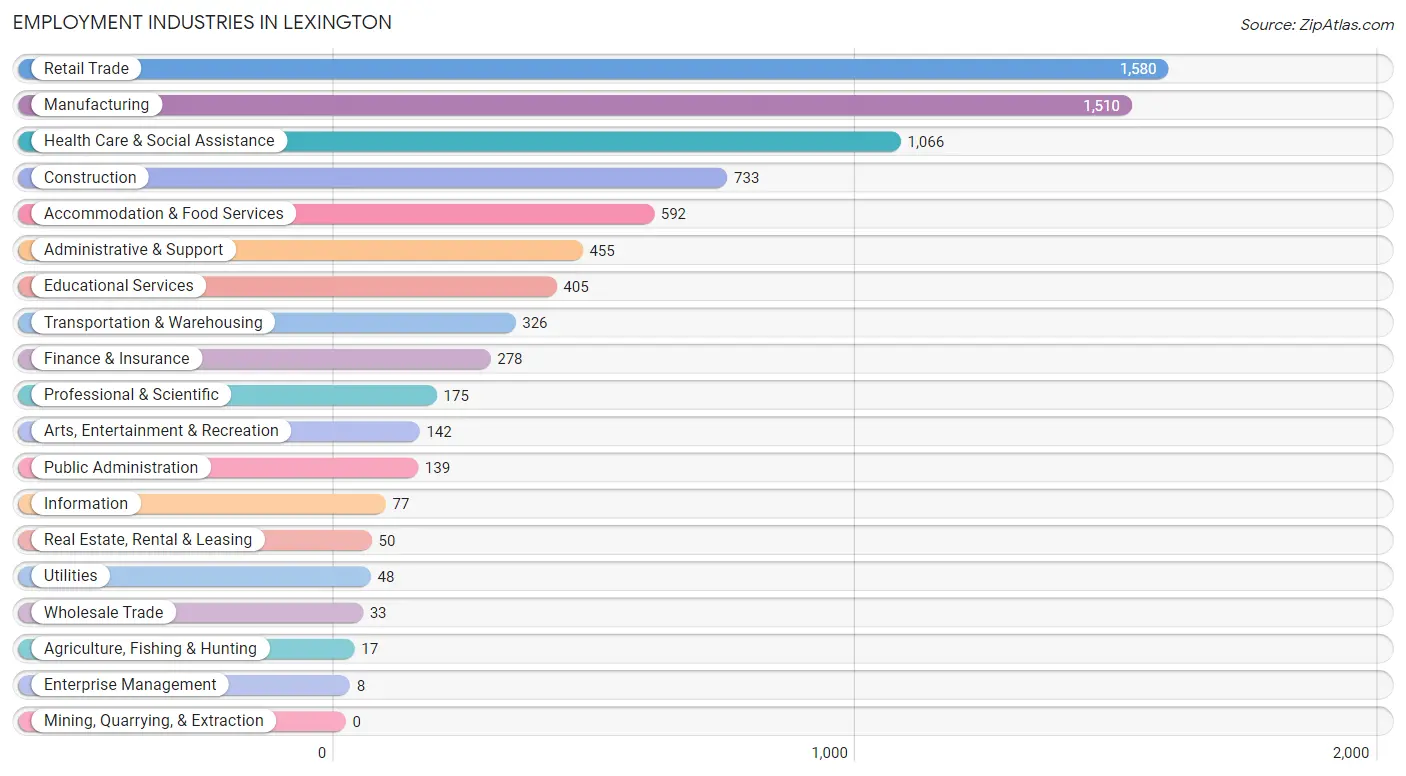
Employment Industries in Lexington
The major employment industries in Lexington include Retail Trade (1,580 | 19.9%), Manufacturing (1,510 | 19.0%), Health Care & Social Assistance (1,066 | 13.4%), Construction (733 | 9.2%), and Accommodation & Food Services (592 | 7.4%).
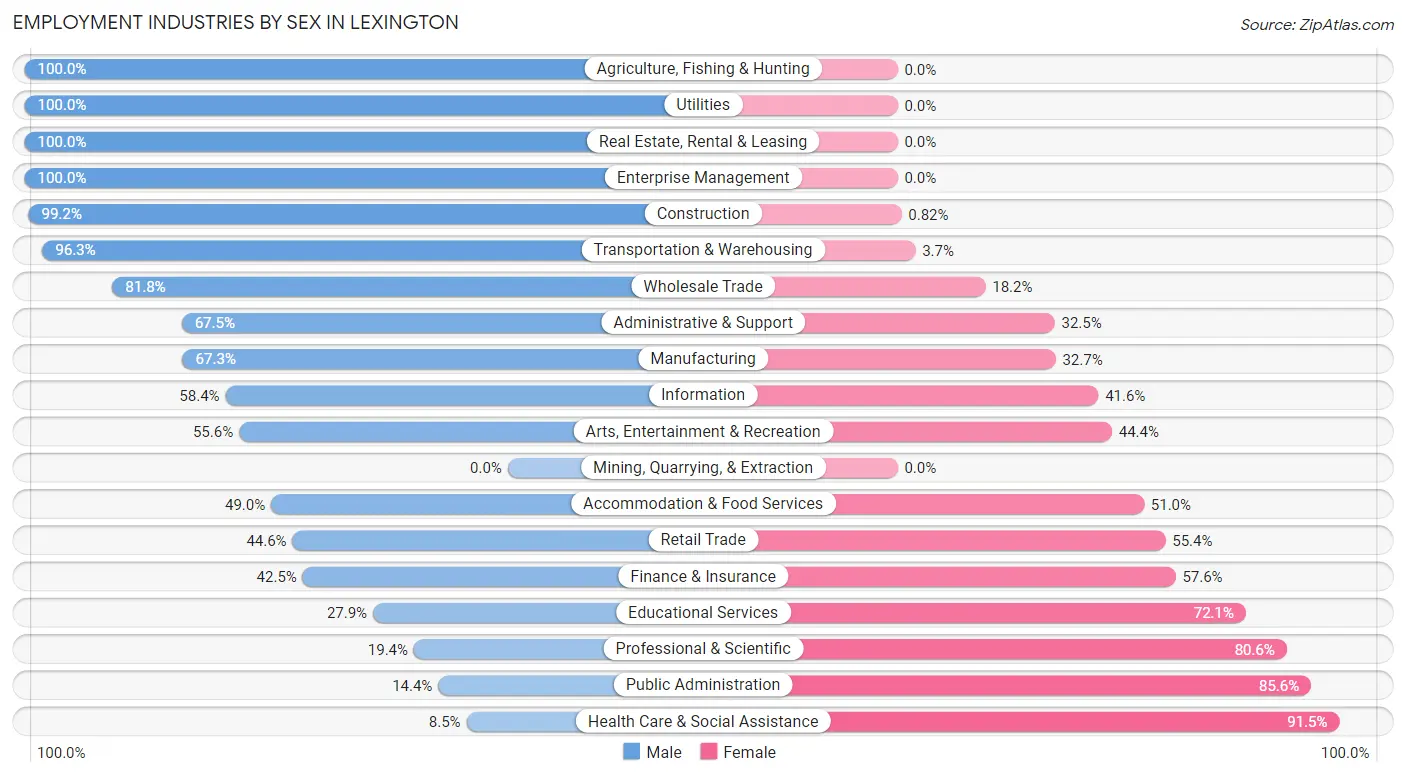
Employment Industries by Sex in Lexington
The Lexington industries that see more men than women are Agriculture, Fishing & Hunting (100.0%), Utilities (100.0%), and Real Estate, Rental & Leasing (100.0%), whereas the industries that tend to have a higher number of women are Health Care & Social Assistance (91.5%), Public Administration (85.6%), and Professional & Scientific (80.6%).
| Industry | Male | Female |
| Agriculture, Fishing & Hunting | 17 (100.0%) | 0 (0.0%) |
| Mining, Quarrying, & Extraction | 0 (0.0%) | 0 (0.0%) |
| Construction | 727 (99.2%) | 6 (0.8%) |
| Manufacturing | 1,016 (67.3%) | 494 (32.7%) |
| Wholesale Trade | 27 (81.8%) | 6 (18.2%) |
| Retail Trade | 704 (44.6%) | 876 (55.4%) |
| Transportation & Warehousing | 314 (96.3%) | 12 (3.7%) |
| Utilities | 48 (100.0%) | 0 (0.0%) |
| Information | 45 (58.4%) | 32 (41.6%) |
| Finance & Insurance | 118 (42.4%) | 160 (57.6%) |
| Real Estate, Rental & Leasing | 50 (100.0%) | 0 (0.0%) |
| Professional & Scientific | 34 (19.4%) | 141 (80.6%) |
| Enterprise Management | 8 (100.0%) | 0 (0.0%) |
| Administrative & Support | 307 (67.5%) | 148 (32.5%) |
| Educational Services | 113 (27.9%) | 292 (72.1%) |
| Health Care & Social Assistance | 91 (8.5%) | 975 (91.5%) |
| Arts, Entertainment & Recreation | 79 (55.6%) | 63 (44.4%) |
| Accommodation & Food Services | 290 (49.0%) | 302 (51.0%) |
| Public Administration | 20 (14.4%) | 119 (85.6%) |
| Total | 4,248 (53.4%) | 3,699 (46.6%) |
Education in Lexington
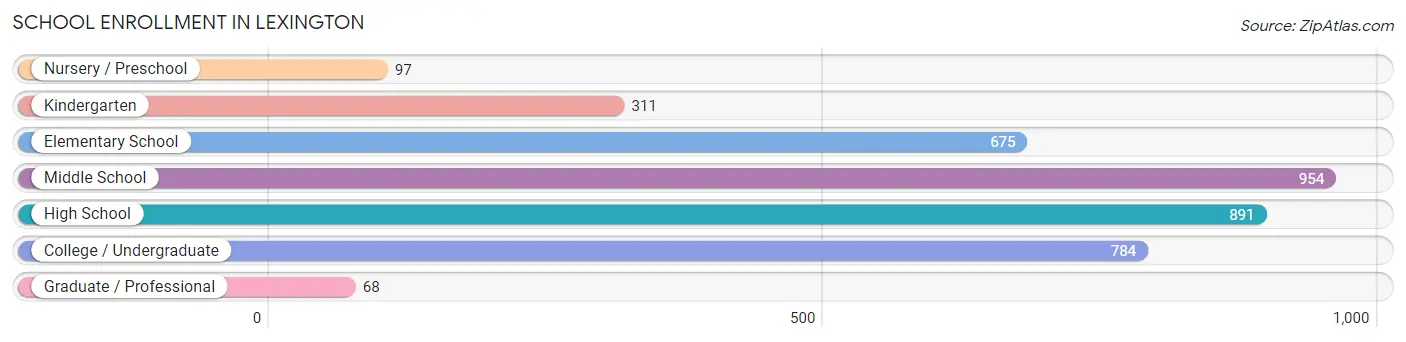
School Enrollment in Lexington
The most common levels of schooling among the 3,780 students in Lexington are middle school (954 | 25.2%), high school (891 | 23.6%), and college / undergraduate (784 | 20.7%).
| School Level | # Students | % Students |
| Nursery / Preschool | 97 | 2.6% |
| Kindergarten | 311 | 8.2% |
| Elementary School | 675 | 17.9% |
| Middle School | 954 | 25.2% |
| High School | 891 | 23.6% |
| College / Undergraduate | 784 | 20.7% |
| Graduate / Professional | 68 | 1.8% |
| Total | 3,780 | 100.0% |
School Enrollment by Age by Funding Source in Lexington
Out of a total of 3,780 students who are enrolled in schools in Lexington, 510 (13.5%) attend a private institution, while the remaining 3,270 (86.5%) are enrolled in public schools. The age group of 3 to 4 year olds has the highest likelihood of being enrolled in private schools, with 41 (49.4% in the age bracket) enrolled. Conversely, the age group of 18 to 19 year olds has the lowest likelihood of being enrolled in a private school, with 138 (100.0% in the age bracket) attending a public institution.
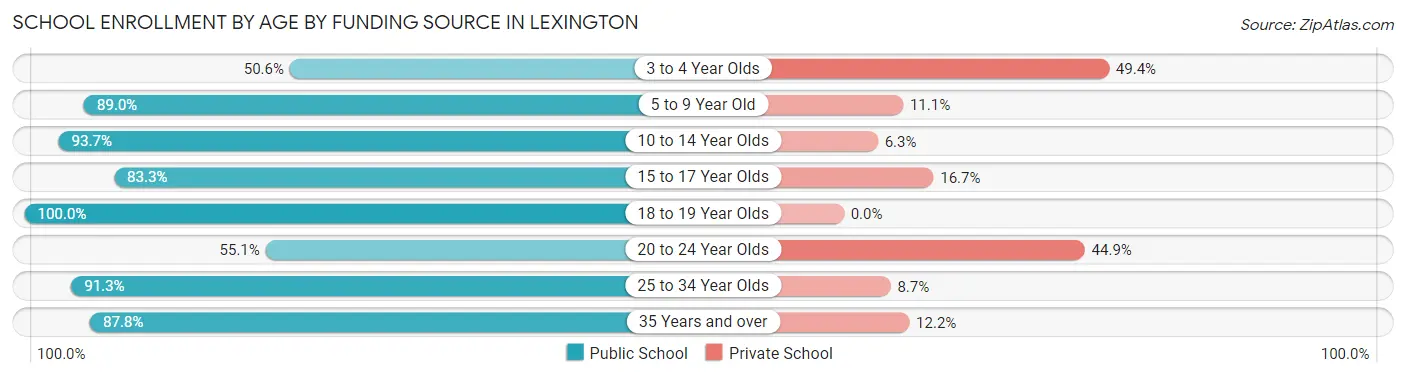
| Age Bracket | Public School | Private School |
| 3 to 4 Year Olds | 42 (50.6%) | 41 (49.4%) |
| 5 to 9 Year Old | 845 (88.9%) | 105 (11.1%) |
| 10 to 14 Year Olds | 1,048 (93.7%) | 71 (6.3%) |
| 15 to 17 Year Olds | 599 (83.3%) | 120 (16.7%) |
| 18 to 19 Year Olds | 138 (100.0%) | 0 (0.0%) |
| 20 to 24 Year Olds | 151 (55.1%) | 123 (44.9%) |
| 25 to 34 Year Olds | 304 (91.3%) | 29 (8.7%) |
| 35 Years and over | 144 (87.8%) | 20 (12.2%) |
| Total | 3,270 (86.5%) | 510 (13.5%) |
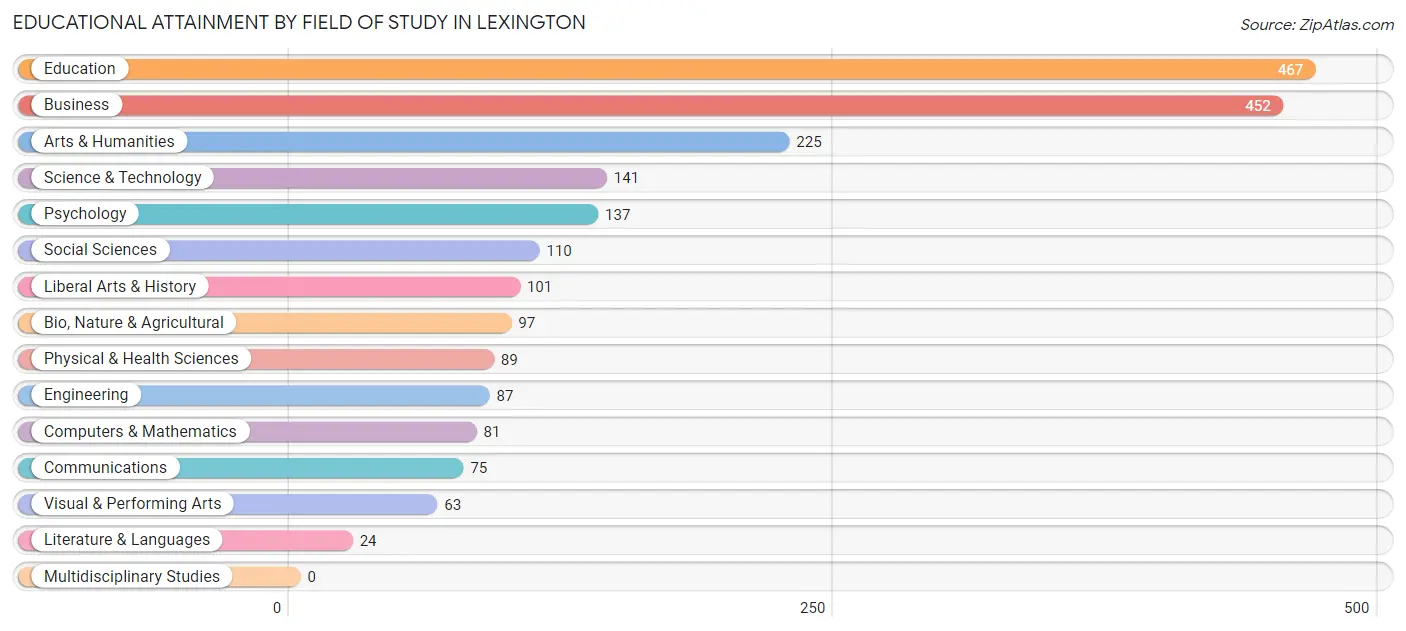
Educational Attainment by Field of Study in Lexington
Education (467 | 21.7%), business (452 | 21.0%), arts & humanities (225 | 10.5%), science & technology (141 | 6.6%), and psychology (137 | 6.4%) are the most common fields of study among 2,149 individuals in Lexington who have obtained a bachelor's degree or higher.
| Field of Study | # Graduates | % Graduates |
| Computers & Mathematics | 81 | 3.8% |
| Bio, Nature & Agricultural | 97 | 4.5% |
| Physical & Health Sciences | 89 | 4.1% |
| Psychology | 137 | 6.4% |
| Social Sciences | 110 | 5.1% |
| Engineering | 87 | 4.1% |
| Multidisciplinary Studies | 0 | 0.0% |
| Science & Technology | 141 | 6.6% |
| Business | 452 | 21.0% |
| Education | 467 | 21.7% |
| Literature & Languages | 24 | 1.1% |
| Liberal Arts & History | 101 | 4.7% |
| Visual & Performing Arts | 63 | 2.9% |
| Communications | 75 | 3.5% |
| Arts & Humanities | 225 | 10.5% |
| Total | 2,149 | 100.0% |
Transportation & Commute in Lexington
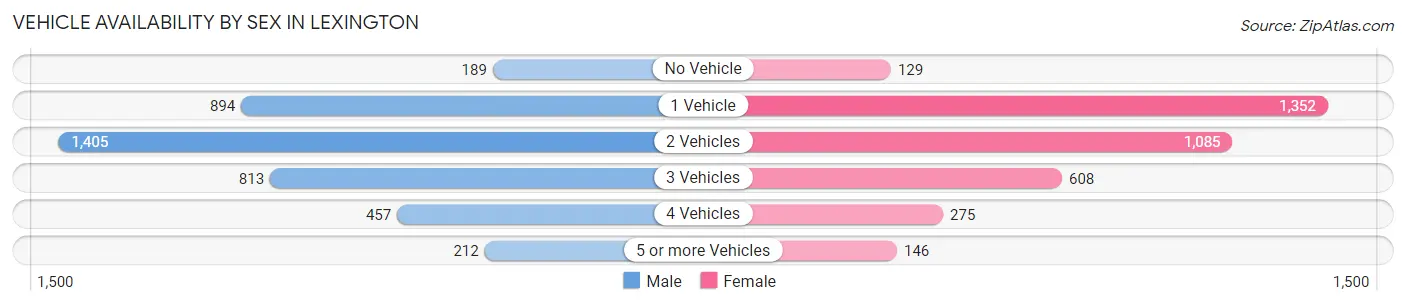
Vehicle Availability by Sex in Lexington
The most prevalent vehicle ownership categories in Lexington are males with 2 vehicles (1,405, accounting for 35.4%) and females with 2 vehicles (1,085, making up 39.1%).
| Vehicles Available | Male | Female |
| No Vehicle | 189 (4.8%) | 129 (3.6%) |
| 1 Vehicle | 894 (22.5%) | 1,352 (37.6%) |
| 2 Vehicles | 1,405 (35.4%) | 1,085 (30.2%) |
| 3 Vehicles | 813 (20.5%) | 608 (16.9%) |
| 4 Vehicles | 457 (11.5%) | 275 (7.6%) |
| 5 or more Vehicles | 212 (5.3%) | 146 (4.1%) |
| Total | 3,970 (100.0%) | 3,595 (100.0%) |
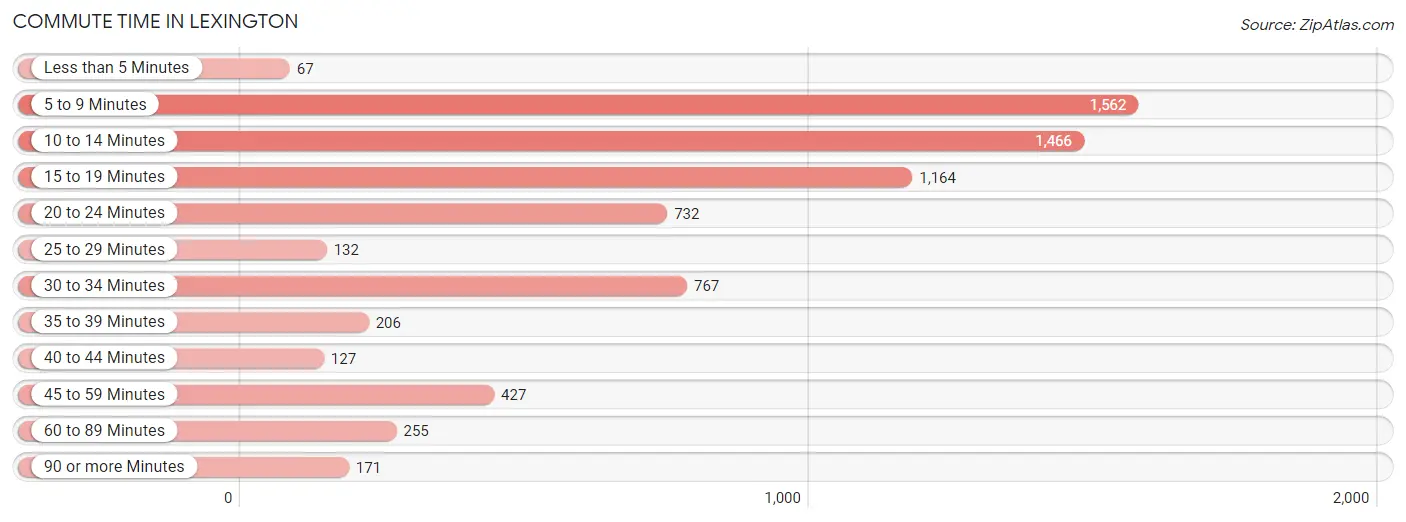
Commute Time in Lexington
The most frequently occuring commute durations in Lexington are 5 to 9 minutes (1,562 commuters, 22.1%), 10 to 14 minutes (1,466 commuters, 20.7%), and 15 to 19 minutes (1,164 commuters, 16.5%).
| Commute Time | # Commuters | % Commuters |
| Less than 5 Minutes | 67 | 0.9% |
| 5 to 9 Minutes | 1,562 | 22.1% |
| 10 to 14 Minutes | 1,466 | 20.7% |
| 15 to 19 Minutes | 1,164 | 16.5% |
| 20 to 24 Minutes | 732 | 10.3% |
| 25 to 29 Minutes | 132 | 1.9% |
| 30 to 34 Minutes | 767 | 10.8% |
| 35 to 39 Minutes | 206 | 2.9% |
| 40 to 44 Minutes | 127 | 1.8% |
| 45 to 59 Minutes | 427 | 6.0% |
| 60 to 89 Minutes | 255 | 3.6% |
| 90 or more Minutes | 171 | 2.4% |
Commute Time by Sex in Lexington
The most common commute times in Lexington are 5 to 9 minutes (820 commuters, 21.2%) for males and 5 to 9 minutes (742 commuters, 23.2%) for females.
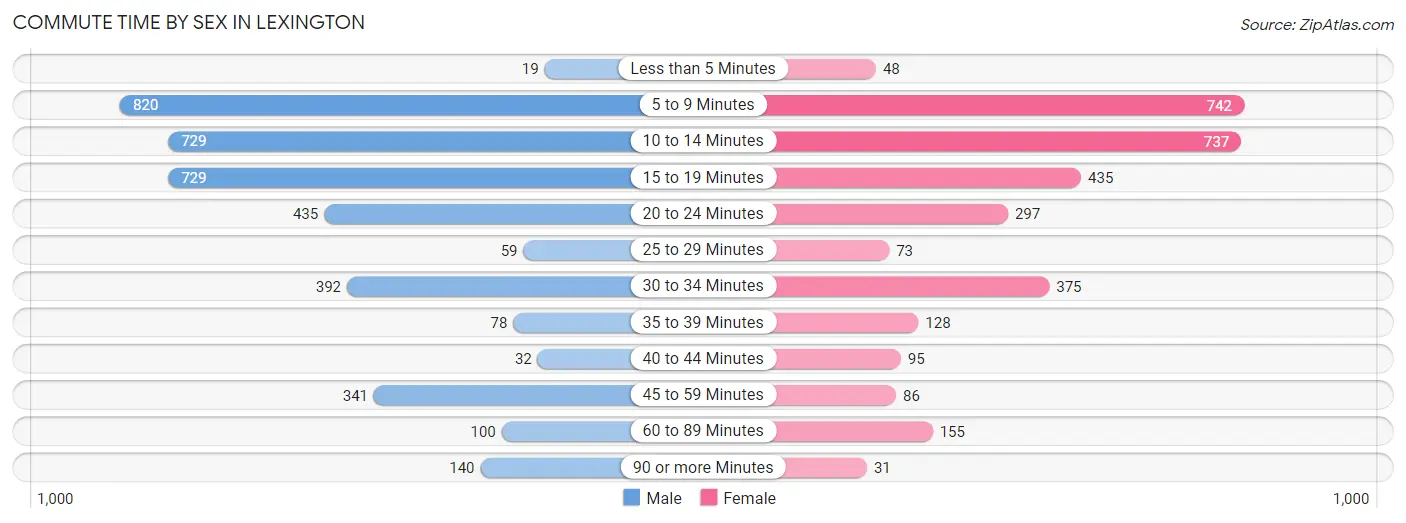
| Commute Time | Male | Female |
| Less than 5 Minutes | 19 (0.5%) | 48 (1.5%) |
| 5 to 9 Minutes | 820 (21.2%) | 742 (23.2%) |
| 10 to 14 Minutes | 729 (18.8%) | 737 (23.0%) |
| 15 to 19 Minutes | 729 (18.8%) | 435 (13.6%) |
| 20 to 24 Minutes | 435 (11.2%) | 297 (9.3%) |
| 25 to 29 Minutes | 59 (1.5%) | 73 (2.3%) |
| 30 to 34 Minutes | 392 (10.1%) | 375 (11.7%) |
| 35 to 39 Minutes | 78 (2.0%) | 128 (4.0%) |
| 40 to 44 Minutes | 32 (0.8%) | 95 (3.0%) |
| 45 to 59 Minutes | 341 (8.8%) | 86 (2.7%) |
| 60 to 89 Minutes | 100 (2.6%) | 155 (4.8%) |
| 90 or more Minutes | 140 (3.6%) | 31 (1.0%) |
Time of Departure to Work by Sex in Lexington
The most frequent times of departure to work in Lexington are 6:30 AM to 6:59 AM (554, 14.3%) for males and 7:00 AM to 7:29 AM (580, 18.1%) for females.
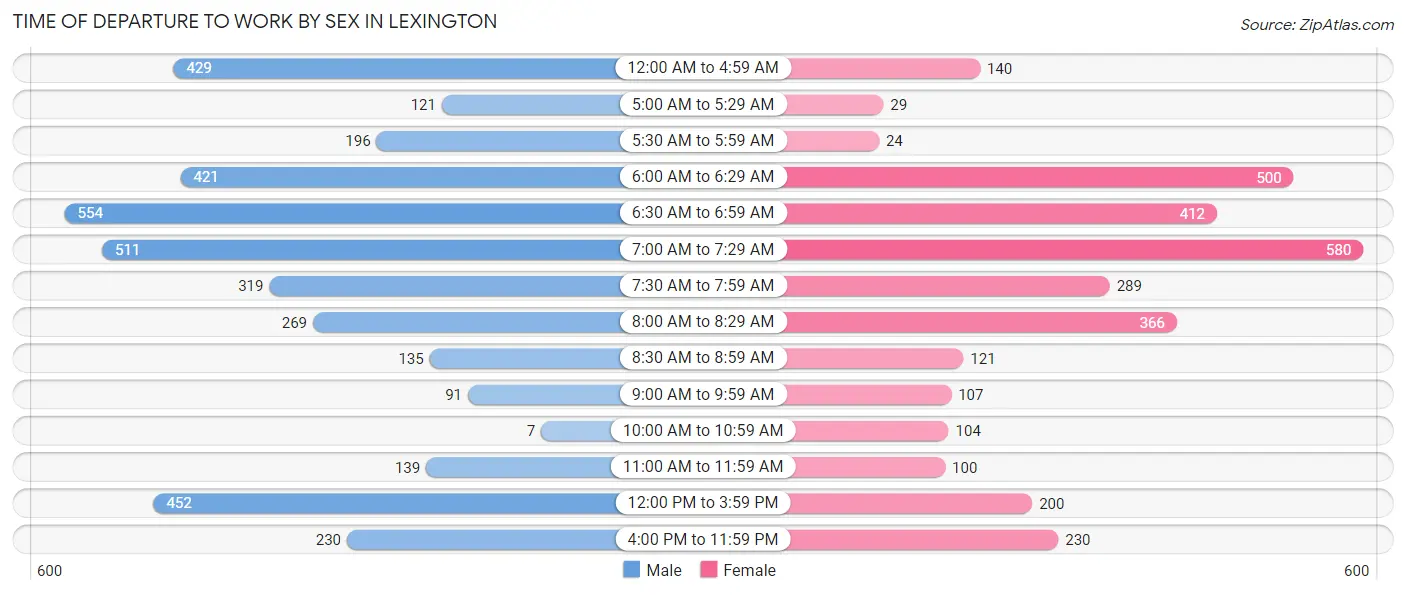
| Time of Departure | Male | Female |
| 12:00 AM to 4:59 AM | 429 (11.1%) | 140 (4.4%) |
| 5:00 AM to 5:29 AM | 121 (3.1%) | 29 (0.9%) |
| 5:30 AM to 5:59 AM | 196 (5.1%) | 24 (0.7%) |
| 6:00 AM to 6:29 AM | 421 (10.9%) | 500 (15.6%) |
| 6:30 AM to 6:59 AM | 554 (14.3%) | 412 (12.9%) |
| 7:00 AM to 7:29 AM | 511 (13.2%) | 580 (18.1%) |
| 7:30 AM to 7:59 AM | 319 (8.2%) | 289 (9.0%) |
| 8:00 AM to 8:29 AM | 269 (6.9%) | 366 (11.4%) |
| 8:30 AM to 8:59 AM | 135 (3.5%) | 121 (3.8%) |
| 9:00 AM to 9:59 AM | 91 (2.4%) | 107 (3.3%) |
| 10:00 AM to 10:59 AM | 7 (0.2%) | 104 (3.3%) |
| 11:00 AM to 11:59 AM | 139 (3.6%) | 100 (3.1%) |
| 12:00 PM to 3:59 PM | 452 (11.7%) | 200 (6.2%) |
| 4:00 PM to 11:59 PM | 230 (5.9%) | 230 (7.2%) |
| Total | 3,874 (100.0%) | 3,202 (100.0%) |
Housing Occupancy in Lexington
Occupancy by Ownership in Lexington
Of the total 7,751 dwellings in Lexington, owner-occupied units account for 3,082 (39.8%), while renter-occupied units make up 4,669 (60.2%).
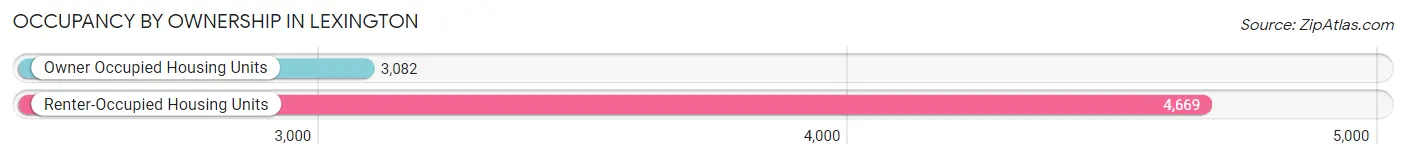
| Occupancy | # Housing Units | % Housing Units |
| Owner Occupied Housing Units | 3,082 | 39.8% |
| Renter-Occupied Housing Units | 4,669 | 60.2% |
| Total Occupied Housing Units | 7,751 | 100.0% |
Occupancy by Household Size in Lexington
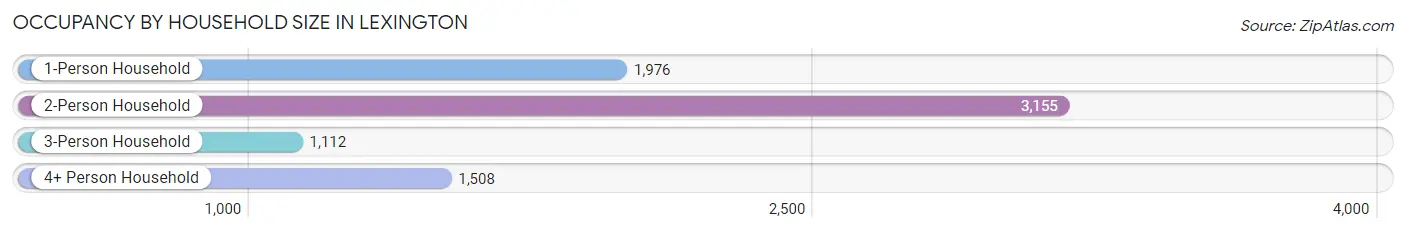
| Household Size | # Housing Units | % Housing Units |
| 1-Person Household | 1,976 | 25.5% |
| 2-Person Household | 3,155 | 40.7% |
| 3-Person Household | 1,112 | 14.3% |
| 4+ Person Household | 1,508 | 19.5% |
| Total Housing Units | 7,751 | 100.0% |
Occupancy by Ownership by Household Size in Lexington
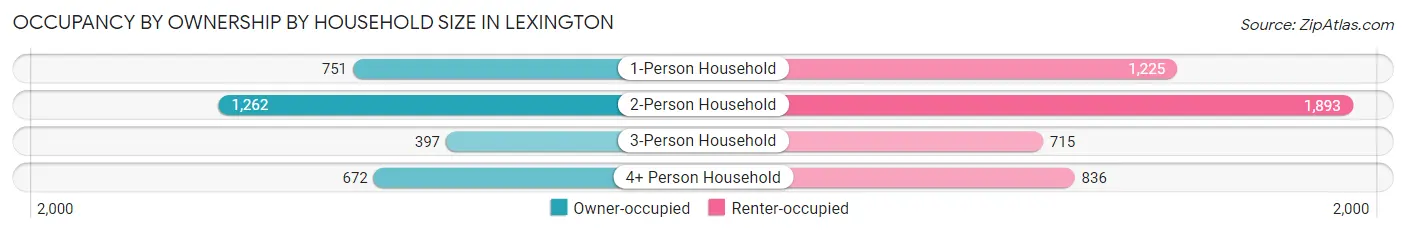
| Household Size | Owner-occupied | Renter-occupied |
| 1-Person Household | 751 (38.0%) | 1,225 (62.0%) |
| 2-Person Household | 1,262 (40.0%) | 1,893 (60.0%) |
| 3-Person Household | 397 (35.7%) | 715 (64.3%) |
| 4+ Person Household | 672 (44.6%) | 836 (55.4%) |
| Total Housing Units | 3,082 (39.8%) | 4,669 (60.2%) |
Occupancy by Educational Attainment in Lexington
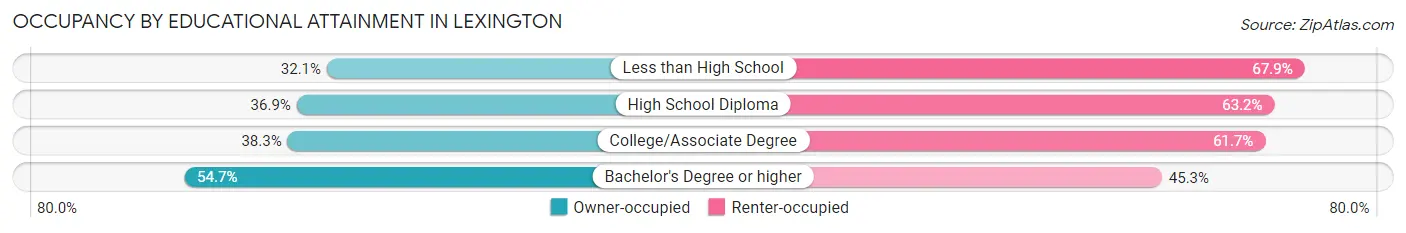
| Household Size | Owner-occupied | Renter-occupied |
| Less than High School | 420 (32.1%) | 890 (67.9%) |
| High School Diploma | 898 (36.8%) | 1,539 (63.1%) |
| College/Associate Degree | 995 (38.3%) | 1,603 (61.7%) |
| Bachelor's Degree or higher | 769 (54.7%) | 637 (45.3%) |
Occupancy by Age of Householder in Lexington
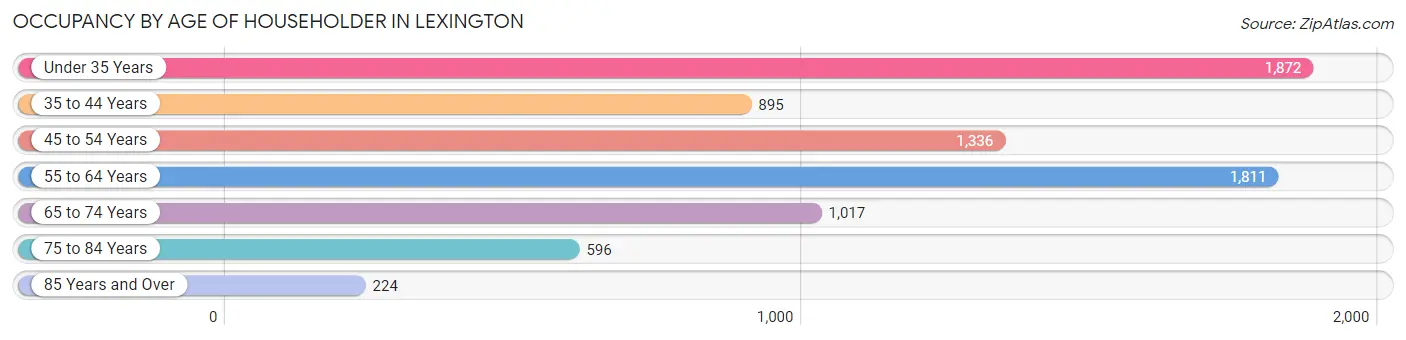
| Age Bracket | # Households | % Households |
| Under 35 Years | 1,872 | 24.1% |
| 35 to 44 Years | 895 | 11.6% |
| 45 to 54 Years | 1,336 | 17.2% |
| 55 to 64 Years | 1,811 | 23.4% |
| 65 to 74 Years | 1,017 | 13.1% |
| 75 to 84 Years | 596 | 7.7% |
| 85 Years and Over | 224 | 2.9% |
| Total | 7,751 | 100.0% |
Housing Finances in Lexington
Median Income by Occupancy in Lexington
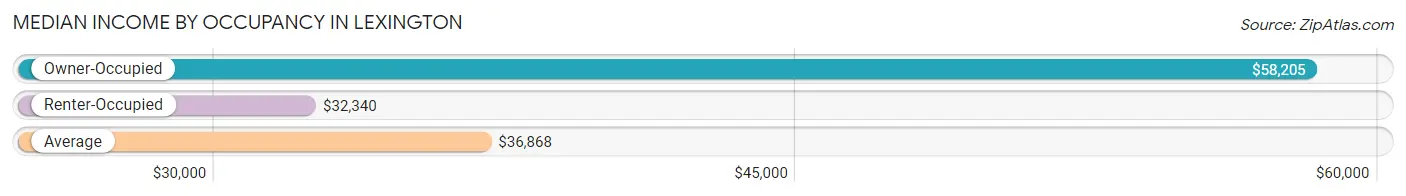
| Occupancy Type | # Households | Median Income |
| Owner-Occupied | 3,082 (39.8%) | $58,205 |
| Renter-Occupied | 4,669 (60.2%) | $32,340 |
| Average | 7,751 (100.0%) | $36,868 |
Occupancy by Householder Income Bracket in Lexington
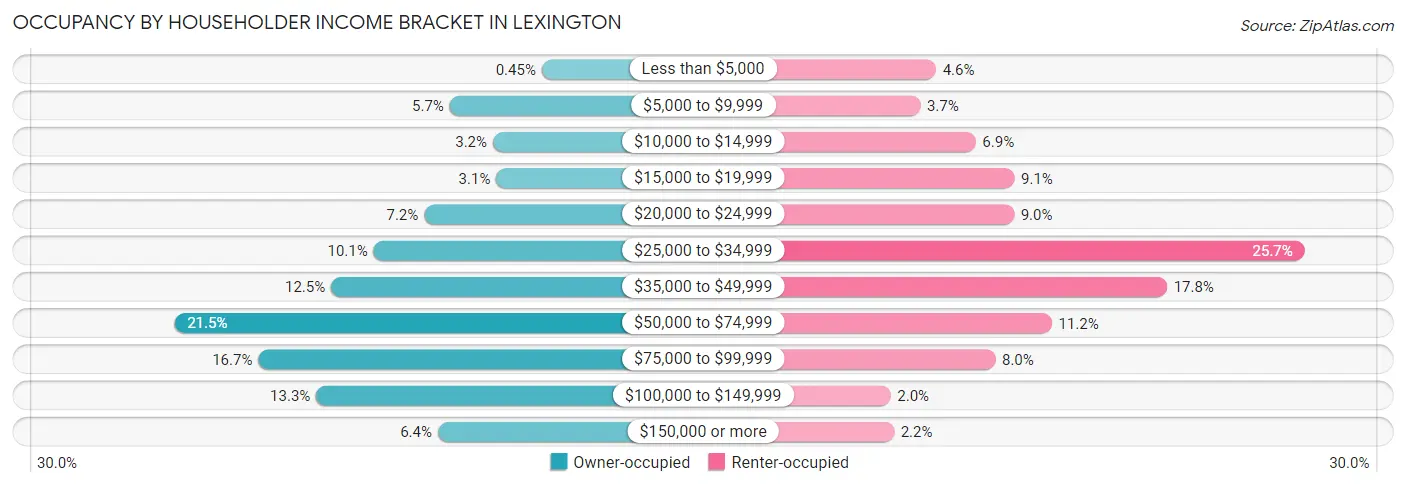
| Income Bracket | Owner-occupied | Renter-occupied |
| Less than $5,000 | 14 (0.4%) | 214 (4.6%) |
| $5,000 to $9,999 | 176 (5.7%) | 172 (3.7%) |
| $10,000 to $14,999 | 100 (3.2%) | 320 (6.9%) |
| $15,000 to $19,999 | 94 (3.0%) | 423 (9.1%) |
| $20,000 to $24,999 | 221 (7.2%) | 422 (9.0%) |
| $25,000 to $34,999 | 310 (10.1%) | 1,198 (25.7%) |
| $35,000 to $49,999 | 385 (12.5%) | 830 (17.8%) |
| $50,000 to $74,999 | 661 (21.4%) | 523 (11.2%) |
| $75,000 to $99,999 | 513 (16.7%) | 372 (8.0%) |
| $100,000 to $149,999 | 411 (13.3%) | 93 (2.0%) |
| $150,000 or more | 197 (6.4%) | 102 (2.2%) |
| Total | 3,082 (100.0%) | 4,669 (100.0%) |
Monthly Housing Cost Tiers in Lexington
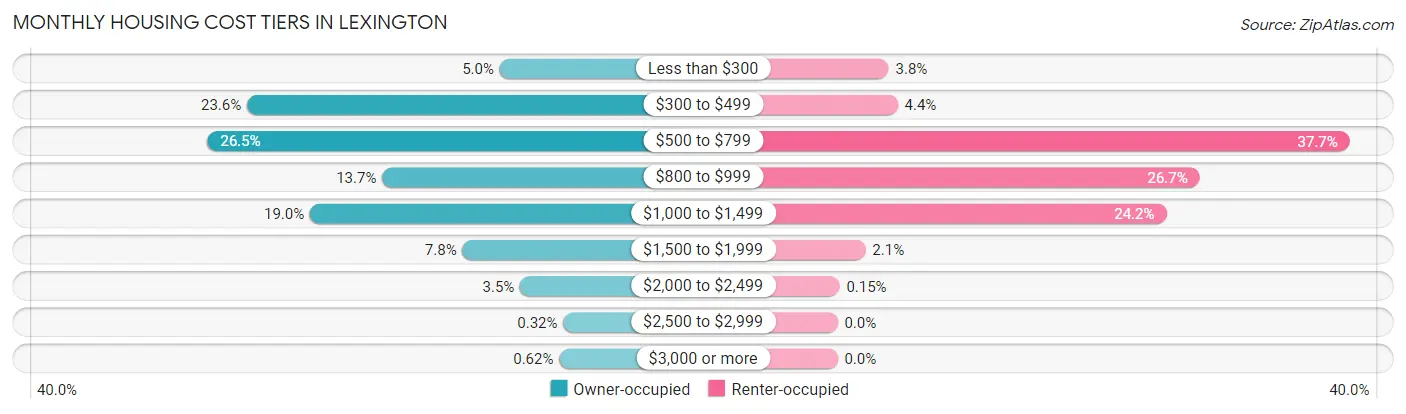
| Monthly Cost | Owner-occupied | Renter-occupied |
| Less than $300 | 154 (5.0%) | 176 (3.8%) |
| $300 to $499 | 728 (23.6%) | 207 (4.4%) |
| $500 to $799 | 818 (26.5%) | 1,761 (37.7%) |
| $800 to $999 | 421 (13.7%) | 1,245 (26.7%) |
| $1,000 to $1,499 | 585 (19.0%) | 1,131 (24.2%) |
| $1,500 to $1,999 | 239 (7.7%) | 96 (2.1%) |
| $2,000 to $2,499 | 108 (3.5%) | 7 (0.2%) |
| $2,500 to $2,999 | 10 (0.3%) | 0 (0.0%) |
| $3,000 or more | 19 (0.6%) | 0 (0.0%) |
| Total | 3,082 (100.0%) | 4,669 (100.0%) |
Physical Housing Characteristics in Lexington
Housing Structures in Lexington
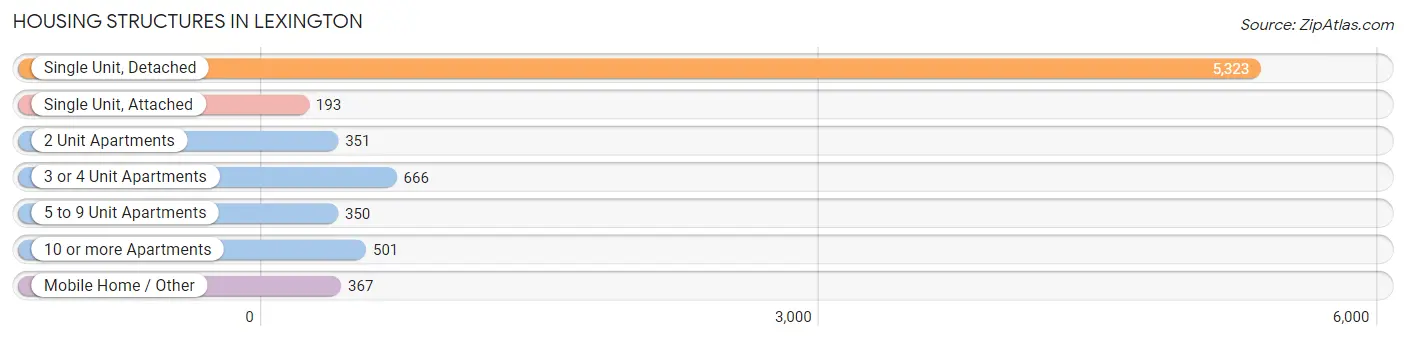
| Structure Type | # Housing Units | % Housing Units |
| Single Unit, Detached | 5,323 | 68.7% |
| Single Unit, Attached | 193 | 2.5% |
| 2 Unit Apartments | 351 | 4.5% |
| 3 or 4 Unit Apartments | 666 | 8.6% |
| 5 to 9 Unit Apartments | 350 | 4.5% |
| 10 or more Apartments | 501 | 6.5% |
| Mobile Home / Other | 367 | 4.7% |
| Total | 7,751 | 100.0% |
Housing Structures by Occupancy in Lexington
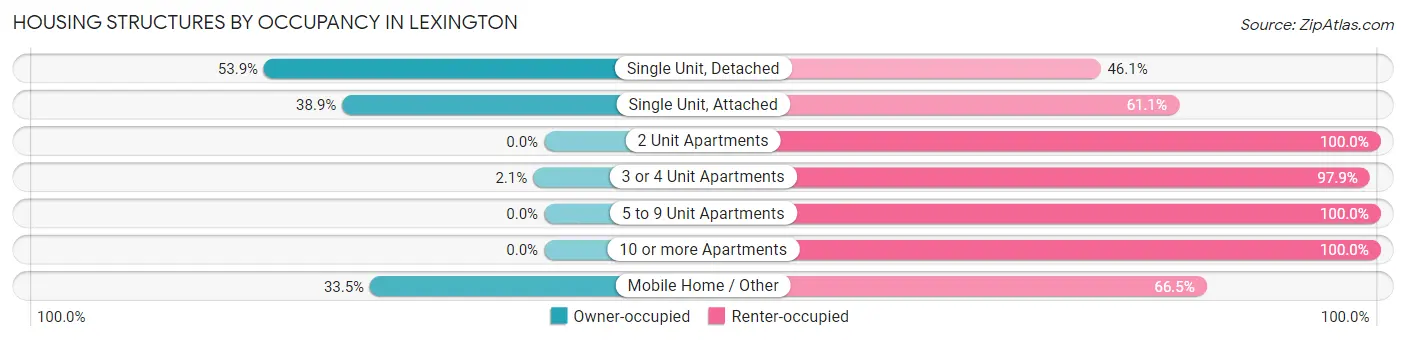
| Structure Type | Owner-occupied | Renter-occupied |
| Single Unit, Detached | 2,870 (53.9%) | 2,453 (46.1%) |
| Single Unit, Attached | 75 (38.9%) | 118 (61.1%) |
| 2 Unit Apartments | 0 (0.0%) | 351 (100.0%) |
| 3 or 4 Unit Apartments | 14 (2.1%) | 652 (97.9%) |
| 5 to 9 Unit Apartments | 0 (0.0%) | 350 (100.0%) |
| 10 or more Apartments | 0 (0.0%) | 501 (100.0%) |
| Mobile Home / Other | 123 (33.5%) | 244 (66.5%) |
| Total | 3,082 (39.8%) | 4,669 (60.2%) |
Housing Structures by Number of Rooms in Lexington
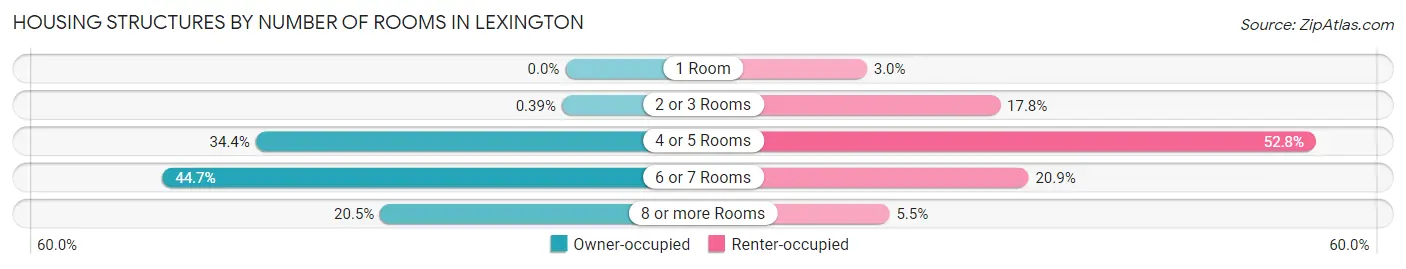
| Number of Rooms | Owner-occupied | Renter-occupied |
| 1 Room | 0 (0.0%) | 139 (3.0%) |
| 2 or 3 Rooms | 12 (0.4%) | 830 (17.8%) |
| 4 or 5 Rooms | 1,059 (34.4%) | 2,466 (52.8%) |
| 6 or 7 Rooms | 1,378 (44.7%) | 977 (20.9%) |
| 8 or more Rooms | 633 (20.5%) | 257 (5.5%) |
| Total | 3,082 (100.0%) | 4,669 (100.0%) |
Housing Structure by Heating Type in Lexington
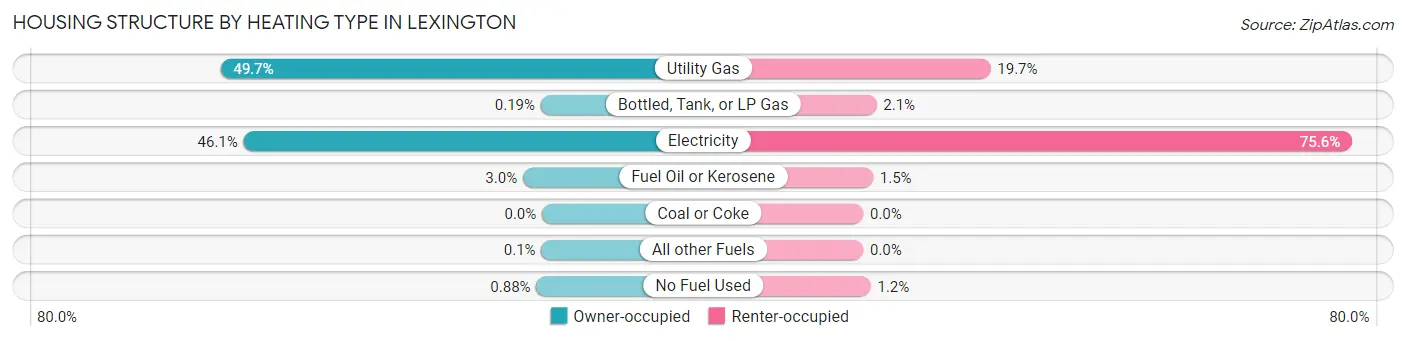
| Heating Type | Owner-occupied | Renter-occupied |
| Utility Gas | 1,533 (49.7%) | 919 (19.7%) |
| Bottled, Tank, or LP Gas | 6 (0.2%) | 96 (2.1%) |
| Electricity | 1,422 (46.1%) | 3,529 (75.6%) |
| Fuel Oil or Kerosene | 91 (2.9%) | 71 (1.5%) |
| Coal or Coke | 0 (0.0%) | 0 (0.0%) |
| All other Fuels | 3 (0.1%) | 0 (0.0%) |
| No Fuel Used | 27 (0.9%) | 54 (1.2%) |
| Total | 3,082 (100.0%) | 4,669 (100.0%) |
Household Vehicle Usage in Lexington
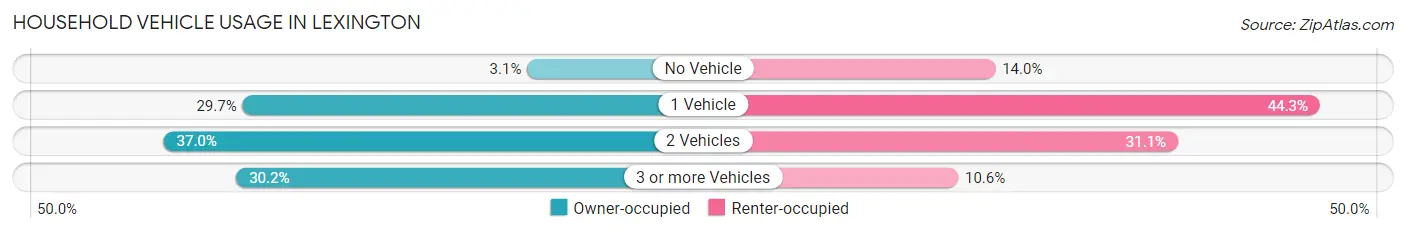
| Vehicles per Household | Owner-occupied | Renter-occupied |
| No Vehicle | 95 (3.1%) | 655 (14.0%) |
| 1 Vehicle | 914 (29.7%) | 2,070 (44.3%) |
| 2 Vehicles | 1,141 (37.0%) | 1,451 (31.1%) |
| 3 or more Vehicles | 932 (30.2%) | 493 (10.6%) |
| Total | 3,082 (100.0%) | 4,669 (100.0%) |
Real Estate & Mortgages in Lexington
Real Estate and Mortgage Overview in Lexington
| Characteristic | Without Mortgage | With Mortgage |
| Housing Units | 1,463 | 1,619 |
| Median Property Value | $126,100 | $148,600 |
| Median Household Income | $48,603 | $149 |
| Monthly Housing Costs | $468 | $19 |
| Real Estate Taxes | $1,245 | $31 |
Property Value by Mortgage Status in Lexington
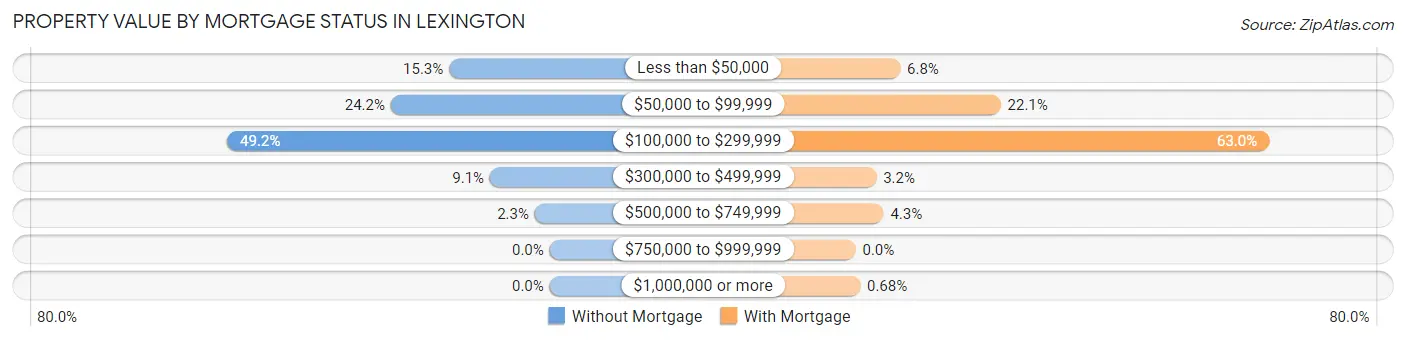
| Property Value | Without Mortgage | With Mortgage |
| Less than $50,000 | 224 (15.3%) | 110 (6.8%) |
| $50,000 to $99,999 | 354 (24.2%) | 358 (22.1%) |
| $100,000 to $299,999 | 719 (49.1%) | 1,020 (63.0%) |
| $300,000 to $499,999 | 133 (9.1%) | 51 (3.2%) |
| $500,000 to $749,999 | 33 (2.3%) | 69 (4.3%) |
| $750,000 to $999,999 | 0 (0.0%) | 0 (0.0%) |
| $1,000,000 or more | 0 (0.0%) | 11 (0.7%) |
| Total | 1,463 (100.0%) | 1,619 (100.0%) |
Household Income by Mortgage Status in Lexington
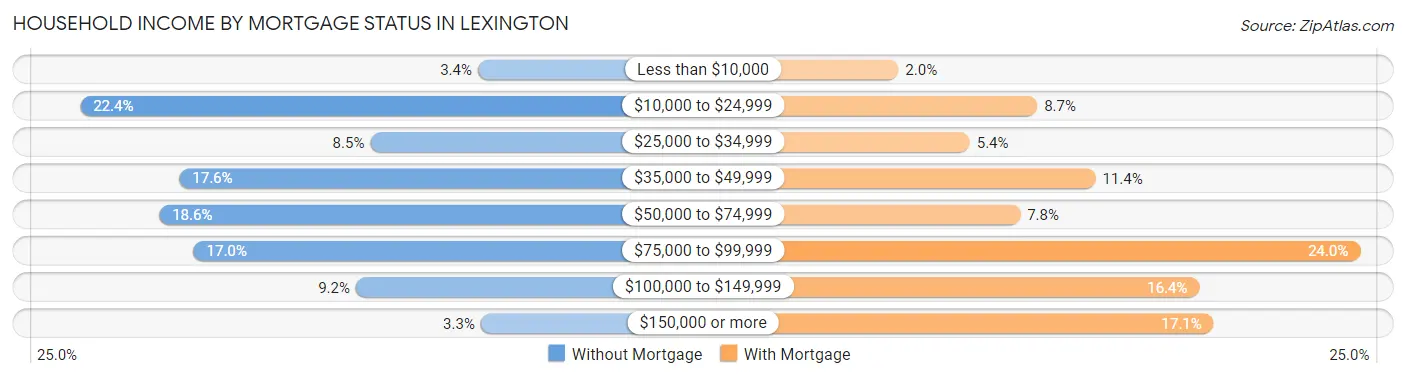
| Household Income | Without Mortgage | With Mortgage |
| Less than $10,000 | 50 (3.4%) | 33 (2.0%) |
| $10,000 to $24,999 | 327 (22.4%) | 140 (8.6%) |
| $25,000 to $34,999 | 125 (8.5%) | 88 (5.4%) |
| $35,000 to $49,999 | 258 (17.6%) | 185 (11.4%) |
| $50,000 to $74,999 | 272 (18.6%) | 127 (7.8%) |
| $75,000 to $99,999 | 248 (17.0%) | 389 (24.0%) |
| $100,000 to $149,999 | 135 (9.2%) | 265 (16.4%) |
| $150,000 or more | 48 (3.3%) | 276 (17.1%) |
| Total | 1,463 (100.0%) | 1,619 (100.0%) |
Property Value to Household Income Ratio in Lexington
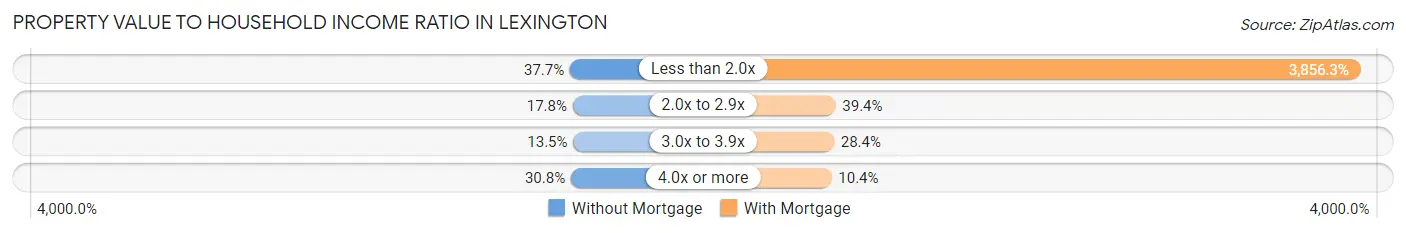
| Value-to-Income Ratio | Without Mortgage | With Mortgage |
| Less than 2.0x | 552 (37.7%) | 62,434 (3,856.3%) |
| 2.0x to 2.9x | 260 (17.8%) | 638 (39.4%) |
| 3.0x to 3.9x | 197 (13.5%) | 459 (28.3%) |
| 4.0x or more | 451 (30.8%) | 169 (10.4%) |
| Total | 1,463 (100.0%) | 1,619 (100.0%) |
Real Estate Taxes by Mortgage Status in Lexington
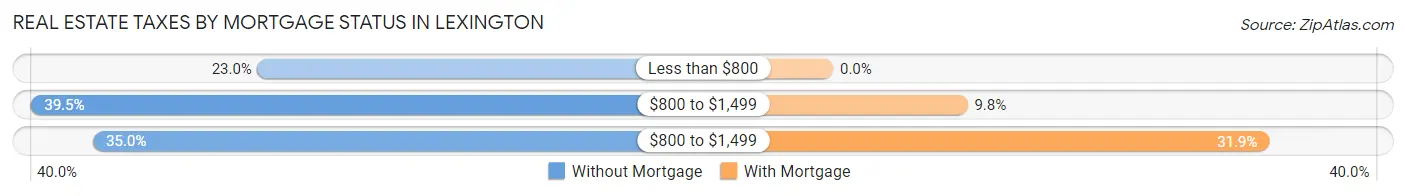
| Property Taxes | Without Mortgage | With Mortgage |
| Less than $800 | 336 (23.0%) | 0 (0.0%) |
| $800 to $1,499 | 578 (39.5%) | 159 (9.8%) |
| $800 to $1,499 | 512 (35.0%) | 516 (31.9%) |
| Total | 1,463 (100.0%) | 1,619 (100.0%) |
Health & Disability in Lexington
Health Insurance Coverage by Age in Lexington
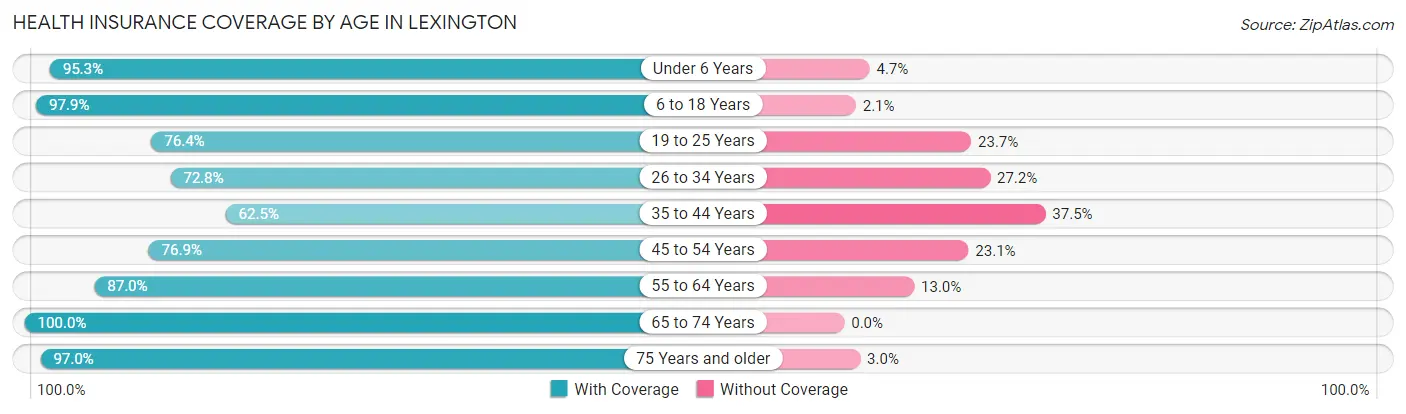
| Age Bracket | With Coverage | Without Coverage |
| Under 6 Years | 1,579 (95.3%) | 78 (4.7%) |
| 6 to 18 Years | 2,786 (97.9%) | 61 (2.1%) |
| 19 to 25 Years | 1,304 (76.3%) | 404 (23.6%) |
| 26 to 34 Years | 1,782 (72.8%) | 665 (27.2%) |
| 35 to 44 Years | 1,425 (62.5%) | 855 (37.5%) |
| 45 to 54 Years | 1,721 (76.9%) | 518 (23.1%) |
| 55 to 64 Years | 2,485 (87.0%) | 372 (13.0%) |
| 65 to 74 Years | 1,597 (100.0%) | 0 (0.0%) |
| 75 Years and older | 1,048 (97.0%) | 32 (3.0%) |
| Total | 15,727 (84.1%) | 2,985 (16.0%) |
Health Insurance Coverage by Citizenship Status in Lexington
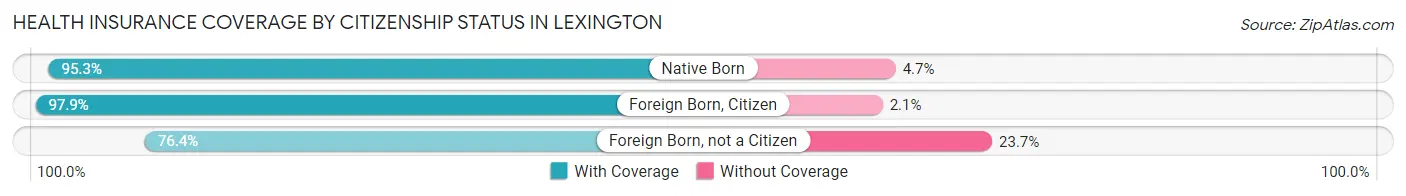
| Citizenship Status | With Coverage | Without Coverage |
| Native Born | 1,579 (95.3%) | 78 (4.7%) |
| Foreign Born, Citizen | 2,786 (97.9%) | 61 (2.1%) |
| Foreign Born, not a Citizen | 1,304 (76.3%) | 404 (23.6%) |
Health Insurance Coverage by Household Income in Lexington
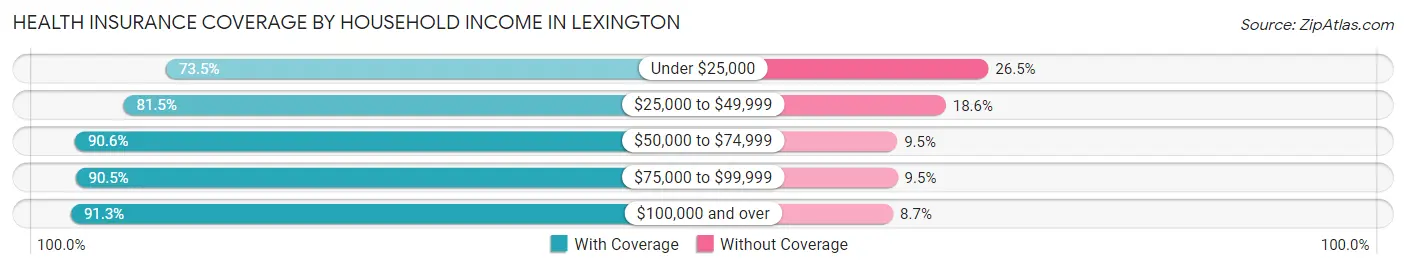
| Household Income | With Coverage | Without Coverage |
| Under $25,000 | 3,002 (73.5%) | 1,084 (26.5%) |
| $25,000 to $49,999 | 4,557 (81.5%) | 1,038 (18.5%) |
| $50,000 to $74,999 | 2,684 (90.5%) | 280 (9.5%) |
| $75,000 to $99,999 | 2,906 (90.5%) | 306 (9.5%) |
| $100,000 and over | 2,522 (91.3%) | 240 (8.7%) |
Public vs Private Health Insurance Coverage by Age in Lexington
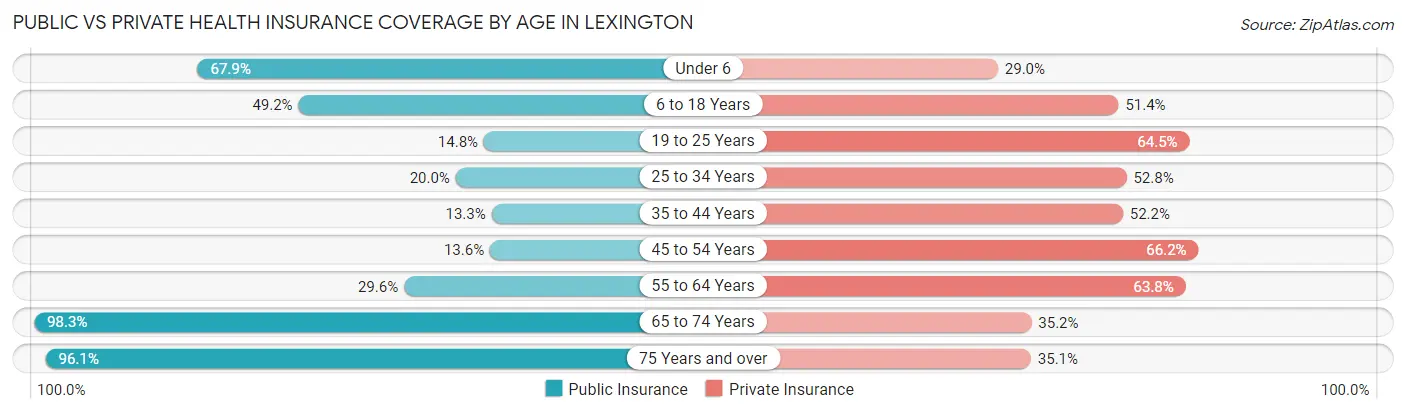
| Age Bracket | Public Insurance | Private Insurance |
| Under 6 | 1,125 (67.9%) | 480 (29.0%) |
| 6 to 18 Years | 1,400 (49.2%) | 1,462 (51.3%) |
| 19 to 25 Years | 252 (14.7%) | 1,102 (64.5%) |
| 25 to 34 Years | 489 (20.0%) | 1,293 (52.8%) |
| 35 to 44 Years | 304 (13.3%) | 1,189 (52.1%) |
| 45 to 54 Years | 305 (13.6%) | 1,482 (66.2%) |
| 55 to 64 Years | 845 (29.6%) | 1,823 (63.8%) |
| 65 to 74 Years | 1,569 (98.3%) | 562 (35.2%) |
| 75 Years and over | 1,038 (96.1%) | 379 (35.1%) |
| Total | 7,327 (39.2%) | 9,772 (52.2%) |
Disability Status by Sex by Age in Lexington
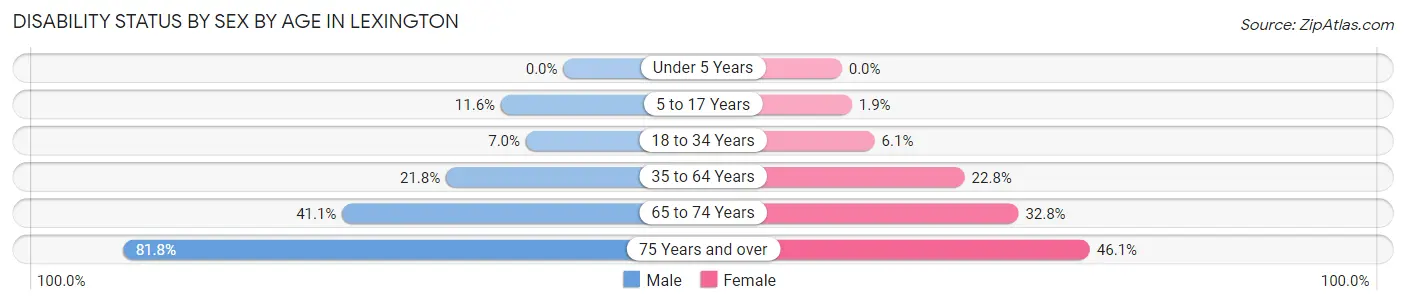
| Age Bracket | Male | Female |
| Under 5 Years | 0 (0.0%) | 0 (0.0%) |
| 5 to 17 Years | 163 (11.6%) | 31 (1.9%) |
| 18 to 34 Years | 122 (7.0%) | 152 (6.1%) |
| 35 to 64 Years | 850 (21.8%) | 792 (22.8%) |
| 65 to 74 Years | 305 (41.0%) | 280 (32.8%) |
| 75 Years and over | 386 (81.8%) | 280 (46.1%) |
Disability Class by Sex by Age in Lexington
Disability Class: Hearing Difficulty
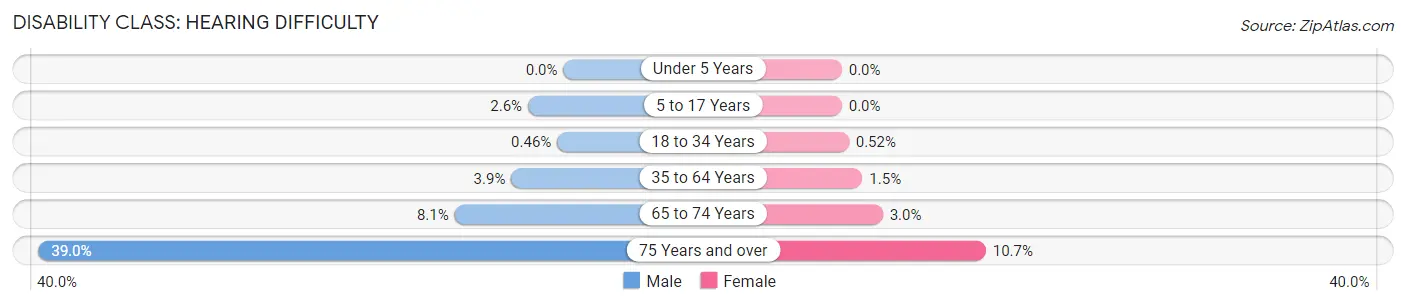
| Age Bracket | Male | Female |
| Under 5 Years | 0 (0.0%) | 0 (0.0%) |
| 5 to 17 Years | 37 (2.6%) | 0 (0.0%) |
| 18 to 34 Years | 8 (0.5%) | 13 (0.5%) |
| 35 to 64 Years | 151 (3.9%) | 53 (1.5%) |
| 65 to 74 Years | 60 (8.1%) | 26 (3.0%) |
| 75 Years and over | 184 (39.0%) | 65 (10.7%) |
Disability Class: Vision Difficulty
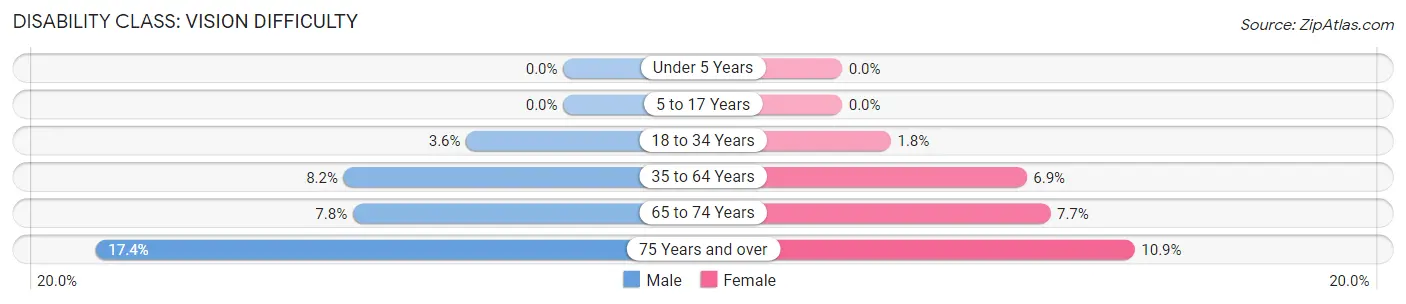
| Age Bracket | Male | Female |
| Under 5 Years | 0 (0.0%) | 0 (0.0%) |
| 5 to 17 Years | 0 (0.0%) | 0 (0.0%) |
| 18 to 34 Years | 63 (3.6%) | 45 (1.8%) |
| 35 to 64 Years | 318 (8.2%) | 238 (6.9%) |
| 65 to 74 Years | 58 (7.8%) | 66 (7.7%) |
| 75 Years and over | 82 (17.4%) | 66 (10.9%) |
Disability Class: Cognitive Difficulty
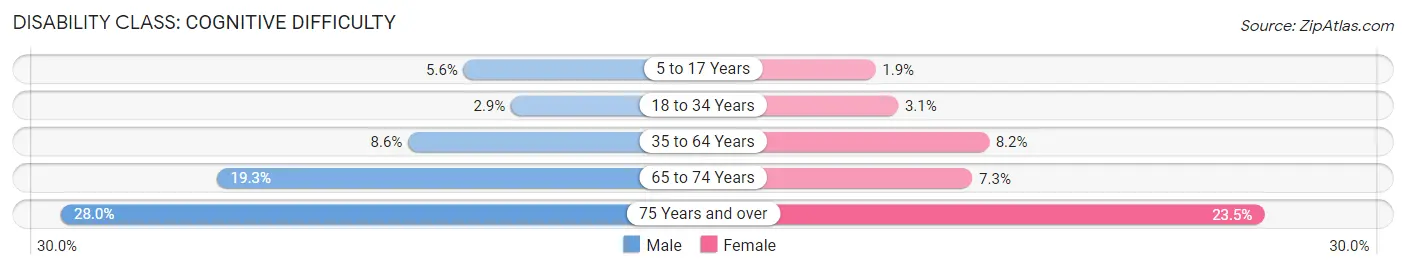
| Age Bracket | Male | Female |
| 5 to 17 Years | 78 (5.6%) | 31 (1.9%) |
| 18 to 34 Years | 51 (2.9%) | 78 (3.1%) |
| 35 to 64 Years | 337 (8.6%) | 284 (8.2%) |
| 65 to 74 Years | 143 (19.3%) | 62 (7.3%) |
| 75 Years and over | 132 (28.0%) | 143 (23.5%) |
Disability Class: Ambulatory Difficulty
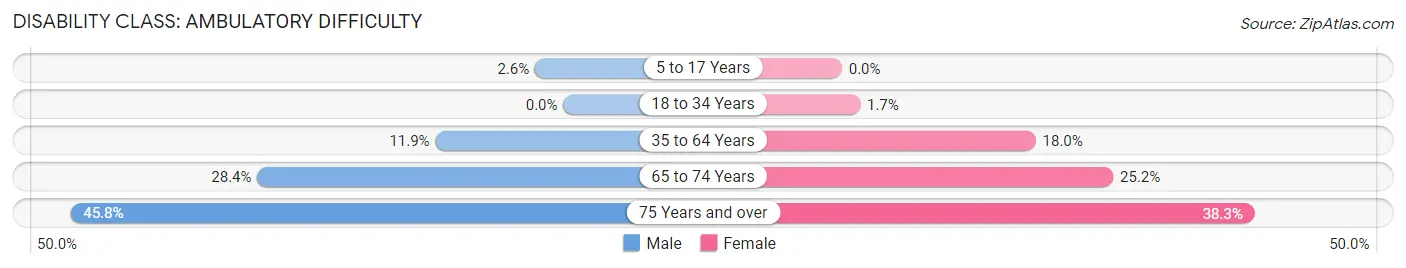
| Age Bracket | Male | Female |
| 5 to 17 Years | 37 (2.6%) | 0 (0.0%) |
| 18 to 34 Years | 0 (0.0%) | 42 (1.7%) |
| 35 to 64 Years | 463 (11.9%) | 625 (18.0%) |
| 65 to 74 Years | 211 (28.4%) | 215 (25.2%) |
| 75 Years and over | 216 (45.8%) | 233 (38.3%) |
Disability Class: Self-Care Difficulty
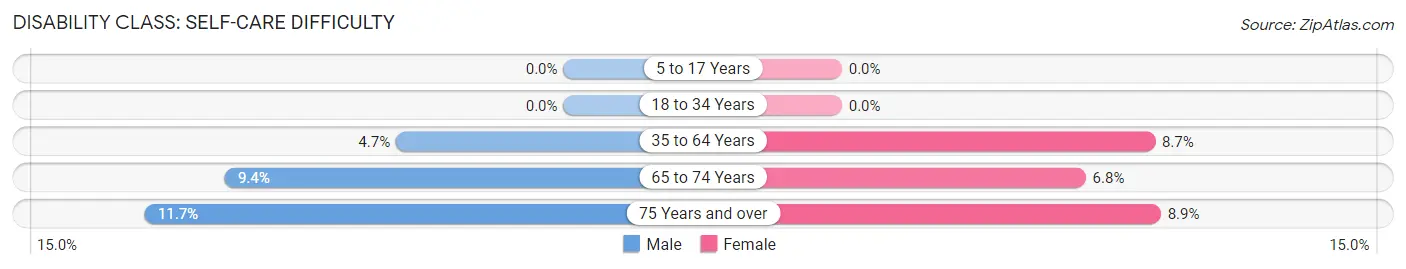
| Age Bracket | Male | Female |
| 5 to 17 Years | 0 (0.0%) | 0 (0.0%) |
| 18 to 34 Years | 0 (0.0%) | 0 (0.0%) |
| 35 to 64 Years | 182 (4.7%) | 303 (8.7%) |
| 65 to 74 Years | 70 (9.4%) | 58 (6.8%) |
| 75 Years and over | 55 (11.7%) | 54 (8.9%) |
Technology Access in Lexington
Computing Device Access in Lexington
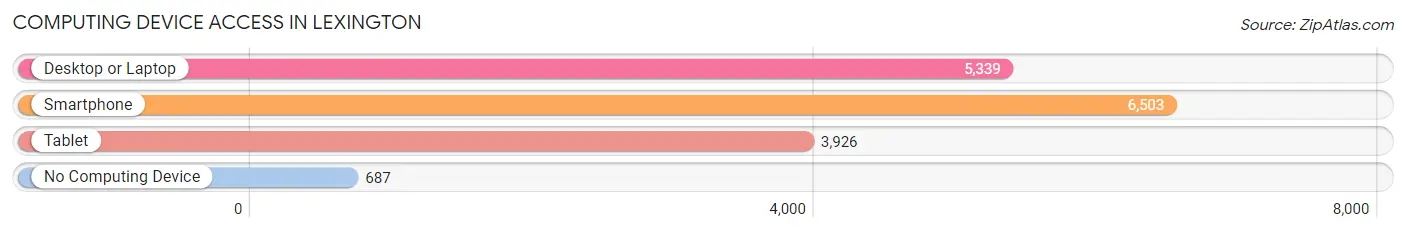
| Device Type | # Households | % Households |
| Desktop or Laptop | 5,339 | 68.9% |
| Smartphone | 6,503 | 83.9% |
| Tablet | 3,926 | 50.6% |
| No Computing Device | 687 | 8.9% |
| Total | 7,751 | 100.0% |
Internet Access in Lexington
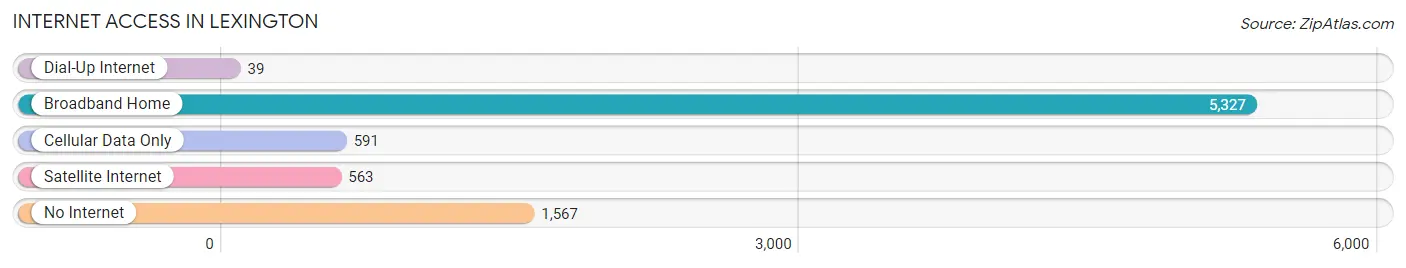
| Internet Type | # Households | % Households |
| Dial-Up Internet | 39 | 0.5% |
| Broadband Home | 5,327 | 68.7% |
| Cellular Data Only | 591 | 7.6% |
| Satellite Internet | 563 | 7.3% |
| No Internet | 1,567 | 20.2% |
| Total | 7,751 | 100.0% |
Lexington Summary
Lexington, North Carolina is a small city located in the heart of Davidson County. It is the county seat and the largest city in the county. The city is located in the Piedmont region of North Carolina, and is situated between the Uwharrie Mountains and the Yadkin River. The city has a population of 19,953 as of the 2010 census, and is part of the Winston-Salem metropolitan area.
History
The area that is now Lexington was first settled in 1753 by German and Scots-Irish immigrants. The town was originally known as "Saxapahaw," after the nearby river. In 1785, the town was renamed "Lexington" in honor of the Battle of Lexington, which had taken place in Massachusetts during the American Revolution.
The town was officially incorporated in 1825, and the first courthouse was built in 1826. The town grew rapidly in the 19th century, and by the end of the century, it had become a major center for manufacturing and industry. The city was also home to several prominent educational institutions, including the Davidson County Normal and Industrial Institute (now known as Davidson County Community College).
Geography
Lexington is located in the Piedmont region of North Carolina, and is situated between the Uwharrie Mountains and the Yadkin River. The city has a total area of 8.3 square miles, of which 8.2 square miles is land and 0.1 square miles is water. The city is located at an elevation of 845 feet above sea level.
The climate in Lexington is humid subtropical, with hot, humid summers and mild winters. The average annual temperature is 61.3°F, and the average annual precipitation is 44.3 inches.
Economy
The economy of Lexington is largely based on manufacturing and industry. The city is home to several major employers, including Thomas Built Buses, a manufacturer of school buses; Davidson County Community College; and the Davidson County Government.
The city also has a thriving retail sector, with several major shopping centers and outlets. The city is also home to several restaurants, bars, and other entertainment venues.
Demographics
As of the 2010 census, the population of Lexington was 19,953. The racial makeup of the city was 79.2% White, 15.3% African American, 0.4% Native American, 1.2% Asian, 0.1% Pacific Islander, 1.7% from other races, and 2.1% from two or more races. Hispanic or Latino of any race were 4.2% of the population.
The median household income in Lexington was $37,945, and the median family income was $45,945. The per capita income in the city was $20,945. About 15.3% of the population was below the poverty line.
Common Questions
What is Per Capita Income in Lexington?
Per Capita income in Lexington is $21,934.
What is the Median Family Income in Lexington?
Median Family Income in Lexington is $41,044.
What is the Median Household income in Lexington?
Median Household Income in Lexington is $36,868.
What is Income or Wage Gap in Lexington?
Income or Wage Gap in Lexington is 7.2%.
Women in Lexington earn 92.8 cents for every dollar earned by a man.
What is Family Income Deficit in Lexington?
Family Income Deficit in Lexington is $11,950.
Families that are below poverty line in Lexington earn $11,950 less on average than the poverty threshold level.
What is Inequality or Gini Index in Lexington?
Inequality or Gini Index in Lexington is 0.45.
What is the Total Population of Lexington?
Total Population of Lexington is 19,595.
What is the Total Male Population of Lexington?
Total Male Population of Lexington is 9,700.
What is the Total Female Population of Lexington?
Total Female Population of Lexington is 9,895.
What is the Ratio of Males per 100 Females in Lexington?
There are 98.03 Males per 100 Females in Lexington.
What is the Ratio of Females per 100 Males in Lexington?
There are 102.01 Females per 100 Males in Lexington.
What is the Median Population Age in Lexington?
Median Population Age in Lexington is 38.6 Years.
What is the Average Family Size in Lexington
Average Family Size in Lexington is 2.9 People.
What is the Average Household Size in Lexington
Average Household Size in Lexington is 2.4 People.
How Large is the Labor Force in Lexington?
There are 8,575 People in the Labor Forcein in Lexington.
What is the Percentage of People in the Labor Force in Lexington?
54.9% of People are in the Labor Force in Lexington.
What is the Unemployment Rate in Lexington?
Unemployment Rate in Lexington is 6.6%.