China Grove, NC Map & Demographics
China Grove Map
China Grove Overview
$30,416
PER CAPITA INCOME
$59,183
AVG FAMILY INCOME
$44,881
AVG HOUSEHOLD INCOME
17.8%
WAGE / INCOME GAP [ % ]
82.2¢/ $1
WAGE / INCOME GAP [ $ ]
0.47
INEQUALITY / GINI INDEX
4,449
TOTAL POPULATION
2,044
MALE POPULATION
2,405
FEMALE POPULATION
84.99
MALES / 100 FEMALES
117.66
FEMALES / 100 MALES
34.6
MEDIAN AGE
2.7
AVG FAMILY SIZE
2.2
AVG HOUSEHOLD SIZE
2,249
LABOR FORCE [ PEOPLE ]
61.3%
PERCENT IN LABOR FORCE
8.3%
UNEMPLOYMENT RATE
China Grove Zip Codes
China Grove Area Codes
Income in China Grove
Income Overview in China Grove
Per Capita Income in China Grove is $30,416, while median incomes of families and households are $59,183 and $44,881 respectively.
| Characteristic | Number | Measure |
| Per Capita Income | 4,449 | $30,416 |
| Median Family Income | 1,235 | $59,183 |
| Mean Family Income | 1,235 | $77,210 |
| Median Household Income | 2,006 | $44,881 |
| Mean Household Income | 2,006 | $66,381 |
| Income Deficit | 1,235 | $0 |
| Wage / Income Gap (%) | 4,449 | 17.75% |
| Wage / Income Gap ($) | 4,449 | 82.25¢ per $1 |
| Gini / Inequality Index | 4,449 | 0.47 |
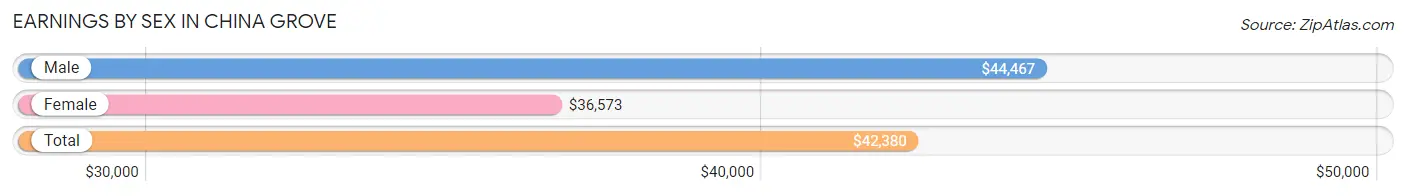
Earnings by Sex in China Grove
Average Earnings in China Grove are $42,380, $44,467 for men and $36,573 for women, a difference of 17.7%.
| Sex | Number | Average Earnings |
| Male | 1,299 (57.6%) | $44,467 |
| Female | 958 (42.4%) | $36,573 |
| Total | 2,257 (100.0%) | $42,380 |
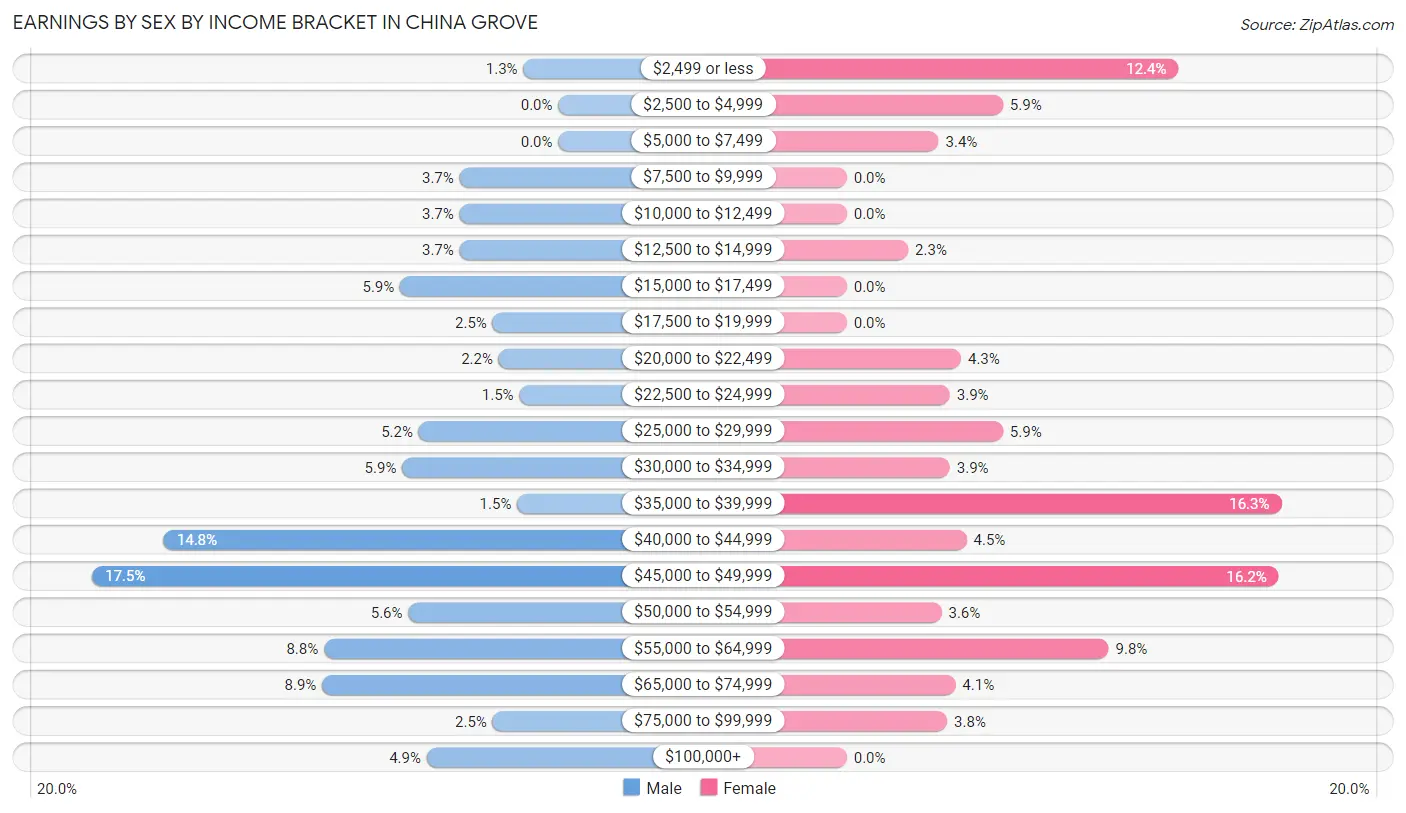
Earnings by Sex by Income Bracket in China Grove
The most common earnings brackets in China Grove are $45,000 to $49,999 for men (227 | 17.5%) and $35,000 to $39,999 for women (156 | 16.3%).
| Income | Male | Female |
| $2,499 or less | 17 (1.3%) | 119 (12.4%) |
| $2,500 to $4,999 | 0 (0.0%) | 56 (5.9%) |
| $5,000 to $7,499 | 0 (0.0%) | 33 (3.4%) |
| $7,500 to $9,999 | 48 (3.7%) | 0 (0.0%) |
| $10,000 to $12,499 | 48 (3.7%) | 0 (0.0%) |
| $12,500 to $14,999 | 48 (3.7%) | 22 (2.3%) |
| $15,000 to $17,499 | 77 (5.9%) | 0 (0.0%) |
| $17,500 to $19,999 | 32 (2.5%) | 0 (0.0%) |
| $20,000 to $22,499 | 29 (2.2%) | 41 (4.3%) |
| $22,500 to $24,999 | 19 (1.5%) | 37 (3.9%) |
| $25,000 to $29,999 | 68 (5.2%) | 56 (5.9%) |
| $30,000 to $34,999 | 76 (5.9%) | 37 (3.9%) |
| $35,000 to $39,999 | 20 (1.5%) | 156 (16.3%) |
| $40,000 to $44,999 | 192 (14.8%) | 43 (4.5%) |
| $45,000 to $49,999 | 227 (17.5%) | 155 (16.2%) |
| $50,000 to $54,999 | 73 (5.6%) | 34 (3.5%) |
| $55,000 to $64,999 | 114 (8.8%) | 94 (9.8%) |
| $65,000 to $74,999 | 115 (8.8%) | 39 (4.1%) |
| $75,000 to $99,999 | 32 (2.5%) | 36 (3.8%) |
| $100,000+ | 64 (4.9%) | 0 (0.0%) |
| Total | 1,299 (100.0%) | 958 (100.0%) |
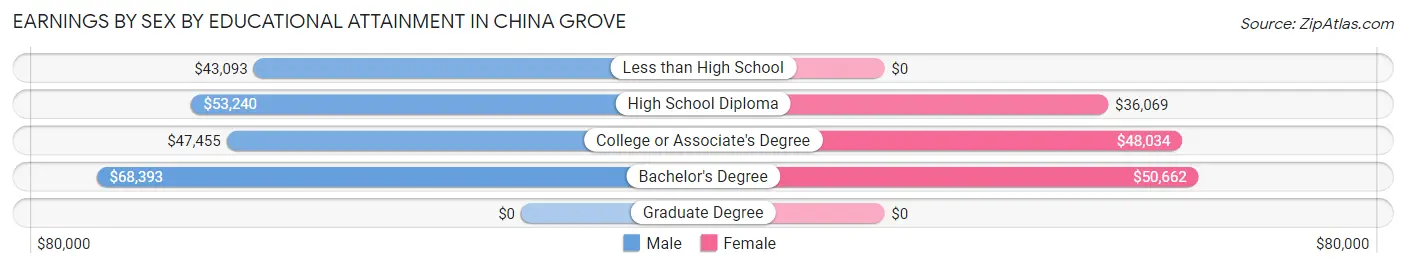
Earnings by Sex by Educational Attainment in China Grove
Average earnings in China Grove are $46,636 for men and $37,569 for women, a difference of 19.4%. Men with an educational attainment of bachelor's degree enjoy the highest average annual earnings of $68,393, while those with less than high school education earn the least with $43,093. Women with an educational attainment of bachelor's degree earn the most with the average annual earnings of $50,662, while those with high school diploma education have the smallest earnings of $36,069.
| Educational Attainment | Male Income | Female Income |
| Less than High School | $43,093 | $0 |
| High School Diploma | $53,240 | $36,069 |
| College or Associate's Degree | $47,455 | $48,034 |
| Bachelor's Degree | $68,393 | $50,662 |
| Graduate Degree | - | - |
| Total | $46,636 | $37,569 |
Family Income in China Grove
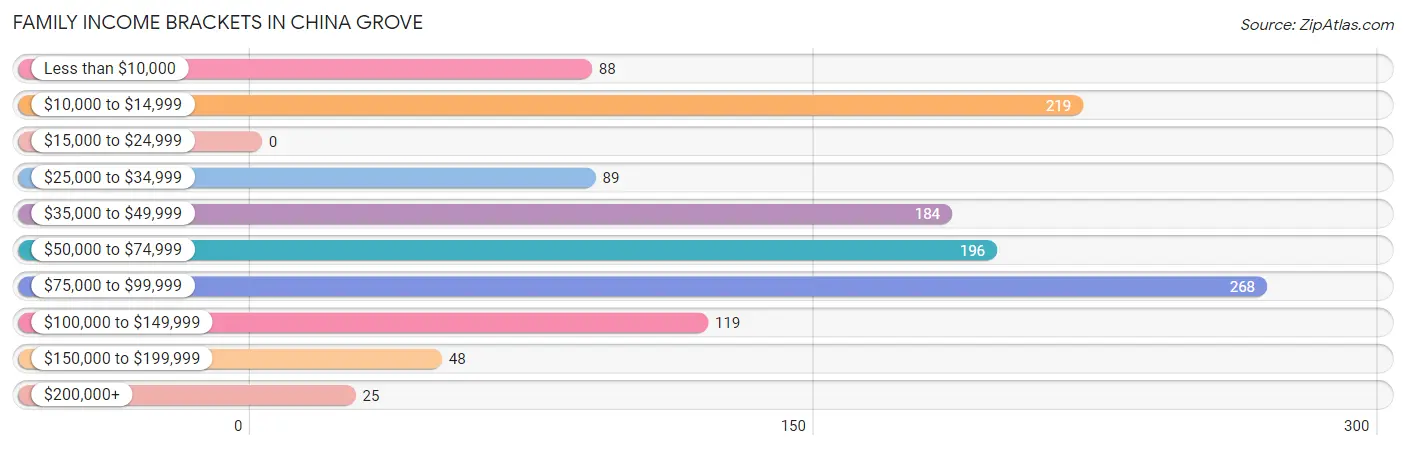
Family Income Brackets in China Grove
According to the China Grove family income data, there are 268 families falling into the $75,000 to $99,999 income range, which is the most common income bracket and makes up 21.7% of all families.
| Income Bracket | # Families | % Families |
| Less than $10,000 | 88 | 7.1% |
| $10,000 to $14,999 | 219 | 17.7% |
| $15,000 to $24,999 | 0 | 0.0% |
| $25,000 to $34,999 | 89 | 7.2% |
| $35,000 to $49,999 | 184 | 14.9% |
| $50,000 to $74,999 | 196 | 15.9% |
| $75,000 to $99,999 | 268 | 21.7% |
| $100,000 to $149,999 | 119 | 9.6% |
| $150,000 to $199,999 | 48 | 3.9% |
| $200,000+ | 25 | 2.0% |
Family Income by Famaliy Size in China Grove
4-person families (167 | 13.5%) account for the highest median family income in China Grove with $96,394 per family, while 2-person families (432 | 35.0%) have the highest median income of $35,228 per family member.

| Income Bracket | # Families | Median Income |
| 2-Person Families | 432 (35.0%) | $70,455 |
| 3-Person Families | 562 (45.5%) | $35,605 |
| 4-Person Families | 167 (13.5%) | $96,394 |
| 5-Person Families | 74 (6.0%) | $0 |
| 6-Person Families | 0 (0.0%) | $0 |
| 7+ Person Families | 0 (0.0%) | $0 |
| Total | 1,235 (100.0%) | $59,183 |
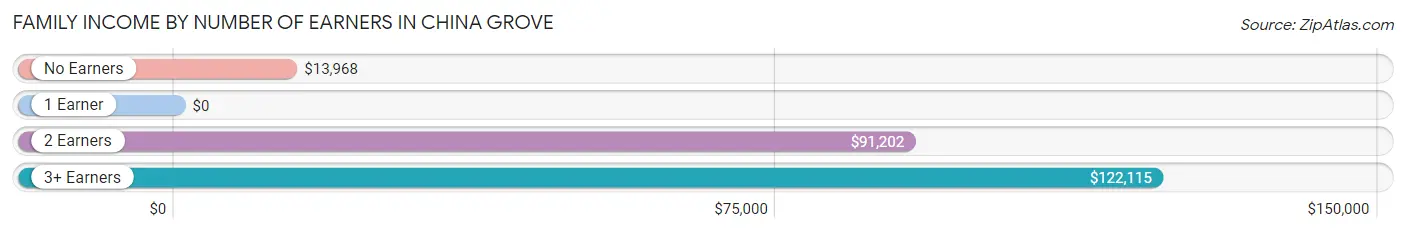
Family Income by Number of Earners in China Grove
| Number of Earners | # Families | Median Income |
| No Earners | 432 (35.0%) | $13,968 |
| 1 Earner | 192 (15.5%) | $0 |
| 2 Earners | 521 (42.2%) | $91,202 |
| 3+ Earners | 90 (7.3%) | $122,115 |
| Total | 1,235 (100.0%) | $59,183 |
Household Income in China Grove
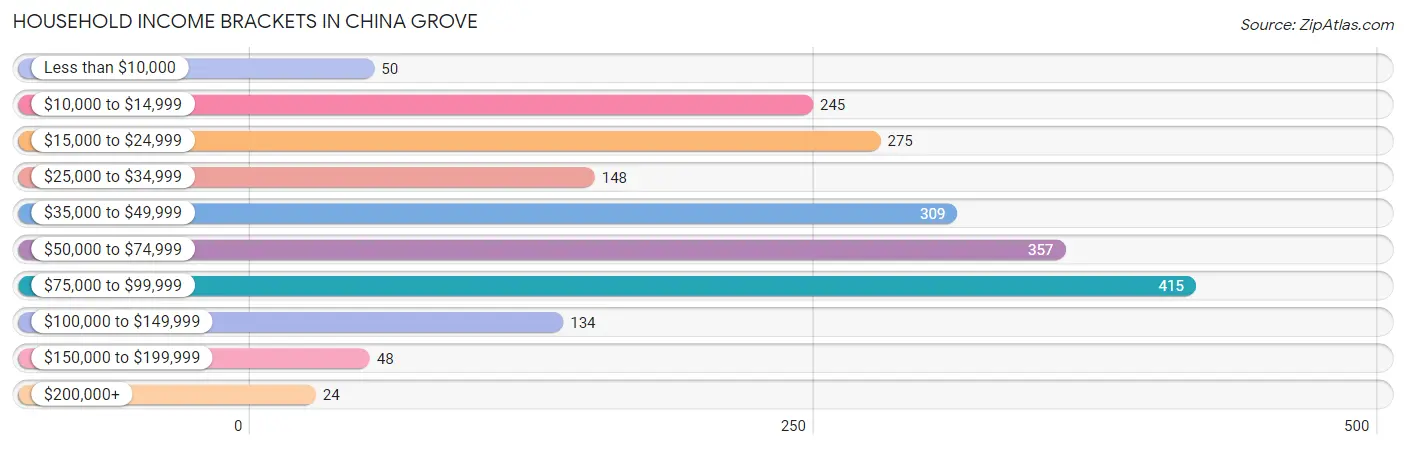
Household Income Brackets in China Grove
With 415 households falling in the category, the $75,000 to $99,999 income range is the most frequent in China Grove, accounting for 20.7% of all households. In contrast, only 24 households (1.2%) fall into the $200,000+ income bracket, making it the least populous group.
| Income Bracket | # Households | % Households |
| Less than $10,000 | 50 | 2.5% |
| $10,000 to $14,999 | 245 | 12.2% |
| $15,000 to $24,999 | 275 | 13.7% |
| $25,000 to $34,999 | 148 | 7.4% |
| $35,000 to $49,999 | 309 | 15.4% |
| $50,000 to $74,999 | 357 | 17.8% |
| $75,000 to $99,999 | 415 | 20.7% |
| $100,000 to $149,999 | 134 | 6.7% |
| $150,000 to $199,999 | 48 | 2.4% |
| $200,000+ | 24 | 1.2% |
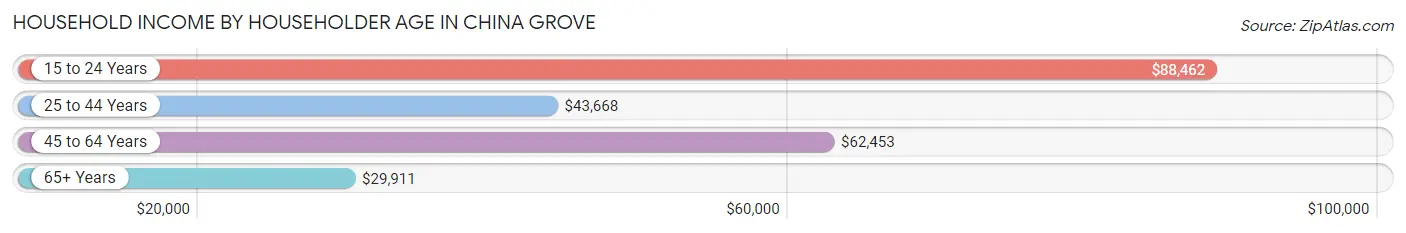
Household Income by Householder Age in China Grove
The median household income in China Grove is $44,881, with the highest median household income of $88,462 found in the 15 to 24 years age bracket for the primary householder. A total of 126 households (6.3%) fall into this category. Meanwhile, the 65+ years age bracket for the primary householder has the lowest median household income of $29,911, with 423 households (21.1%) in this group.
| Income Bracket | # Households | Median Income |
| 15 to 24 Years | 126 (6.3%) | $88,462 |
| 25 to 44 Years | 727 (36.2%) | $43,668 |
| 45 to 64 Years | 730 (36.4%) | $62,453 |
| 65+ Years | 423 (21.1%) | $29,911 |
| Total | 2,006 (100.0%) | $44,881 |
Poverty in China Grove
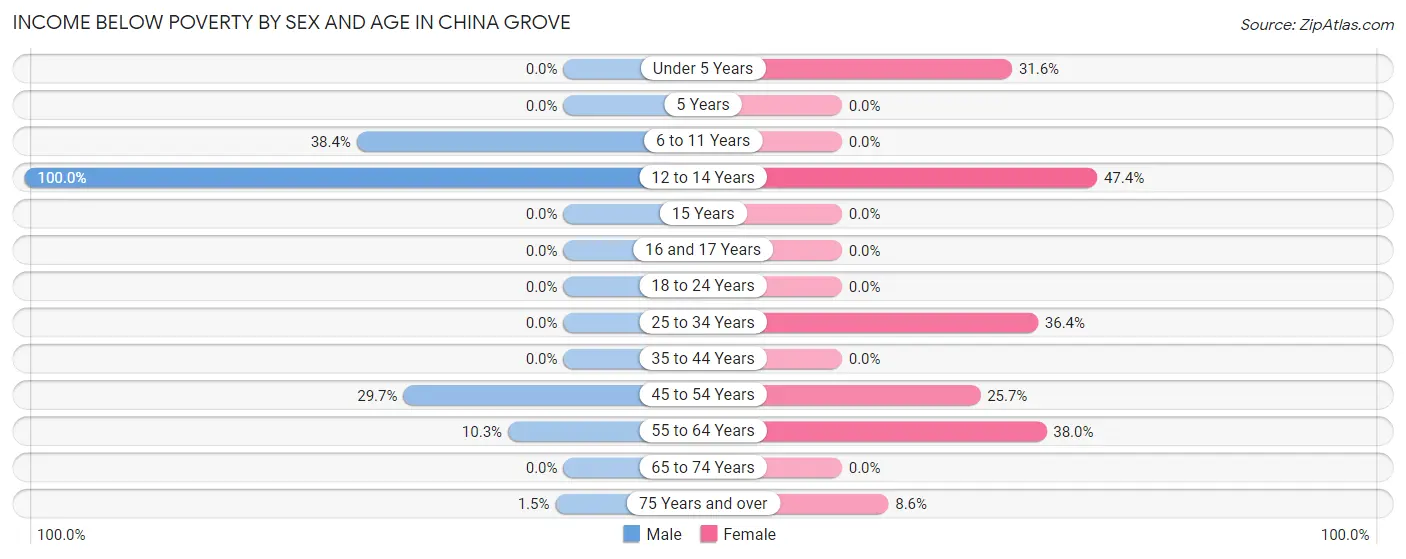
Income Below Poverty by Sex and Age in China Grove
With 14.4% poverty level for males and 21.5% for females among the residents of China Grove, 12 to 14 year old males and 12 to 14 year old females are the most vulnerable to poverty, with 82 males (100.0%) and 36 females (47.4%) in their respective age groups living below the poverty level.
| Age Bracket | Male | Female |
| Under 5 Years | 0 (0.0%) | 42 (31.6%) |
| 5 Years | 0 (0.0%) | 0 (0.0%) |
| 6 to 11 Years | 84 (38.4%) | 0 (0.0%) |
| 12 to 14 Years | 82 (100.0%) | 36 (47.4%) |
| 15 Years | 0 (0.0%) | 0 (0.0%) |
| 16 and 17 Years | 0 (0.0%) | 0 (0.0%) |
| 18 to 24 Years | 0 (0.0%) | 0 (0.0%) |
| 25 to 34 Years | 0 (0.0%) | 218 (36.4%) |
| 35 to 44 Years | 0 (0.0%) | 0 (0.0%) |
| 45 to 54 Years | 101 (29.7%) | 65 (25.7%) |
| 55 to 64 Years | 25 (10.3%) | 137 (38.0%) |
| 65 to 74 Years | 0 (0.0%) | 0 (0.0%) |
| 75 Years and over | 1 (1.5%) | 17 (8.6%) |
| Total | 293 (14.4%) | 515 (21.5%) |
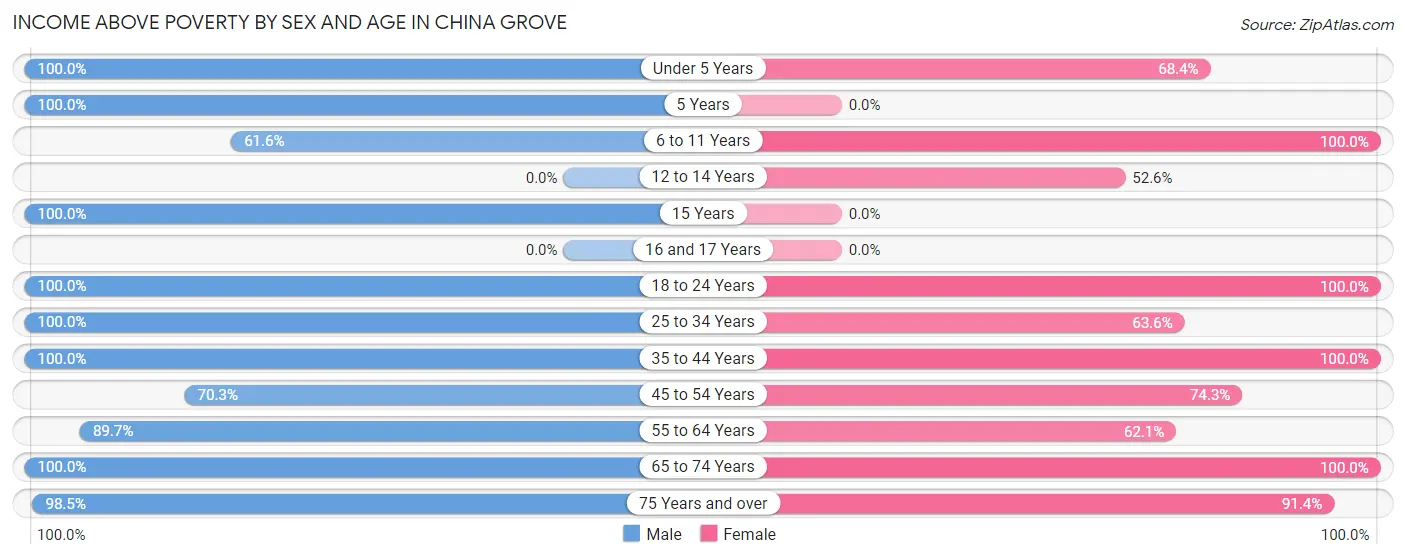
Income Above Poverty by Sex and Age in China Grove
According to the poverty statistics in China Grove, males aged under 5 years and females aged 6 to 11 years are the age groups that are most secure financially, with 100.0% of males and 100.0% of females in these age groups living above the poverty line.
| Age Bracket | Male | Female |
| Under 5 Years | 17 (100.0%) | 91 (68.4%) |
| 5 Years | 28 (100.0%) | 0 (0.0%) |
| 6 to 11 Years | 135 (61.6%) | 208 (100.0%) |
| 12 to 14 Years | 0 (0.0%) | 40 (52.6%) |
| 15 Years | 17 (100.0%) | 0 (0.0%) |
| 16 and 17 Years | 0 (0.0%) | 0 (0.0%) |
| 18 to 24 Years | 151 (100.0%) | 325 (100.0%) |
| 25 to 34 Years | 455 (100.0%) | 381 (63.6%) |
| 35 to 44 Years | 203 (100.0%) | 78 (100.0%) |
| 45 to 54 Years | 239 (70.3%) | 188 (74.3%) |
| 55 to 64 Years | 218 (89.7%) | 224 (62.1%) |
| 65 to 74 Years | 205 (100.0%) | 168 (100.0%) |
| 75 Years and over | 66 (98.5%) | 180 (91.4%) |
| Total | 1,734 (85.6%) | 1,883 (78.5%) |
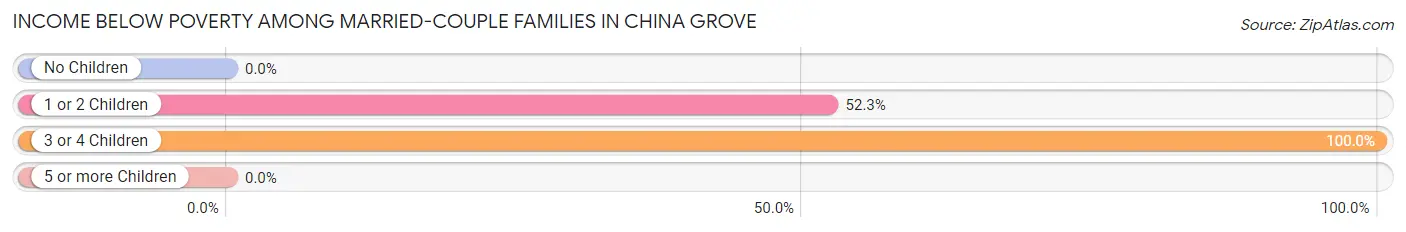
Income Below Poverty Among Married-Couple Families in China Grove
The poverty statistics for married-couple families in China Grove show that 26.0% or 246 of the total 948 families live below the poverty line. Families with 3 or 4 children have the highest poverty rate of 100.0%, comprising of 28 families. On the other hand, families with no children have the lowest poverty rate of 0.0%, which includes 0 families.
| Children | Above Poverty | Below Poverty |
| No Children | 503 (100.0%) | 0 (0.0%) |
| 1 or 2 Children | 199 (47.7%) | 218 (52.3%) |
| 3 or 4 Children | 0 (0.0%) | 28 (100.0%) |
| 5 or more Children | 0 (0.0%) | 0 (0.0%) |
| Total | 702 (74.1%) | 246 (26.0%) |
Income Below Poverty Among Single-Parent Households in China Grove
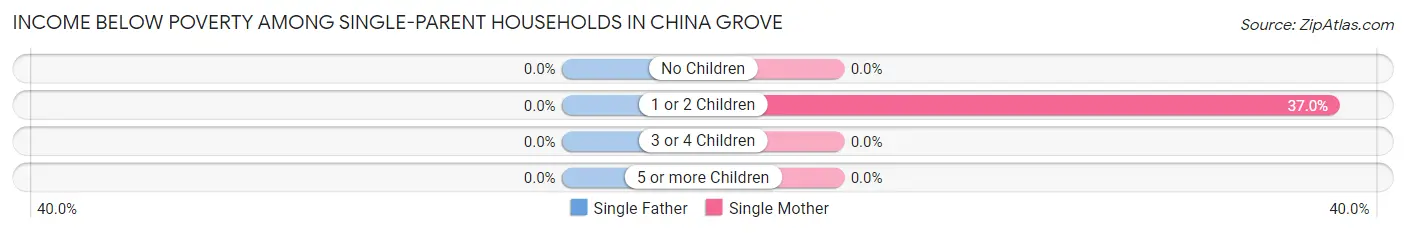
| Children | Single Father | Single Mother |
| No Children | 0 (0.0%) | 0 (0.0%) |
| 1 or 2 Children | 0 (0.0%) | 88 (37.0%) |
| 3 or 4 Children | 0 (0.0%) | 0 (0.0%) |
| 5 or more Children | 0 (0.0%) | 0 (0.0%) |
| Total | 0 (0.0%) | 88 (34.1%) |
Income Below Poverty Among Married-Couple vs Single-Parent Households in China Grove
The poverty data for China Grove shows that 246 of the married-couple family households (26.0%) and 88 of the single-parent households (30.7%) are living below the poverty level. Within the married-couple family households, those with 3 or 4 children have the highest poverty rate, with 28 households (100.0%) falling below the poverty line. Among the single-parent households, those with 1 or 2 children have the highest poverty rate, with 88 household (37.0%) living below poverty.
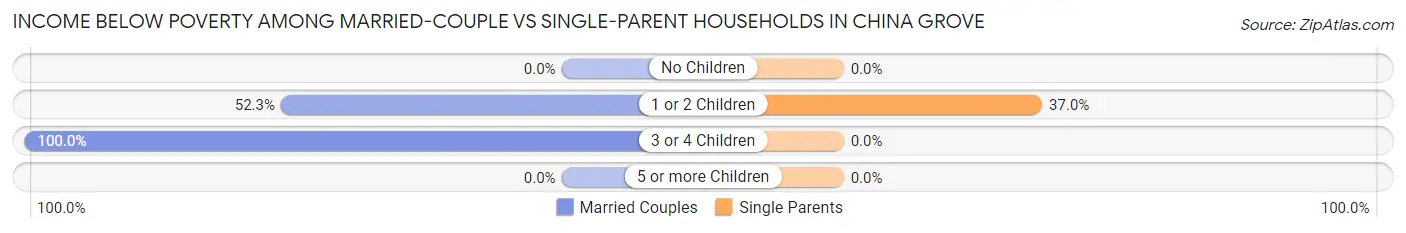
| Children | Married-Couple Families | Single-Parent Households |
| No Children | 0 (0.0%) | 0 (0.0%) |
| 1 or 2 Children | 218 (52.3%) | 88 (37.0%) |
| 3 or 4 Children | 28 (100.0%) | 0 (0.0%) |
| 5 or more Children | 0 (0.0%) | 0 (0.0%) |
| Total | 246 (26.0%) | 88 (30.7%) |
Race in China Grove
The most populous races in China Grove are White / Caucasian (2,936 | 66.0%), Hispanic or Latino (1,232 | 27.7%), and Two or more Races (631 | 14.2%).
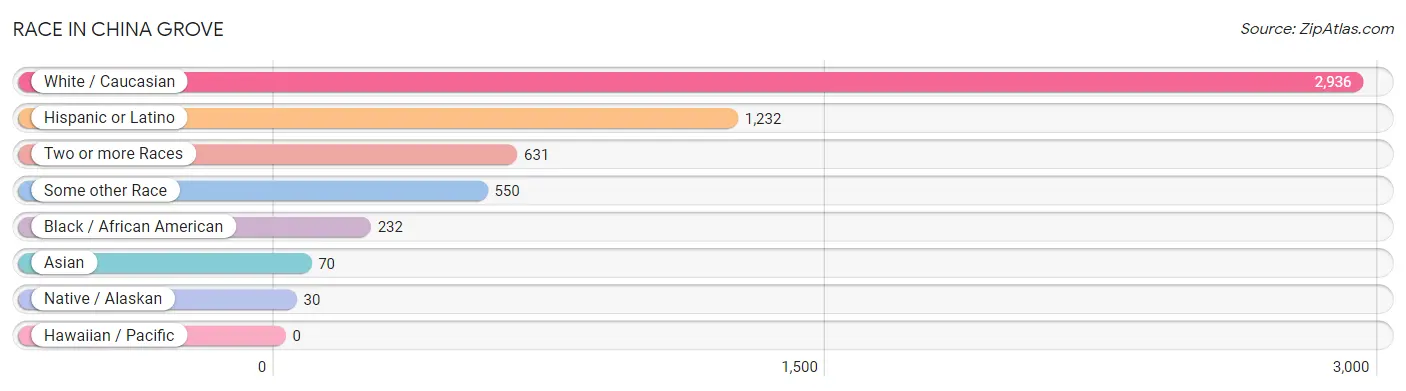
| Race | # Population | % Population |
| Asian | 70 | 1.6% |
| Black / African American | 232 | 5.2% |
| Hawaiian / Pacific | 0 | 0.0% |
| Hispanic or Latino | 1,232 | 27.7% |
| Native / Alaskan | 30 | 0.7% |
| White / Caucasian | 2,936 | 66.0% |
| Two or more Races | 631 | 14.2% |
| Some other Race | 550 | 12.4% |
| Total | 4,449 | 100.0% |
Ancestry in China Grove
The most populous ancestries reported in China Grove are German (868 | 19.5%), Mexican (576 | 13.0%), American (546 | 12.3%), English (435 | 9.8%), and Central American (356 | 8.0%), together accounting for 62.5% of all China Grove residents.
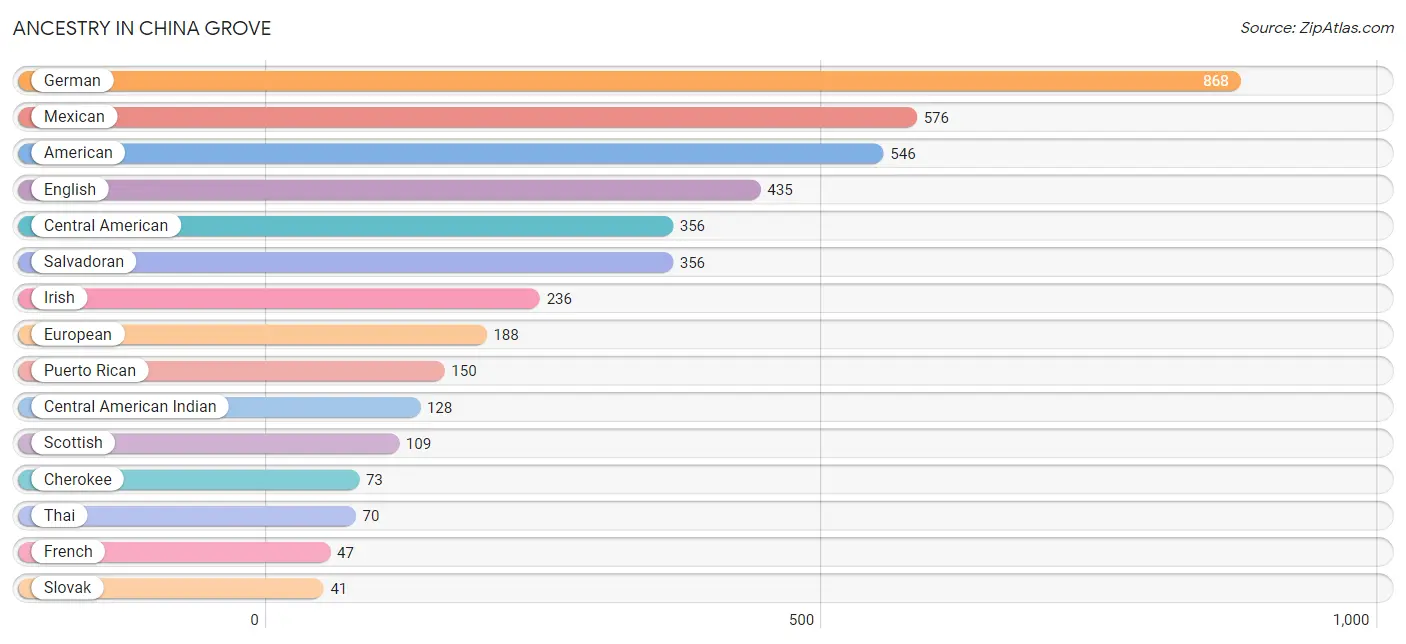
| Ancestry | # Population | % Population |
| American | 546 | 12.3% |
| Apache | 8 | 0.2% |
| British | 36 | 0.8% |
| Central American | 356 | 8.0% |
| Central American Indian | 128 | 2.9% |
| Cherokee | 73 | 1.6% |
| Cuban | 27 | 0.6% |
| English | 435 | 9.8% |
| European | 188 | 4.2% |
| French | 47 | 1.1% |
| German | 868 | 19.5% |
| Greek | 20 | 0.4% |
| Irish | 236 | 5.3% |
| Italian | 20 | 0.4% |
| Mexican | 576 | 13.0% |
| Mexican American Indian | 38 | 0.9% |
| Puerto Rican | 150 | 3.4% |
| Salvadoran | 356 | 8.0% |
| Scotch-Irish | 38 | 0.9% |
| Scottish | 109 | 2.5% |
| Slovak | 41 | 0.9% |
| Thai | 70 | 1.6% | View All 22 Rows |
Immigrants in China Grove
The most numerous immigrant groups reported in China Grove came from Latin America (579 | 13.0%), Central America (534 | 12.0%), Mexico (357 | 8.0%), El Salvador (124 | 2.8%), and Europe (90 | 2.0%), together accounting for 37.8% of all China Grove residents.
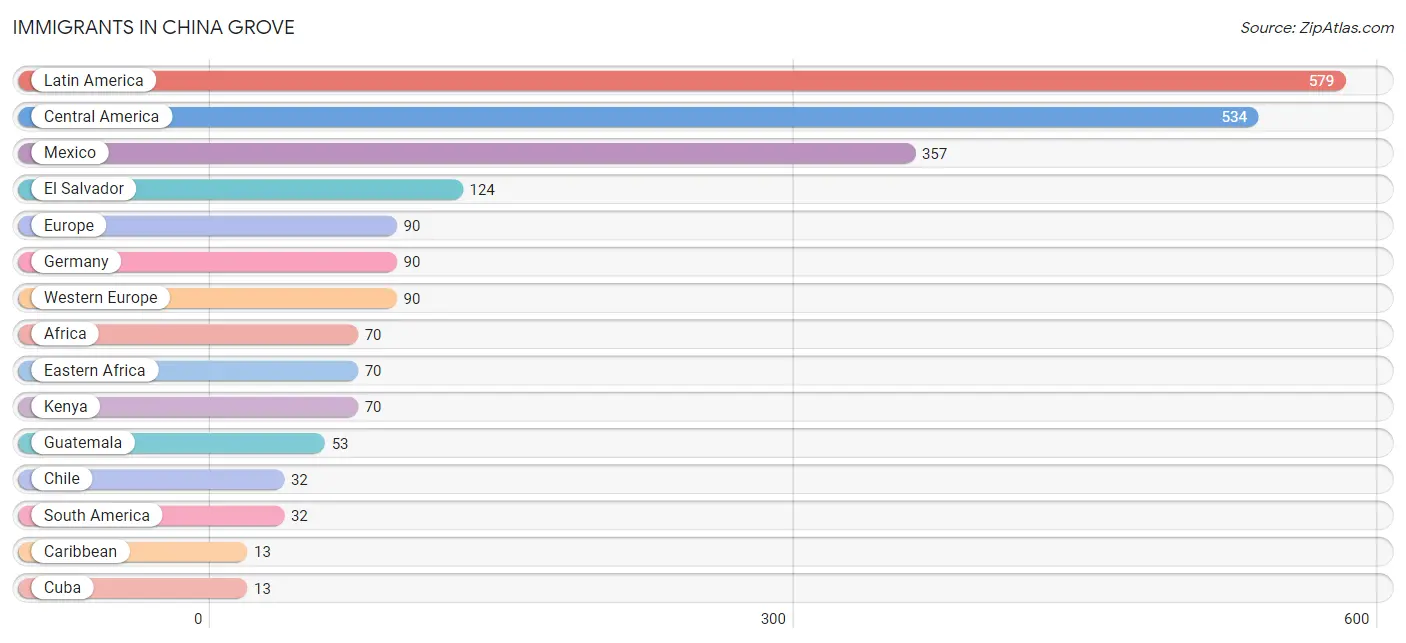
| Immigration Origin | # Population | % Population |
| Africa | 70 | 1.6% |
| Caribbean | 13 | 0.3% |
| Central America | 534 | 12.0% |
| Chile | 32 | 0.7% |
| Cuba | 13 | 0.3% |
| Eastern Africa | 70 | 1.6% |
| El Salvador | 124 | 2.8% |
| Europe | 90 | 2.0% |
| Germany | 90 | 2.0% |
| Guatemala | 53 | 1.2% |
| Kenya | 70 | 1.6% |
| Latin America | 579 | 13.0% |
| Mexico | 357 | 8.0% |
| South America | 32 | 0.7% |
| Western Europe | 90 | 2.0% | View All 15 Rows |
Sex and Age in China Grove
Sex and Age in China Grove
The most populous age groups in China Grove are 50 to 54 Years (297 | 14.5%) for men and 25 to 29 Years (308 | 12.8%) for women.
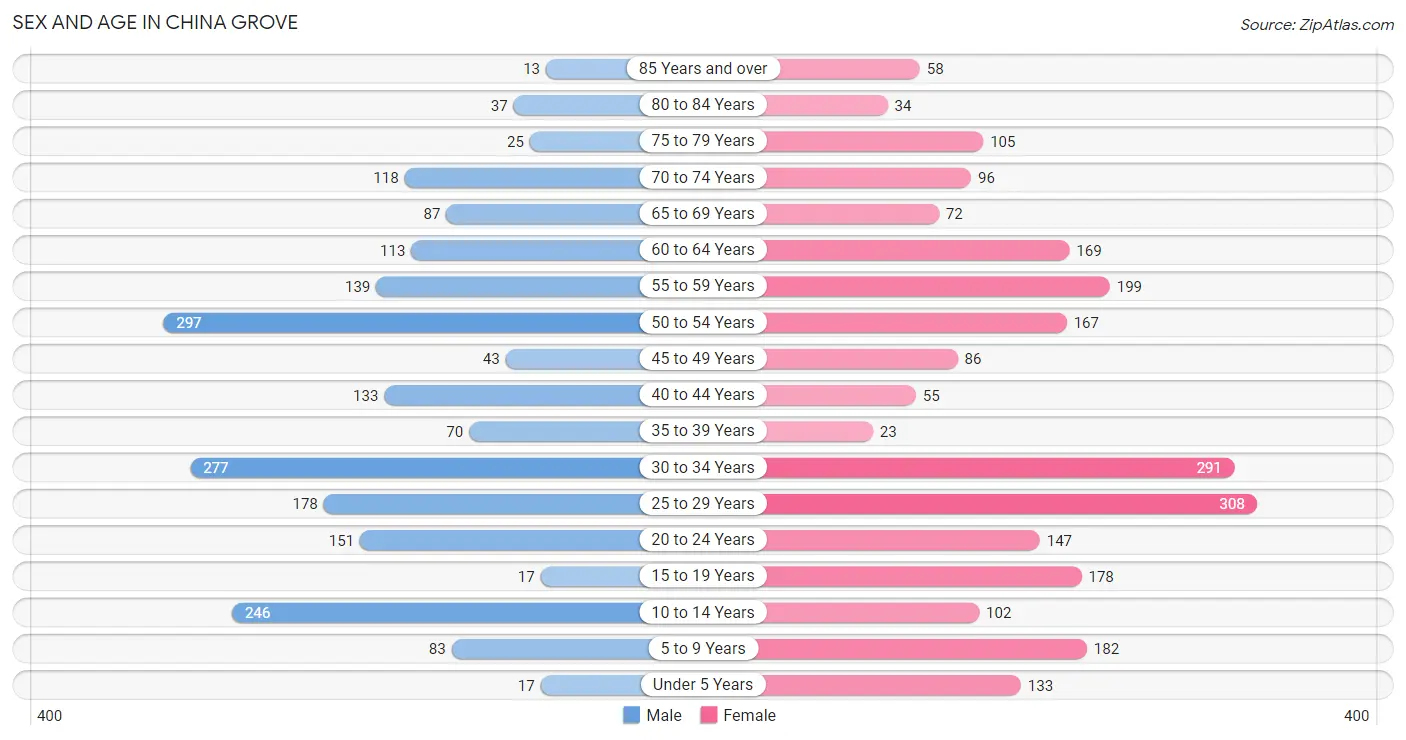
| Age Bracket | Male | Female |
| Under 5 Years | 17 (0.8%) | 133 (5.5%) |
| 5 to 9 Years | 83 (4.1%) | 182 (7.6%) |
| 10 to 14 Years | 246 (12.0%) | 102 (4.2%) |
| 15 to 19 Years | 17 (0.8%) | 178 (7.4%) |
| 20 to 24 Years | 151 (7.4%) | 147 (6.1%) |
| 25 to 29 Years | 178 (8.7%) | 308 (12.8%) |
| 30 to 34 Years | 277 (13.6%) | 291 (12.1%) |
| 35 to 39 Years | 70 (3.4%) | 23 (1.0%) |
| 40 to 44 Years | 133 (6.5%) | 55 (2.3%) |
| 45 to 49 Years | 43 (2.1%) | 86 (3.6%) |
| 50 to 54 Years | 297 (14.5%) | 167 (6.9%) |
| 55 to 59 Years | 139 (6.8%) | 199 (8.3%) |
| 60 to 64 Years | 113 (5.5%) | 169 (7.0%) |
| 65 to 69 Years | 87 (4.3%) | 72 (3.0%) |
| 70 to 74 Years | 118 (5.8%) | 96 (4.0%) |
| 75 to 79 Years | 25 (1.2%) | 105 (4.4%) |
| 80 to 84 Years | 37 (1.8%) | 34 (1.4%) |
| 85 Years and over | 13 (0.6%) | 58 (2.4%) |
| Total | 2,044 (100.0%) | 2,405 (100.0%) |
Families and Households in China Grove
Median Family Size in China Grove
The median family size in China Grove is 2.73 persons per family, with single male/father families (29 | 2.4%) accounting for the largest median family size of 3.28 persons per family. On the other hand, single female/mother families (258 | 20.9%) represent the smallest median family size with 2.71 persons per family.
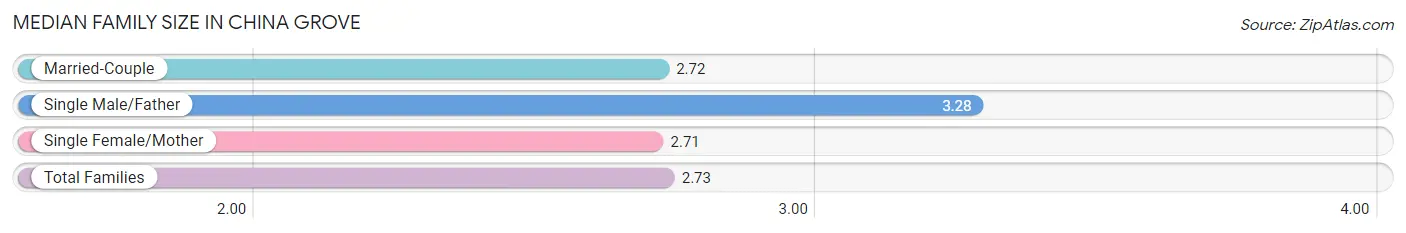
| Family Type | # Families | Family Size |
| Married-Couple | 948 (76.8%) | 2.72 |
| Single Male/Father | 29 (2.4%) | 3.28 |
| Single Female/Mother | 258 (20.9%) | 2.71 |
| Total Families | 1,235 (100.0%) | 2.73 |
Median Household Size in China Grove
The median household size in China Grove is 2.20 persons per household, with single male/father households (29 | 1.5%) accounting for the largest median household size of 3.28 persons per household. non-family households (771 | 38.4%) represent the smallest median household size with 1.32 persons per household.
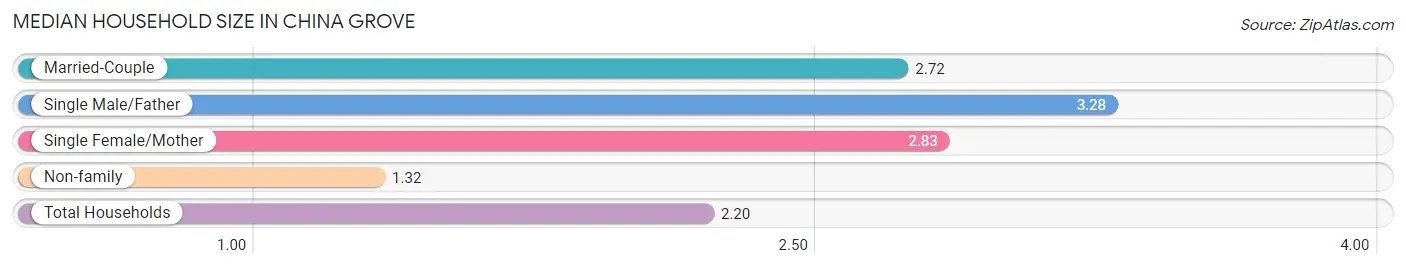
| Household Type | # Households | Household Size |
| Married-Couple | 948 (47.3%) | 2.72 |
| Single Male/Father | 29 (1.5%) | 3.28 |
| Single Female/Mother | 258 (12.9%) | 2.83 |
| Non-family | 771 (38.4%) | 1.32 |
| Total Households | 2,006 (100.0%) | 2.20 |
Household Size by Marriage Status in China Grove
Out of a total of 2,006 households in China Grove, 1,235 (61.6%) are family households, while 771 (38.4%) are nonfamily households. The most numerous type of family households are 3-person households, comprising 615, and the most common type of nonfamily households are 1-person households, comprising 570.
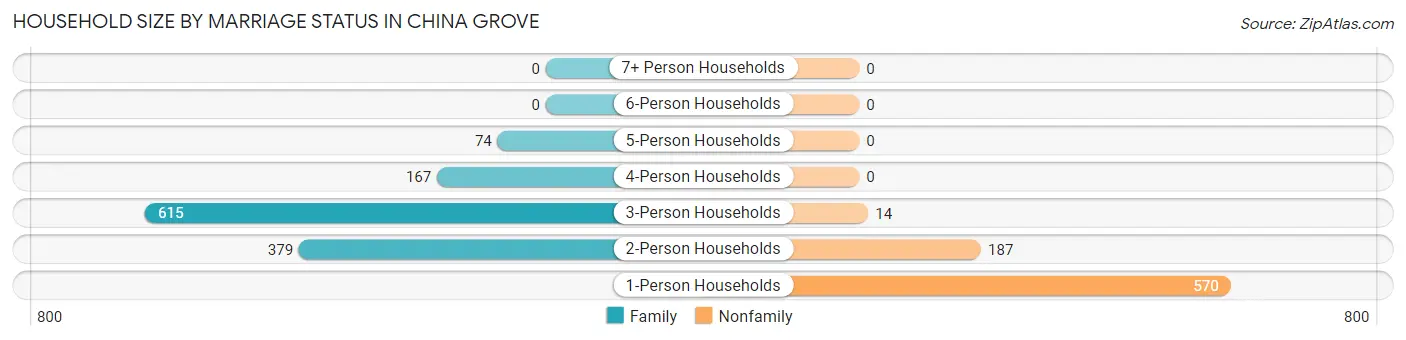
| Household Size | Family Households | Nonfamily Households |
| 1-Person Households | - | 570 (28.4%) |
| 2-Person Households | 379 (18.9%) | 187 (9.3%) |
| 3-Person Households | 615 (30.7%) | 14 (0.7%) |
| 4-Person Households | 167 (8.3%) | 0 (0.0%) |
| 5-Person Households | 74 (3.7%) | 0 (0.0%) |
| 6-Person Households | 0 (0.0%) | 0 (0.0%) |
| 7+ Person Households | 0 (0.0%) | 0 (0.0%) |
| Total | 1,235 (61.6%) | 771 (38.4%) |
Female Fertility in China Grove
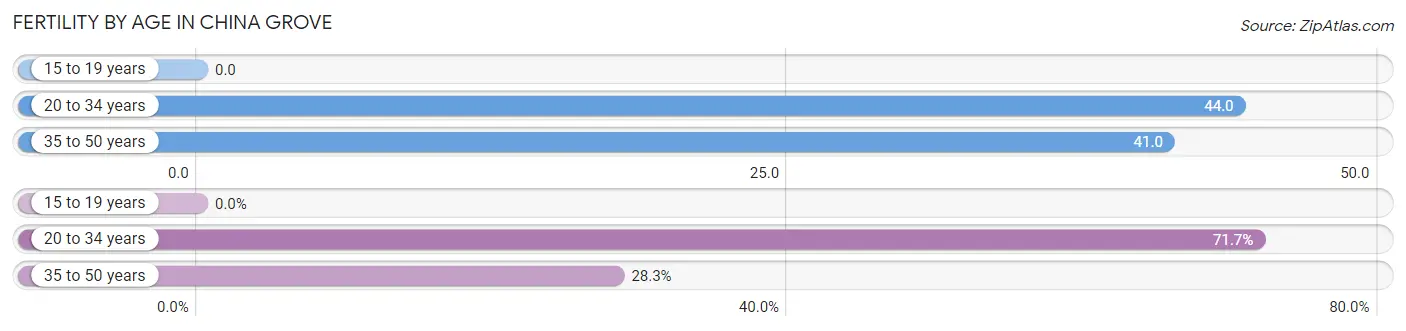
Fertility by Age in China Grove
Average fertility rate in China Grove is 37.0 births per 1,000 women. Women in the age bracket of 20 to 34 years have the highest fertility rate with 44.0 births per 1,000 women. Women in the age bracket of 20 to 34 years acount for 71.7% of all women with births.
| Age Bracket | Women with Births | Births / 1,000 Women |
| 15 to 19 years | 0 (0.0%) | 0.0 |
| 20 to 34 years | 33 (71.7%) | 44.0 |
| 35 to 50 years | 13 (28.3%) | 41.0 |
| Total | 46 (100.0%) | 37.0 |
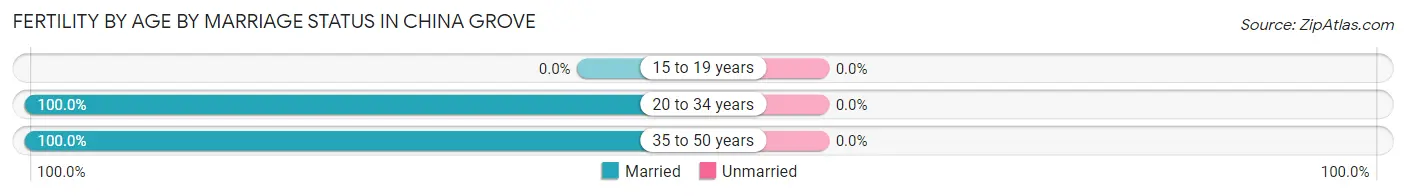
Fertility by Age by Marriage Status in China Grove
| Age Bracket | Married | Unmarried |
| 15 to 19 years | 0 (0.0%) | 0 (0.0%) |
| 20 to 34 years | 33 (100.0%) | 0 (0.0%) |
| 35 to 50 years | 13 (100.0%) | 0 (0.0%) |
| Total | 46 (100.0%) | 0 (0.0%) |
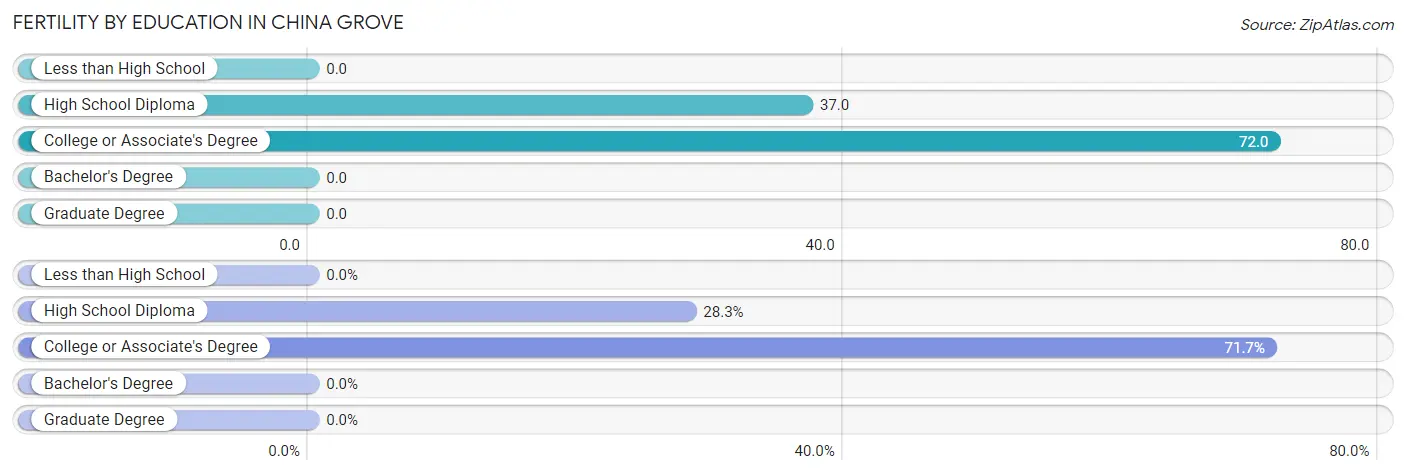
Fertility by Education in China Grove
| Educational Attainment | Women with Births | Births / 1,000 Women |
| Less than High School | 0 (0.0%) | 0.0 |
| High School Diploma | 13 (28.3%) | 37.0 |
| College or Associate's Degree | 33 (71.7%) | 72.0 |
| Bachelor's Degree | 0 (0.0%) | 0.0 |
| Graduate Degree | 0 (0.0%) | 0.0 |
| Total | 46 (100.0%) | 37.0 |
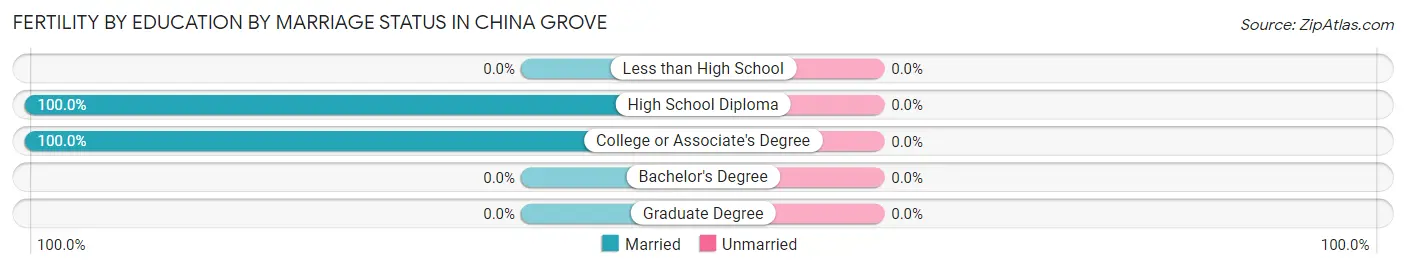
Fertility by Education by Marriage Status in China Grove
| Educational Attainment | Married | Unmarried |
| Less than High School | 0 (0.0%) | 0 (0.0%) |
| High School Diploma | 13 (100.0%) | 0 (0.0%) |
| College or Associate's Degree | 33 (100.0%) | 0 (0.0%) |
| Bachelor's Degree | 0 (0.0%) | 0 (0.0%) |
| Graduate Degree | 0 (0.0%) | 0 (0.0%) |
| Total | 46 (100.0%) | 0 (0.0%) |
Employment Characteristics in China Grove
Employment by Class of Employer in China Grove
Among the 2,016 employed individuals in China Grove, private company employees (1,626 | 80.6%), local government employees (112 | 5.6%), and self-employed (not incorporated) (110 | 5.5%) make up the most common classes of employment.
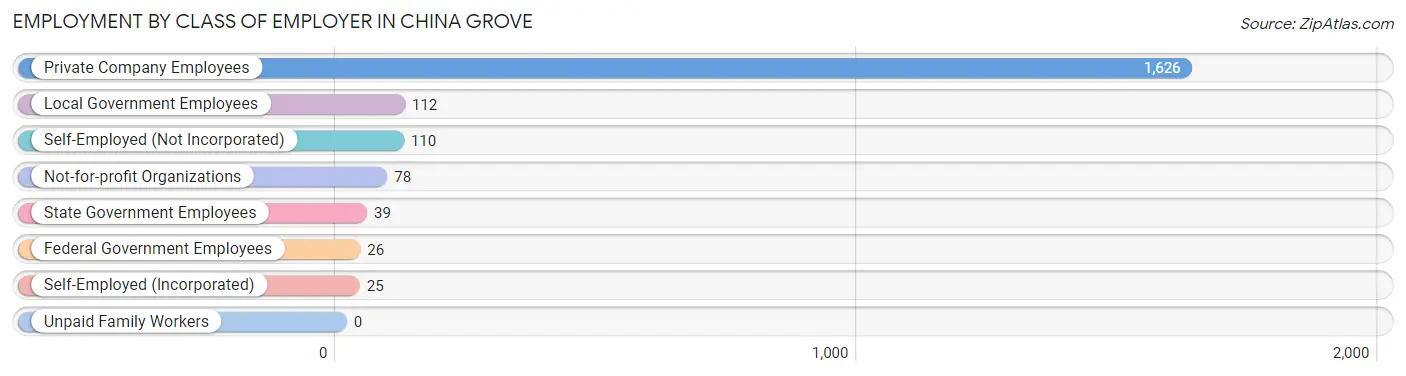
| Employer Class | # Employees | % Employees |
| Private Company Employees | 1,626 | 80.6% |
| Self-Employed (Incorporated) | 25 | 1.2% |
| Self-Employed (Not Incorporated) | 110 | 5.5% |
| Not-for-profit Organizations | 78 | 3.9% |
| Local Government Employees | 112 | 5.6% |
| State Government Employees | 39 | 1.9% |
| Federal Government Employees | 26 | 1.3% |
| Unpaid Family Workers | 0 | 0.0% |
| Total | 2,016 | 100.0% |
Employment Status by Age in China Grove
According to the labor force statistics for China Grove, out of the total population over 16 years of age (3,669), 61.3% or 2,249 individuals are in the labor force, with 8.3% or 187 of them unemployed. The age group with the highest labor force participation rate is 20 to 24 years, with 100.0% or 298 individuals in the labor force. Within the labor force, the 16 to 19 years age range has the highest percentage of unemployed individuals, with 85.3% or 133 of them being unemployed.
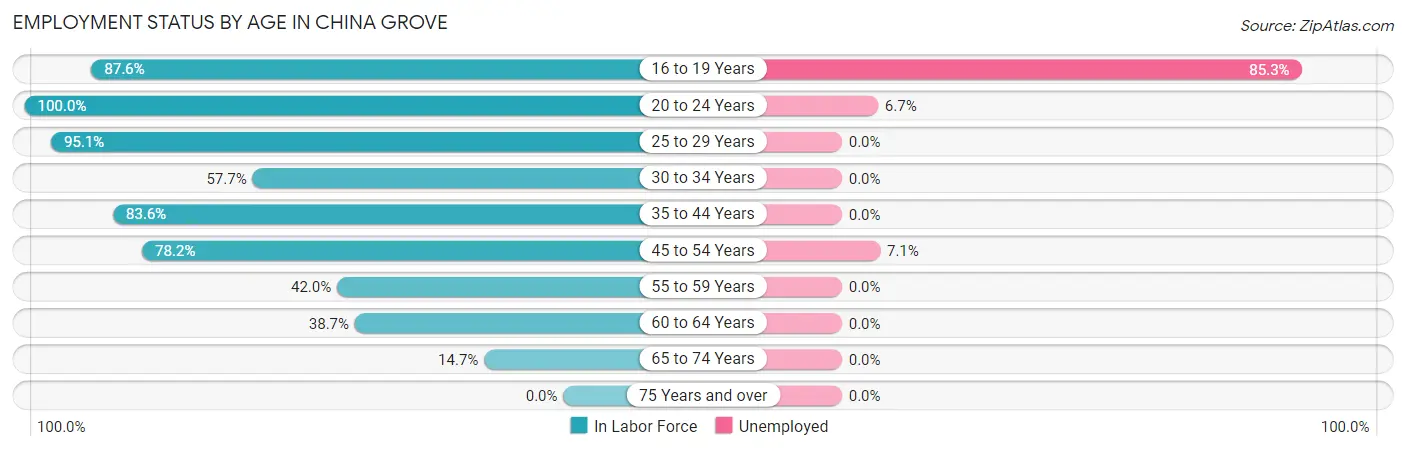
| Age Bracket | In Labor Force | Unemployed |
| 16 to 19 Years | 156 (87.6%) | 133 (85.3%) |
| 20 to 24 Years | 298 (100.0%) | 20 (6.7%) |
| 25 to 29 Years | 462 (95.1%) | 0 (0.0%) |
| 30 to 34 Years | 328 (57.7%) | 0 (0.0%) |
| 35 to 44 Years | 235 (83.6%) | 0 (0.0%) |
| 45 to 54 Years | 464 (78.2%) | 33 (7.1%) |
| 55 to 59 Years | 142 (42.0%) | 0 (0.0%) |
| 60 to 64 Years | 109 (38.7%) | 0 (0.0%) |
| 65 to 74 Years | 55 (14.7%) | 0 (0.0%) |
| 75 Years and over | 0 (0.0%) | 0 (0.0%) |
| Total | 2,249 (61.3%) | 187 (8.3%) |
Employment Status by Educational Attainment in China Grove
According to labor force statistics for China Grove, 68.3% of individuals (1,740) out of the total population between 25 and 64 years of age (2,548) are in the labor force, with 1.9% or 33 of them being unemployed. The group with the highest labor force participation rate are those with the educational attainment of college / associate degree, with 91.5% or 952 individuals in the labor force. Within the labor force, individuals with college / associate degree education have the highest percentage of unemployment, with 3.5% or 33 of them being unemployed.
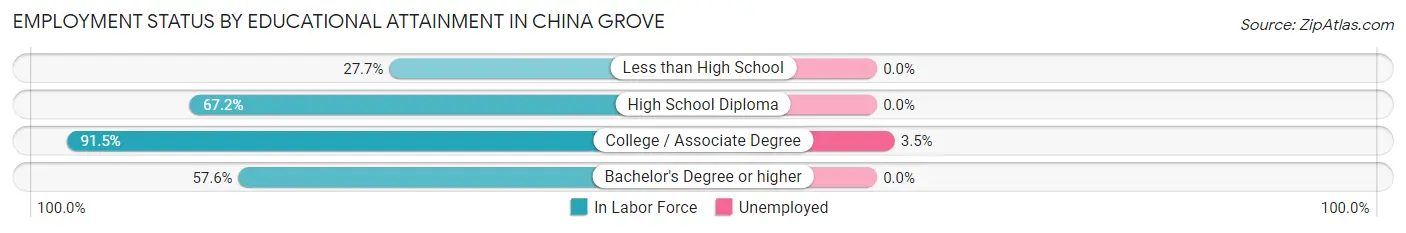
| Educational Attainment | In Labor Force | Unemployed |
| Less than High School | 139 (27.7%) | 0 (0.0%) |
| High School Diploma | 489 (67.2%) | 0 (0.0%) |
| College / Associate Degree | 952 (91.5%) | 36 (3.5%) |
| Bachelor's Degree or higher | 160 (57.6%) | 0 (0.0%) |
| Total | 1,740 (68.3%) | 48 (1.9%) |
Employment Occupations by Sex in China Grove
Management, Business, Science and Arts Occupations
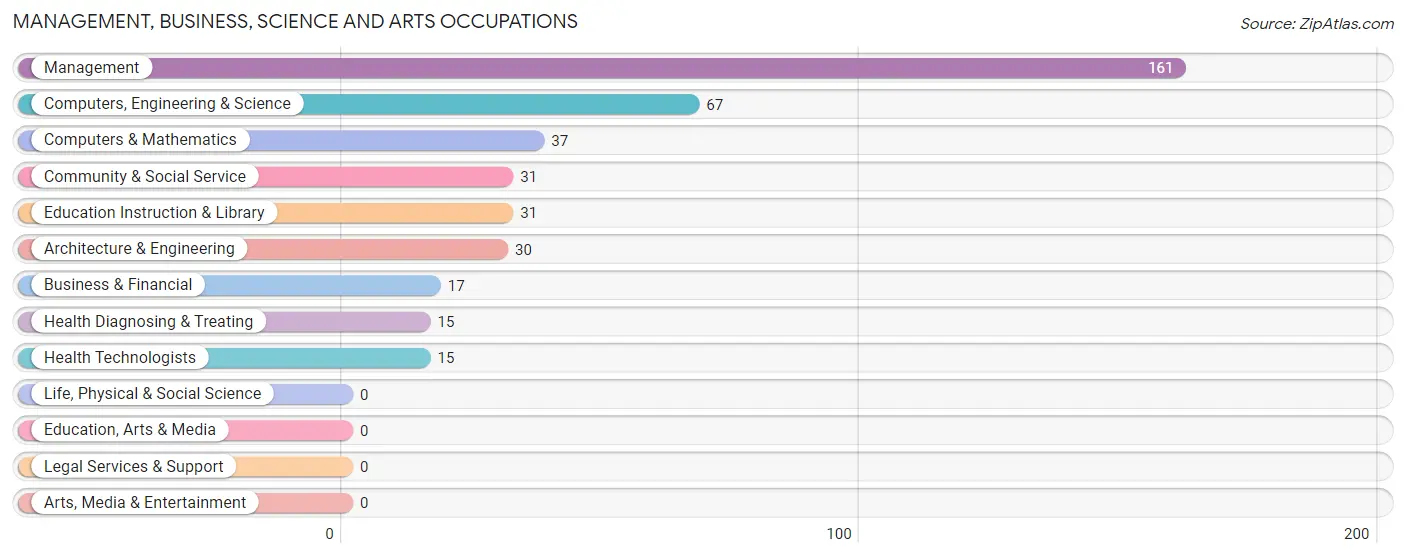
The most common Management, Business, Science and Arts occupations in China Grove are Management (161 | 7.8%), Computers, Engineering & Science (67 | 3.3%), Computers & Mathematics (37 | 1.8%), Community & Social Service (31 | 1.5%), and Education Instruction & Library (31 | 1.5%).
Management, Business, Science and Arts Occupations by Sex
Within the Management, Business, Science and Arts occupations in China Grove, the most male-oriented occupations are Computers & Mathematics (100.0%), Management (78.3%), and Computers, Engineering & Science (55.2%), while the most female-oriented occupations are Business & Financial (100.0%), Architecture & Engineering (100.0%), and Community & Social Service (100.0%).
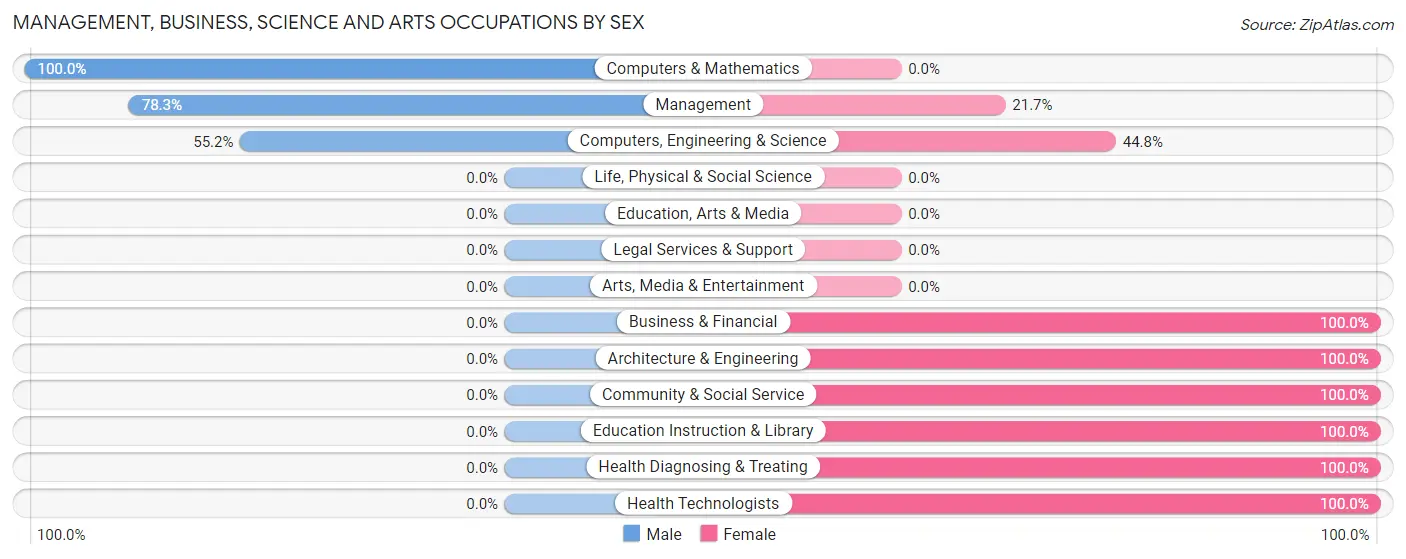
| Occupation | Male | Female |
| Management | 126 (78.3%) | 35 (21.7%) |
| Business & Financial | 0 (0.0%) | 17 (100.0%) |
| Computers, Engineering & Science | 37 (55.2%) | 30 (44.8%) |
| Computers & Mathematics | 37 (100.0%) | 0 (0.0%) |
| Architecture & Engineering | 0 (0.0%) | 30 (100.0%) |
| Life, Physical & Social Science | 0 (0.0%) | 0 (0.0%) |
| Community & Social Service | 0 (0.0%) | 31 (100.0%) |
| Education, Arts & Media | 0 (0.0%) | 0 (0.0%) |
| Legal Services & Support | 0 (0.0%) | 0 (0.0%) |
| Education Instruction & Library | 0 (0.0%) | 31 (100.0%) |
| Arts, Media & Entertainment | 0 (0.0%) | 0 (0.0%) |
| Health Diagnosing & Treating | 0 (0.0%) | 15 (100.0%) |
| Health Technologists | 0 (0.0%) | 15 (100.0%) |
| Total (Category) | 163 (56.0%) | 128 (44.0%) |
| Total (Overall) | 1,270 (61.6%) | 793 (38.4%) |
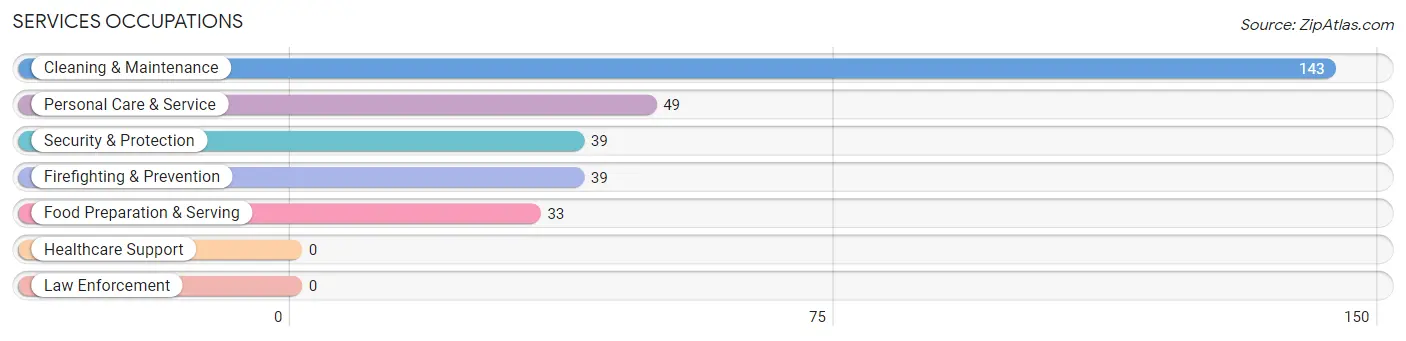
Services Occupations
The most common Services occupations in China Grove are Cleaning & Maintenance (143 | 6.9%), Personal Care & Service (49 | 2.4%), Security & Protection (39 | 1.9%), Firefighting & Prevention (39 | 1.9%), and Food Preparation & Serving (33 | 1.6%).
Services Occupations by Sex
Within the Services occupations in China Grove, the most male-oriented occupations are Security & Protection (100.0%), Firefighting & Prevention (100.0%), and Food Preparation & Serving (48.5%), while the most female-oriented occupations are Personal Care & Service (100.0%), Cleaning & Maintenance (86.7%), and Food Preparation & Serving (51.5%).
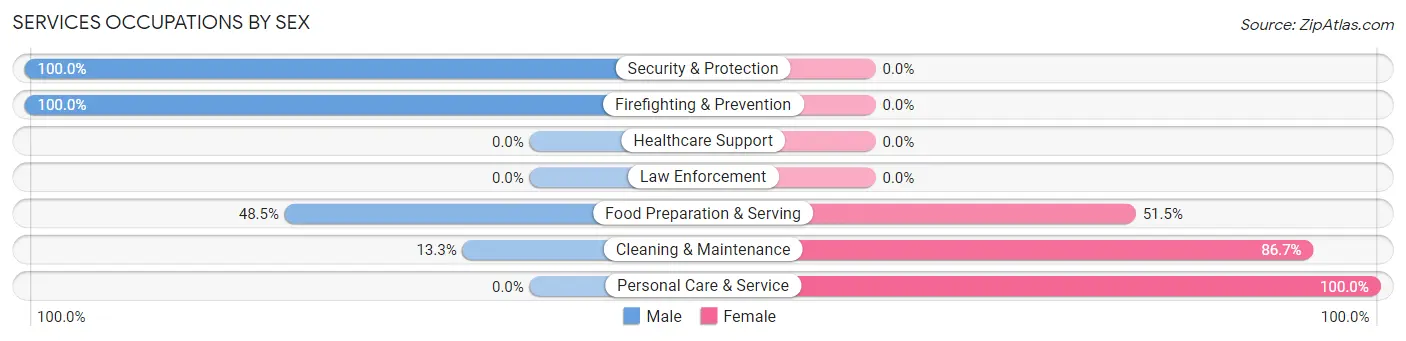
| Occupation | Male | Female |
| Healthcare Support | 0 (0.0%) | 0 (0.0%) |
| Security & Protection | 39 (100.0%) | 0 (0.0%) |
| Firefighting & Prevention | 39 (100.0%) | 0 (0.0%) |
| Law Enforcement | 0 (0.0%) | 0 (0.0%) |
| Food Preparation & Serving | 16 (48.5%) | 17 (51.5%) |
| Cleaning & Maintenance | 19 (13.3%) | 124 (86.7%) |
| Personal Care & Service | 0 (0.0%) | 49 (100.0%) |
| Total (Category) | 74 (28.0%) | 190 (72.0%) |
| Total (Overall) | 1,270 (61.6%) | 793 (38.4%) |
Sales and Office Occupations
The most common Sales and Office occupations in China Grove are Office & Administration (326 | 15.8%), and Sales & Related (140 | 6.8%).

Sales and Office Occupations by Sex

| Occupation | Male | Female |
| Sales & Related | 76 (54.3%) | 64 (45.7%) |
| Office & Administration | 51 (15.6%) | 275 (84.4%) |
| Total (Category) | 127 (27.3%) | 339 (72.8%) |
| Total (Overall) | 1,270 (61.6%) | 793 (38.4%) |
Natural Resources, Construction and Maintenance Occupations
The most common Natural Resources, Construction and Maintenance occupations in China Grove are Installation, Maintenance & Repair (336 | 16.3%), Construction & Extraction (116 | 5.6%), and Farming, Fishing & Forestry (21 | 1.0%).

Natural Resources, Construction and Maintenance Occupations by Sex
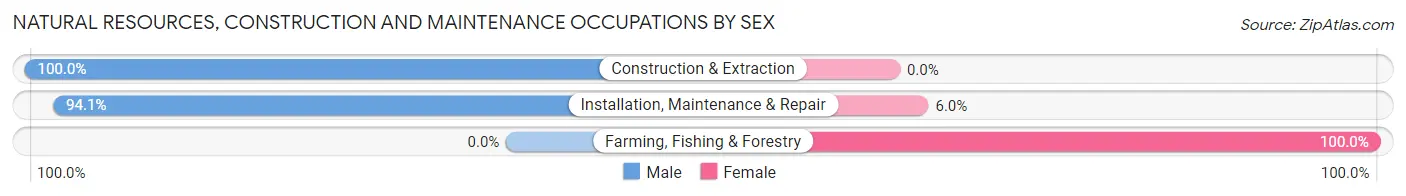
| Occupation | Male | Female |
| Farming, Fishing & Forestry | 0 (0.0%) | 21 (100.0%) |
| Construction & Extraction | 116 (100.0%) | 0 (0.0%) |
| Installation, Maintenance & Repair | 316 (94.1%) | 20 (5.9%) |
| Total (Category) | 432 (91.3%) | 41 (8.7%) |
| Total (Overall) | 1,270 (61.6%) | 793 (38.4%) |
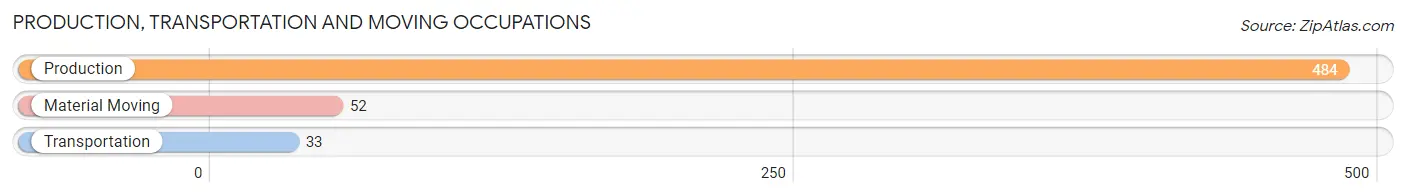
Production, Transportation and Moving Occupations
The most common Production, Transportation and Moving occupations in China Grove are Production (484 | 23.5%), Material Moving (52 | 2.5%), and Transportation (33 | 1.6%).
Production, Transportation and Moving Occupations by Sex
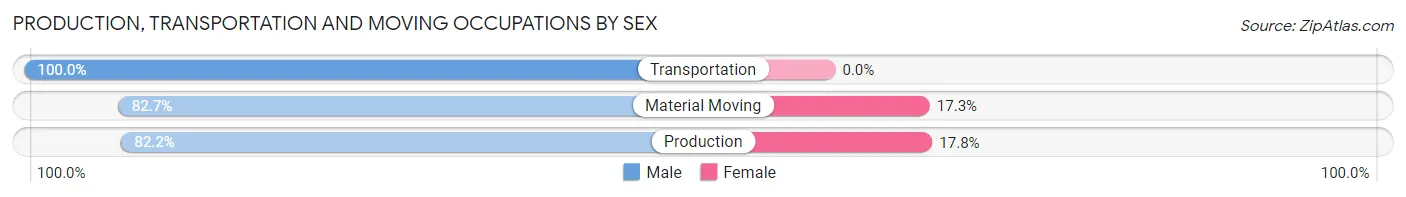
| Occupation | Male | Female |
| Production | 398 (82.2%) | 86 (17.8%) |
| Transportation | 33 (100.0%) | 0 (0.0%) |
| Material Moving | 43 (82.7%) | 9 (17.3%) |
| Total (Category) | 474 (83.3%) | 95 (16.7%) |
| Total (Overall) | 1,270 (61.6%) | 793 (38.4%) |
Employment Industries by Sex in China Grove
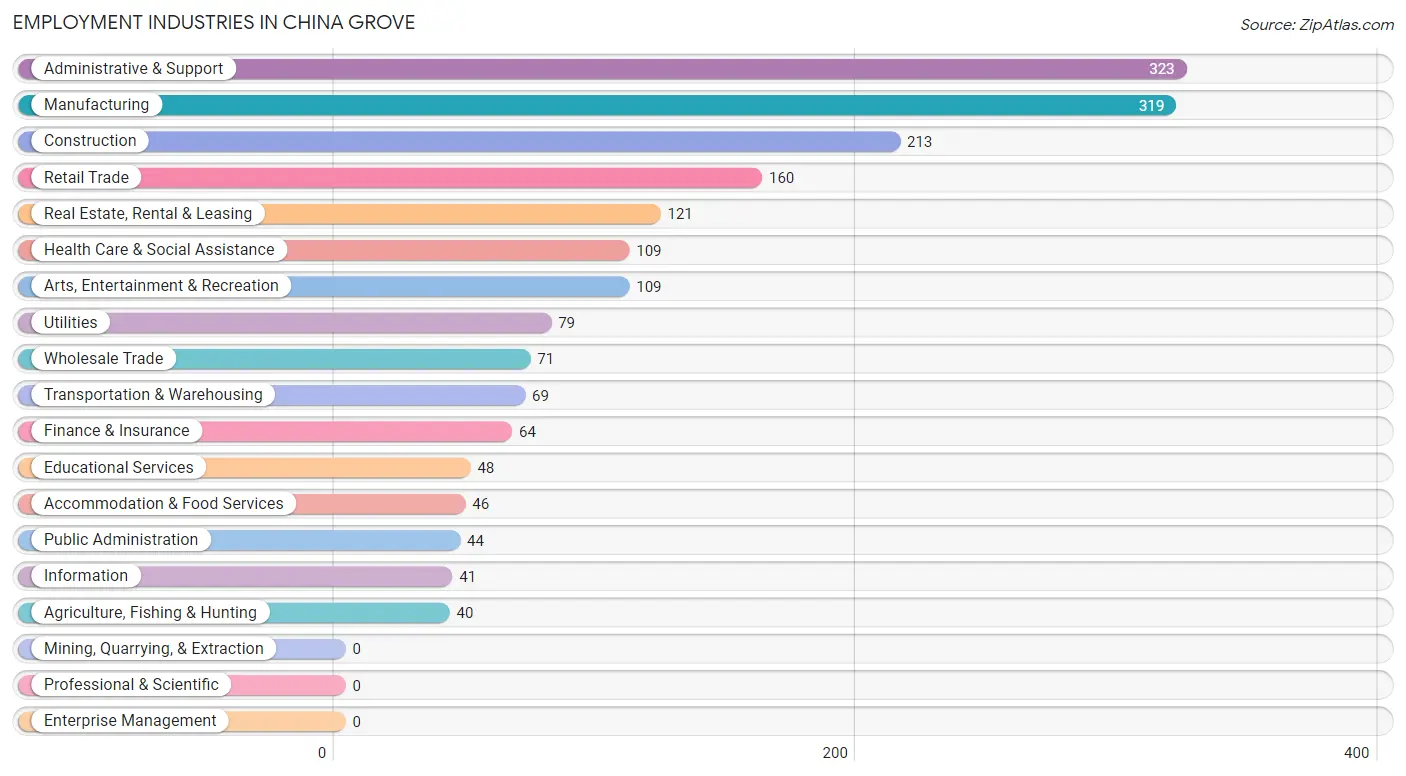
Employment Industries in China Grove
The major employment industries in China Grove include Administrative & Support (323 | 15.7%), Manufacturing (319 | 15.5%), Construction (213 | 10.3%), Retail Trade (160 | 7.8%), and Real Estate, Rental & Leasing (121 | 5.9%).
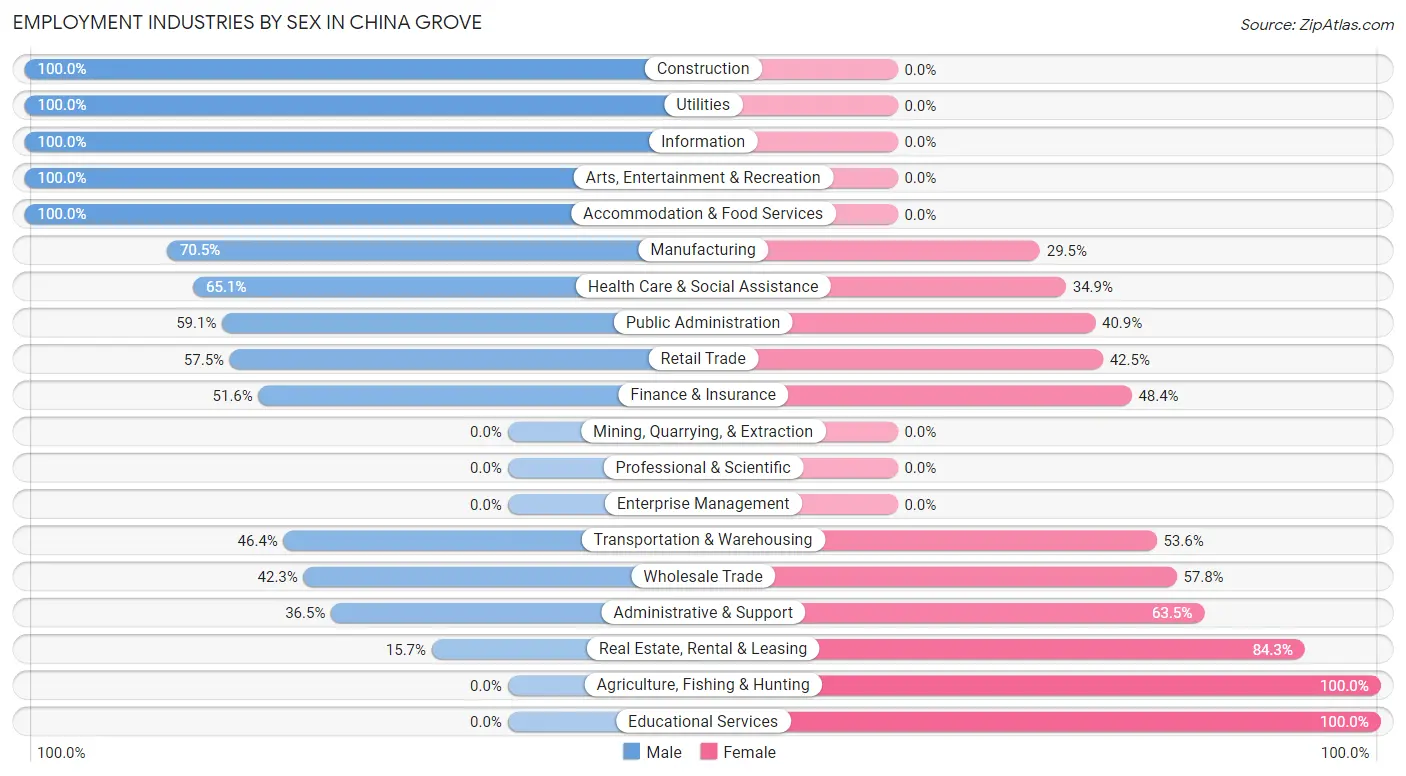
Employment Industries by Sex in China Grove
The China Grove industries that see more men than women are Construction (100.0%), Utilities (100.0%), and Information (100.0%), whereas the industries that tend to have a higher number of women are Agriculture, Fishing & Hunting (100.0%), Educational Services (100.0%), and Real Estate, Rental & Leasing (84.3%).
| Industry | Male | Female |
| Agriculture, Fishing & Hunting | 0 (0.0%) | 40 (100.0%) |
| Mining, Quarrying, & Extraction | 0 (0.0%) | 0 (0.0%) |
| Construction | 213 (100.0%) | 0 (0.0%) |
| Manufacturing | 225 (70.5%) | 94 (29.5%) |
| Wholesale Trade | 30 (42.2%) | 41 (57.8%) |
| Retail Trade | 92 (57.5%) | 68 (42.5%) |
| Transportation & Warehousing | 32 (46.4%) | 37 (53.6%) |
| Utilities | 79 (100.0%) | 0 (0.0%) |
| Information | 41 (100.0%) | 0 (0.0%) |
| Finance & Insurance | 33 (51.6%) | 31 (48.4%) |
| Real Estate, Rental & Leasing | 19 (15.7%) | 102 (84.3%) |
| Professional & Scientific | 0 (0.0%) | 0 (0.0%) |
| Enterprise Management | 0 (0.0%) | 0 (0.0%) |
| Administrative & Support | 118 (36.5%) | 205 (63.5%) |
| Educational Services | 0 (0.0%) | 48 (100.0%) |
| Health Care & Social Assistance | 71 (65.1%) | 38 (34.9%) |
| Arts, Entertainment & Recreation | 109 (100.0%) | 0 (0.0%) |
| Accommodation & Food Services | 46 (100.0%) | 0 (0.0%) |
| Public Administration | 26 (59.1%) | 18 (40.9%) |
| Total | 1,270 (61.6%) | 793 (38.4%) |
Education in China Grove
School Enrollment in China Grove
The most common levels of schooling among the 899 students in China Grove are middle school (266 | 29.6%), elementary school (131 | 14.6%), and college / undergraduate (130 | 14.5%).
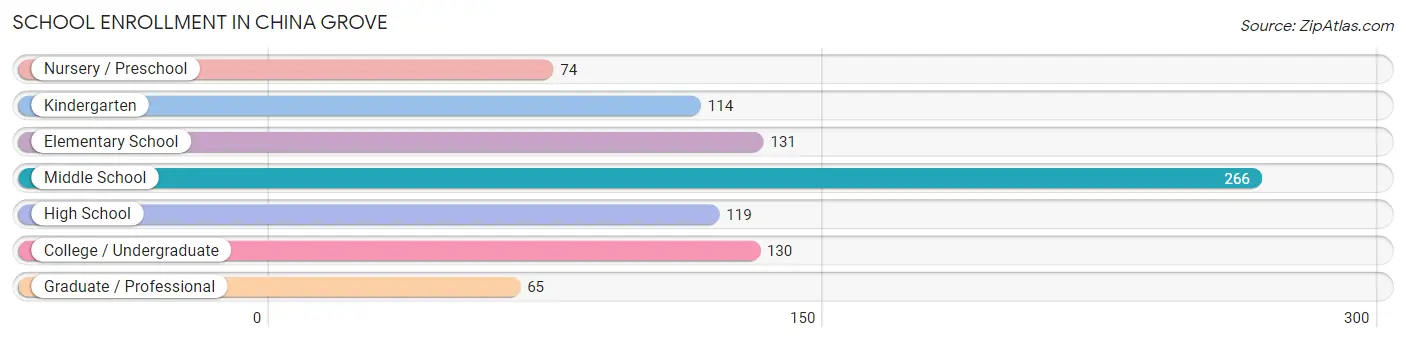
| School Level | # Students | % Students |
| Nursery / Preschool | 74 | 8.2% |
| Kindergarten | 114 | 12.7% |
| Elementary School | 131 | 14.6% |
| Middle School | 266 | 29.6% |
| High School | 119 | 13.2% |
| College / Undergraduate | 130 | 14.5% |
| Graduate / Professional | 65 | 7.2% |
| Total | 899 | 100.0% |
School Enrollment by Age by Funding Source in China Grove
Out of a total of 899 students who are enrolled in schools in China Grove, 134 (14.9%) attend a private institution, while the remaining 765 (85.1%) are enrolled in public schools. The age group of 35 years and over has the highest likelihood of being enrolled in private schools, with 46 (100.0% in the age bracket) enrolled. Conversely, the age group of 5 to 9 year old has the lowest likelihood of being enrolled in a private school, with 227 (100.0% in the age bracket) attending a public institution.
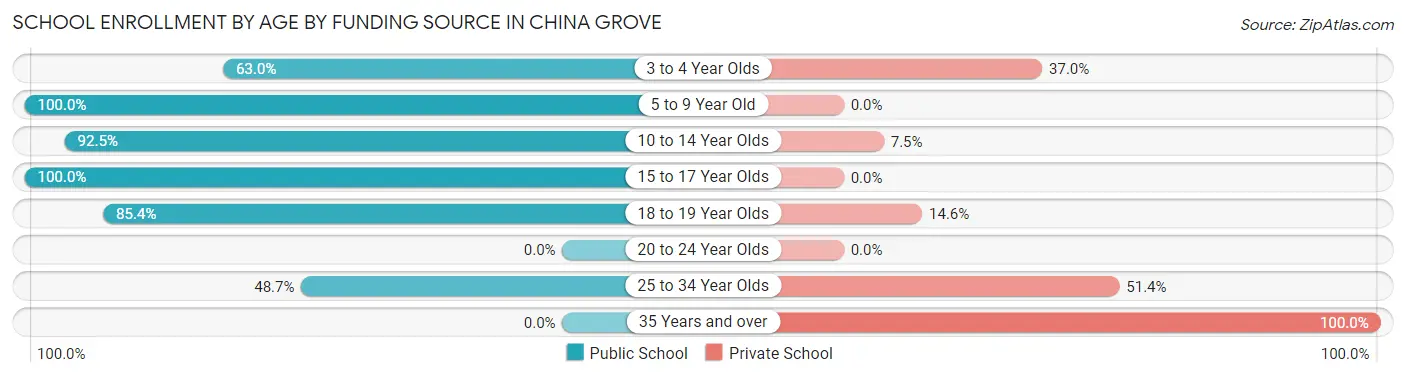
| Age Bracket | Public School | Private School |
| 3 to 4 Year Olds | 29 (63.0%) | 17 (37.0%) |
| 5 to 9 Year Old | 227 (100.0%) | 0 (0.0%) |
| 10 to 14 Year Olds | 322 (92.5%) | 26 (7.5%) |
| 15 to 17 Year Olds | 17 (100.0%) | 0 (0.0%) |
| 18 to 19 Year Olds | 152 (85.4%) | 26 (14.6%) |
| 20 to 24 Year Olds | 0 (0.0%) | 0 (0.0%) |
| 25 to 34 Year Olds | 18 (48.6%) | 19 (51.3%) |
| 35 Years and over | 0 (0.0%) | 46 (100.0%) |
| Total | 765 (85.1%) | 134 (14.9%) |
Educational Attainment by Field of Study in China Grove
Social sciences (91 | 18.2%), computers & mathematics (74 | 14.8%), business (73 | 14.6%), education (67 | 13.4%), and visual & performing arts (67 | 13.4%) are the most common fields of study among 501 individuals in China Grove who have obtained a bachelor's degree or higher.
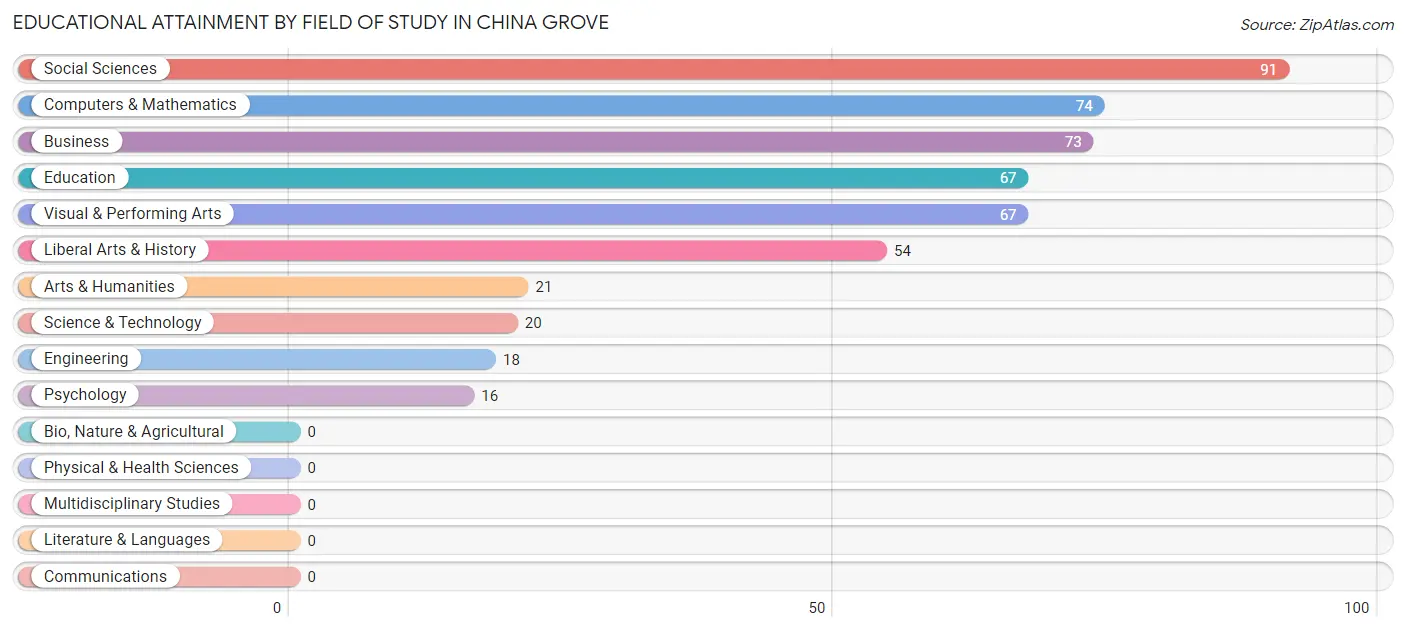
| Field of Study | # Graduates | % Graduates |
| Computers & Mathematics | 74 | 14.8% |
| Bio, Nature & Agricultural | 0 | 0.0% |
| Physical & Health Sciences | 0 | 0.0% |
| Psychology | 16 | 3.2% |
| Social Sciences | 91 | 18.2% |
| Engineering | 18 | 3.6% |
| Multidisciplinary Studies | 0 | 0.0% |
| Science & Technology | 20 | 4.0% |
| Business | 73 | 14.6% |
| Education | 67 | 13.4% |
| Literature & Languages | 0 | 0.0% |
| Liberal Arts & History | 54 | 10.8% |
| Visual & Performing Arts | 67 | 13.4% |
| Communications | 0 | 0.0% |
| Arts & Humanities | 21 | 4.2% |
| Total | 501 | 100.0% |
Transportation & Commute in China Grove
Vehicle Availability by Sex in China Grove
The most prevalent vehicle ownership categories in China Grove are males with 2 vehicles (520, accounting for 41.4%) and females with 2 vehicles (451, making up 68.4%).
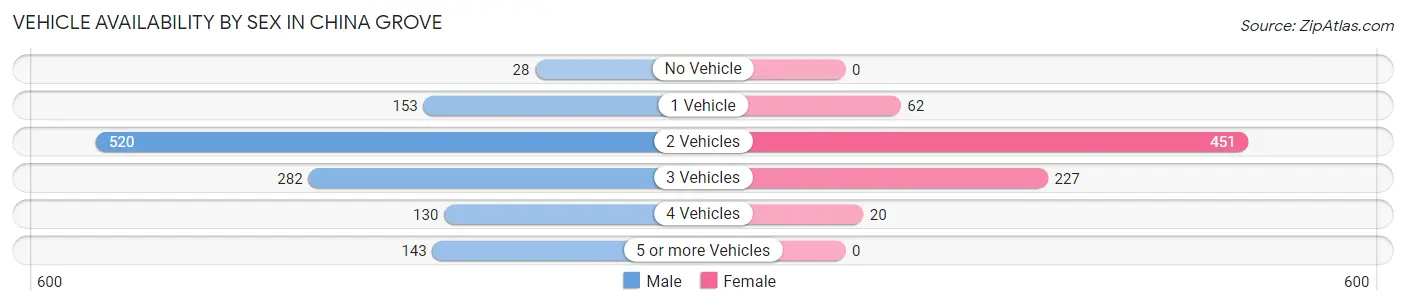
| Vehicles Available | Male | Female |
| No Vehicle | 28 (2.2%) | 0 (0.0%) |
| 1 Vehicle | 153 (12.2%) | 62 (8.2%) |
| 2 Vehicles | 520 (41.4%) | 451 (59.3%) |
| 3 Vehicles | 282 (22.5%) | 227 (29.9%) |
| 4 Vehicles | 130 (10.3%) | 20 (2.6%) |
| 5 or more Vehicles | 143 (11.4%) | 0 (0.0%) |
| Total | 1,256 (100.0%) | 760 (100.0%) |
Commute Time in China Grove
The most frequently occuring commute durations in China Grove are 30 to 34 minutes (502 commuters, 26.7%), 20 to 24 minutes (342 commuters, 18.2%), and 25 to 29 minutes (269 commuters, 14.3%).
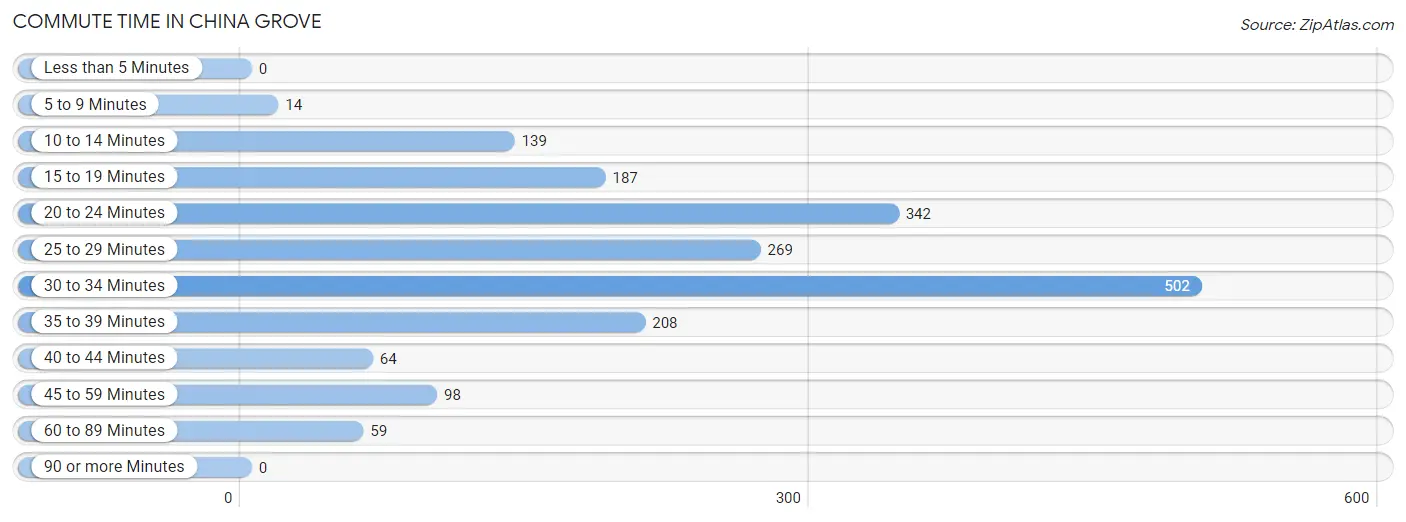
| Commute Time | # Commuters | % Commuters |
| Less than 5 Minutes | 0 | 0.0% |
| 5 to 9 Minutes | 14 | 0.7% |
| 10 to 14 Minutes | 139 | 7.4% |
| 15 to 19 Minutes | 187 | 9.9% |
| 20 to 24 Minutes | 342 | 18.2% |
| 25 to 29 Minutes | 269 | 14.3% |
| 30 to 34 Minutes | 502 | 26.7% |
| 35 to 39 Minutes | 208 | 11.1% |
| 40 to 44 Minutes | 64 | 3.4% |
| 45 to 59 Minutes | 98 | 5.2% |
| 60 to 89 Minutes | 59 | 3.1% |
| 90 or more Minutes | 0 | 0.0% |
Commute Time by Sex in China Grove
The most common commute times in China Grove are 30 to 34 minutes (358 commuters, 30.6%) for males and 25 to 29 minutes (174 commuters, 24.5%) for females.
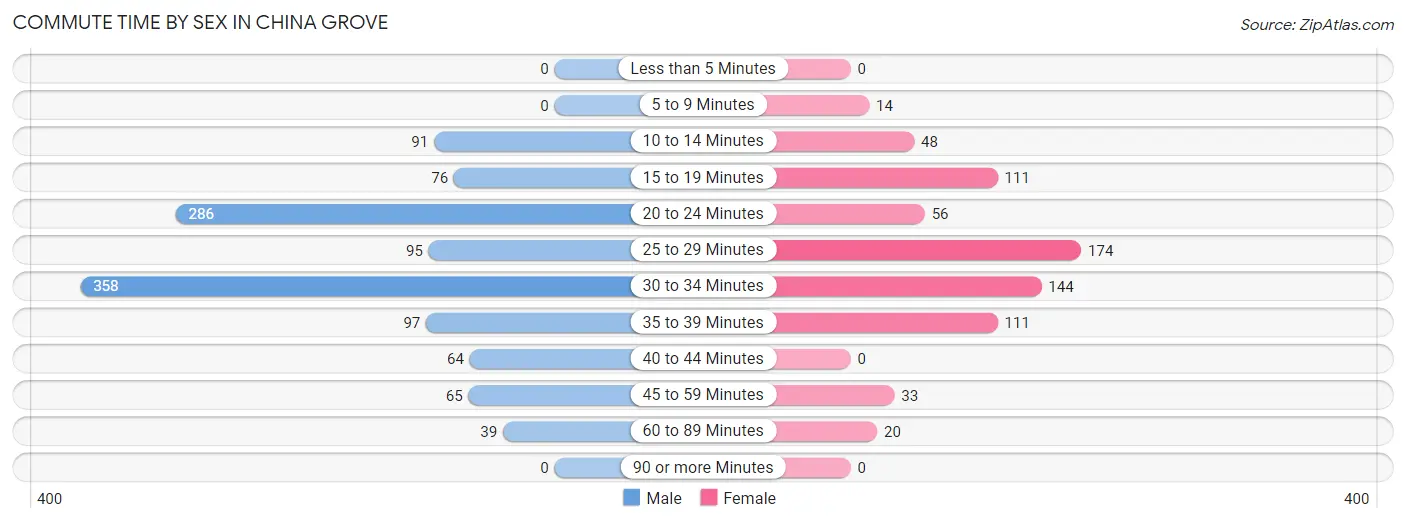
| Commute Time | Male | Female |
| Less than 5 Minutes | 0 (0.0%) | 0 (0.0%) |
| 5 to 9 Minutes | 0 (0.0%) | 14 (2.0%) |
| 10 to 14 Minutes | 91 (7.8%) | 48 (6.8%) |
| 15 to 19 Minutes | 76 (6.5%) | 111 (15.6%) |
| 20 to 24 Minutes | 286 (24.4%) | 56 (7.9%) |
| 25 to 29 Minutes | 95 (8.1%) | 174 (24.5%) |
| 30 to 34 Minutes | 358 (30.6%) | 144 (20.3%) |
| 35 to 39 Minutes | 97 (8.3%) | 111 (15.6%) |
| 40 to 44 Minutes | 64 (5.5%) | 0 (0.0%) |
| 45 to 59 Minutes | 65 (5.6%) | 33 (4.6%) |
| 60 to 89 Minutes | 39 (3.3%) | 20 (2.8%) |
| 90 or more Minutes | 0 (0.0%) | 0 (0.0%) |
Time of Departure to Work by Sex in China Grove
The most frequent times of departure to work in China Grove are 6:30 AM to 6:59 AM (247, 21.1%) for males and 7:00 AM to 7:29 AM (361, 50.8%) for females.
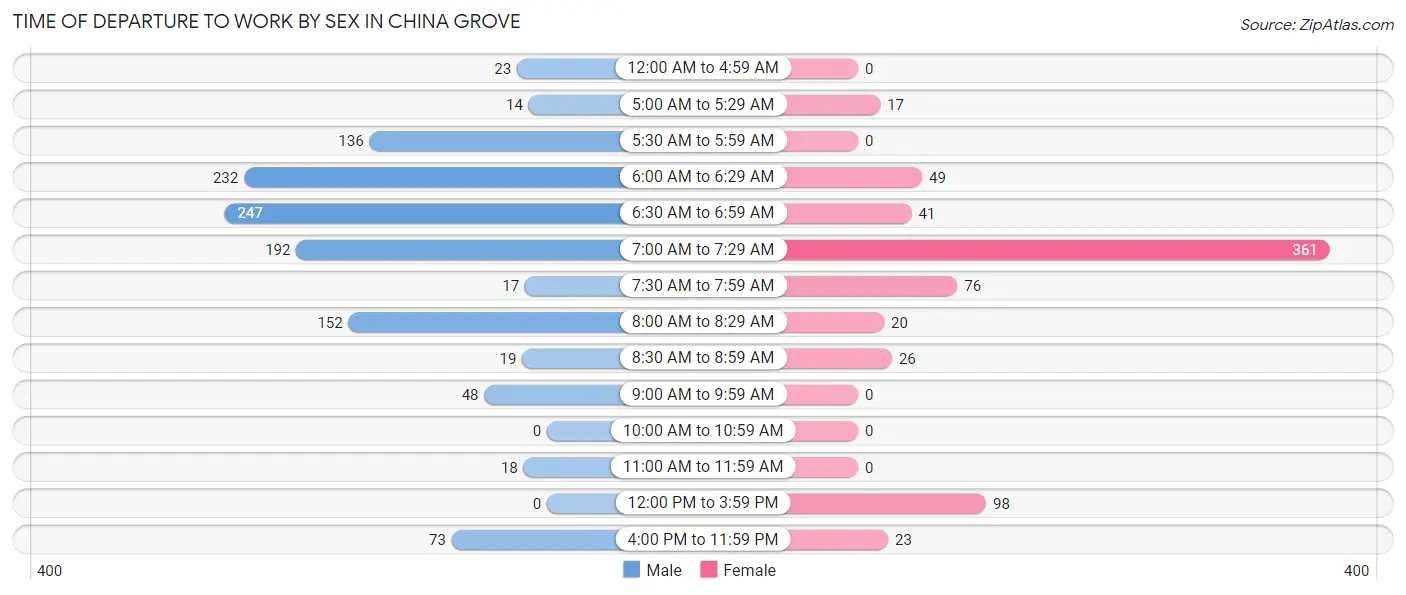
| Time of Departure | Male | Female |
| 12:00 AM to 4:59 AM | 23 (2.0%) | 0 (0.0%) |
| 5:00 AM to 5:29 AM | 14 (1.2%) | 17 (2.4%) |
| 5:30 AM to 5:59 AM | 136 (11.6%) | 0 (0.0%) |
| 6:00 AM to 6:29 AM | 232 (19.8%) | 49 (6.9%) |
| 6:30 AM to 6:59 AM | 247 (21.1%) | 41 (5.8%) |
| 7:00 AM to 7:29 AM | 192 (16.4%) | 361 (50.8%) |
| 7:30 AM to 7:59 AM | 17 (1.5%) | 76 (10.7%) |
| 8:00 AM to 8:29 AM | 152 (13.0%) | 20 (2.8%) |
| 8:30 AM to 8:59 AM | 19 (1.6%) | 26 (3.7%) |
| 9:00 AM to 9:59 AM | 48 (4.1%) | 0 (0.0%) |
| 10:00 AM to 10:59 AM | 0 (0.0%) | 0 (0.0%) |
| 11:00 AM to 11:59 AM | 18 (1.5%) | 0 (0.0%) |
| 12:00 PM to 3:59 PM | 0 (0.0%) | 98 (13.8%) |
| 4:00 PM to 11:59 PM | 73 (6.2%) | 23 (3.2%) |
| Total | 1,171 (100.0%) | 711 (100.0%) |
Housing Occupancy in China Grove
Occupancy by Ownership in China Grove
Of the total 2,006 dwellings in China Grove, owner-occupied units account for 1,359 (67.7%), while renter-occupied units make up 647 (32.3%).
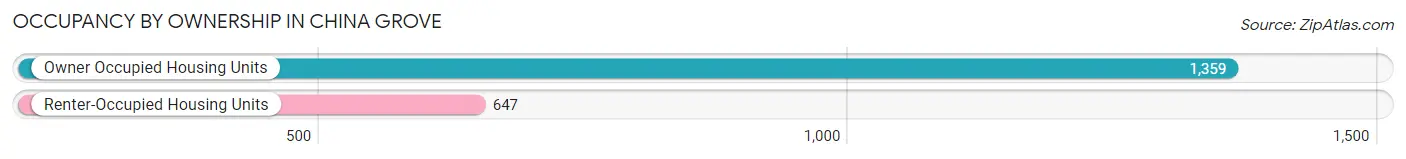
| Occupancy | # Housing Units | % Housing Units |
| Owner Occupied Housing Units | 1,359 | 67.7% |
| Renter-Occupied Housing Units | 647 | 32.3% |
| Total Occupied Housing Units | 2,006 | 100.0% |
Occupancy by Household Size in China Grove
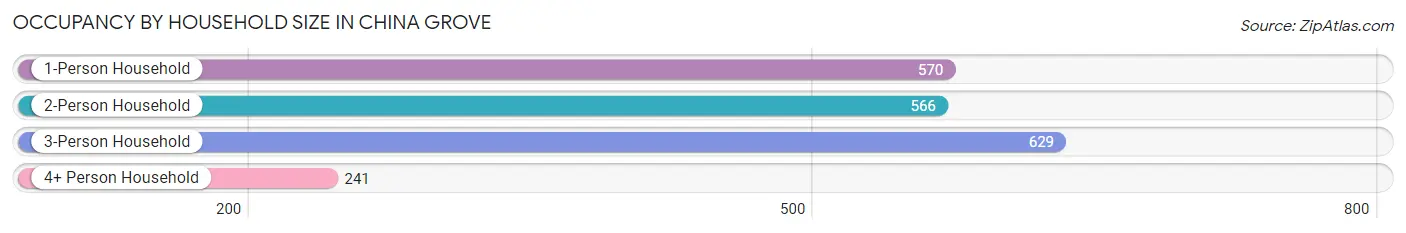
| Household Size | # Housing Units | % Housing Units |
| 1-Person Household | 570 | 28.4% |
| 2-Person Household | 566 | 28.2% |
| 3-Person Household | 629 | 31.4% |
| 4+ Person Household | 241 | 12.0% |
| Total Housing Units | 2,006 | 100.0% |
Occupancy by Ownership by Household Size in China Grove
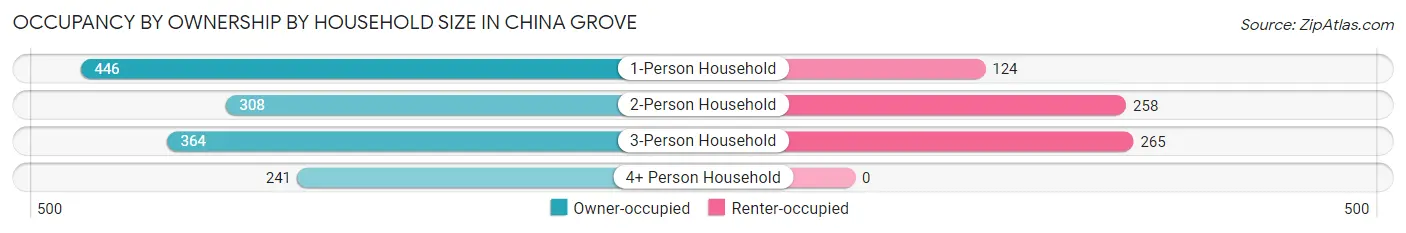
| Household Size | Owner-occupied | Renter-occupied |
| 1-Person Household | 446 (78.2%) | 124 (21.7%) |
| 2-Person Household | 308 (54.4%) | 258 (45.6%) |
| 3-Person Household | 364 (57.9%) | 265 (42.1%) |
| 4+ Person Household | 241 (100.0%) | 0 (0.0%) |
| Total Housing Units | 1,359 (67.7%) | 647 (32.3%) |
Occupancy by Educational Attainment in China Grove
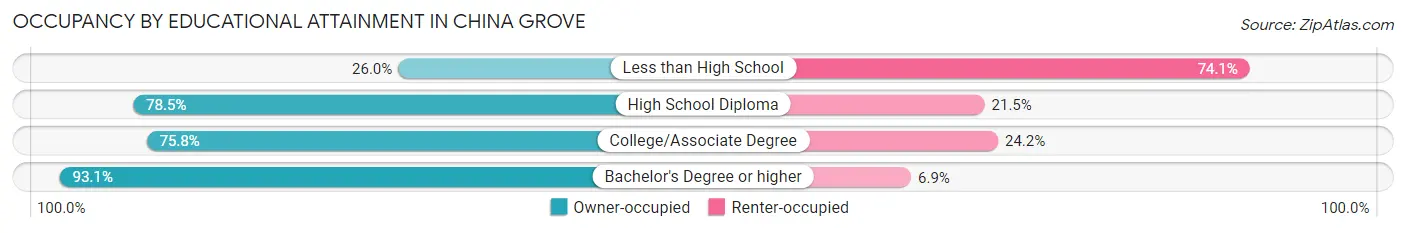
| Household Size | Owner-occupied | Renter-occupied |
| Less than High School | 116 (26.0%) | 331 (74.1%) |
| High School Diploma | 398 (78.5%) | 109 (21.5%) |
| College/Associate Degree | 590 (75.8%) | 188 (24.2%) |
| Bachelor's Degree or higher | 255 (93.1%) | 19 (6.9%) |
Occupancy by Age of Householder in China Grove
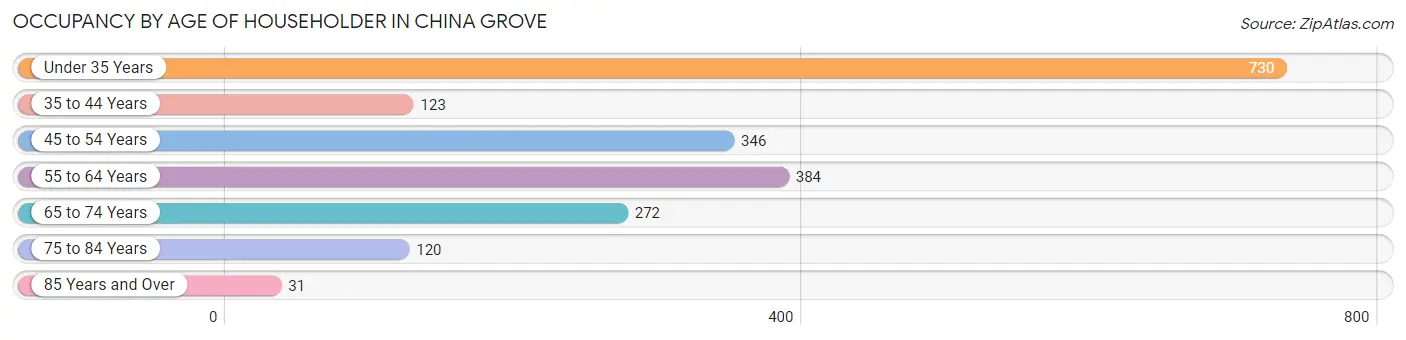
| Age Bracket | # Households | % Households |
| Under 35 Years | 730 | 36.4% |
| 35 to 44 Years | 123 | 6.1% |
| 45 to 54 Years | 346 | 17.2% |
| 55 to 64 Years | 384 | 19.1% |
| 65 to 74 Years | 272 | 13.6% |
| 75 to 84 Years | 120 | 6.0% |
| 85 Years and Over | 31 | 1.5% |
| Total | 2,006 | 100.0% |
Housing Finances in China Grove
Median Income by Occupancy in China Grove
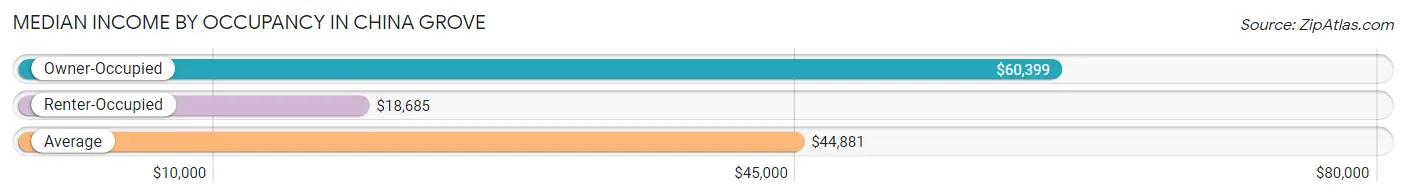
| Occupancy Type | # Households | Median Income |
| Owner-Occupied | 1,359 (67.7%) | $60,399 |
| Renter-Occupied | 647 (32.3%) | $18,685 |
| Average | 2,006 (100.0%) | $44,881 |
Occupancy by Householder Income Bracket in China Grove
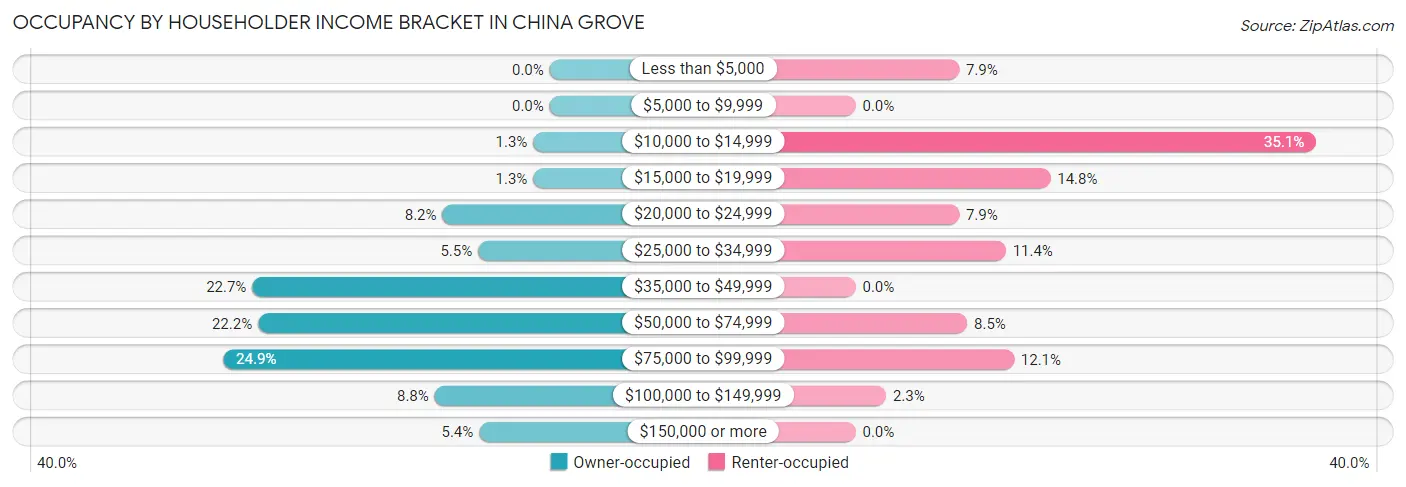
| Income Bracket | Owner-occupied | Renter-occupied |
| Less than $5,000 | 0 (0.0%) | 51 (7.9%) |
| $5,000 to $9,999 | 0 (0.0%) | 0 (0.0%) |
| $10,000 to $14,999 | 17 (1.3%) | 227 (35.1%) |
| $15,000 to $19,999 | 17 (1.3%) | 96 (14.8%) |
| $20,000 to $24,999 | 111 (8.2%) | 51 (7.9%) |
| $25,000 to $34,999 | 74 (5.4%) | 74 (11.4%) |
| $35,000 to $49,999 | 308 (22.7%) | 0 (0.0%) |
| $50,000 to $74,999 | 302 (22.2%) | 55 (8.5%) |
| $75,000 to $99,999 | 338 (24.9%) | 78 (12.1%) |
| $100,000 to $149,999 | 119 (8.8%) | 15 (2.3%) |
| $150,000 or more | 73 (5.4%) | 0 (0.0%) |
| Total | 1,359 (100.0%) | 647 (100.0%) |
Monthly Housing Cost Tiers in China Grove
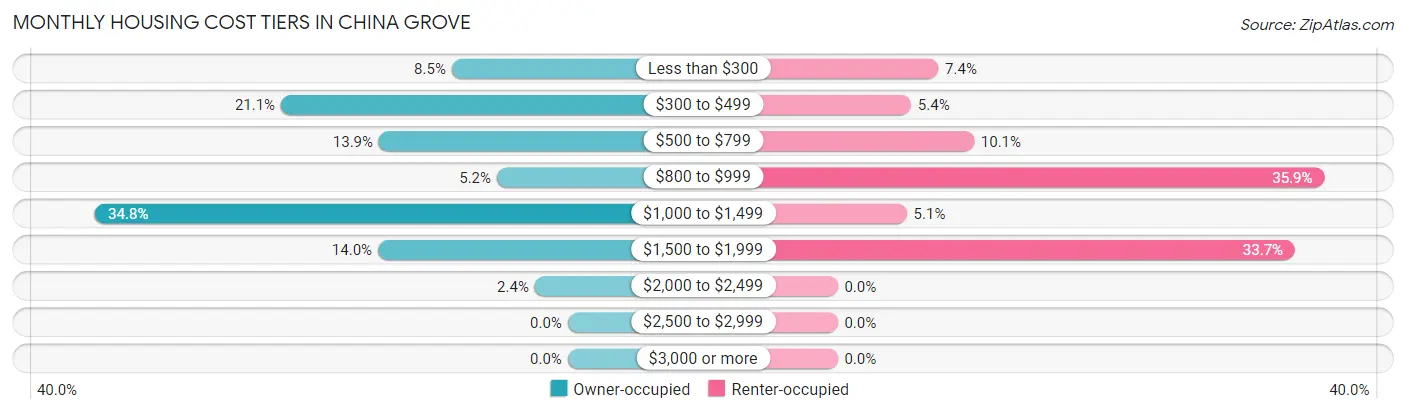
| Monthly Cost | Owner-occupied | Renter-occupied |
| Less than $300 | 116 (8.5%) | 48 (7.4%) |
| $300 to $499 | 287 (21.1%) | 35 (5.4%) |
| $500 to $799 | 189 (13.9%) | 65 (10.1%) |
| $800 to $999 | 71 (5.2%) | 232 (35.9%) |
| $1,000 to $1,499 | 473 (34.8%) | 33 (5.1%) |
| $1,500 to $1,999 | 190 (14.0%) | 218 (33.7%) |
| $2,000 to $2,499 | 33 (2.4%) | 0 (0.0%) |
| $2,500 to $2,999 | 0 (0.0%) | 0 (0.0%) |
| $3,000 or more | 0 (0.0%) | 0 (0.0%) |
| Total | 1,359 (100.0%) | 647 (100.0%) |
Physical Housing Characteristics in China Grove
Housing Structures in China Grove
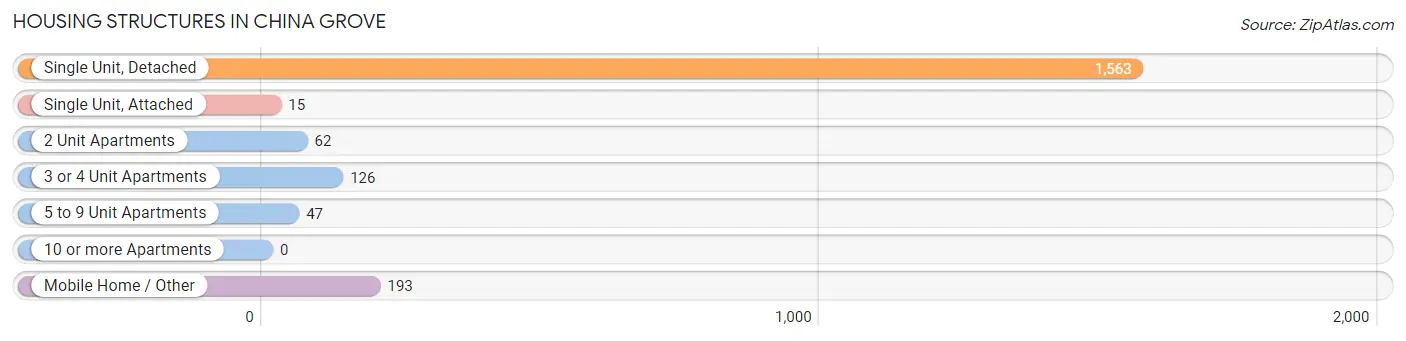
| Structure Type | # Housing Units | % Housing Units |
| Single Unit, Detached | 1,563 | 77.9% |
| Single Unit, Attached | 15 | 0.7% |
| 2 Unit Apartments | 62 | 3.1% |
| 3 or 4 Unit Apartments | 126 | 6.3% |
| 5 to 9 Unit Apartments | 47 | 2.3% |
| 10 or more Apartments | 0 | 0.0% |
| Mobile Home / Other | 193 | 9.6% |
| Total | 2,006 | 100.0% |
Housing Structures by Occupancy in China Grove
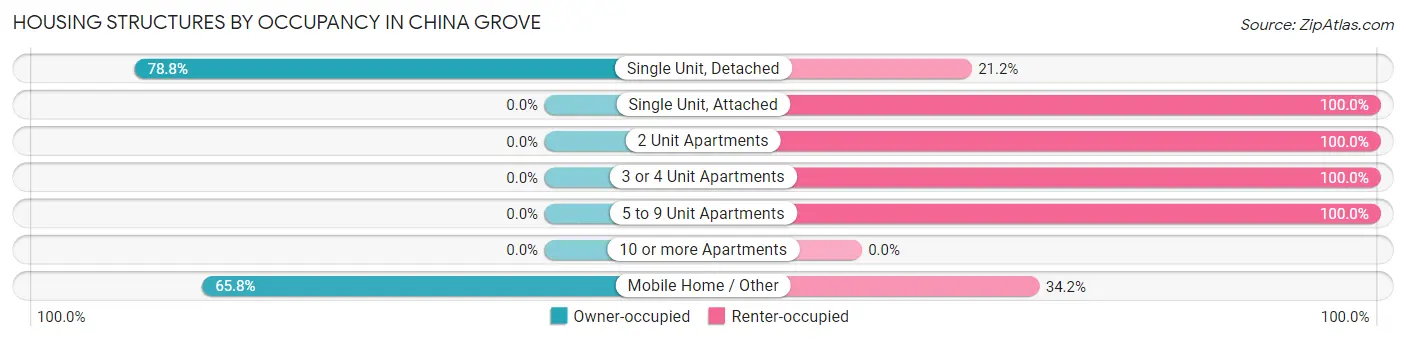
| Structure Type | Owner-occupied | Renter-occupied |
| Single Unit, Detached | 1,232 (78.8%) | 331 (21.2%) |
| Single Unit, Attached | 0 (0.0%) | 15 (100.0%) |
| 2 Unit Apartments | 0 (0.0%) | 62 (100.0%) |
| 3 or 4 Unit Apartments | 0 (0.0%) | 126 (100.0%) |
| 5 to 9 Unit Apartments | 0 (0.0%) | 47 (100.0%) |
| 10 or more Apartments | 0 (0.0%) | 0 (0.0%) |
| Mobile Home / Other | 127 (65.8%) | 66 (34.2%) |
| Total | 1,359 (67.7%) | 647 (32.3%) |
Housing Structures by Number of Rooms in China Grove
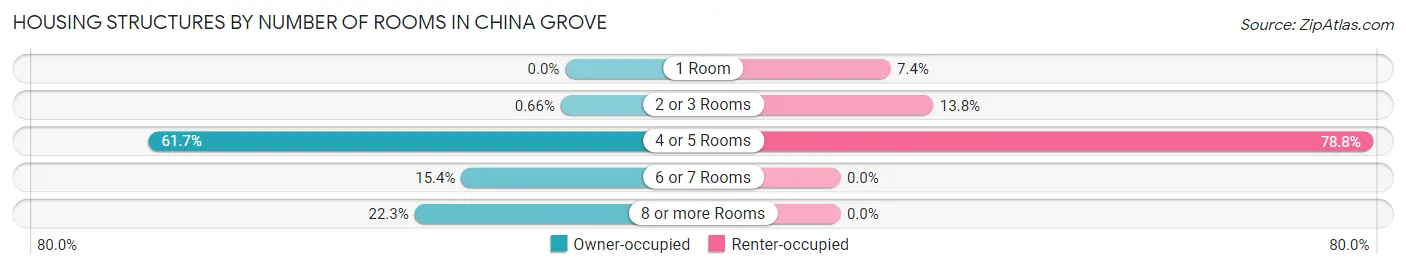
| Number of Rooms | Owner-occupied | Renter-occupied |
| 1 Room | 0 (0.0%) | 48 (7.4%) |
| 2 or 3 Rooms | 9 (0.7%) | 89 (13.8%) |
| 4 or 5 Rooms | 838 (61.7%) | 510 (78.8%) |
| 6 or 7 Rooms | 209 (15.4%) | 0 (0.0%) |
| 8 or more Rooms | 303 (22.3%) | 0 (0.0%) |
| Total | 1,359 (100.0%) | 647 (100.0%) |
Housing Structure by Heating Type in China Grove
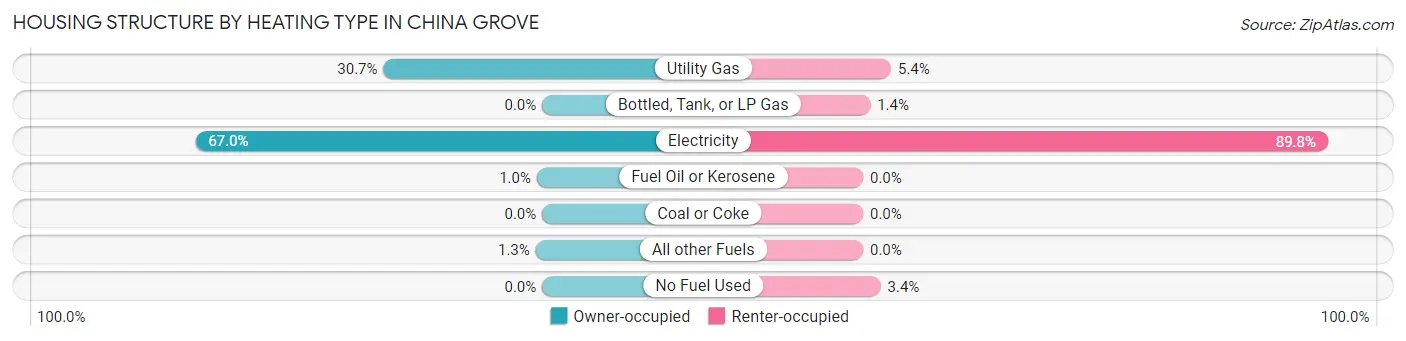
| Heating Type | Owner-occupied | Renter-occupied |
| Utility Gas | 417 (30.7%) | 35 (5.4%) |
| Bottled, Tank, or LP Gas | 0 (0.0%) | 9 (1.4%) |
| Electricity | 911 (67.0%) | 581 (89.8%) |
| Fuel Oil or Kerosene | 14 (1.0%) | 0 (0.0%) |
| Coal or Coke | 0 (0.0%) | 0 (0.0%) |
| All other Fuels | 17 (1.3%) | 0 (0.0%) |
| No Fuel Used | 0 (0.0%) | 22 (3.4%) |
| Total | 1,359 (100.0%) | 647 (100.0%) |
Household Vehicle Usage in China Grove
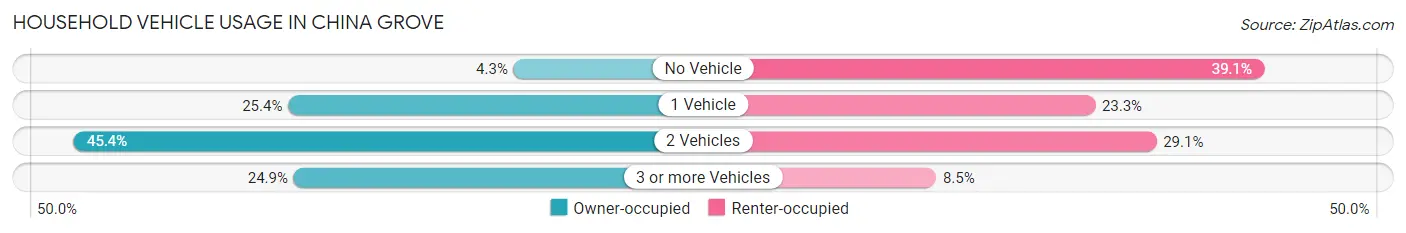
| Vehicles per Household | Owner-occupied | Renter-occupied |
| No Vehicle | 59 (4.3%) | 253 (39.1%) |
| 1 Vehicle | 345 (25.4%) | 151 (23.3%) |
| 2 Vehicles | 617 (45.4%) | 188 (29.1%) |
| 3 or more Vehicles | 338 (24.9%) | 55 (8.5%) |
| Total | 1,359 (100.0%) | 647 (100.0%) |
Real Estate & Mortgages in China Grove
Real Estate and Mortgage Overview in China Grove
| Characteristic | Without Mortgage | With Mortgage |
| Housing Units | 518 | 841 |
| Median Property Value | $85,700 | $212,500 |
| Median Household Income | $42,170 | $48 |
| Monthly Housing Costs | $402 | $0 |
| Real Estate Taxes | $1,415 | $0 |
Property Value by Mortgage Status in China Grove
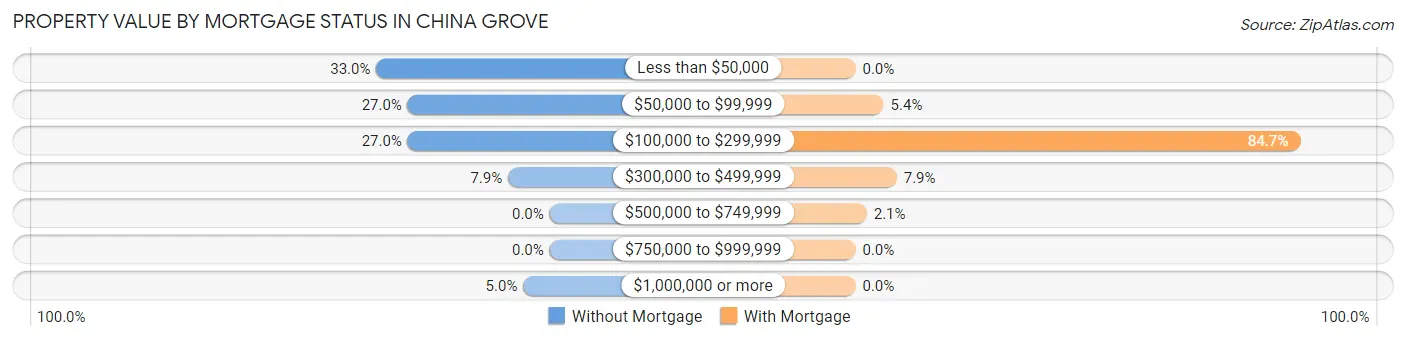
| Property Value | Without Mortgage | With Mortgage |
| Less than $50,000 | 171 (33.0%) | 0 (0.0%) |
| $50,000 to $99,999 | 140 (27.0%) | 45 (5.3%) |
| $100,000 to $299,999 | 140 (27.0%) | 712 (84.7%) |
| $300,000 to $499,999 | 41 (7.9%) | 66 (7.9%) |
| $500,000 to $749,999 | 0 (0.0%) | 18 (2.1%) |
| $750,000 to $999,999 | 0 (0.0%) | 0 (0.0%) |
| $1,000,000 or more | 26 (5.0%) | 0 (0.0%) |
| Total | 518 (100.0%) | 841 (100.0%) |
Household Income by Mortgage Status in China Grove
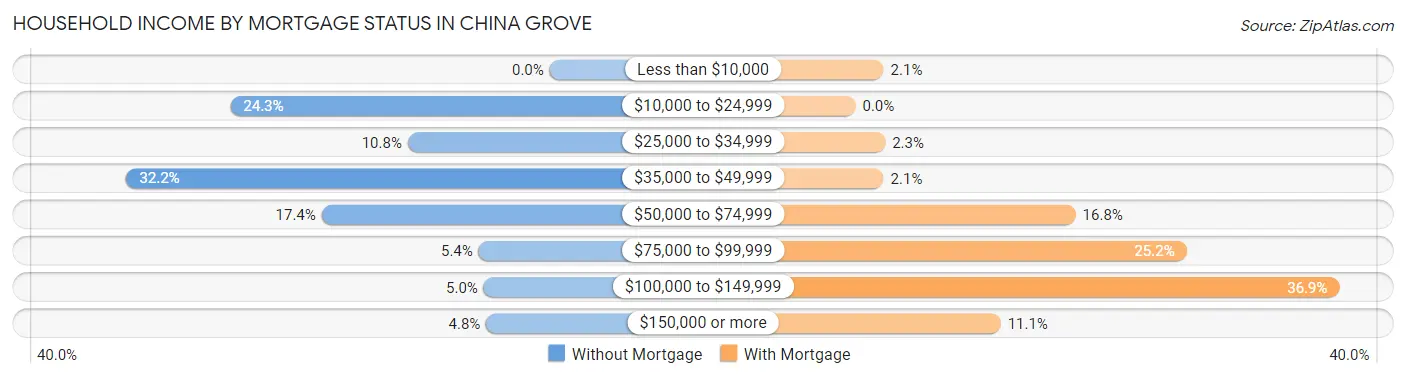
| Household Income | Without Mortgage | With Mortgage |
| Less than $10,000 | 0 (0.0%) | 18 (2.1%) |
| $10,000 to $24,999 | 126 (24.3%) | 0 (0.0%) |
| $25,000 to $34,999 | 56 (10.8%) | 19 (2.3%) |
| $35,000 to $49,999 | 167 (32.2%) | 18 (2.1%) |
| $50,000 to $74,999 | 90 (17.4%) | 141 (16.8%) |
| $75,000 to $99,999 | 28 (5.4%) | 212 (25.2%) |
| $100,000 to $149,999 | 26 (5.0%) | 310 (36.9%) |
| $150,000 or more | 25 (4.8%) | 93 (11.1%) |
| Total | 518 (100.0%) | 841 (100.0%) |
Property Value to Household Income Ratio in China Grove
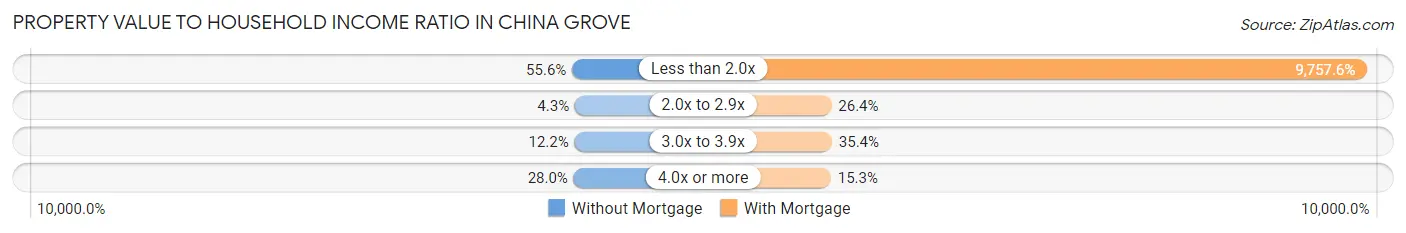
| Value-to-Income Ratio | Without Mortgage | With Mortgage |
| Less than 2.0x | 288 (55.6%) | 82,061 (9,757.6%) |
| 2.0x to 2.9x | 22 (4.3%) | 222 (26.4%) |
| 3.0x to 3.9x | 63 (12.2%) | 298 (35.4%) |
| 4.0x or more | 145 (28.0%) | 129 (15.3%) |
| Total | 518 (100.0%) | 841 (100.0%) |
Real Estate Taxes by Mortgage Status in China Grove
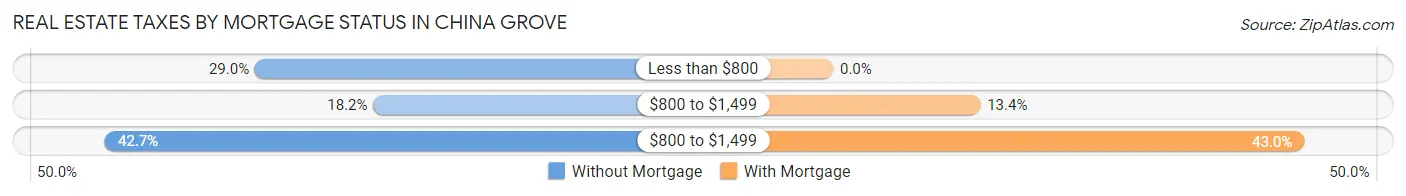
| Property Taxes | Without Mortgage | With Mortgage |
| Less than $800 | 150 (29.0%) | 0 (0.0%) |
| $800 to $1,499 | 94 (18.1%) | 113 (13.4%) |
| $800 to $1,499 | 221 (42.7%) | 362 (43.0%) |
| Total | 518 (100.0%) | 841 (100.0%) |
Health & Disability in China Grove
Health Insurance Coverage by Age in China Grove
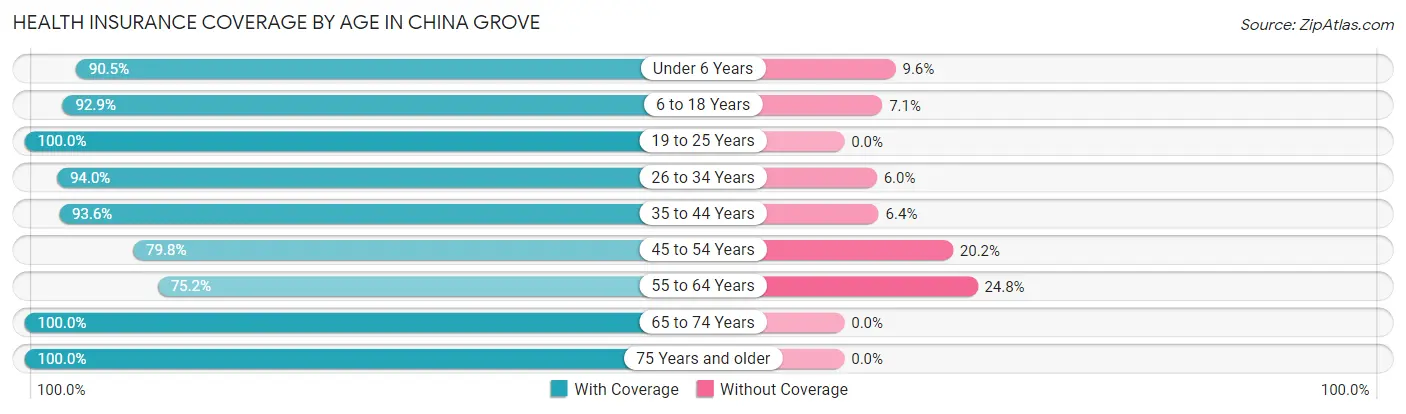
| Age Bracket | With Coverage | Without Coverage |
| Under 6 Years | 161 (90.4%) | 17 (9.6%) |
| 6 to 18 Years | 605 (92.9%) | 46 (7.1%) |
| 19 to 25 Years | 471 (100.0%) | 0 (0.0%) |
| 26 to 34 Years | 949 (94.0%) | 61 (6.0%) |
| 35 to 44 Years | 263 (93.6%) | 18 (6.4%) |
| 45 to 54 Years | 473 (79.8%) | 120 (20.2%) |
| 55 to 64 Years | 454 (75.2%) | 150 (24.8%) |
| 65 to 74 Years | 373 (100.0%) | 0 (0.0%) |
| 75 Years and older | 264 (100.0%) | 0 (0.0%) |
| Total | 4,013 (90.7%) | 412 (9.3%) |
Health Insurance Coverage by Citizenship Status in China Grove

| Citizenship Status | With Coverage | Without Coverage |
| Native Born | 161 (90.4%) | 17 (9.6%) |
| Foreign Born, Citizen | 605 (92.9%) | 46 (7.1%) |
| Foreign Born, not a Citizen | 471 (100.0%) | 0 (0.0%) |
Health Insurance Coverage by Household Income in China Grove
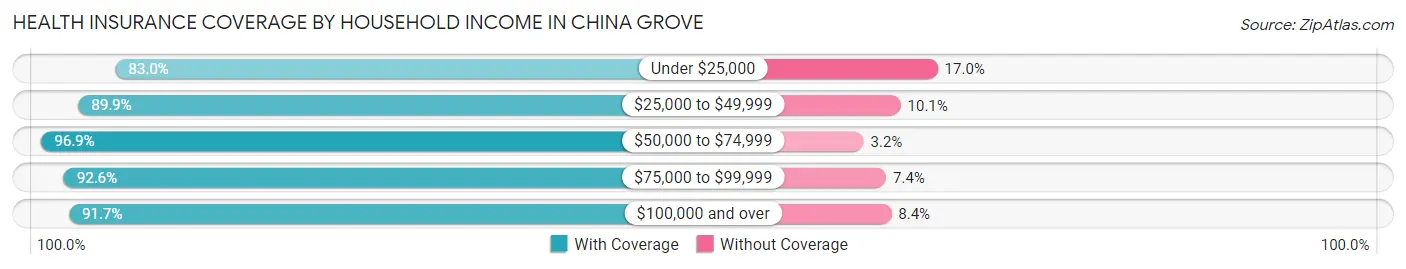
| Household Income | With Coverage | Without Coverage |
| Under $25,000 | 624 (83.0%) | 128 (17.0%) |
| $25,000 to $49,999 | 1,168 (89.9%) | 131 (10.1%) |
| $50,000 to $74,999 | 646 (96.9%) | 21 (3.2%) |
| $75,000 to $99,999 | 944 (92.6%) | 75 (7.4%) |
| $100,000 and over | 626 (91.6%) | 57 (8.4%) |
Public vs Private Health Insurance Coverage by Age in China Grove
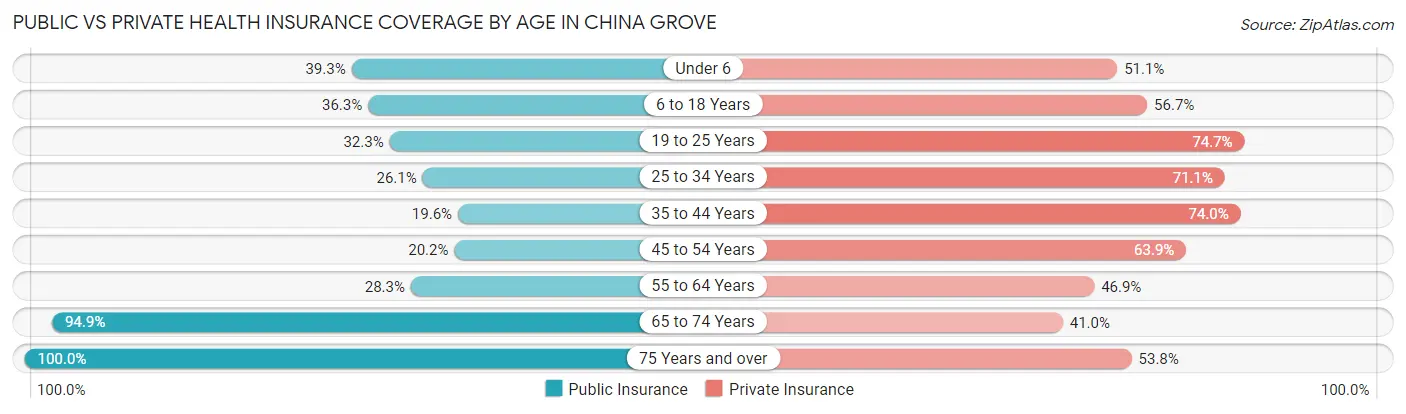
| Age Bracket | Public Insurance | Private Insurance |
| Under 6 | 70 (39.3%) | 91 (51.1%) |
| 6 to 18 Years | 236 (36.2%) | 369 (56.7%) |
| 19 to 25 Years | 152 (32.3%) | 352 (74.7%) |
| 25 to 34 Years | 264 (26.1%) | 718 (71.1%) |
| 35 to 44 Years | 55 (19.6%) | 208 (74.0%) |
| 45 to 54 Years | 120 (20.2%) | 379 (63.9%) |
| 55 to 64 Years | 171 (28.3%) | 283 (46.9%) |
| 65 to 74 Years | 354 (94.9%) | 153 (41.0%) |
| 75 Years and over | 264 (100.0%) | 142 (53.8%) |
| Total | 1,686 (38.1%) | 2,695 (60.9%) |
Disability Status by Sex by Age in China Grove
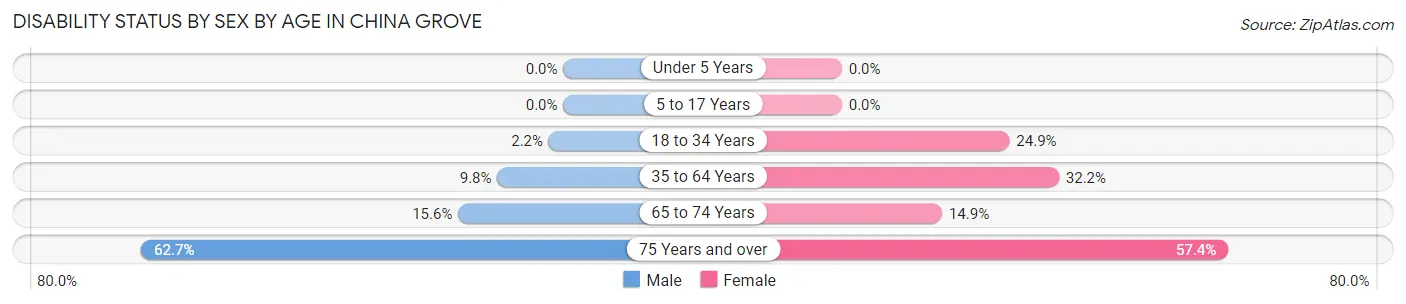
| Age Bracket | Male | Female |
| Under 5 Years | 0 (0.0%) | 0 (0.0%) |
| 5 to 17 Years | 0 (0.0%) | 0 (0.0%) |
| 18 to 34 Years | 13 (2.1%) | 230 (24.9%) |
| 35 to 64 Years | 77 (9.8%) | 223 (32.2%) |
| 65 to 74 Years | 32 (15.6%) | 25 (14.9%) |
| 75 Years and over | 42 (62.7%) | 113 (57.4%) |
Disability Class by Sex by Age in China Grove
Disability Class: Hearing Difficulty
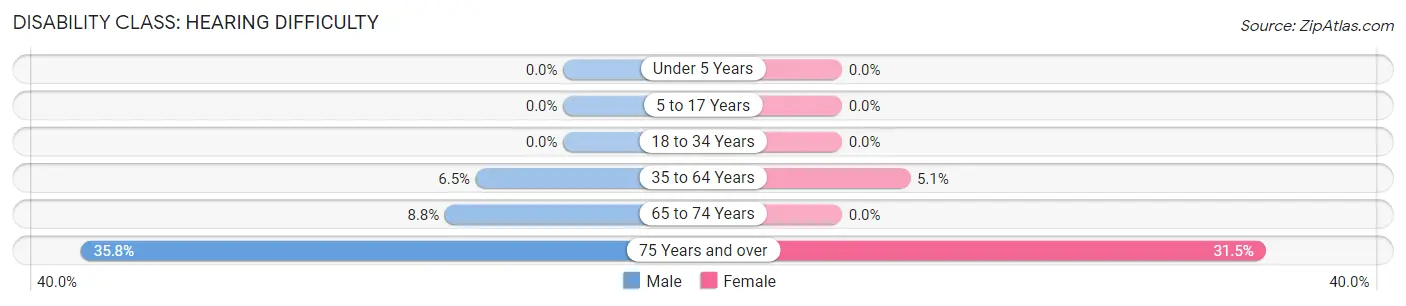
| Age Bracket | Male | Female |
| Under 5 Years | 0 (0.0%) | 0 (0.0%) |
| 5 to 17 Years | 0 (0.0%) | 0 (0.0%) |
| 18 to 34 Years | 0 (0.0%) | 0 (0.0%) |
| 35 to 64 Years | 51 (6.5%) | 35 (5.1%) |
| 65 to 74 Years | 18 (8.8%) | 0 (0.0%) |
| 75 Years and over | 24 (35.8%) | 62 (31.5%) |
Disability Class: Vision Difficulty
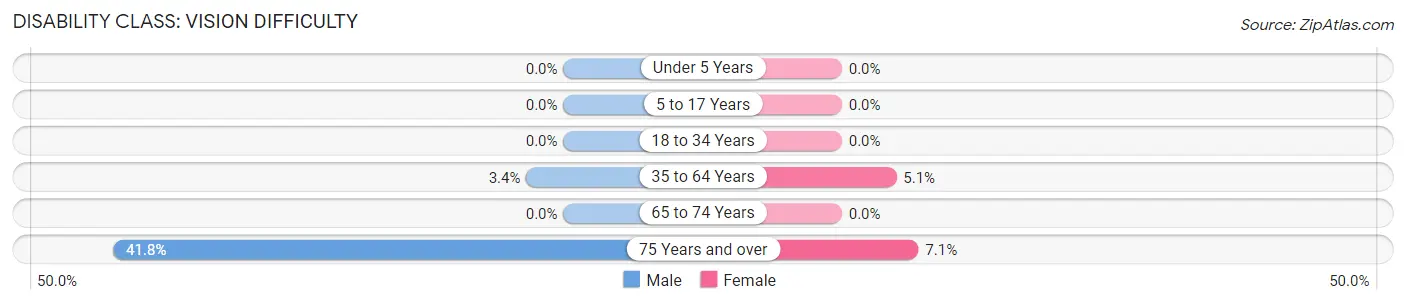
| Age Bracket | Male | Female |
| Under 5 Years | 0 (0.0%) | 0 (0.0%) |
| 5 to 17 Years | 0 (0.0%) | 0 (0.0%) |
| 18 to 34 Years | 0 (0.0%) | 0 (0.0%) |
| 35 to 64 Years | 27 (3.4%) | 35 (5.1%) |
| 65 to 74 Years | 0 (0.0%) | 0 (0.0%) |
| 75 Years and over | 28 (41.8%) | 14 (7.1%) |
Disability Class: Cognitive Difficulty
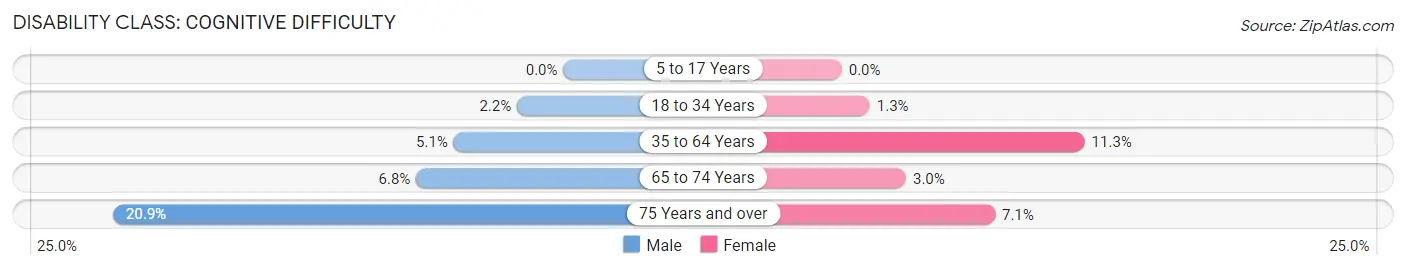
| Age Bracket | Male | Female |
| 5 to 17 Years | 0 (0.0%) | 0 (0.0%) |
| 18 to 34 Years | 13 (2.1%) | 12 (1.3%) |
| 35 to 64 Years | 40 (5.1%) | 78 (11.3%) |
| 65 to 74 Years | 14 (6.8%) | 5 (3.0%) |
| 75 Years and over | 14 (20.9%) | 14 (7.1%) |
Disability Class: Ambulatory Difficulty
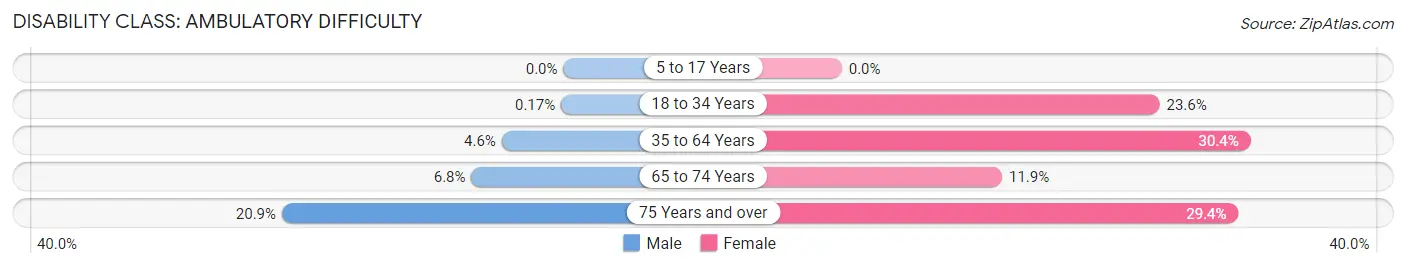
| Age Bracket | Male | Female |
| 5 to 17 Years | 0 (0.0%) | 0 (0.0%) |
| 18 to 34 Years | 1 (0.2%) | 218 (23.6%) |
| 35 to 64 Years | 36 (4.6%) | 210 (30.3%) |
| 65 to 74 Years | 14 (6.8%) | 20 (11.9%) |
| 75 Years and over | 14 (20.9%) | 58 (29.4%) |
Disability Class: Self-Care Difficulty
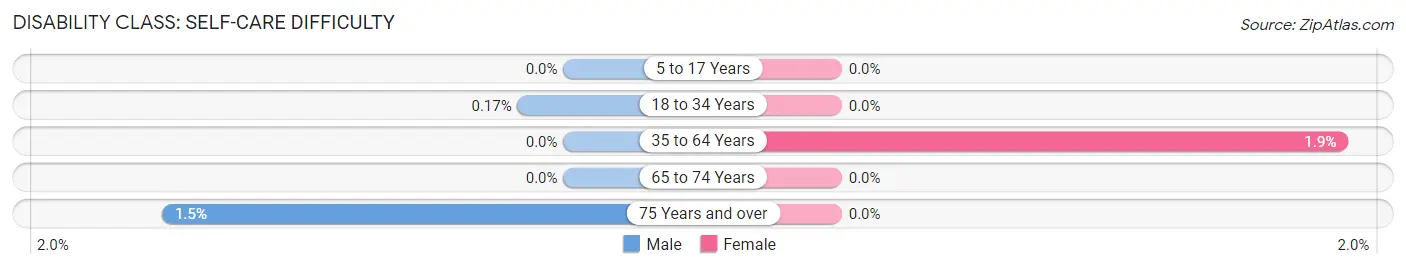
| Age Bracket | Male | Female |
| 5 to 17 Years | 0 (0.0%) | 0 (0.0%) |
| 18 to 34 Years | 1 (0.2%) | 0 (0.0%) |
| 35 to 64 Years | 0 (0.0%) | 13 (1.9%) |
| 65 to 74 Years | 0 (0.0%) | 0 (0.0%) |
| 75 Years and over | 1 (1.5%) | 0 (0.0%) |
Technology Access in China Grove
Computing Device Access in China Grove
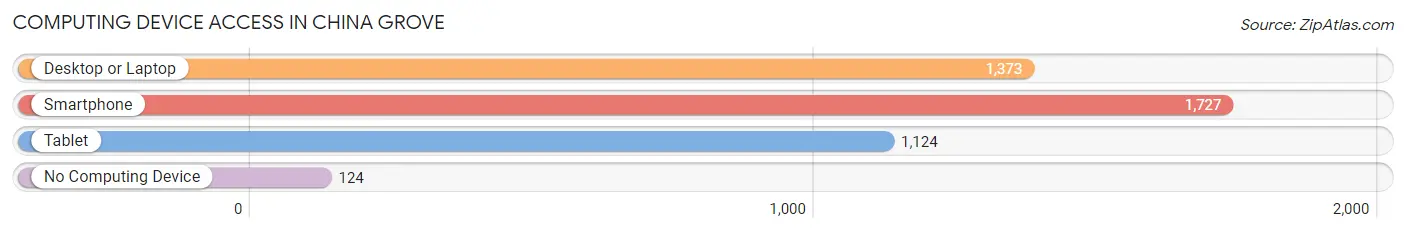
| Device Type | # Households | % Households |
| Desktop or Laptop | 1,373 | 68.4% |
| Smartphone | 1,727 | 86.1% |
| Tablet | 1,124 | 56.0% |
| No Computing Device | 124 | 6.2% |
| Total | 2,006 | 100.0% |
Internet Access in China Grove
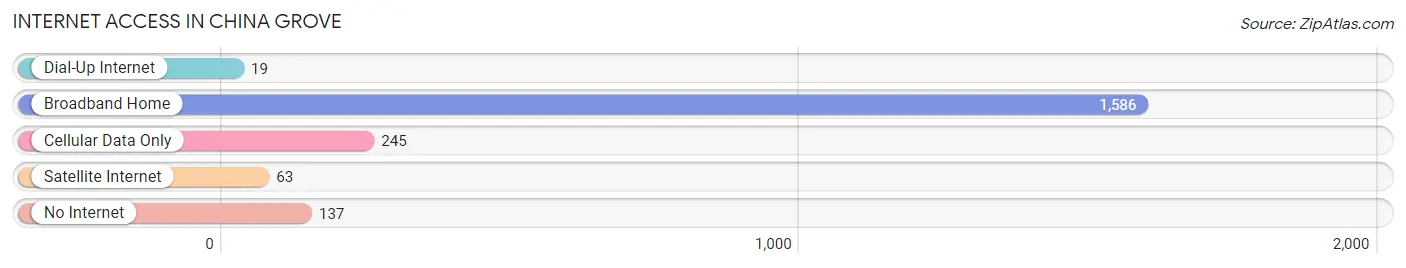
| Internet Type | # Households | % Households |
| Dial-Up Internet | 19 | 0.9% |
| Broadband Home | 1,586 | 79.1% |
| Cellular Data Only | 245 | 12.2% |
| Satellite Internet | 63 | 3.1% |
| No Internet | 137 | 6.8% |
| Total | 2,006 | 100.0% |
China Grove Summary
Geography
China Grove is a small town located in Rowan County, North Carolina. It is situated in the Piedmont region of the state, approximately 30 miles northeast of Charlotte. The town is located at the intersection of Interstate 85 and US 29, making it a convenient stop for travelers. The town is surrounded by rolling hills and farmland, and is home to a variety of wildlife.
The town of China Grove covers an area of 2.2 square miles, with a population of 4,163 as of the 2010 census. The town is divided into two distinct sections, the historic downtown area and the newer residential area. The downtown area is home to a variety of businesses, including restaurants, shops, and other services. The residential area is made up of single-family homes, townhomes, and apartments.
History
The town of China Grove was founded in 1851 by a group of settlers from China Grove, Pennsylvania. The settlers were looking for a place to start a new life and found the area to be ideal for farming. The town was named after the original settlement in Pennsylvania, and the first post office was established in 1853.
The town grew slowly over the years, and by the early 1900s, it had become a thriving agricultural center. The town was home to several cotton mills, as well as a variety of other businesses. The town also had a railroad station, which allowed for easy transportation of goods and people.
In the 1950s, the town began to experience a period of growth and development. The town was home to several new businesses, including a furniture factory and a textile mill. The town also saw the construction of several new homes and businesses.
Economy
The economy of China Grove is largely based on agriculture and manufacturing. The town is home to several farms, which produce a variety of crops, including corn, soybeans, and cotton. The town is also home to several manufacturing companies, which produce a variety of products, including furniture, textiles, and automotive parts.
The town is also home to a variety of retail businesses, including restaurants, grocery stores, and other services. The town is also home to a variety of professional services, including doctors, lawyers, and accountants.
Demographics
As of the 2010 census, the population of China Grove was 4,163. The racial makeup of the town was 87.3% White, 8.2% African American, 0.4% Native American, 0.7% Asian, 0.1% Pacific Islander, 1.2% from other races, and 2.1% from two or more races. Hispanic or Latino of any race were 3.2% of the population.
The median income for a household in the town was $37,917, and the median income for a family was $45,938. The per capita income for the town was $19,945. About 11.2% of families and 14.2% of the population were below the poverty line, including 19.2% of those under age 18 and 8.2% of those age 65 or over.
Conclusion
China Grove is a small town located in Rowan County, North Carolina. It is situated in the Piedmont region of the state, approximately 30 miles northeast of Charlotte. The town is divided into two distinct sections, the historic downtown area and the newer residential area. The town was founded in 1851 by a group of settlers from China Grove, Pennsylvania, and has since grown into a thriving agricultural and manufacturing center. The economy of China Grove is largely based on agriculture and manufacturing, and the town is home to a variety of retail businesses, professional services, and other services. As of the 2010 census, the population of China Grove was 4,163, with a median household income of $37,917.
Common Questions
What is Per Capita Income in China Grove?
Per Capita income in China Grove is $30,416.
What is the Median Family Income in China Grove?
Median Family Income in China Grove is $59,183.
What is the Median Household income in China Grove?
Median Household Income in China Grove is $44,881.
What is Income or Wage Gap in China Grove?
Income or Wage Gap in China Grove is 17.8%.
Women in China Grove earn 82.2 cents for every dollar earned by a man.
What is Inequality or Gini Index in China Grove?
Inequality or Gini Index in China Grove is 0.47.
What is the Total Population of China Grove?
Total Population of China Grove is 4,449.
What is the Total Male Population of China Grove?
Total Male Population of China Grove is 2,044.
What is the Total Female Population of China Grove?
Total Female Population of China Grove is 2,405.
What is the Ratio of Males per 100 Females in China Grove?
There are 84.99 Males per 100 Females in China Grove.
What is the Ratio of Females per 100 Males in China Grove?
There are 117.66 Females per 100 Males in China Grove.
What is the Median Population Age in China Grove?
Median Population Age in China Grove is 34.6 Years.
What is the Average Family Size in China Grove
Average Family Size in China Grove is 2.7 People.
What is the Average Household Size in China Grove
Average Household Size in China Grove is 2.2 People.
How Large is the Labor Force in China Grove?
There are 2,249 People in the Labor Forcein in China Grove.
What is the Percentage of People in the Labor Force in China Grove?
61.3% of People are in the Labor Force in China Grove.
What is the Unemployment Rate in China Grove?
Unemployment Rate in China Grove is 8.3%.