Roanoke Rapids, NC Map & Demographics
Roanoke Rapids Map
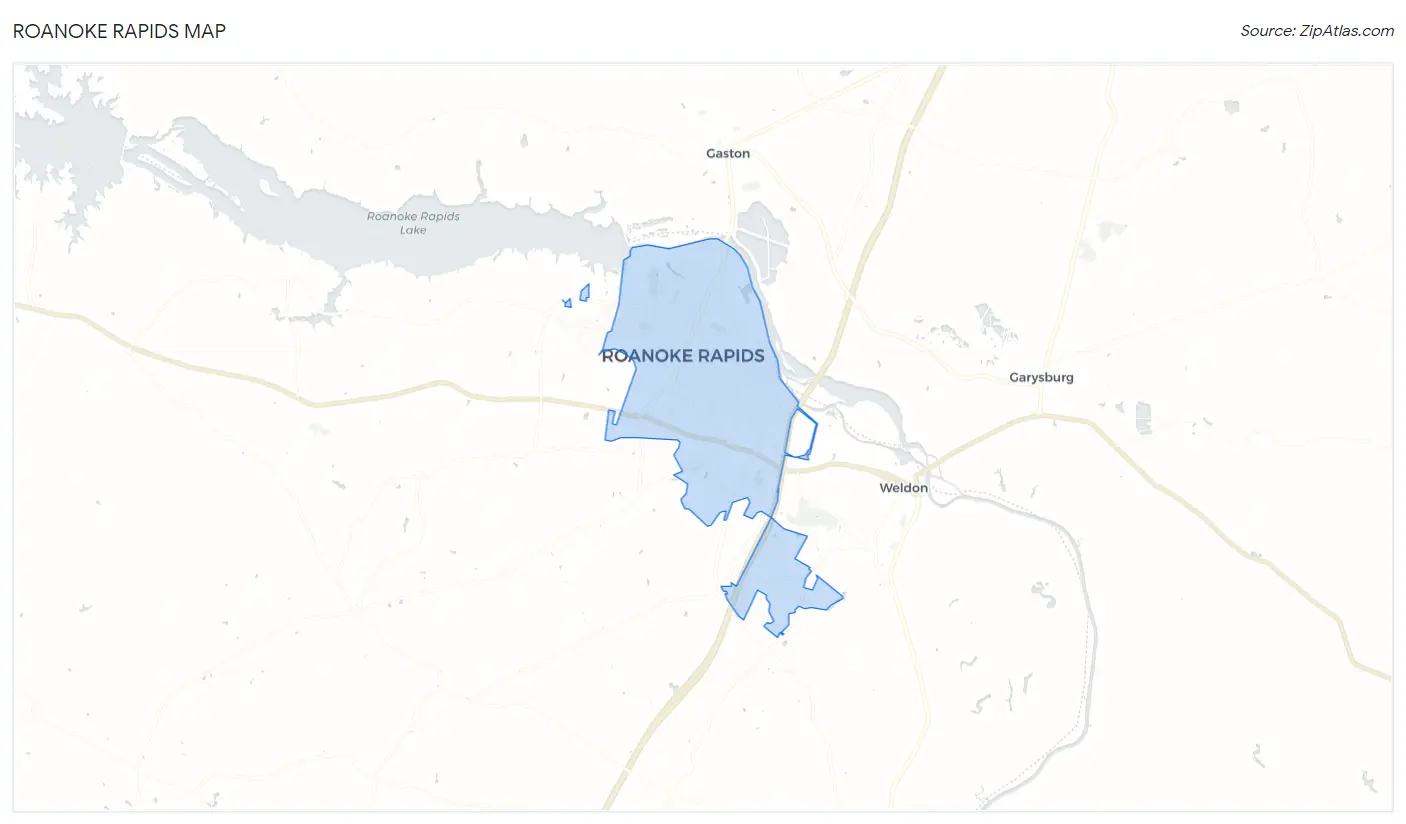
Roanoke Rapids Overview
$27,714
PER CAPITA INCOME
$60,060
AVG FAMILY INCOME
$45,732
AVG HOUSEHOLD INCOME
15.6%
WAGE / INCOME GAP [ % ]
84.4¢/ $1
WAGE / INCOME GAP [ $ ]
$10,004
FAMILY INCOME DEFICIT
0.47
INEQUALITY / GINI INDEX
15,143
TOTAL POPULATION
7,125
MALE POPULATION
8,018
FEMALE POPULATION
88.86
MALES / 100 FEMALES
112.53
FEMALES / 100 MALES
40.5
MEDIAN AGE
3.0
AVG FAMILY SIZE
2.4
AVG HOUSEHOLD SIZE
6,632
LABOR FORCE [ PEOPLE ]
55.7%
PERCENT IN LABOR FORCE
6.2%
UNEMPLOYMENT RATE
Roanoke Rapids Zip Codes
Roanoke Rapids Area Codes
Income in Roanoke Rapids
Income Overview in Roanoke Rapids
Per Capita Income in Roanoke Rapids is $27,714, while median incomes of families and households are $60,060 and $45,732 respectively.
| Characteristic | Number | Measure |
| Per Capita Income | 15,143 | $27,714 |
| Median Family Income | 3,903 | $60,060 |
| Mean Family Income | 3,903 | $77,242 |
| Median Household Income | 6,318 | $45,732 |
| Mean Household Income | 6,318 | $63,980 |
| Income Deficit | 3,903 | $10,004 |
| Wage / Income Gap (%) | 15,143 | 15.62% |
| Wage / Income Gap ($) | 15,143 | 84.38¢ per $1 |
| Gini / Inequality Index | 15,143 | 0.47 |
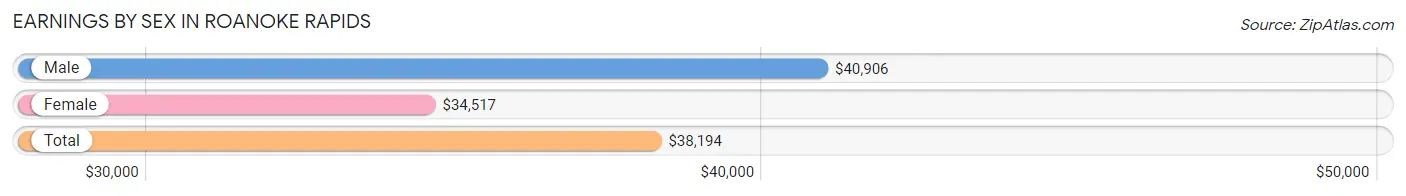
Earnings by Sex in Roanoke Rapids
Average Earnings in Roanoke Rapids are $38,194, $40,906 for men and $34,517 for women, a difference of 15.6%.
| Sex | Number | Average Earnings |
| Male | 3,243 (48.4%) | $40,906 |
| Female | 3,452 (51.6%) | $34,517 |
| Total | 6,695 (100.0%) | $38,194 |
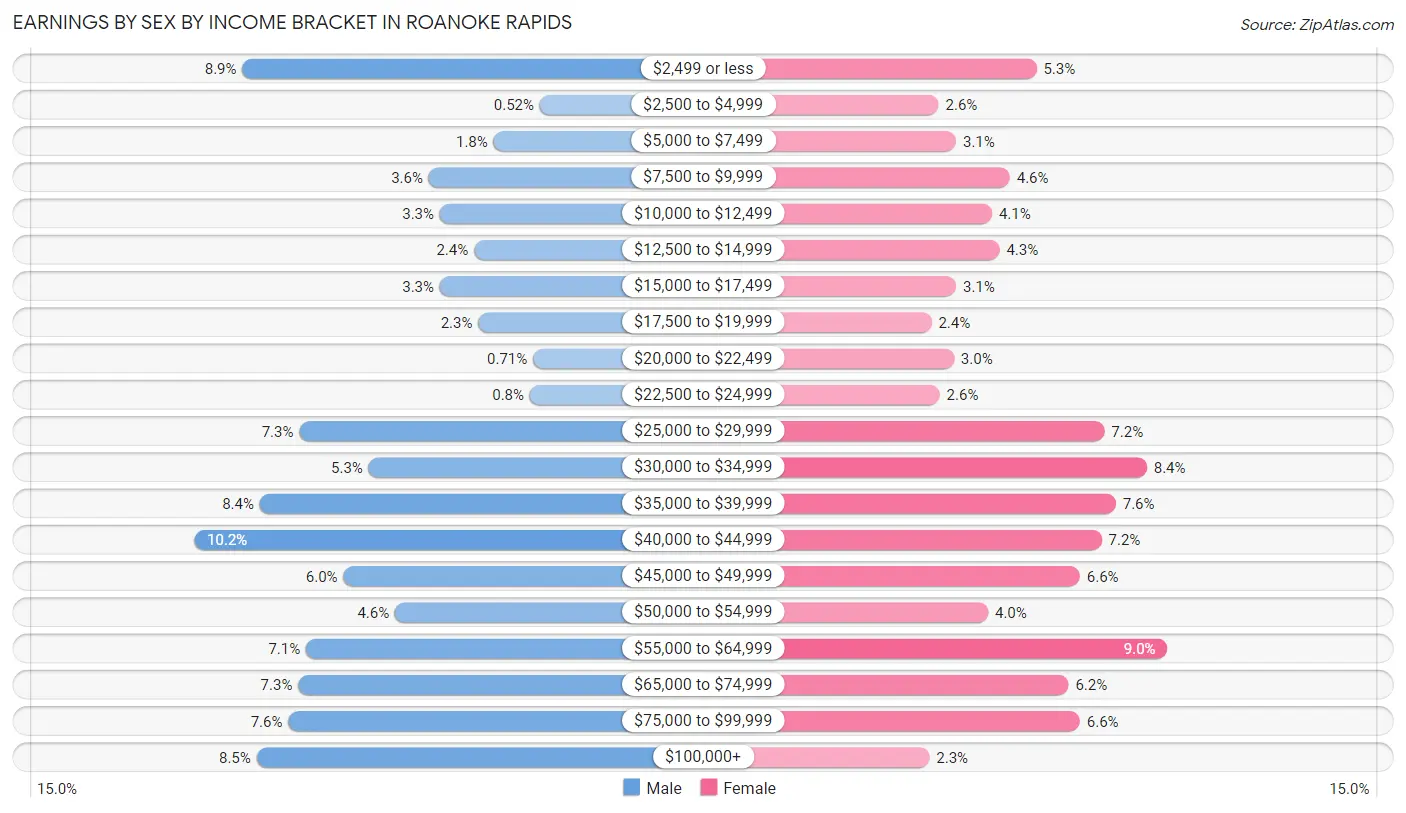
Earnings by Sex by Income Bracket in Roanoke Rapids
The most common earnings brackets in Roanoke Rapids are $40,000 to $44,999 for men (332 | 10.2%) and $55,000 to $64,999 for women (311 | 9.0%).
| Income | Male | Female |
| $2,499 or less | 288 (8.9%) | 184 (5.3%) |
| $2,500 to $4,999 | 17 (0.5%) | 89 (2.6%) |
| $5,000 to $7,499 | 59 (1.8%) | 106 (3.1%) |
| $7,500 to $9,999 | 118 (3.6%) | 158 (4.6%) |
| $10,000 to $12,499 | 108 (3.3%) | 141 (4.1%) |
| $12,500 to $14,999 | 77 (2.4%) | 148 (4.3%) |
| $15,000 to $17,499 | 108 (3.3%) | 106 (3.1%) |
| $17,500 to $19,999 | 73 (2.2%) | 82 (2.4%) |
| $20,000 to $22,499 | 23 (0.7%) | 104 (3.0%) |
| $22,500 to $24,999 | 26 (0.8%) | 90 (2.6%) |
| $25,000 to $29,999 | 236 (7.3%) | 250 (7.2%) |
| $30,000 to $34,999 | 173 (5.3%) | 291 (8.4%) |
| $35,000 to $39,999 | 272 (8.4%) | 261 (7.6%) |
| $40,000 to $44,999 | 332 (10.2%) | 247 (7.2%) |
| $45,000 to $49,999 | 196 (6.0%) | 226 (6.6%) |
| $50,000 to $54,999 | 149 (4.6%) | 137 (4.0%) |
| $55,000 to $64,999 | 230 (7.1%) | 311 (9.0%) |
| $65,000 to $74,999 | 237 (7.3%) | 215 (6.2%) |
| $75,000 to $99,999 | 246 (7.6%) | 226 (6.6%) |
| $100,000+ | 275 (8.5%) | 80 (2.3%) |
| Total | 3,243 (100.0%) | 3,452 (100.0%) |
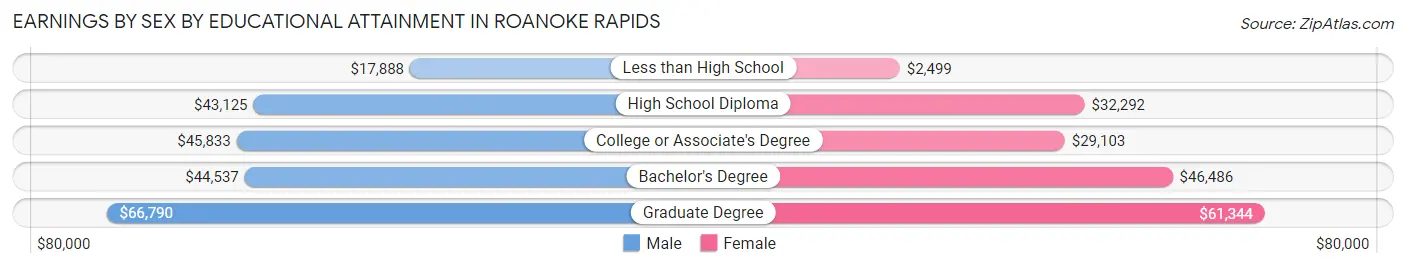
Earnings by Sex by Educational Attainment in Roanoke Rapids
Average earnings in Roanoke Rapids are $44,263 for men and $38,052 for women, a difference of 14.0%. Men with an educational attainment of graduate degree enjoy the highest average annual earnings of $66,790, while those with less than high school education earn the least with $17,888. Women with an educational attainment of graduate degree earn the most with the average annual earnings of $61,344, while those with less than high school education have the smallest earnings of $2,499.
| Educational Attainment | Male Income | Female Income |
| Less than High School | $17,888 | $2,499 |
| High School Diploma | $43,125 | $32,292 |
| College or Associate's Degree | $45,833 | $29,103 |
| Bachelor's Degree | $44,537 | $46,486 |
| Graduate Degree | $66,790 | $61,344 |
| Total | $44,263 | $38,052 |
Family Income in Roanoke Rapids
Family Income Brackets in Roanoke Rapids
According to the Roanoke Rapids family income data, there are 773 families falling into the $50,000 to $74,999 income range, which is the most common income bracket and makes up 19.8% of all families. Conversely, the $200,000+ income bracket is the least frequent group with only 168 families (4.3%) belonging to this category.
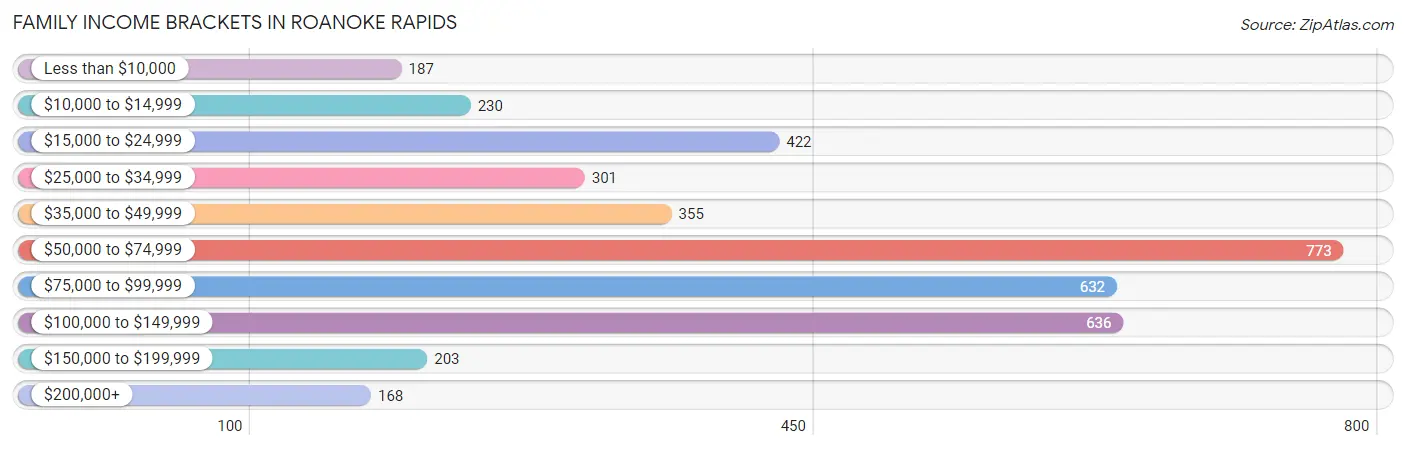
| Income Bracket | # Families | % Families |
| Less than $10,000 | 187 | 4.8% |
| $10,000 to $14,999 | 230 | 5.9% |
| $15,000 to $24,999 | 422 | 10.8% |
| $25,000 to $34,999 | 301 | 7.7% |
| $35,000 to $49,999 | 355 | 9.1% |
| $50,000 to $74,999 | 773 | 19.8% |
| $75,000 to $99,999 | 632 | 16.2% |
| $100,000 to $149,999 | 636 | 16.3% |
| $150,000 to $199,999 | 203 | 5.2% |
| $200,000+ | 168 | 4.3% |
Family Income by Famaliy Size in Roanoke Rapids
5-person families (171 | 4.4%) account for the highest median family income in Roanoke Rapids with $84,173 per family, while 2-person families (1,993 | 51.1%) have the highest median income of $27,164 per family member.
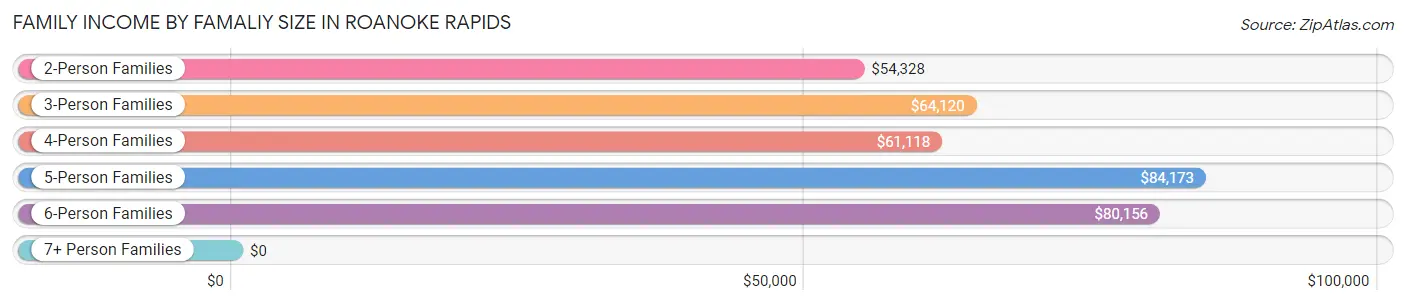
| Income Bracket | # Families | Median Income |
| 2-Person Families | 1,993 (51.1%) | $54,328 |
| 3-Person Families | 1,025 (26.3%) | $64,120 |
| 4-Person Families | 486 (12.4%) | $61,118 |
| 5-Person Families | 171 (4.4%) | $84,173 |
| 6-Person Families | 162 (4.2%) | $80,156 |
| 7+ Person Families | 66 (1.7%) | $0 |
| Total | 3,903 (100.0%) | $60,060 |
Family Income by Number of Earners in Roanoke Rapids
The median family income in Roanoke Rapids is $60,060, with families comprising 3+ earners (304) having the highest median family income of $113,403, while families with no earners (886) have the lowest median family income of $21,848, accounting for 7.8% and 22.7% of families, respectively.
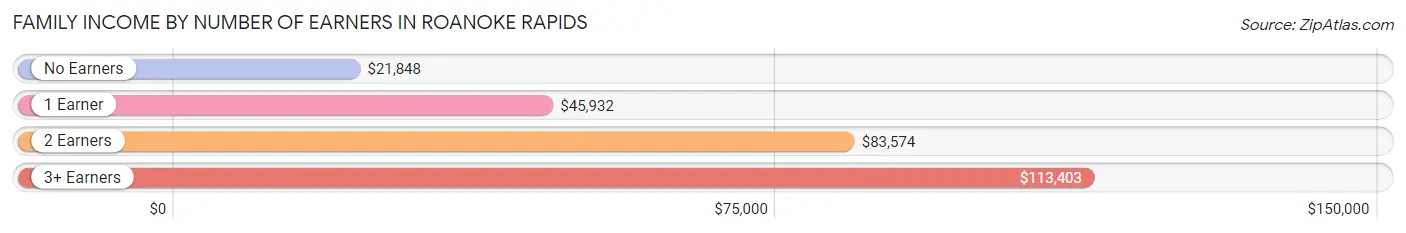
| Number of Earners | # Families | Median Income |
| No Earners | 886 (22.7%) | $21,848 |
| 1 Earner | 1,346 (34.5%) | $45,932 |
| 2 Earners | 1,367 (35.0%) | $83,574 |
| 3+ Earners | 304 (7.8%) | $113,403 |
| Total | 3,903 (100.0%) | $60,060 |
Household Income in Roanoke Rapids
Household Income Brackets in Roanoke Rapids
With 872 households falling in the category, the $75,000 to $99,999 income range is the most frequent in Roanoke Rapids, accounting for 13.8% of all households. In contrast, only 190 households (3.0%) fall into the $200,000+ income bracket, making it the least populous group.
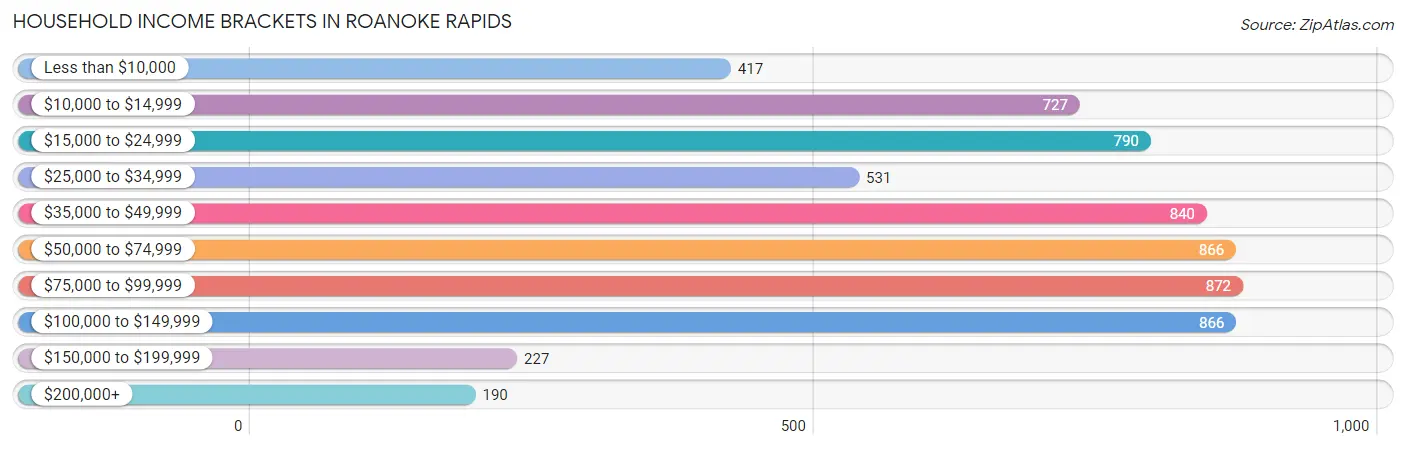
| Income Bracket | # Households | % Households |
| Less than $10,000 | 417 | 6.6% |
| $10,000 to $14,999 | 727 | 11.5% |
| $15,000 to $24,999 | 790 | 12.5% |
| $25,000 to $34,999 | 531 | 8.4% |
| $35,000 to $49,999 | 840 | 13.3% |
| $50,000 to $74,999 | 866 | 13.7% |
| $75,000 to $99,999 | 872 | 13.8% |
| $100,000 to $149,999 | 866 | 13.7% |
| $150,000 to $199,999 | 227 | 3.6% |
| $200,000+ | 190 | 3.0% |
Household Income by Householder Age in Roanoke Rapids
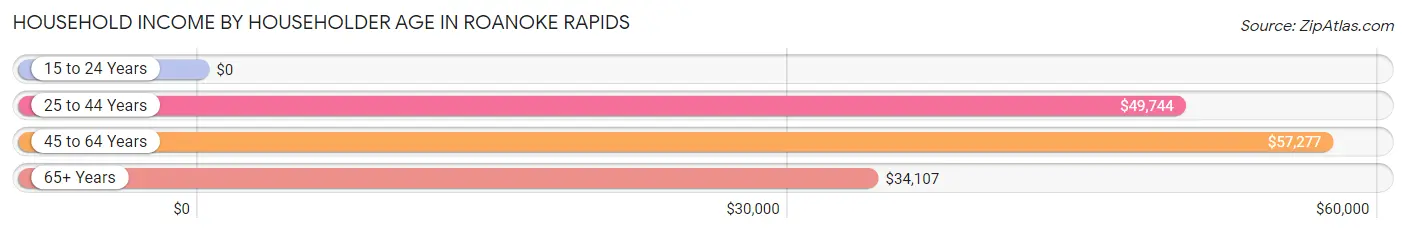
The median household income in Roanoke Rapids is $45,732, with the highest median household income of $57,277 found in the 45 to 64 years age bracket for the primary householder. A total of 2,325 households (36.8%) fall into this category. Meanwhile, the 15 to 24 years age bracket for the primary householder has the lowest median household income of $0, with 175 households (2.8%) in this group.
| Income Bracket | # Households | Median Income |
| 15 to 24 Years | 175 (2.8%) | $0 |
| 25 to 44 Years | 1,770 (28.0%) | $49,744 |
| 45 to 64 Years | 2,325 (36.8%) | $57,277 |
| 65+ Years | 2,048 (32.4%) | $34,107 |
| Total | 6,318 (100.0%) | $45,732 |
Poverty in Roanoke Rapids
Income Below Poverty by Sex and Age in Roanoke Rapids
With 19.8% poverty level for males and 20.9% for females among the residents of Roanoke Rapids, 15 year old males and 15 year old females are the most vulnerable to poverty, with 72 males (59.5%) and 22 females (55.0%) in their respective age groups living below the poverty level.
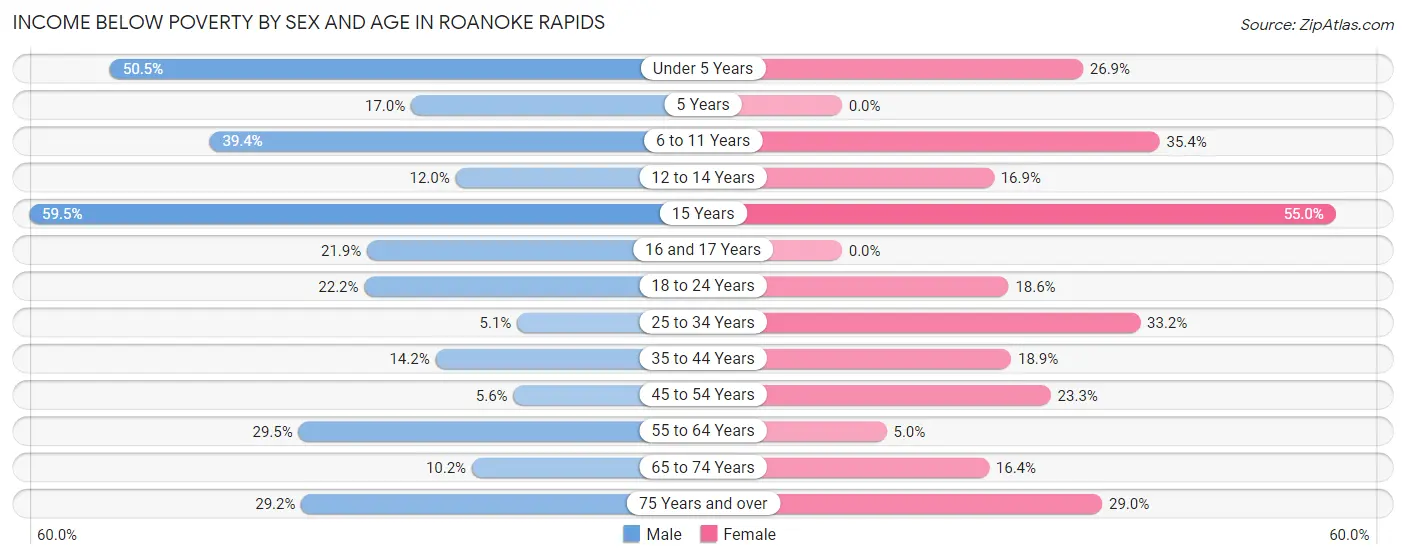
| Age Bracket | Male | Female |
| Under 5 Years | 153 (50.5%) | 174 (26.9%) |
| 5 Years | 19 (17.0%) | 0 (0.0%) |
| 6 to 11 Years | 160 (39.4%) | 178 (35.4%) |
| 12 to 14 Years | 92 (12.0%) | 55 (16.9%) |
| 15 Years | 72 (59.5%) | 22 (55.0%) |
| 16 and 17 Years | 61 (21.9%) | 0 (0.0%) |
| 18 to 24 Years | 170 (22.2%) | 108 (18.6%) |
| 25 to 34 Years | 44 (5.1%) | 294 (33.2%) |
| 35 to 44 Years | 99 (14.2%) | 183 (18.9%) |
| 45 to 54 Years | 39 (5.6%) | 230 (23.3%) |
| 55 to 64 Years | 315 (29.5%) | 53 (5.0%) |
| 65 to 74 Years | 62 (10.2%) | 192 (16.4%) |
| 75 Years and over | 117 (29.2%) | 171 (29.0%) |
| Total | 1,403 (19.8%) | 1,660 (20.9%) |
Income Above Poverty by Sex and Age in Roanoke Rapids
According to the poverty statistics in Roanoke Rapids, males aged 25 to 34 years and females aged 16 and 17 years are the age groups that are most secure financially, with 94.9% of males and 100.0% of females in these age groups living above the poverty line.
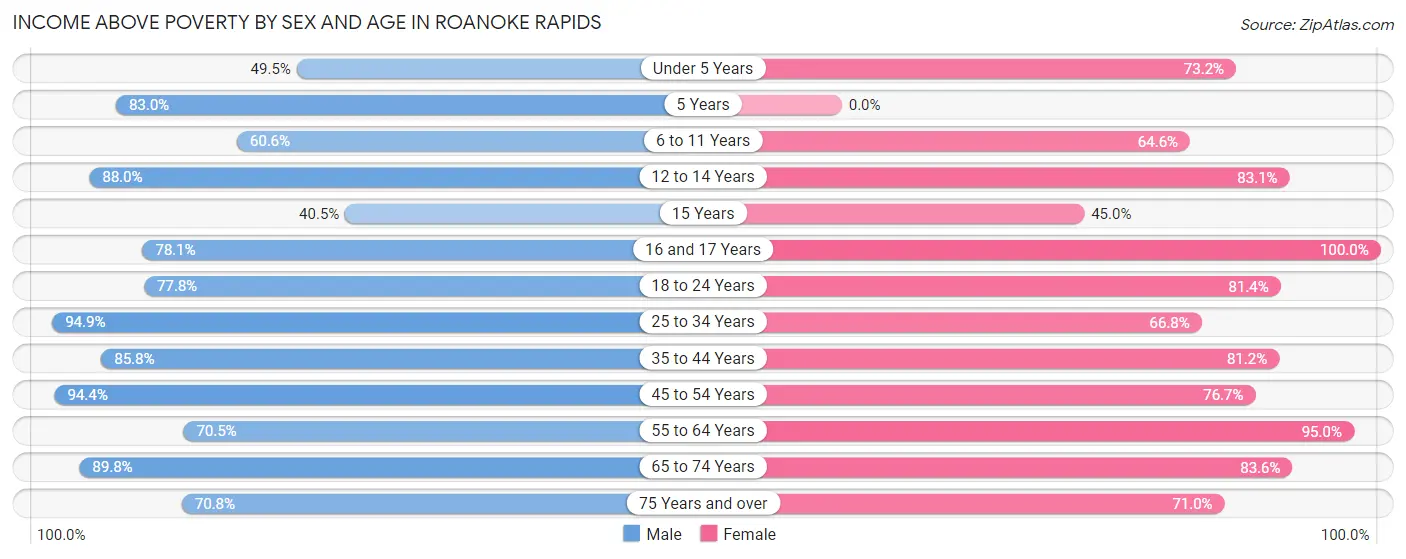
| Age Bracket | Male | Female |
| Under 5 Years | 150 (49.5%) | 474 (73.2%) |
| 5 Years | 93 (83.0%) | 0 (0.0%) |
| 6 to 11 Years | 246 (60.6%) | 325 (64.6%) |
| 12 to 14 Years | 674 (88.0%) | 270 (83.1%) |
| 15 Years | 49 (40.5%) | 18 (45.0%) |
| 16 and 17 Years | 218 (78.1%) | 165 (100.0%) |
| 18 to 24 Years | 597 (77.8%) | 474 (81.4%) |
| 25 to 34 Years | 812 (94.9%) | 591 (66.8%) |
| 35 to 44 Years | 596 (85.8%) | 788 (81.1%) |
| 45 to 54 Years | 663 (94.4%) | 759 (76.7%) |
| 55 to 64 Years | 753 (70.5%) | 1,012 (95.0%) |
| 65 to 74 Years | 547 (89.8%) | 980 (83.6%) |
| 75 Years and over | 284 (70.8%) | 419 (71.0%) |
| Total | 5,682 (80.2%) | 6,275 (79.1%) |
Income Below Poverty Among Married-Couple Families in Roanoke Rapids
The poverty statistics for married-couple families in Roanoke Rapids show that 8.5% or 197 of the total 2,332 families live below the poverty line. Families with 3 or 4 children have the highest poverty rate of 10.2%, comprising of 22 families. On the other hand, families with 1 or 2 children have the lowest poverty rate of 4.6%, which includes 26 families.
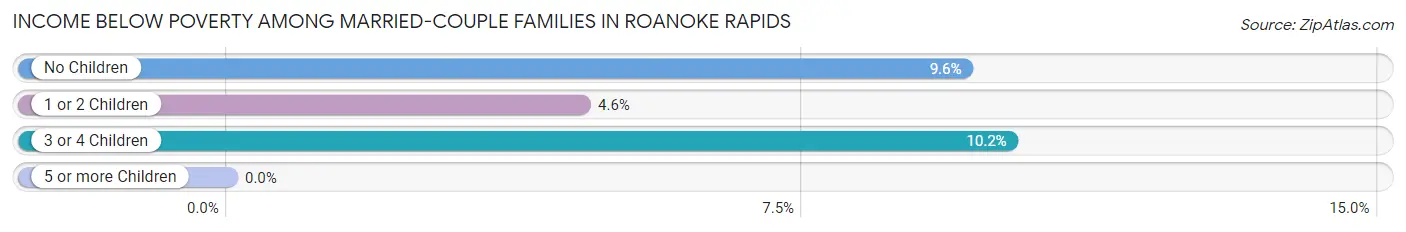
| Children | Above Poverty | Below Poverty |
| No Children | 1,403 (90.4%) | 149 (9.6%) |
| 1 or 2 Children | 538 (95.4%) | 26 (4.6%) |
| 3 or 4 Children | 194 (89.8%) | 22 (10.2%) |
| 5 or more Children | 0 (0.0%) | 0 (0.0%) |
| Total | 2,135 (91.5%) | 197 (8.5%) |
Income Below Poverty Among Single-Parent Households in Roanoke Rapids
According to the poverty data in Roanoke Rapids, 42.6% or 83 single-father households and 35.8% or 493 single-mother households are living below the poverty line. Among single-father households, those with no children have the highest poverty rate, with 54 households (63.5%) experiencing poverty. Likewise, among single-mother households, those with 3 or 4 children have the highest poverty rate, with 55 households (100.0%) falling below the poverty line.
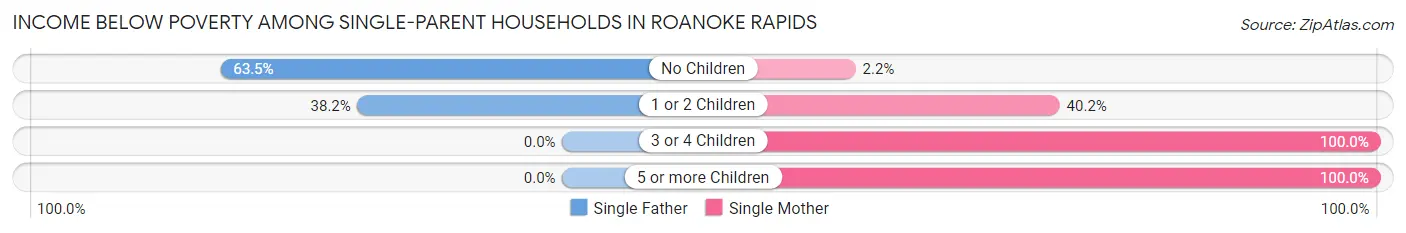
| Children | Single Father | Single Mother |
| No Children | 54 (63.5%) | 7 (2.2%) |
| 1 or 2 Children | 29 (38.2%) | 387 (40.2%) |
| 3 or 4 Children | 0 (0.0%) | 55 (100.0%) |
| 5 or more Children | 0 (0.0%) | 44 (100.0%) |
| Total | 83 (42.6%) | 493 (35.8%) |
Income Below Poverty Among Married-Couple vs Single-Parent Households in Roanoke Rapids
The poverty data for Roanoke Rapids shows that 197 of the married-couple family households (8.5%) and 576 of the single-parent households (36.7%) are living below the poverty level. Within the married-couple family households, those with 3 or 4 children have the highest poverty rate, with 22 households (10.2%) falling below the poverty line. Among the single-parent households, those with 5 or more children have the highest poverty rate, with 44 household (100.0%) living below poverty.
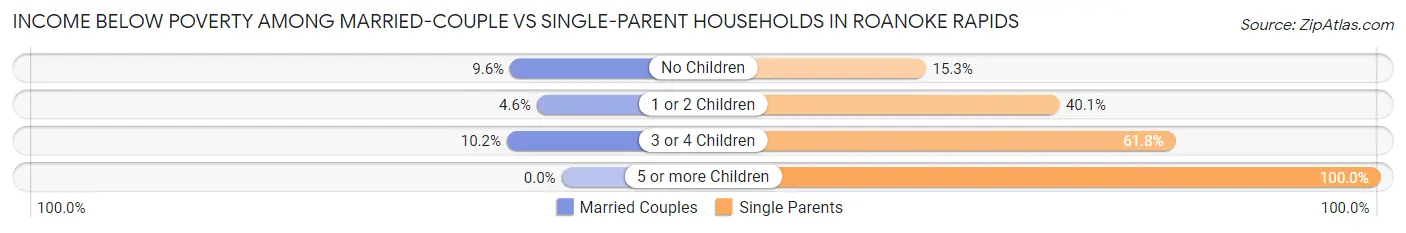
| Children | Married-Couple Families | Single-Parent Households |
| No Children | 149 (9.6%) | 61 (15.2%) |
| 1 or 2 Children | 26 (4.6%) | 416 (40.1%) |
| 3 or 4 Children | 22 (10.2%) | 55 (61.8%) |
| 5 or more Children | 0 (0.0%) | 44 (100.0%) |
| Total | 197 (8.5%) | 576 (36.7%) |
Race in Roanoke Rapids
The most populous races in Roanoke Rapids are White / Caucasian (8,051 | 53.2%), Black / African American (5,218 | 34.5%), and Two or more Races (1,064 | 7.0%).
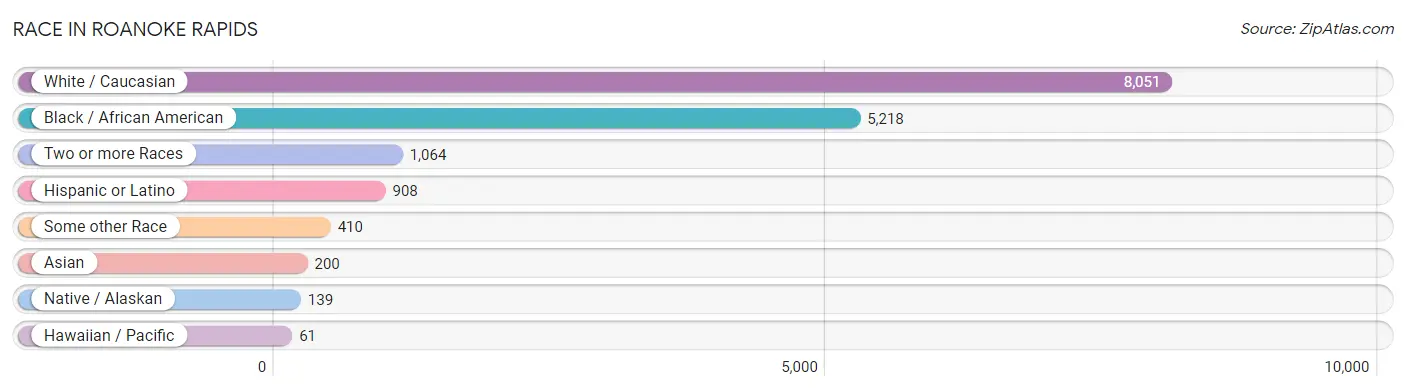
| Race | # Population | % Population |
| Asian | 200 | 1.3% |
| Black / African American | 5,218 | 34.5% |
| Hawaiian / Pacific | 61 | 0.4% |
| Hispanic or Latino | 908 | 6.0% |
| Native / Alaskan | 139 | 0.9% |
| White / Caucasian | 8,051 | 53.2% |
| Two or more Races | 1,064 | 7.0% |
| Some other Race | 410 | 2.7% |
| Total | 15,143 | 100.0% |
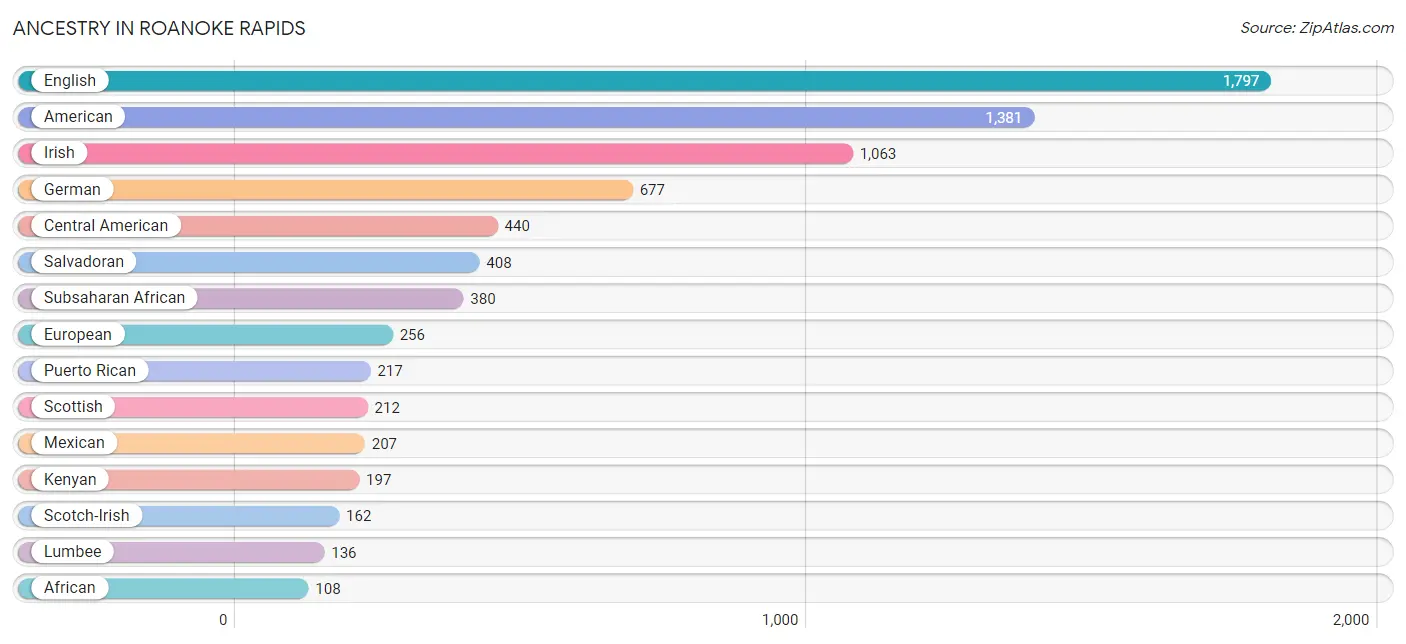
Ancestry in Roanoke Rapids
The most populous ancestries reported in Roanoke Rapids are English (1,797 | 11.9%), American (1,381 | 9.1%), Irish (1,063 | 7.0%), German (677 | 4.5%), and Central American (440 | 2.9%), together accounting for 35.4% of all Roanoke Rapids residents.
| Ancestry | # Population | % Population |
| African | 108 | 0.7% |
| American | 1,381 | 9.1% |
| Arab | 34 | 0.2% |
| Belgian | 5 | 0.0% |
| Bhutanese | 93 | 0.6% |
| British | 32 | 0.2% |
| Canadian | 10 | 0.1% |
| Central American | 440 | 2.9% |
| Cherokee | 30 | 0.2% |
| Cuban | 9 | 0.1% |
| Dominican | 35 | 0.2% |
| Dutch | 87 | 0.6% |
| English | 1,797 | 11.9% |
| European | 256 | 1.7% |
| French | 38 | 0.3% |
| German | 677 | 4.5% |
| Guamanian / Chamorro | 46 | 0.3% |
| Guatemalan | 20 | 0.1% |
| Honduran | 12 | 0.1% |
| Hungarian | 15 | 0.1% |
| Indian (Asian) | 15 | 0.1% |
| Irish | 1,063 | 7.0% |
| Italian | 40 | 0.3% |
| Kenyan | 197 | 1.3% |
| Korean | 58 | 0.4% |
| Lebanese | 34 | 0.2% |
| Lumbee | 136 | 0.9% |
| Mexican | 207 | 1.4% |
| Native Hawaiian | 80 | 0.5% |
| Northern European | 17 | 0.1% |
| Norwegian | 66 | 0.4% |
| Pakistani | 15 | 0.1% |
| Polish | 69 | 0.5% |
| Portuguese | 20 | 0.1% |
| Puerto Rican | 217 | 1.4% |
| Russian | 55 | 0.4% |
| Salvadoran | 408 | 2.7% |
| Scandinavian | 26 | 0.2% |
| Scotch-Irish | 162 | 1.1% |
| Scottish | 212 | 1.4% |
| Sri Lankan | 91 | 0.6% |
| Subsaharan African | 380 | 2.5% |
| Swedish | 34 | 0.2% |
| Swiss | 13 | 0.1% |
| Thai | 63 | 0.4% |
| Welsh | 46 | 0.3% | View All 46 Rows |
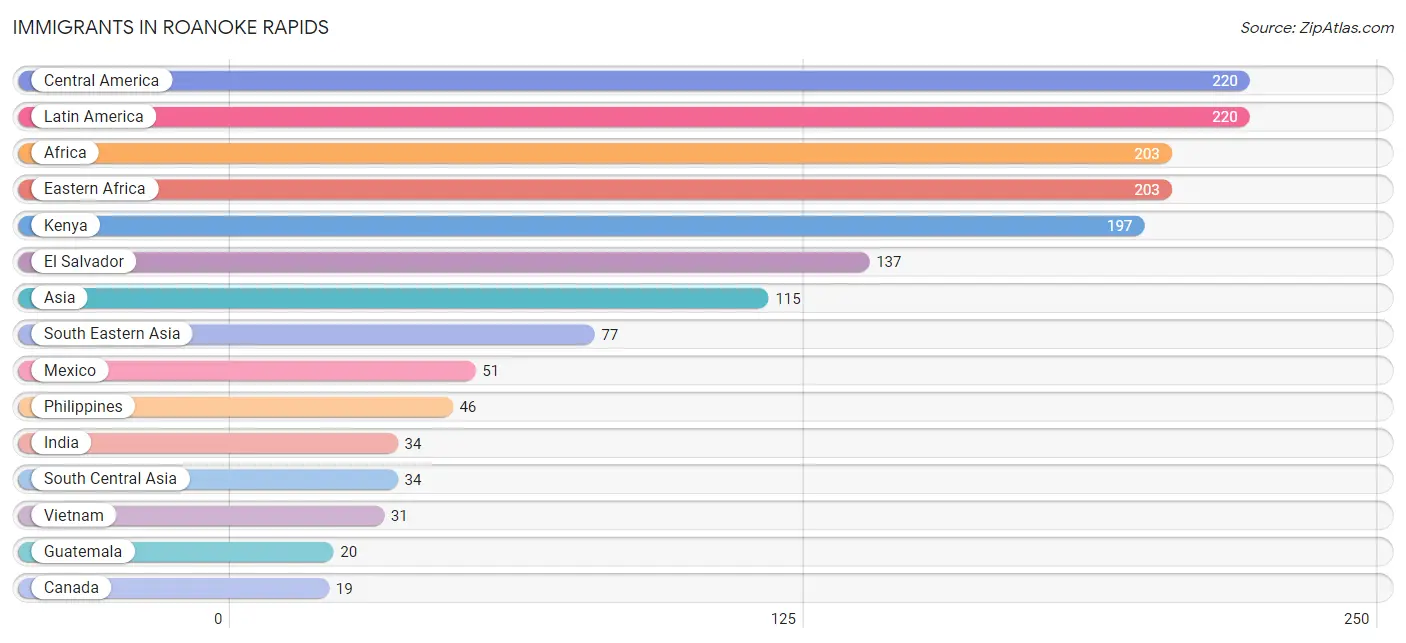
Immigrants in Roanoke Rapids
The most numerous immigrant groups reported in Roanoke Rapids came from Central America (220 | 1.5%), Latin America (220 | 1.5%), Africa (203 | 1.3%), Eastern Africa (203 | 1.3%), and Kenya (197 | 1.3%), together accounting for 6.9% of all Roanoke Rapids residents.
| Immigration Origin | # Population | % Population |
| Africa | 203 | 1.3% |
| Asia | 115 | 0.8% |
| Canada | 19 | 0.1% |
| Central America | 220 | 1.5% |
| China | 4 | 0.0% |
| Eastern Africa | 203 | 1.3% |
| Eastern Asia | 4 | 0.0% |
| El Salvador | 137 | 0.9% |
| Europe | 10 | 0.1% |
| Guatemala | 20 | 0.1% |
| Honduras | 12 | 0.1% |
| India | 34 | 0.2% |
| Italy | 10 | 0.1% |
| Kenya | 197 | 1.3% |
| Latin America | 220 | 1.5% |
| Mexico | 51 | 0.3% |
| Philippines | 46 | 0.3% |
| South Central Asia | 34 | 0.2% |
| South Eastern Asia | 77 | 0.5% |
| Southern Europe | 10 | 0.1% |
| Uganda | 6 | 0.0% |
| Vietnam | 31 | 0.2% | View All 22 Rows |
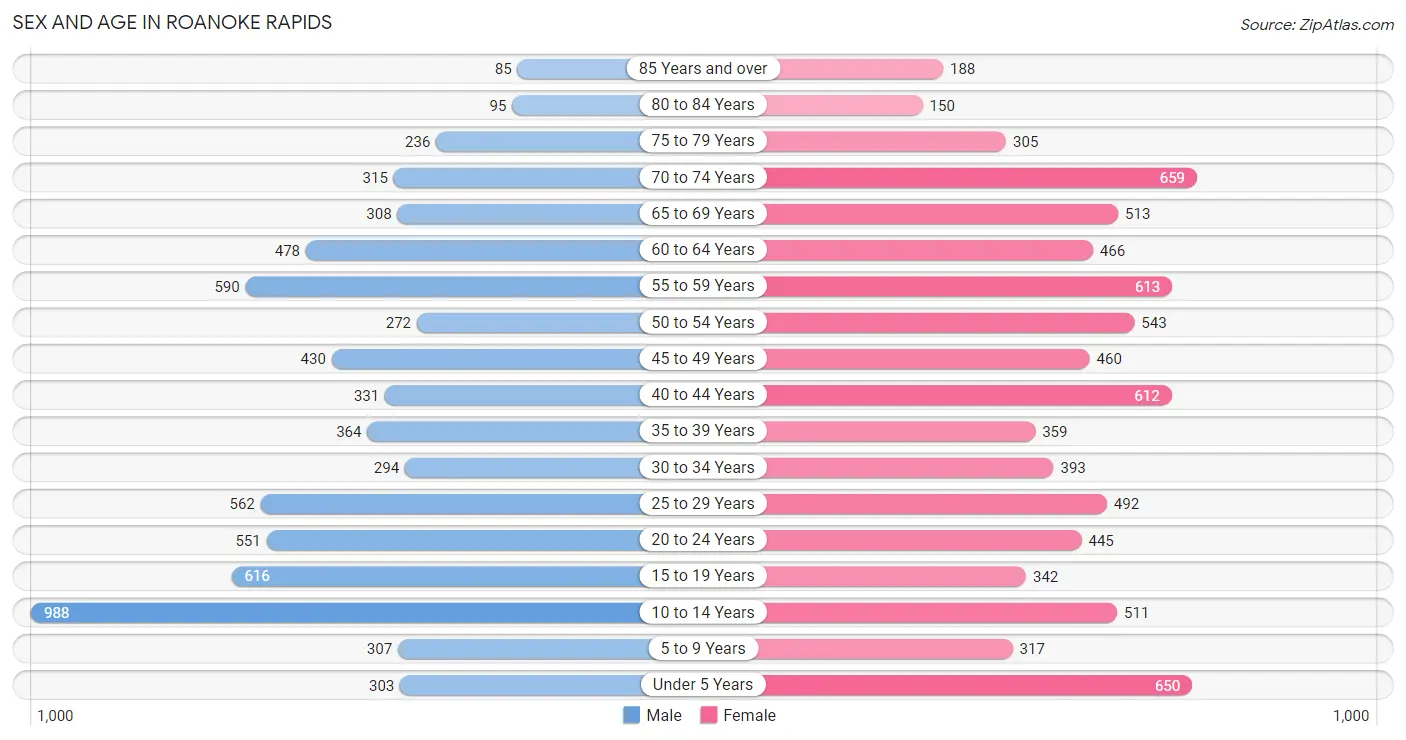
Sex and Age in Roanoke Rapids
Sex and Age in Roanoke Rapids
The most populous age groups in Roanoke Rapids are 10 to 14 Years (988 | 13.9%) for men and 70 to 74 Years (659 | 8.2%) for women.
| Age Bracket | Male | Female |
| Under 5 Years | 303 (4.3%) | 650 (8.1%) |
| 5 to 9 Years | 307 (4.3%) | 317 (4.0%) |
| 10 to 14 Years | 988 (13.9%) | 511 (6.4%) |
| 15 to 19 Years | 616 (8.6%) | 342 (4.3%) |
| 20 to 24 Years | 551 (7.7%) | 445 (5.6%) |
| 25 to 29 Years | 562 (7.9%) | 492 (6.1%) |
| 30 to 34 Years | 294 (4.1%) | 393 (4.9%) |
| 35 to 39 Years | 364 (5.1%) | 359 (4.5%) |
| 40 to 44 Years | 331 (4.6%) | 612 (7.6%) |
| 45 to 49 Years | 430 (6.0%) | 460 (5.7%) |
| 50 to 54 Years | 272 (3.8%) | 543 (6.8%) |
| 55 to 59 Years | 590 (8.3%) | 613 (7.6%) |
| 60 to 64 Years | 478 (6.7%) | 466 (5.8%) |
| 65 to 69 Years | 308 (4.3%) | 513 (6.4%) |
| 70 to 74 Years | 315 (4.4%) | 659 (8.2%) |
| 75 to 79 Years | 236 (3.3%) | 305 (3.8%) |
| 80 to 84 Years | 95 (1.3%) | 150 (1.9%) |
| 85 Years and over | 85 (1.2%) | 188 (2.3%) |
| Total | 7,125 (100.0%) | 8,018 (100.0%) |
Families and Households in Roanoke Rapids
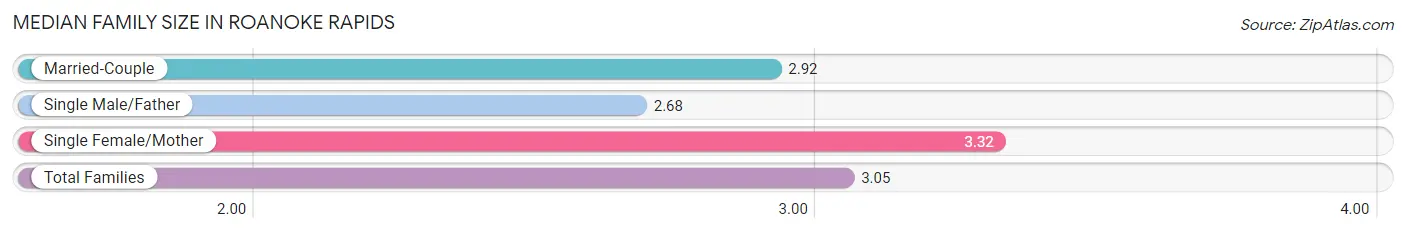
Median Family Size in Roanoke Rapids
The median family size in Roanoke Rapids is 3.05 persons per family, with single female/mother families (1,376 | 35.2%) accounting for the largest median family size of 3.32 persons per family. On the other hand, single male/father families (195 | 5.0%) represent the smallest median family size with 2.68 persons per family.
| Family Type | # Families | Family Size |
| Married-Couple | 2,332 (59.8%) | 2.92 |
| Single Male/Father | 195 (5.0%) | 2.68 |
| Single Female/Mother | 1,376 (35.2%) | 3.32 |
| Total Families | 3,903 (100.0%) | 3.05 |
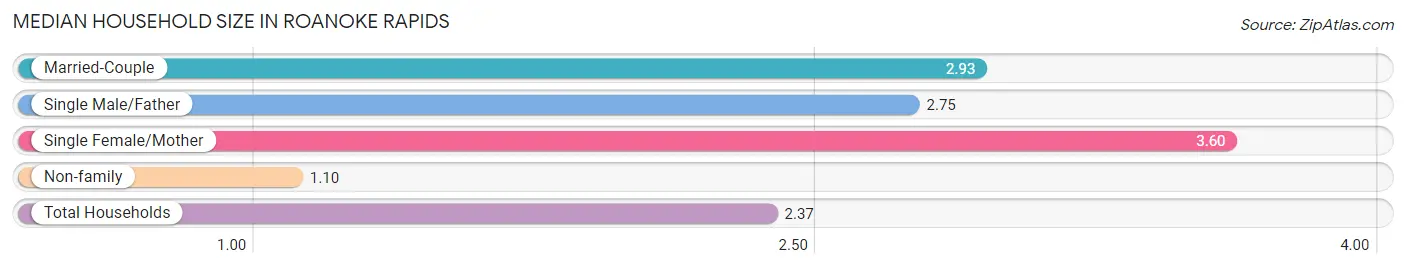
Median Household Size in Roanoke Rapids
The median household size in Roanoke Rapids is 2.37 persons per household, with single female/mother households (1,376 | 21.8%) accounting for the largest median household size of 3.6 persons per household. non-family households (2,415 | 38.2%) represent the smallest median household size with 1.10 persons per household.
| Household Type | # Households | Household Size |
| Married-Couple | 2,332 (36.9%) | 2.93 |
| Single Male/Father | 195 (3.1%) | 2.75 |
| Single Female/Mother | 1,376 (21.8%) | 3.60 |
| Non-family | 2,415 (38.2%) | 1.10 |
| Total Households | 6,318 (100.0%) | 2.37 |
Household Size by Marriage Status in Roanoke Rapids
Out of a total of 6,318 households in Roanoke Rapids, 3,903 (61.8%) are family households, while 2,415 (38.2%) are nonfamily households. The most numerous type of family households are 2-person households, comprising 1,865, and the most common type of nonfamily households are 1-person households, comprising 2,224.
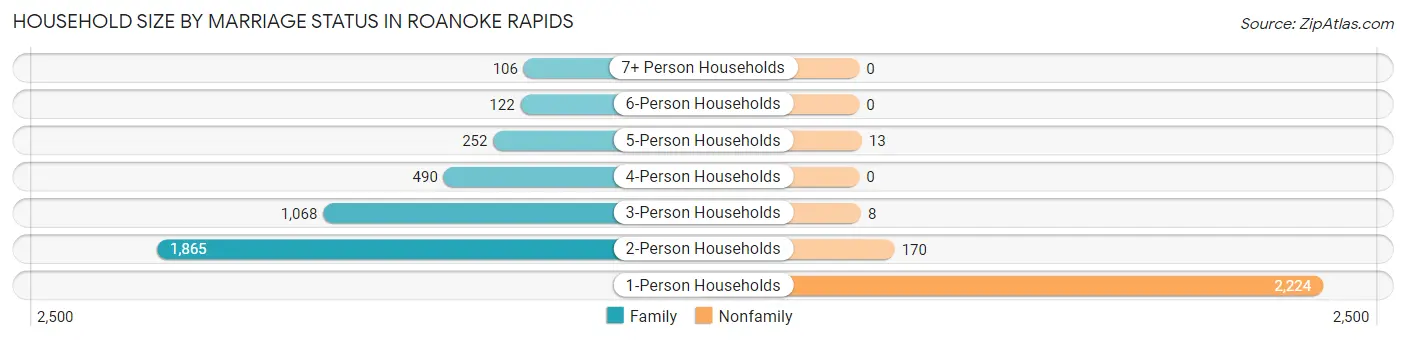
| Household Size | Family Households | Nonfamily Households |
| 1-Person Households | - | 2,224 (35.2%) |
| 2-Person Households | 1,865 (29.5%) | 170 (2.7%) |
| 3-Person Households | 1,068 (16.9%) | 8 (0.1%) |
| 4-Person Households | 490 (7.8%) | 0 (0.0%) |
| 5-Person Households | 252 (4.0%) | 13 (0.2%) |
| 6-Person Households | 122 (1.9%) | 0 (0.0%) |
| 7+ Person Households | 106 (1.7%) | 0 (0.0%) |
| Total | 3,903 (61.8%) | 2,415 (38.2%) |
Female Fertility in Roanoke Rapids
Fertility by Age in Roanoke Rapids
Average fertility rate in Roanoke Rapids is 29.0 births per 1,000 women. Women in the age bracket of 20 to 34 years have the highest fertility rate with 72.0 births per 1,000 women. Women in the age bracket of 20 to 34 years acount for 100.0% of all women with births.
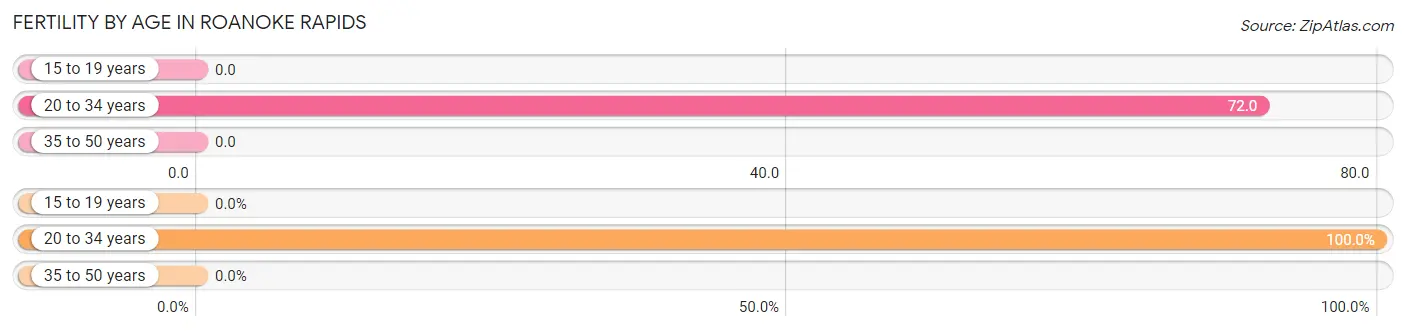
| Age Bracket | Women with Births | Births / 1,000 Women |
| 15 to 19 years | 0 (0.0%) | 0.0 |
| 20 to 34 years | 96 (100.0%) | 72.0 |
| 35 to 50 years | 0 (0.0%) | 0.0 |
| Total | 96 (100.0%) | 29.0 |
Fertility by Age by Marriage Status in Roanoke Rapids
41.7% of women with births (96) in Roanoke Rapids are married. The highest percentage of unmarried women with births falls into 20 to 34 years age bracket with 58.3% of them unmarried at the time of birth, while the lowest percentage of unmarried women with births belong to 20 to 34 years age bracket with 58.3% of them unmarried.
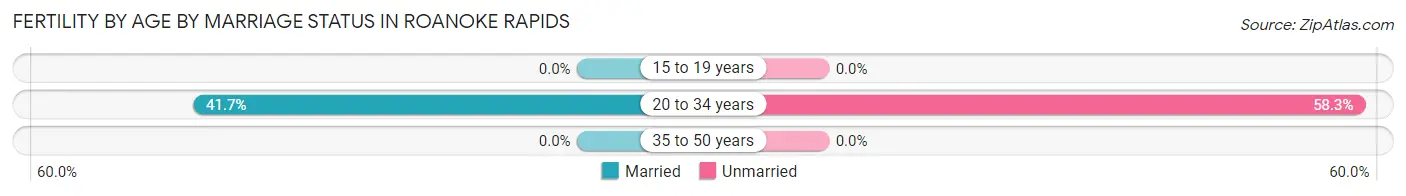
| Age Bracket | Married | Unmarried |
| 15 to 19 years | 0 (0.0%) | 0 (0.0%) |
| 20 to 34 years | 40 (41.7%) | 56 (58.3%) |
| 35 to 50 years | 0 (0.0%) | 0 (0.0%) |
| Total | 40 (41.7%) | 56 (58.3%) |
Fertility by Education in Roanoke Rapids
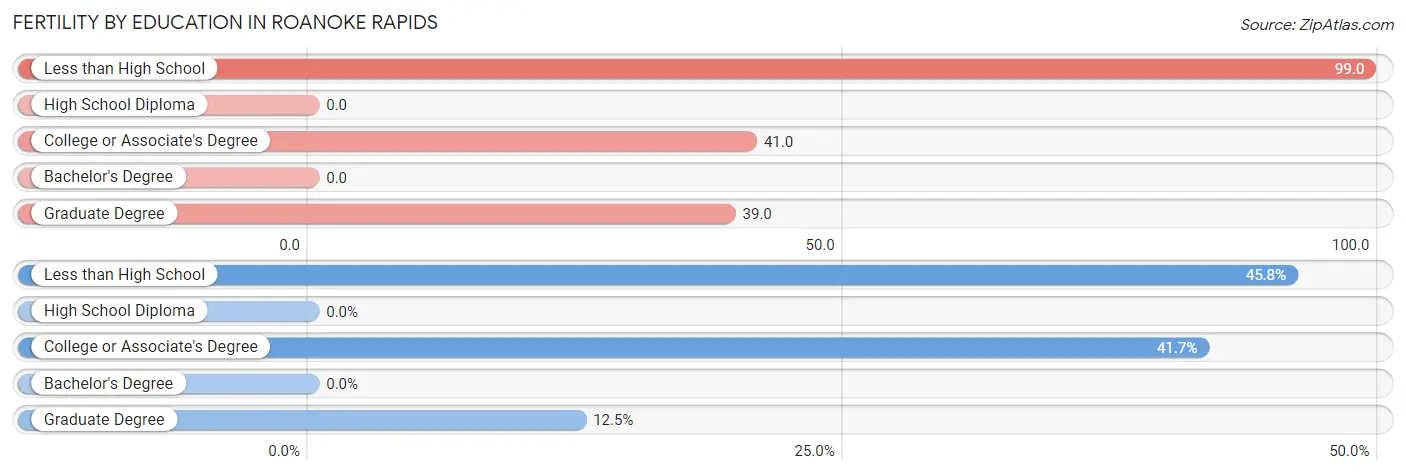
| Educational Attainment | Women with Births | Births / 1,000 Women |
| Less than High School | 44 (45.8%) | 99.0 |
| High School Diploma | 0 (0.0%) | 0.0 |
| College or Associate's Degree | 40 (41.7%) | 41.0 |
| Bachelor's Degree | 0 (0.0%) | 0.0 |
| Graduate Degree | 12 (12.5%) | 39.0 |
| Total | 96 (100.0%) | 29.0 |
Fertility by Education by Marriage Status in Roanoke Rapids
58.3% of women with births in Roanoke Rapids are unmarried. Women with the educational attainment of college or associate's degree are most likely to be married with 100.0% of them married at childbirth, while women with the educational attainment of less than high school are least likely to be married with 100.0% of them unmarried at childbirth.
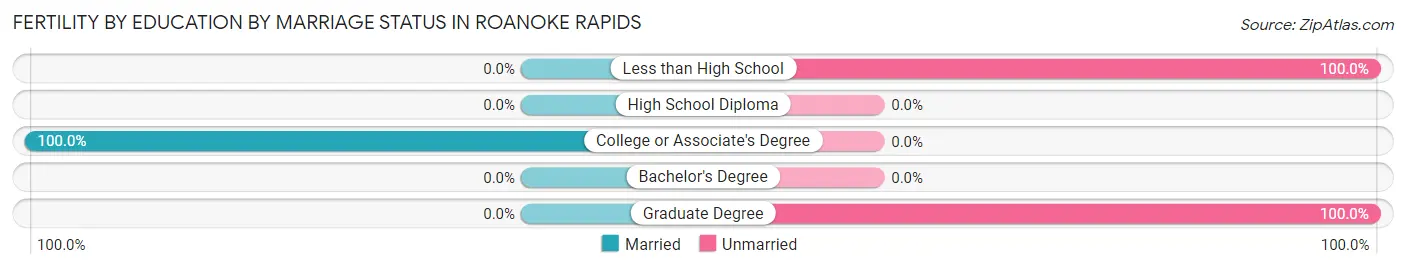
| Educational Attainment | Married | Unmarried |
| Less than High School | 0 (0.0%) | 44 (100.0%) |
| High School Diploma | 0 (0.0%) | 0 (0.0%) |
| College or Associate's Degree | 40 (100.0%) | 0 (0.0%) |
| Bachelor's Degree | 0 (0.0%) | 0 (0.0%) |
| Graduate Degree | 0 (0.0%) | 12 (100.0%) |
| Total | 40 (41.7%) | 56 (58.3%) |
Employment Characteristics in Roanoke Rapids
Employment by Class of Employer in Roanoke Rapids
Among the 6,090 employed individuals in Roanoke Rapids, private company employees (3,706 | 60.9%), local government employees (892 | 14.6%), and not-for-profit organizations (507 | 8.3%) make up the most common classes of employment.
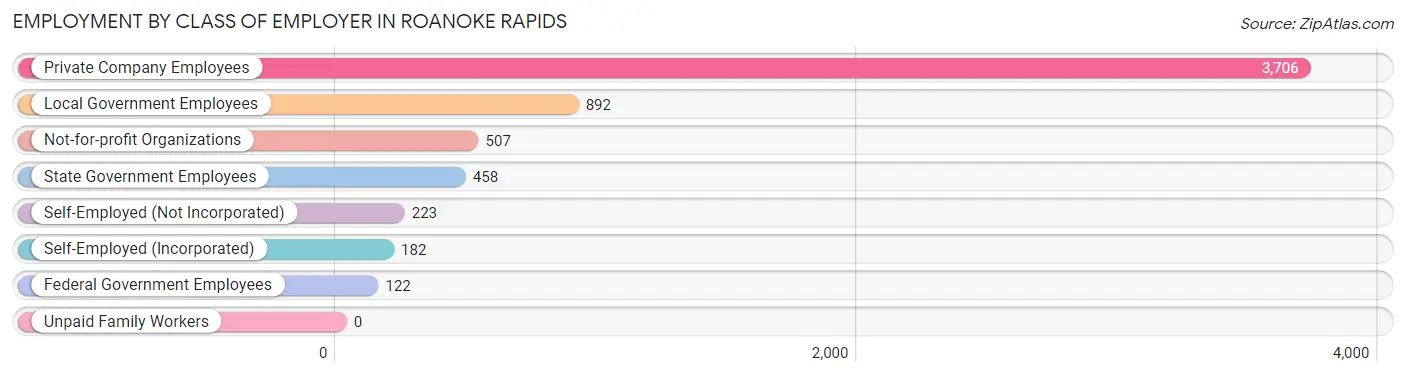
| Employer Class | # Employees | % Employees |
| Private Company Employees | 3,706 | 60.9% |
| Self-Employed (Incorporated) | 182 | 3.0% |
| Self-Employed (Not Incorporated) | 223 | 3.7% |
| Not-for-profit Organizations | 507 | 8.3% |
| Local Government Employees | 892 | 14.6% |
| State Government Employees | 458 | 7.5% |
| Federal Government Employees | 122 | 2.0% |
| Unpaid Family Workers | 0 | 0.0% |
| Total | 6,090 | 100.0% |
Employment Status by Age in Roanoke Rapids
According to the labor force statistics for Roanoke Rapids, out of the total population over 16 years of age (11,906), 55.7% or 6,632 individuals are in the labor force, with 6.2% or 411 of them unemployed. The age group with the highest labor force participation rate is 35 to 44 years, with 86.4% or 1,439 individuals in the labor force. Within the labor force, the 20 to 24 years age range has the highest percentage of unemployed individuals, with 34.0% or 201 of them being unemployed.
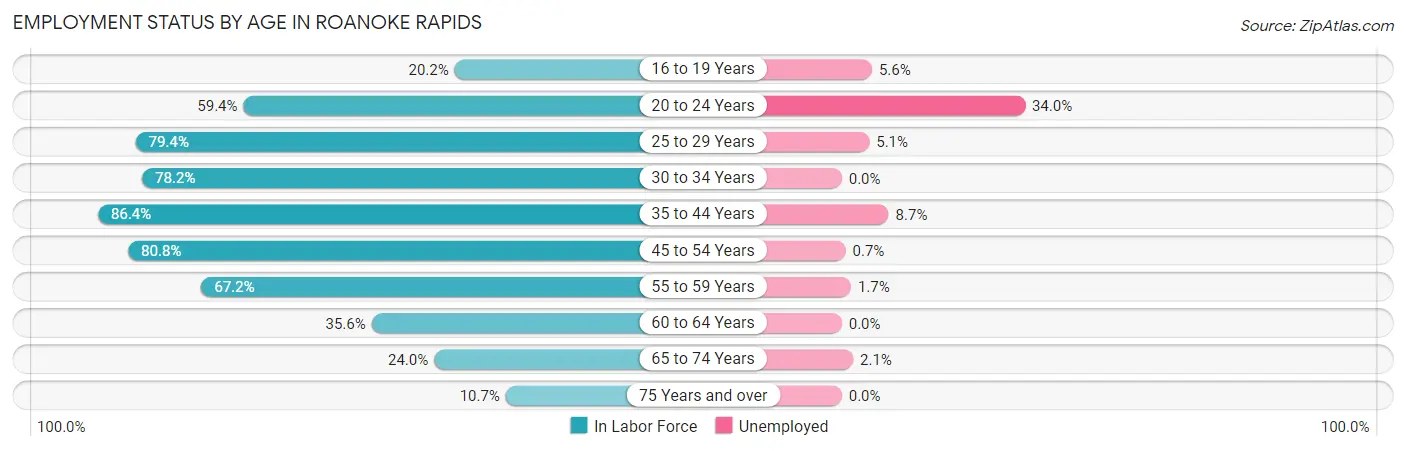
| Age Bracket | In Labor Force | Unemployed |
| 16 to 19 Years | 161 (20.2%) | 9 (5.6%) |
| 20 to 24 Years | 592 (59.4%) | 201 (34.0%) |
| 25 to 29 Years | 837 (79.4%) | 43 (5.1%) |
| 30 to 34 Years | 537 (78.2%) | 0 (0.0%) |
| 35 to 44 Years | 1,439 (86.4%) | 125 (8.7%) |
| 45 to 54 Years | 1,378 (80.8%) | 10 (0.7%) |
| 55 to 59 Years | 808 (67.2%) | 14 (1.7%) |
| 60 to 64 Years | 336 (35.6%) | 0 (0.0%) |
| 65 to 74 Years | 431 (24.0%) | 9 (2.1%) |
| 75 Years and over | 113 (10.7%) | 0 (0.0%) |
| Total | 6,632 (55.7%) | 411 (6.2%) |
Employment Status by Educational Attainment in Roanoke Rapids
According to labor force statistics for Roanoke Rapids, 73.5% of individuals (5,335) out of the total population between 25 and 64 years of age (7,259) are in the labor force, with 3.6% or 192 of them being unemployed. The group with the highest labor force participation rate are those with the educational attainment of bachelor's degree or higher, with 89.3% or 1,619 individuals in the labor force. Within the labor force, individuals with less than high school education have the highest percentage of unemployment, with 24.1% or 80 of them being unemployed.
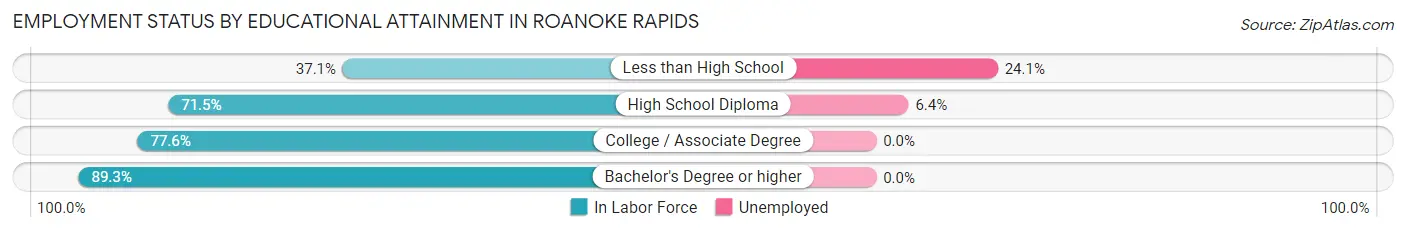
| Educational Attainment | In Labor Force | Unemployed |
| Less than High School | 332 (37.1%) | 216 (24.1%) |
| High School Diploma | 1,708 (71.5%) | 153 (6.4%) |
| College / Associate Degree | 1,677 (77.6%) | 0 (0.0%) |
| Bachelor's Degree or higher | 1,619 (89.3%) | 0 (0.0%) |
| Total | 5,335 (73.5%) | 261 (3.6%) |
Employment Occupations by Sex in Roanoke Rapids
Management, Business, Science and Arts Occupations
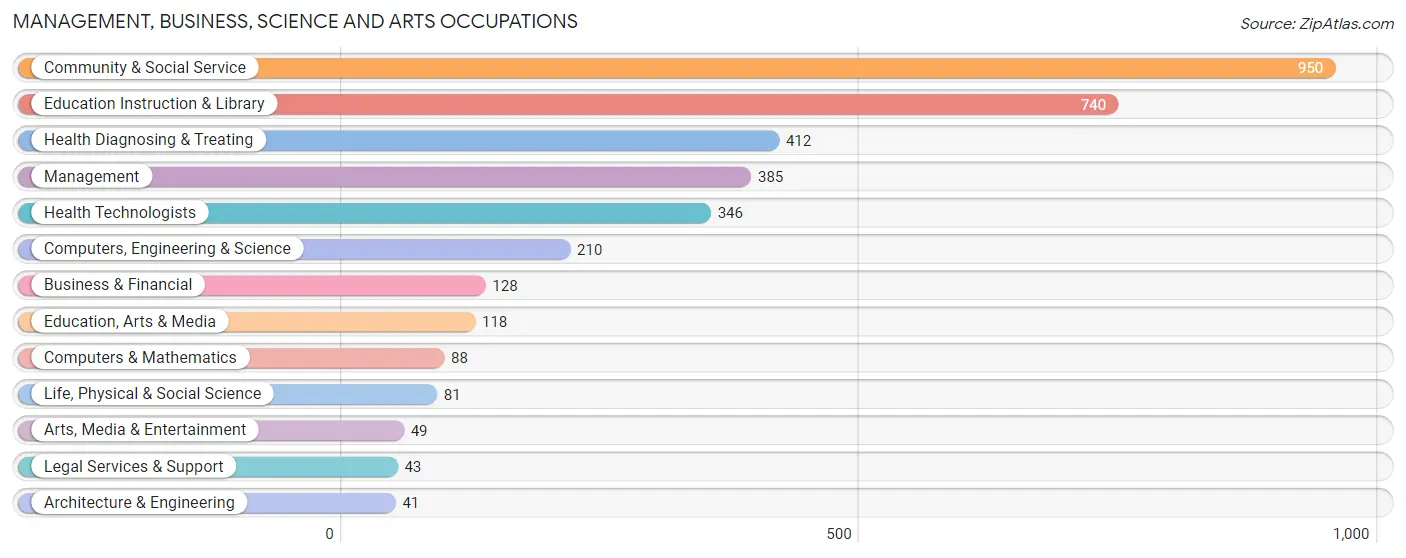
The most common Management, Business, Science and Arts occupations in Roanoke Rapids are Community & Social Service (950 | 15.3%), Education Instruction & Library (740 | 11.9%), Health Diagnosing & Treating (412 | 6.6%), Management (385 | 6.2%), and Health Technologists (346 | 5.6%).
Management, Business, Science and Arts Occupations by Sex
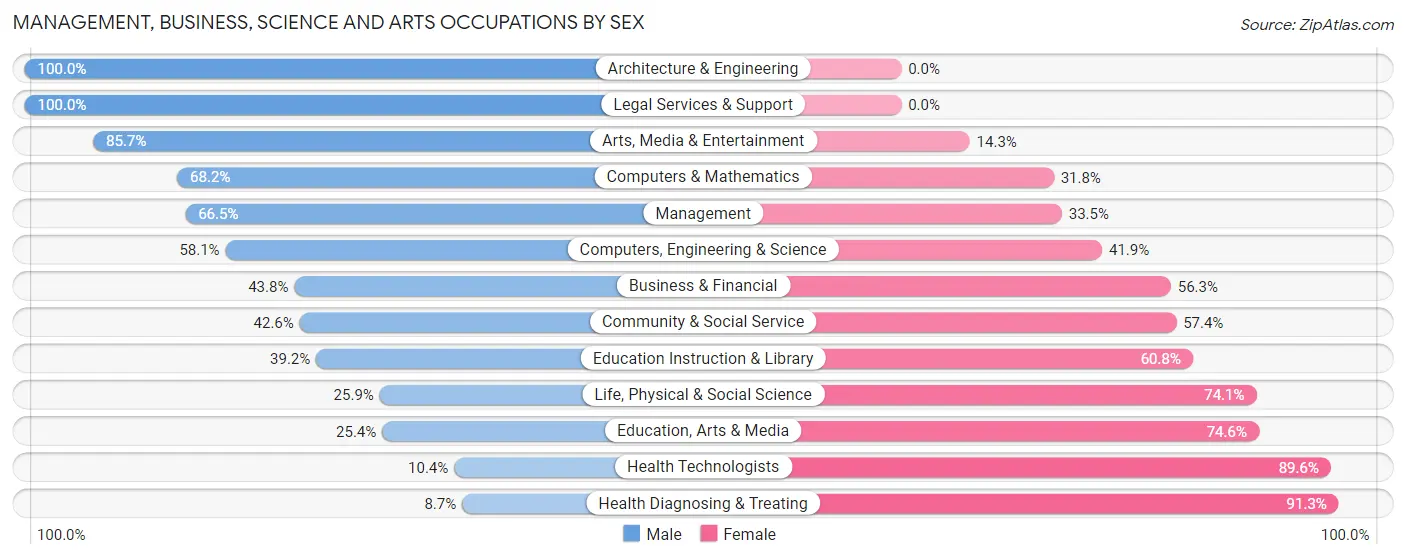
Within the Management, Business, Science and Arts occupations in Roanoke Rapids, the most male-oriented occupations are Architecture & Engineering (100.0%), Legal Services & Support (100.0%), and Arts, Media & Entertainment (85.7%), while the most female-oriented occupations are Health Diagnosing & Treating (91.3%), Health Technologists (89.6%), and Education, Arts & Media (74.6%).
| Occupation | Male | Female |
| Management | 256 (66.5%) | 129 (33.5%) |
| Business & Financial | 56 (43.8%) | 72 (56.2%) |
| Computers, Engineering & Science | 122 (58.1%) | 88 (41.9%) |
| Computers & Mathematics | 60 (68.2%) | 28 (31.8%) |
| Architecture & Engineering | 41 (100.0%) | 0 (0.0%) |
| Life, Physical & Social Science | 21 (25.9%) | 60 (74.1%) |
| Community & Social Service | 405 (42.6%) | 545 (57.4%) |
| Education, Arts & Media | 30 (25.4%) | 88 (74.6%) |
| Legal Services & Support | 43 (100.0%) | 0 (0.0%) |
| Education Instruction & Library | 290 (39.2%) | 450 (60.8%) |
| Arts, Media & Entertainment | 42 (85.7%) | 7 (14.3%) |
| Health Diagnosing & Treating | 36 (8.7%) | 376 (91.3%) |
| Health Technologists | 36 (10.4%) | 310 (89.6%) |
| Total (Category) | 875 (42.0%) | 1,210 (58.0%) |
| Total (Overall) | 2,968 (47.9%) | 3,233 (52.1%) |
Services Occupations
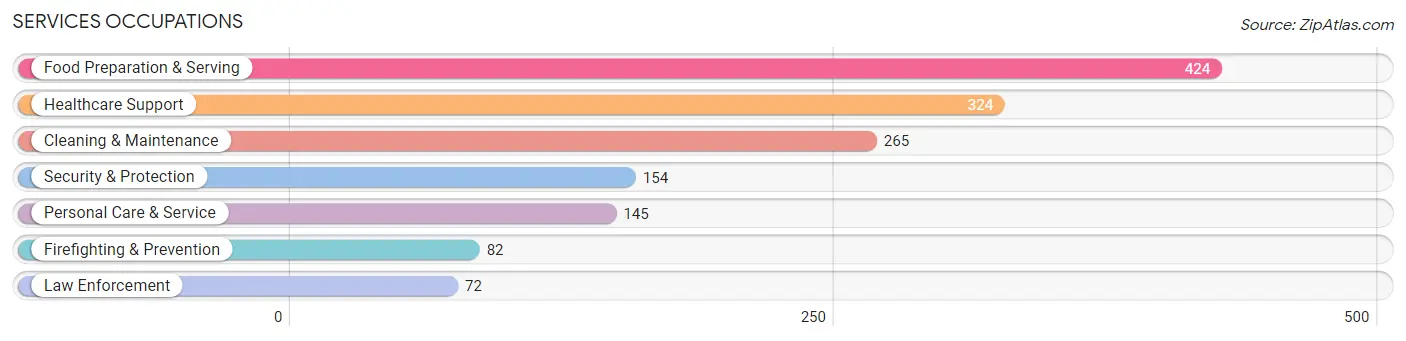
The most common Services occupations in Roanoke Rapids are Food Preparation & Serving (424 | 6.8%), Healthcare Support (324 | 5.2%), Cleaning & Maintenance (265 | 4.3%), Security & Protection (154 | 2.5%), and Personal Care & Service (145 | 2.3%).
Services Occupations by Sex
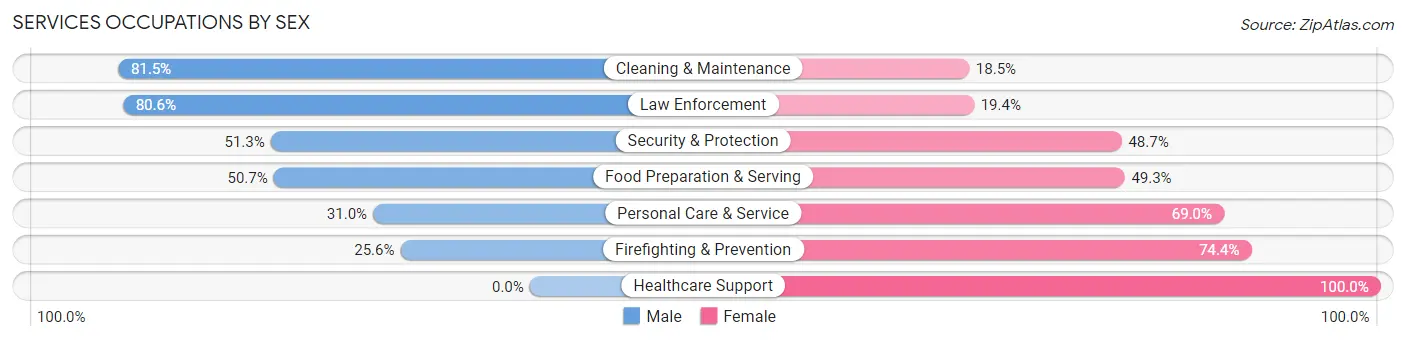
Within the Services occupations in Roanoke Rapids, the most male-oriented occupations are Cleaning & Maintenance (81.5%), Law Enforcement (80.6%), and Security & Protection (51.3%), while the most female-oriented occupations are Healthcare Support (100.0%), Firefighting & Prevention (74.4%), and Personal Care & Service (69.0%).
| Occupation | Male | Female |
| Healthcare Support | 0 (0.0%) | 324 (100.0%) |
| Security & Protection | 79 (51.3%) | 75 (48.7%) |
| Firefighting & Prevention | 21 (25.6%) | 61 (74.4%) |
| Law Enforcement | 58 (80.6%) | 14 (19.4%) |
| Food Preparation & Serving | 215 (50.7%) | 209 (49.3%) |
| Cleaning & Maintenance | 216 (81.5%) | 49 (18.5%) |
| Personal Care & Service | 45 (31.0%) | 100 (69.0%) |
| Total (Category) | 555 (42.3%) | 757 (57.7%) |
| Total (Overall) | 2,968 (47.9%) | 3,233 (52.1%) |
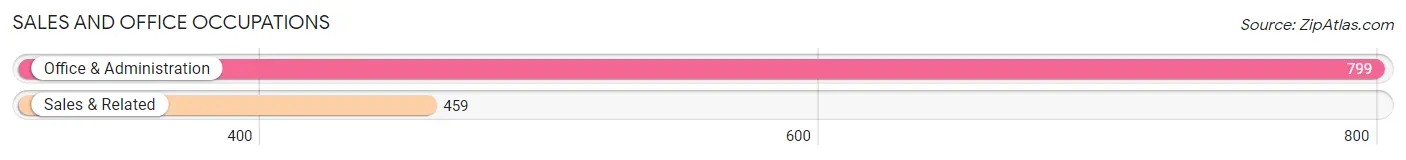
Sales and Office Occupations
The most common Sales and Office occupations in Roanoke Rapids are Office & Administration (799 | 12.9%), and Sales & Related (459 | 7.4%).
Sales and Office Occupations by Sex
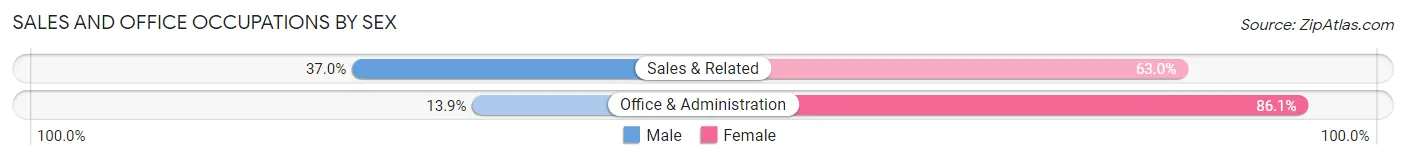
| Occupation | Male | Female |
| Sales & Related | 170 (37.0%) | 289 (63.0%) |
| Office & Administration | 111 (13.9%) | 688 (86.1%) |
| Total (Category) | 281 (22.3%) | 977 (77.7%) |
| Total (Overall) | 2,968 (47.9%) | 3,233 (52.1%) |
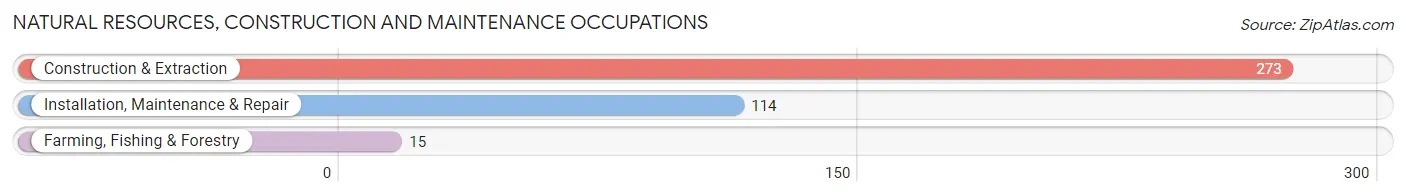
Natural Resources, Construction and Maintenance Occupations
The most common Natural Resources, Construction and Maintenance occupations in Roanoke Rapids are Construction & Extraction (273 | 4.4%), Installation, Maintenance & Repair (114 | 1.8%), and Farming, Fishing & Forestry (15 | 0.2%).
Natural Resources, Construction and Maintenance Occupations by Sex
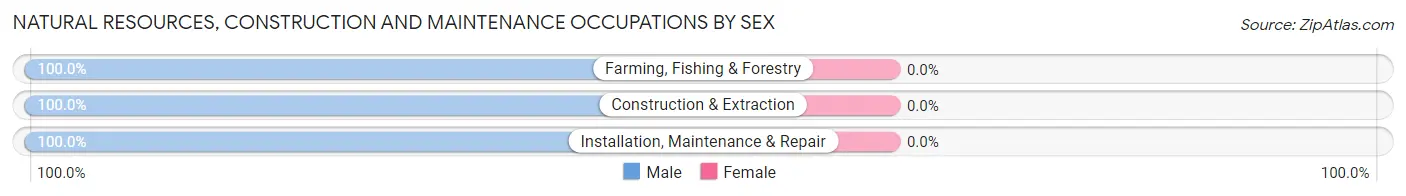
| Occupation | Male | Female |
| Farming, Fishing & Forestry | 15 (100.0%) | 0 (0.0%) |
| Construction & Extraction | 273 (100.0%) | 0 (0.0%) |
| Installation, Maintenance & Repair | 114 (100.0%) | 0 (0.0%) |
| Total (Category) | 402 (100.0%) | 0 (0.0%) |
| Total (Overall) | 2,968 (47.9%) | 3,233 (52.1%) |
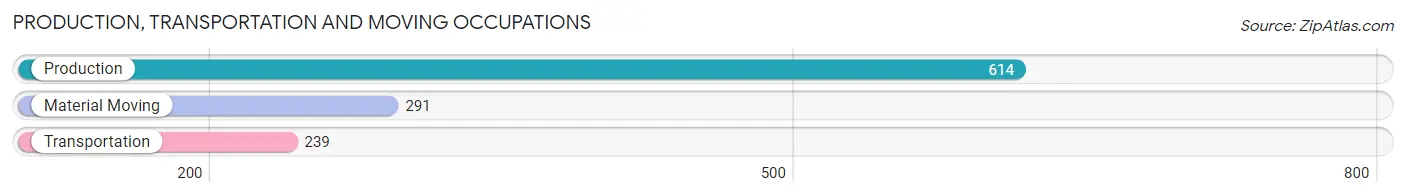
Production, Transportation and Moving Occupations
The most common Production, Transportation and Moving occupations in Roanoke Rapids are Production (614 | 9.9%), Material Moving (291 | 4.7%), and Transportation (239 | 3.8%).
Production, Transportation and Moving Occupations by Sex
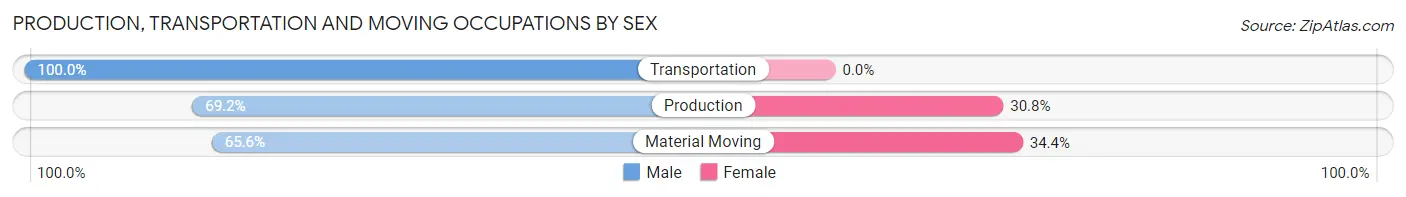
| Occupation | Male | Female |
| Production | 425 (69.2%) | 189 (30.8%) |
| Transportation | 239 (100.0%) | 0 (0.0%) |
| Material Moving | 191 (65.6%) | 100 (34.4%) |
| Total (Category) | 855 (74.7%) | 289 (25.3%) |
| Total (Overall) | 2,968 (47.9%) | 3,233 (52.1%) |
Employment Industries by Sex in Roanoke Rapids
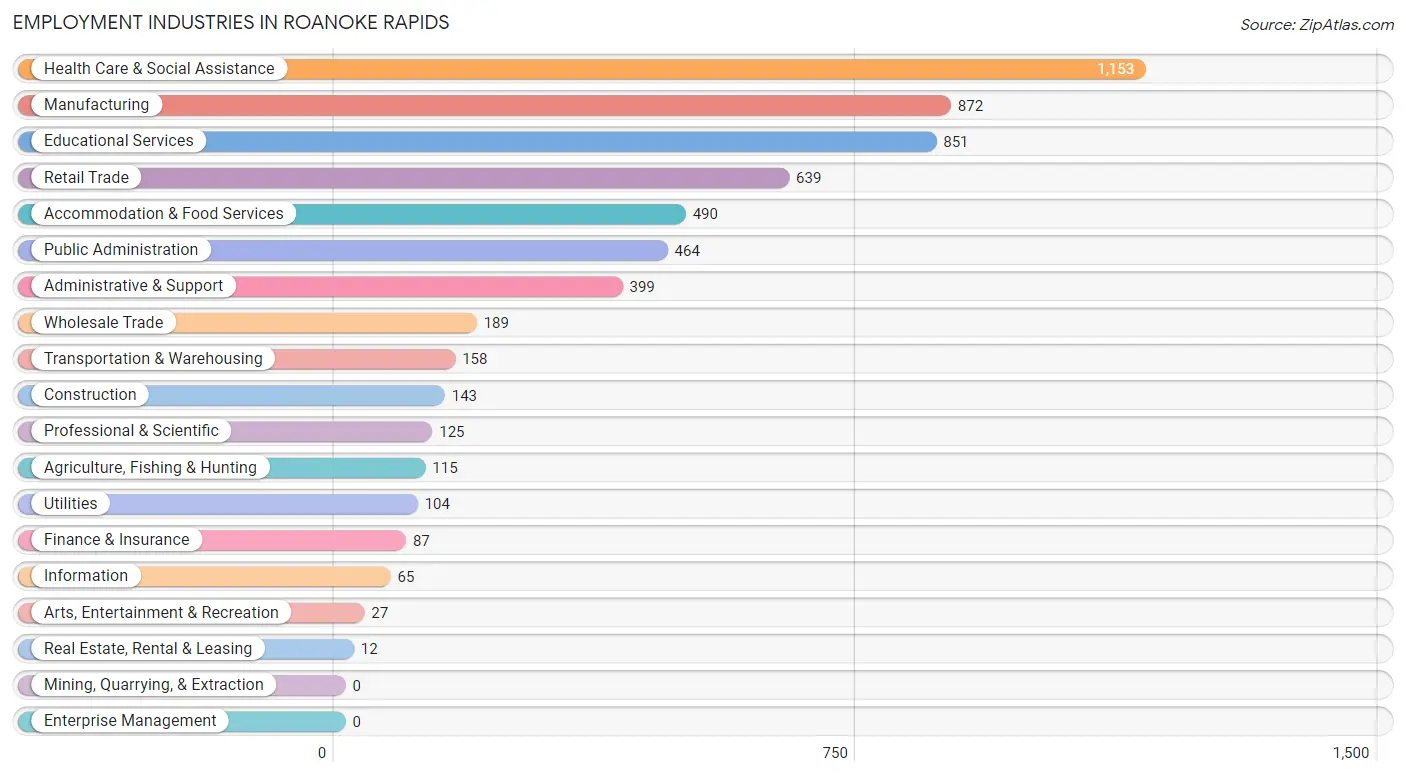
Employment Industries in Roanoke Rapids
The major employment industries in Roanoke Rapids include Health Care & Social Assistance (1,153 | 18.6%), Manufacturing (872 | 14.1%), Educational Services (851 | 13.7%), Retail Trade (639 | 10.3%), and Accommodation & Food Services (490 | 7.9%).
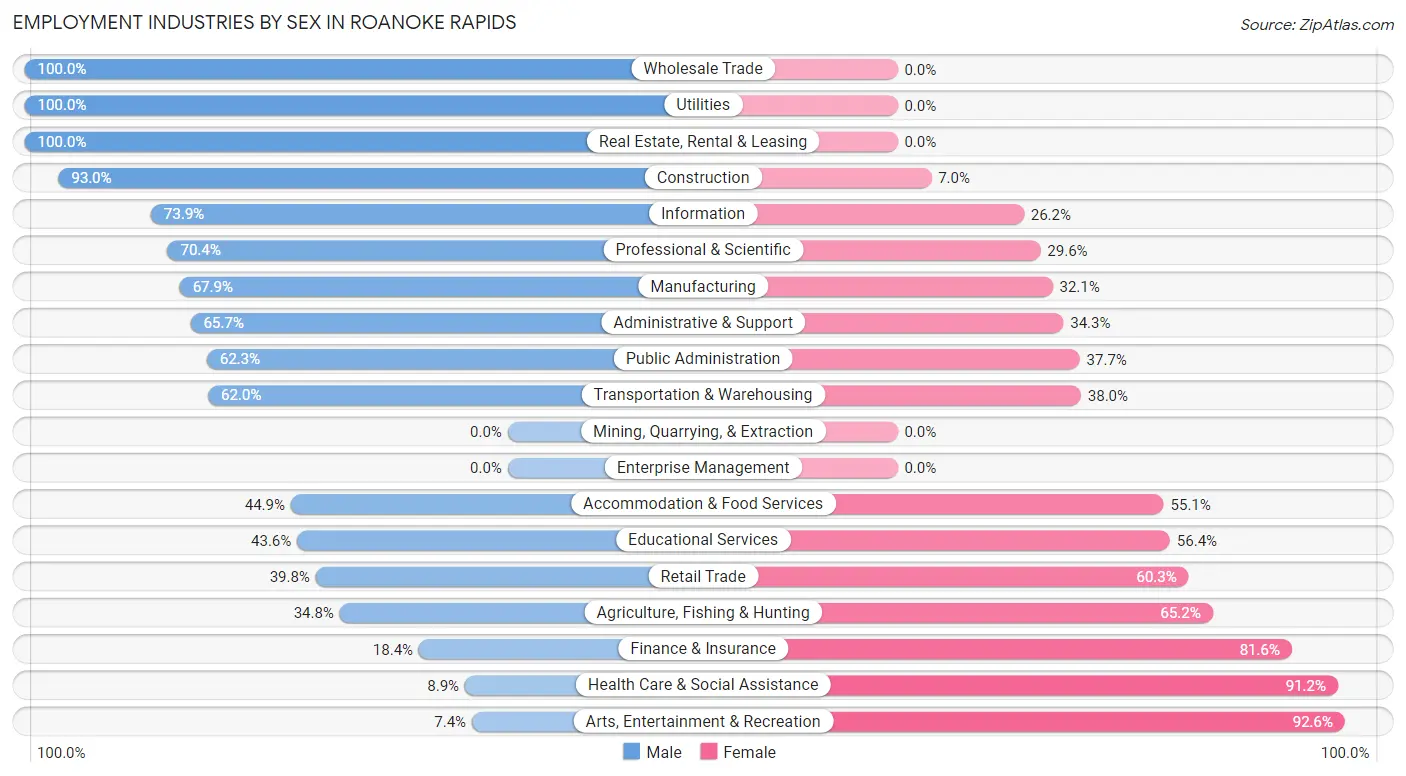
Employment Industries by Sex in Roanoke Rapids
The Roanoke Rapids industries that see more men than women are Wholesale Trade (100.0%), Utilities (100.0%), and Real Estate, Rental & Leasing (100.0%), whereas the industries that tend to have a higher number of women are Arts, Entertainment & Recreation (92.6%), Health Care & Social Assistance (91.1%), and Finance & Insurance (81.6%).
| Industry | Male | Female |
| Agriculture, Fishing & Hunting | 40 (34.8%) | 75 (65.2%) |
| Mining, Quarrying, & Extraction | 0 (0.0%) | 0 (0.0%) |
| Construction | 133 (93.0%) | 10 (7.0%) |
| Manufacturing | 592 (67.9%) | 280 (32.1%) |
| Wholesale Trade | 189 (100.0%) | 0 (0.0%) |
| Retail Trade | 254 (39.8%) | 385 (60.3%) |
| Transportation & Warehousing | 98 (62.0%) | 60 (38.0%) |
| Utilities | 104 (100.0%) | 0 (0.0%) |
| Information | 48 (73.9%) | 17 (26.2%) |
| Finance & Insurance | 16 (18.4%) | 71 (81.6%) |
| Real Estate, Rental & Leasing | 12 (100.0%) | 0 (0.0%) |
| Professional & Scientific | 88 (70.4%) | 37 (29.6%) |
| Enterprise Management | 0 (0.0%) | 0 (0.0%) |
| Administrative & Support | 262 (65.7%) | 137 (34.3%) |
| Educational Services | 371 (43.6%) | 480 (56.4%) |
| Health Care & Social Assistance | 102 (8.8%) | 1,051 (91.1%) |
| Arts, Entertainment & Recreation | 2 (7.4%) | 25 (92.6%) |
| Accommodation & Food Services | 220 (44.9%) | 270 (55.1%) |
| Public Administration | 289 (62.3%) | 175 (37.7%) |
| Total | 2,968 (47.9%) | 3,233 (52.1%) |
Education in Roanoke Rapids
School Enrollment in Roanoke Rapids
The most common levels of schooling among the 3,446 students in Roanoke Rapids are high school (970 | 28.1%), middle school (914 | 26.5%), and elementary school (569 | 16.5%).
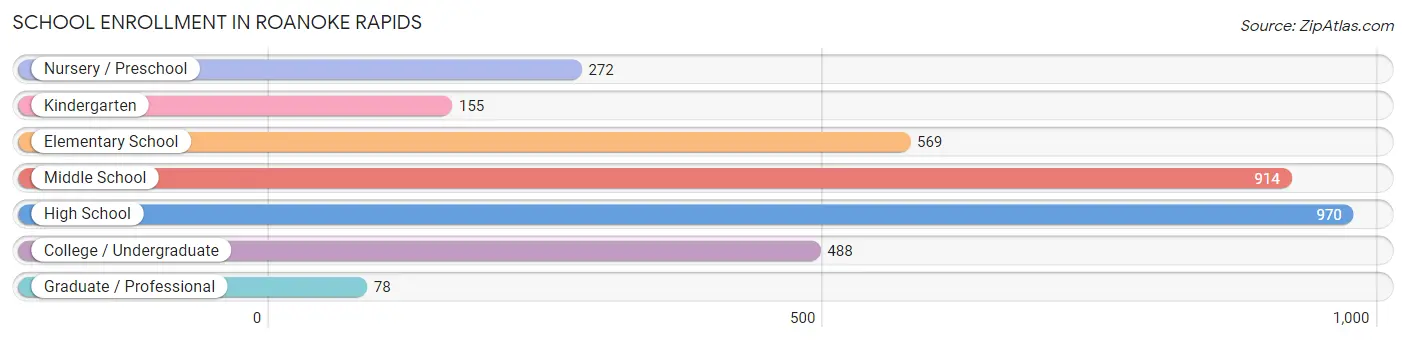
| School Level | # Students | % Students |
| Nursery / Preschool | 272 | 7.9% |
| Kindergarten | 155 | 4.5% |
| Elementary School | 569 | 16.5% |
| Middle School | 914 | 26.5% |
| High School | 970 | 28.1% |
| College / Undergraduate | 488 | 14.2% |
| Graduate / Professional | 78 | 2.3% |
| Total | 3,446 | 100.0% |
School Enrollment by Age by Funding Source in Roanoke Rapids
Out of a total of 3,446 students who are enrolled in schools in Roanoke Rapids, 265 (7.7%) attend a private institution, while the remaining 3,181 (92.3%) are enrolled in public schools. The age group of 35 years and over has the highest likelihood of being enrolled in private schools, with 49 (21.9% in the age bracket) enrolled. Conversely, the age group of 3 to 4 year olds has the lowest likelihood of being enrolled in a private school, with 179 (100.0% in the age bracket) attending a public institution.
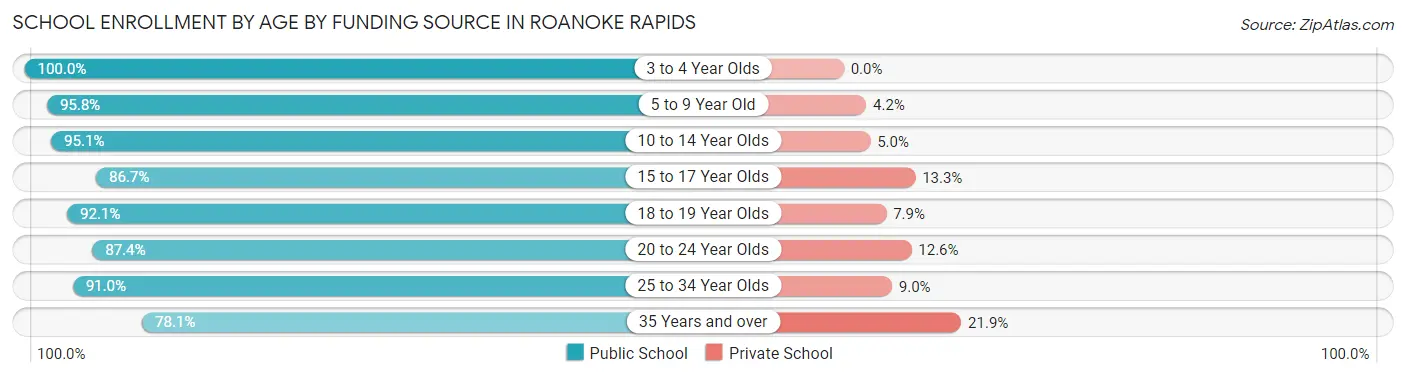
| Age Bracket | Public School | Private School |
| 3 to 4 Year Olds | 179 (100.0%) | 0 (0.0%) |
| 5 to 9 Year Old | 598 (95.8%) | 26 (4.2%) |
| 10 to 14 Year Olds | 1,268 (95.1%) | 66 (5.0%) |
| 15 to 17 Year Olds | 501 (86.7%) | 77 (13.3%) |
| 18 to 19 Year Olds | 221 (92.1%) | 19 (7.9%) |
| 20 to 24 Year Olds | 97 (87.4%) | 14 (12.6%) |
| 25 to 34 Year Olds | 142 (91.0%) | 14 (9.0%) |
| 35 Years and over | 175 (78.1%) | 49 (21.9%) |
| Total | 3,181 (92.3%) | 265 (7.7%) |
Educational Attainment by Field of Study in Roanoke Rapids
Science & technology (476 | 18.4%), education (359 | 13.9%), arts & humanities (291 | 11.3%), business (267 | 10.3%), and social sciences (245 | 9.5%) are the most common fields of study among 2,584 individuals in Roanoke Rapids who have obtained a bachelor's degree or higher.
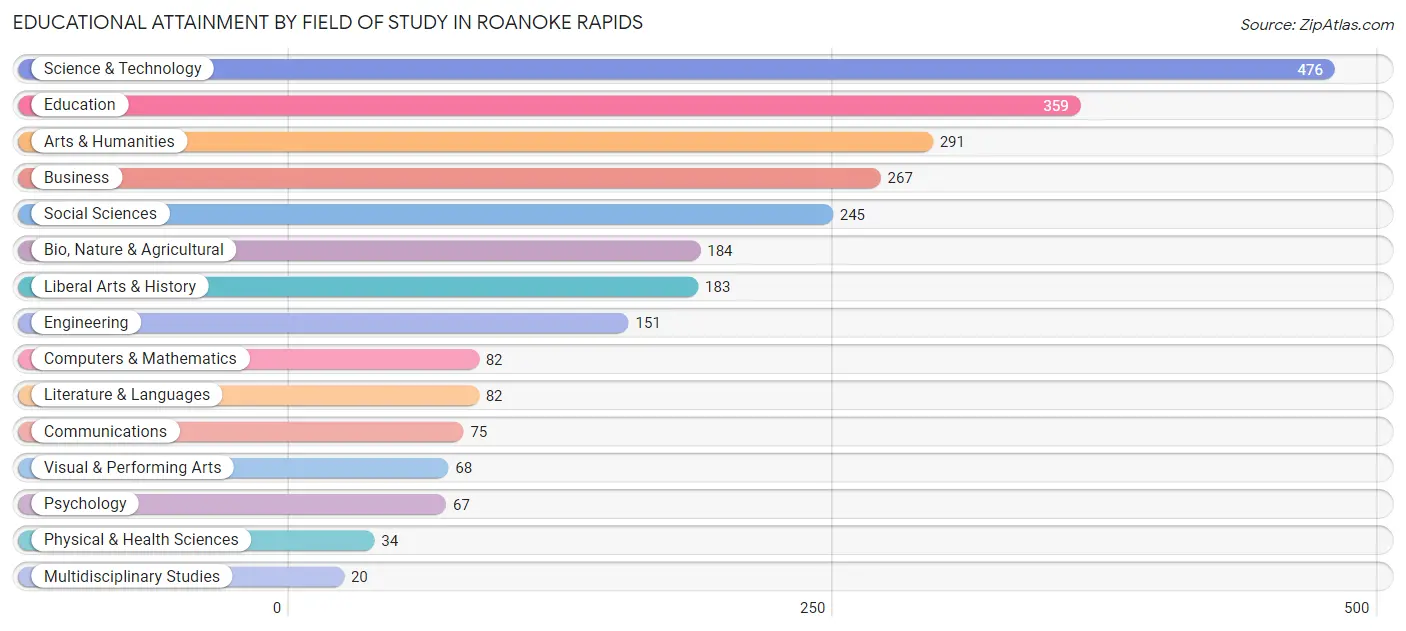
| Field of Study | # Graduates | % Graduates |
| Computers & Mathematics | 82 | 3.2% |
| Bio, Nature & Agricultural | 184 | 7.1% |
| Physical & Health Sciences | 34 | 1.3% |
| Psychology | 67 | 2.6% |
| Social Sciences | 245 | 9.5% |
| Engineering | 151 | 5.8% |
| Multidisciplinary Studies | 20 | 0.8% |
| Science & Technology | 476 | 18.4% |
| Business | 267 | 10.3% |
| Education | 359 | 13.9% |
| Literature & Languages | 82 | 3.2% |
| Liberal Arts & History | 183 | 7.1% |
| Visual & Performing Arts | 68 | 2.6% |
| Communications | 75 | 2.9% |
| Arts & Humanities | 291 | 11.3% |
| Total | 2,584 | 100.0% |
Transportation & Commute in Roanoke Rapids
Vehicle Availability by Sex in Roanoke Rapids
The most prevalent vehicle ownership categories in Roanoke Rapids are males with 2 vehicles (1,076, accounting for 36.1%) and females with 2 vehicles (1,046, making up 34.7%).
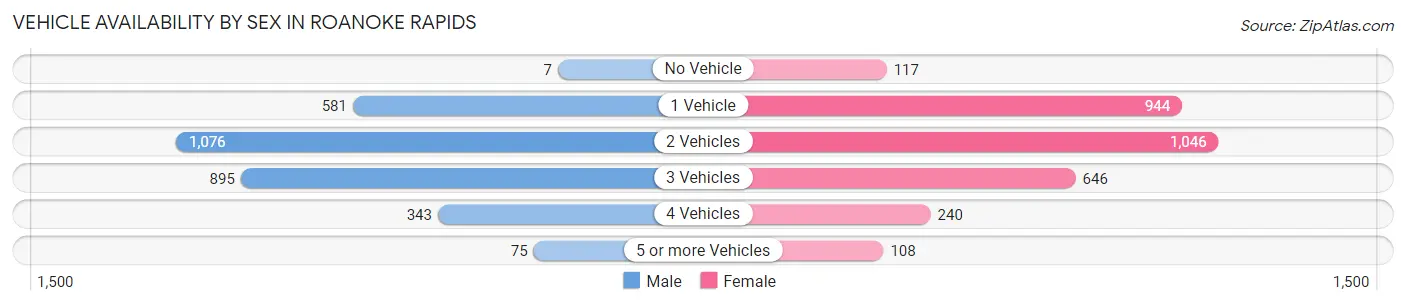
| Vehicles Available | Male | Female |
| No Vehicle | 7 (0.2%) | 117 (3.8%) |
| 1 Vehicle | 581 (19.5%) | 944 (30.4%) |
| 2 Vehicles | 1,076 (36.1%) | 1,046 (33.7%) |
| 3 Vehicles | 895 (30.1%) | 646 (20.8%) |
| 4 Vehicles | 343 (11.5%) | 240 (7.7%) |
| 5 or more Vehicles | 75 (2.5%) | 108 (3.5%) |
| Total | 2,977 (100.0%) | 3,101 (100.0%) |
Commute Time in Roanoke Rapids
The most frequently occuring commute durations in Roanoke Rapids are 5 to 9 minutes (1,508 commuters, 26.2%), 10 to 14 minutes (1,059 commuters, 18.4%), and 15 to 19 minutes (727 commuters, 12.6%).
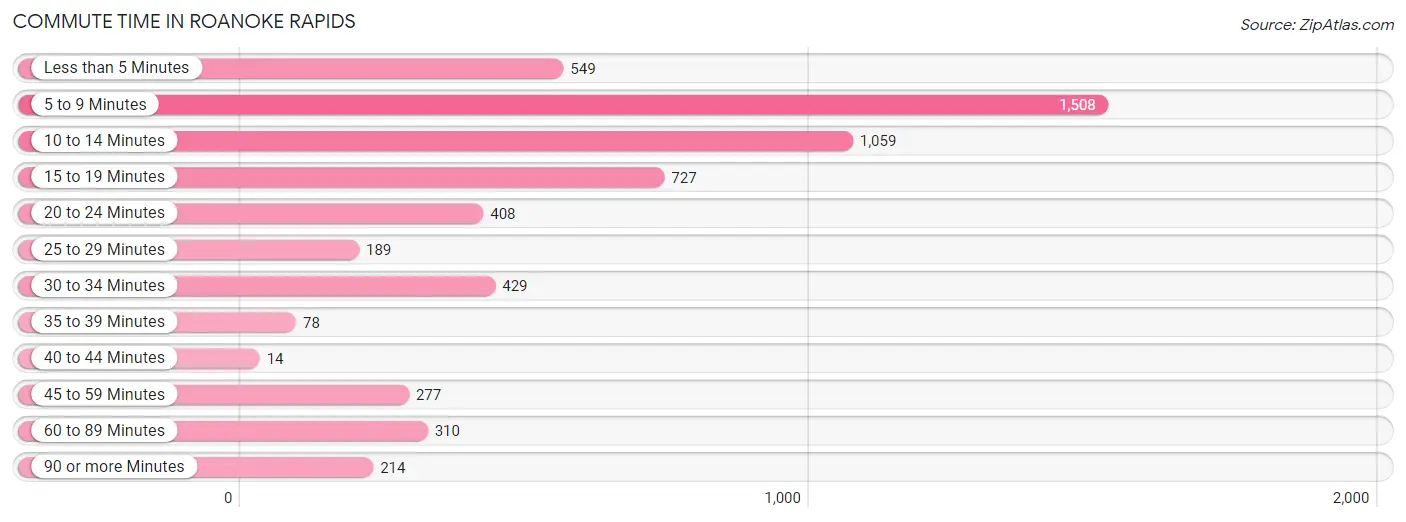
| Commute Time | # Commuters | % Commuters |
| Less than 5 Minutes | 549 | 9.5% |
| 5 to 9 Minutes | 1,508 | 26.2% |
| 10 to 14 Minutes | 1,059 | 18.4% |
| 15 to 19 Minutes | 727 | 12.6% |
| 20 to 24 Minutes | 408 | 7.1% |
| 25 to 29 Minutes | 189 | 3.3% |
| 30 to 34 Minutes | 429 | 7.4% |
| 35 to 39 Minutes | 78 | 1.3% |
| 40 to 44 Minutes | 14 | 0.2% |
| 45 to 59 Minutes | 277 | 4.8% |
| 60 to 89 Minutes | 310 | 5.4% |
| 90 or more Minutes | 214 | 3.7% |
Commute Time by Sex in Roanoke Rapids
The most common commute times in Roanoke Rapids are 5 to 9 minutes (657 commuters, 22.2%) for males and 5 to 9 minutes (851 commuters, 30.3%) for females.
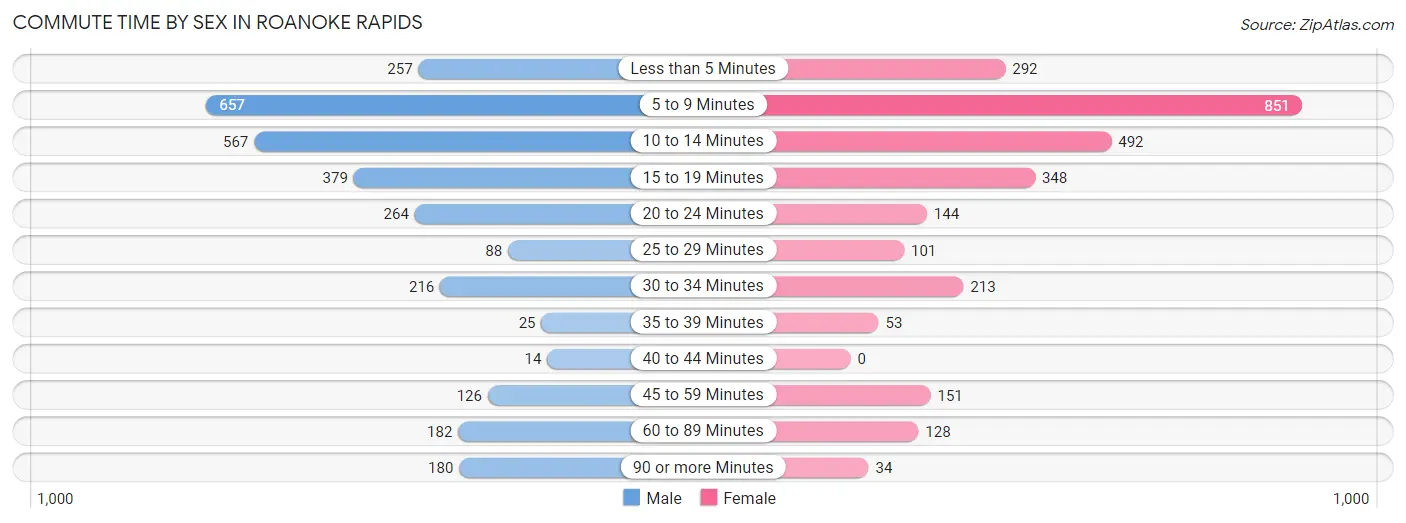
| Commute Time | Male | Female |
| Less than 5 Minutes | 257 (8.7%) | 292 (10.4%) |
| 5 to 9 Minutes | 657 (22.2%) | 851 (30.3%) |
| 10 to 14 Minutes | 567 (19.2%) | 492 (17.5%) |
| 15 to 19 Minutes | 379 (12.8%) | 348 (12.4%) |
| 20 to 24 Minutes | 264 (8.9%) | 144 (5.1%) |
| 25 to 29 Minutes | 88 (3.0%) | 101 (3.6%) |
| 30 to 34 Minutes | 216 (7.3%) | 213 (7.6%) |
| 35 to 39 Minutes | 25 (0.9%) | 53 (1.9%) |
| 40 to 44 Minutes | 14 (0.5%) | 0 (0.0%) |
| 45 to 59 Minutes | 126 (4.3%) | 151 (5.4%) |
| 60 to 89 Minutes | 182 (6.2%) | 128 (4.6%) |
| 90 or more Minutes | 180 (6.1%) | 34 (1.2%) |
Time of Departure to Work by Sex in Roanoke Rapids
The most frequent times of departure to work in Roanoke Rapids are 6:00 AM to 6:29 AM (408, 13.8%) for males and 7:00 AM to 7:29 AM (539, 19.2%) for females.
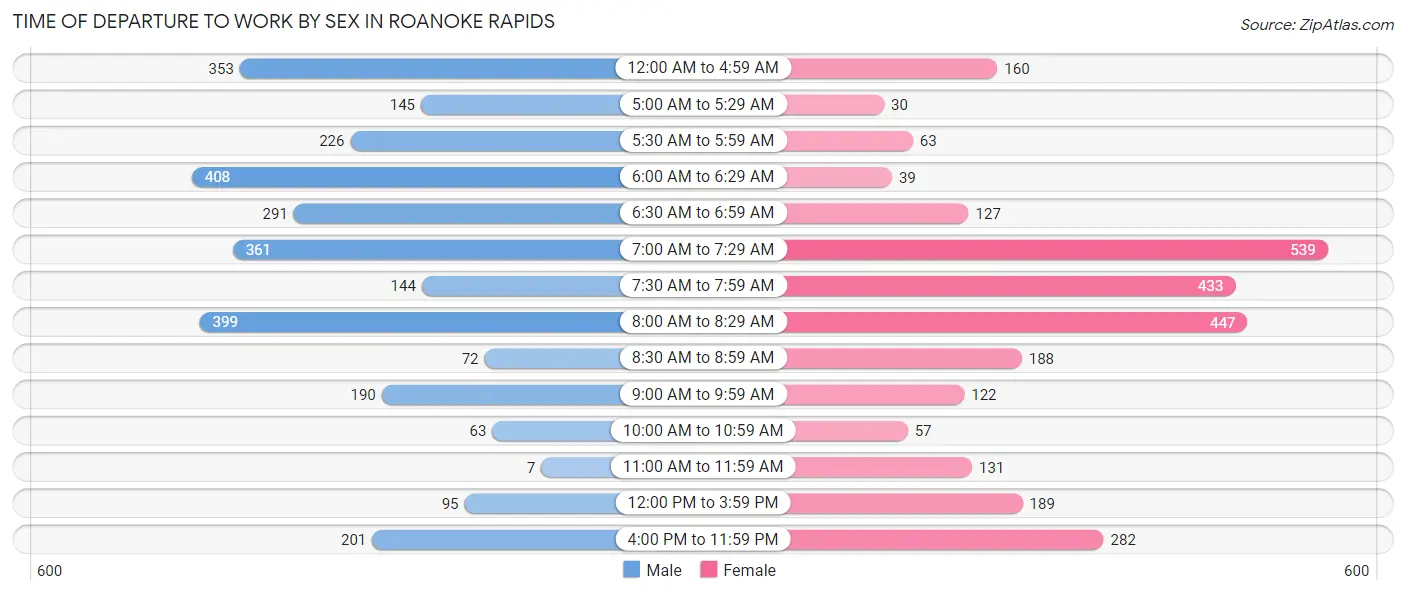
| Time of Departure | Male | Female |
| 12:00 AM to 4:59 AM | 353 (11.9%) | 160 (5.7%) |
| 5:00 AM to 5:29 AM | 145 (4.9%) | 30 (1.1%) |
| 5:30 AM to 5:59 AM | 226 (7.6%) | 63 (2.2%) |
| 6:00 AM to 6:29 AM | 408 (13.8%) | 39 (1.4%) |
| 6:30 AM to 6:59 AM | 291 (9.9%) | 127 (4.5%) |
| 7:00 AM to 7:29 AM | 361 (12.2%) | 539 (19.2%) |
| 7:30 AM to 7:59 AM | 144 (4.9%) | 433 (15.4%) |
| 8:00 AM to 8:29 AM | 399 (13.5%) | 447 (15.9%) |
| 8:30 AM to 8:59 AM | 72 (2.4%) | 188 (6.7%) |
| 9:00 AM to 9:59 AM | 190 (6.4%) | 122 (4.3%) |
| 10:00 AM to 10:59 AM | 63 (2.1%) | 57 (2.0%) |
| 11:00 AM to 11:59 AM | 7 (0.2%) | 131 (4.7%) |
| 12:00 PM to 3:59 PM | 95 (3.2%) | 189 (6.7%) |
| 4:00 PM to 11:59 PM | 201 (6.8%) | 282 (10.1%) |
| Total | 2,955 (100.0%) | 2,807 (100.0%) |
Housing Occupancy in Roanoke Rapids
Occupancy by Ownership in Roanoke Rapids
Of the total 6,318 dwellings in Roanoke Rapids, owner-occupied units account for 3,178 (50.3%), while renter-occupied units make up 3,140 (49.7%).
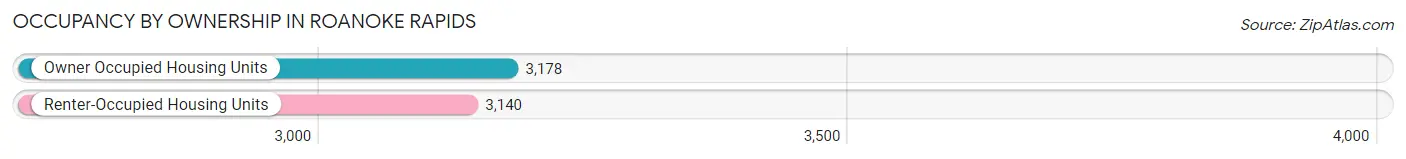
| Occupancy | # Housing Units | % Housing Units |
| Owner Occupied Housing Units | 3,178 | 50.3% |
| Renter-Occupied Housing Units | 3,140 | 49.7% |
| Total Occupied Housing Units | 6,318 | 100.0% |
Occupancy by Household Size in Roanoke Rapids
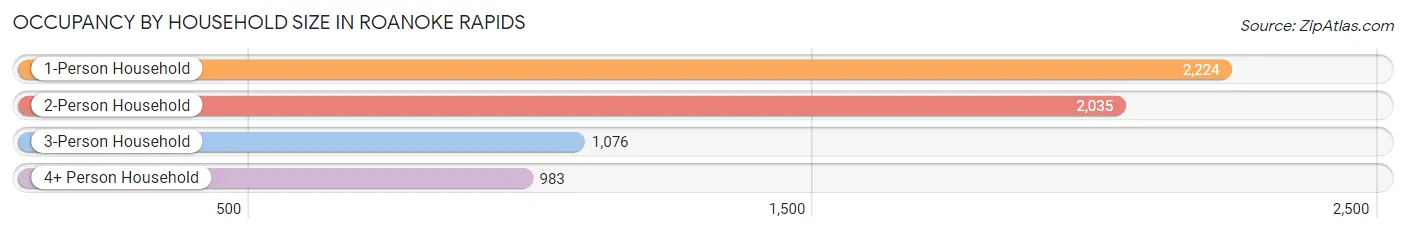
| Household Size | # Housing Units | % Housing Units |
| 1-Person Household | 2,224 | 35.2% |
| 2-Person Household | 2,035 | 32.2% |
| 3-Person Household | 1,076 | 17.0% |
| 4+ Person Household | 983 | 15.6% |
| Total Housing Units | 6,318 | 100.0% |
Occupancy by Ownership by Household Size in Roanoke Rapids
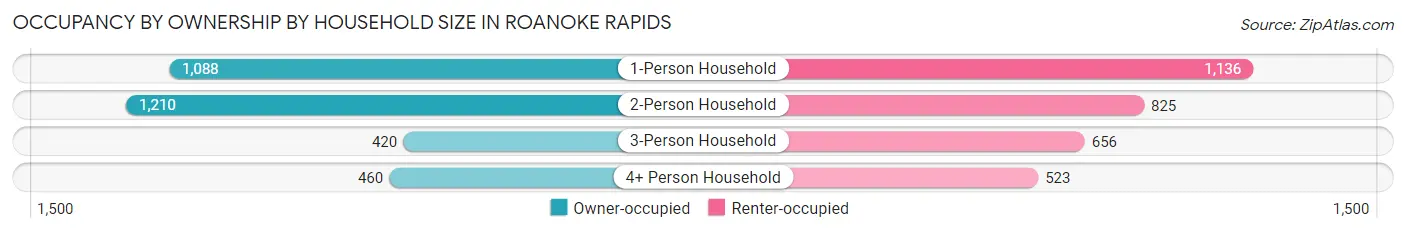
| Household Size | Owner-occupied | Renter-occupied |
| 1-Person Household | 1,088 (48.9%) | 1,136 (51.1%) |
| 2-Person Household | 1,210 (59.5%) | 825 (40.5%) |
| 3-Person Household | 420 (39.0%) | 656 (61.0%) |
| 4+ Person Household | 460 (46.8%) | 523 (53.2%) |
| Total Housing Units | 3,178 (50.3%) | 3,140 (49.7%) |
Occupancy by Educational Attainment in Roanoke Rapids
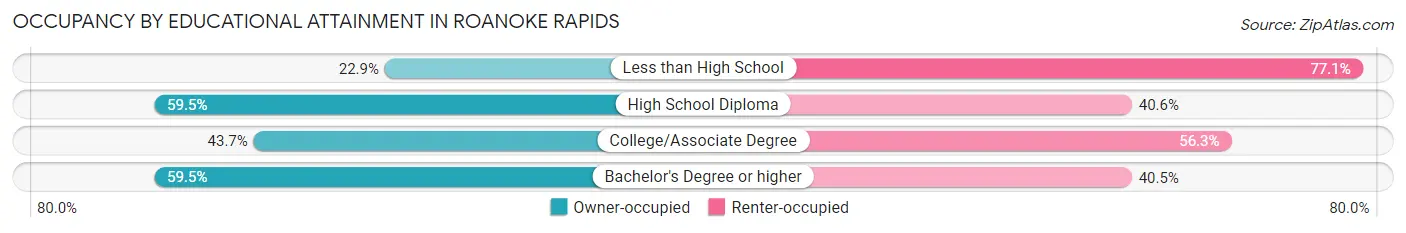
| Household Size | Owner-occupied | Renter-occupied |
| Less than High School | 193 (22.9%) | 651 (77.1%) |
| High School Diploma | 1,343 (59.5%) | 916 (40.6%) |
| College/Associate Degree | 747 (43.7%) | 963 (56.3%) |
| Bachelor's Degree or higher | 895 (59.5%) | 610 (40.5%) |
Occupancy by Age of Householder in Roanoke Rapids
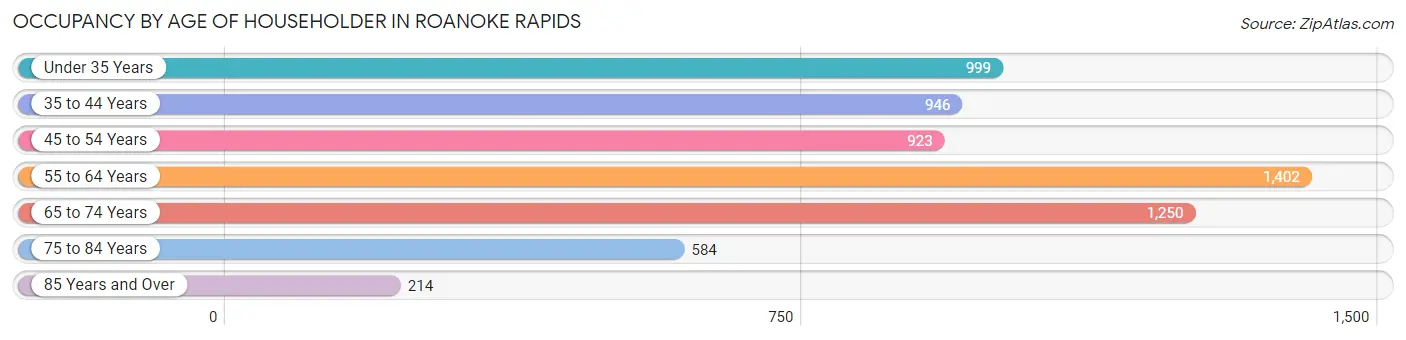
| Age Bracket | # Households | % Households |
| Under 35 Years | 999 | 15.8% |
| 35 to 44 Years | 946 | 15.0% |
| 45 to 54 Years | 923 | 14.6% |
| 55 to 64 Years | 1,402 | 22.2% |
| 65 to 74 Years | 1,250 | 19.8% |
| 75 to 84 Years | 584 | 9.2% |
| 85 Years and Over | 214 | 3.4% |
| Total | 6,318 | 100.0% |
Housing Finances in Roanoke Rapids
Median Income by Occupancy in Roanoke Rapids
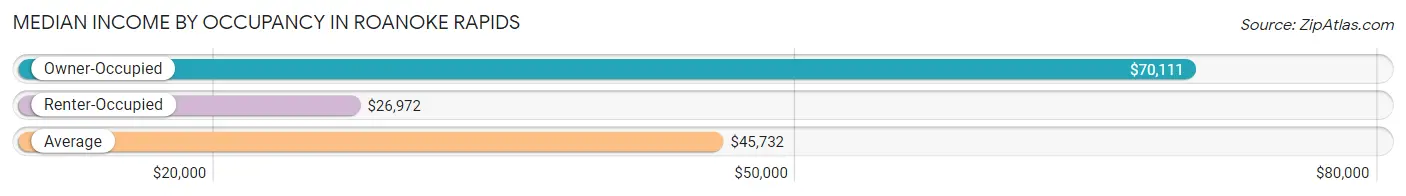
| Occupancy Type | # Households | Median Income |
| Owner-Occupied | 3,178 (50.3%) | $70,111 |
| Renter-Occupied | 3,140 (49.7%) | $26,972 |
| Average | 6,318 (100.0%) | $45,732 |
Occupancy by Householder Income Bracket in Roanoke Rapids
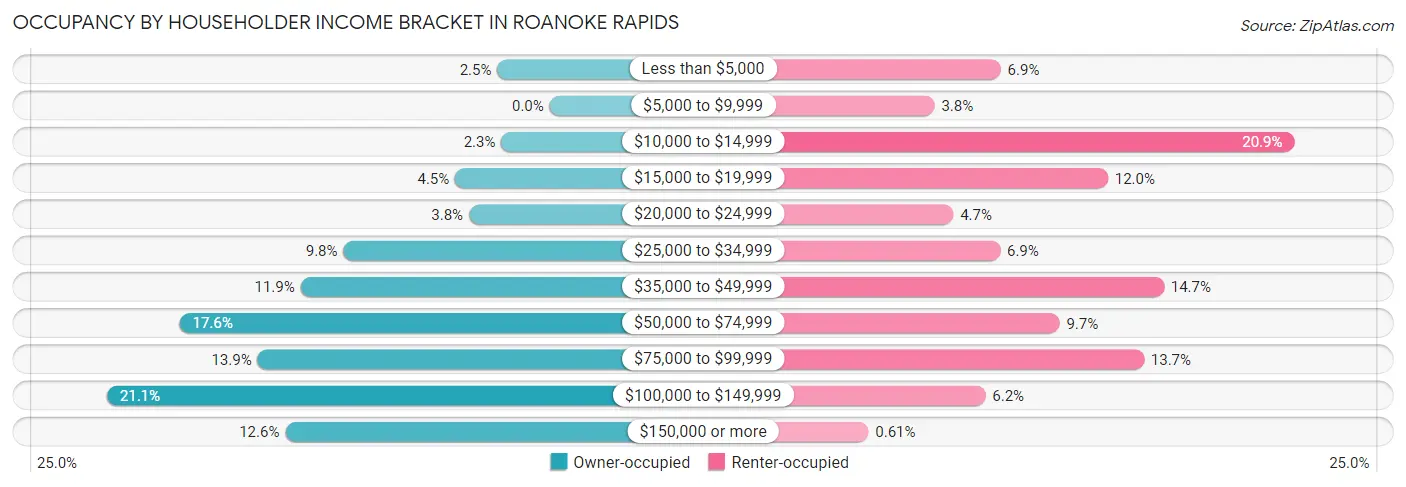
| Income Bracket | Owner-occupied | Renter-occupied |
| Less than $5,000 | 79 (2.5%) | 217 (6.9%) |
| $5,000 to $9,999 | 0 (0.0%) | 118 (3.8%) |
| $10,000 to $14,999 | 73 (2.3%) | 656 (20.9%) |
| $15,000 to $19,999 | 143 (4.5%) | 377 (12.0%) |
| $20,000 to $24,999 | 122 (3.8%) | 146 (4.6%) |
| $25,000 to $34,999 | 312 (9.8%) | 216 (6.9%) |
| $35,000 to $49,999 | 377 (11.9%) | 461 (14.7%) |
| $50,000 to $74,999 | 560 (17.6%) | 305 (9.7%) |
| $75,000 to $99,999 | 442 (13.9%) | 431 (13.7%) |
| $100,000 to $149,999 | 670 (21.1%) | 194 (6.2%) |
| $150,000 or more | 400 (12.6%) | 19 (0.6%) |
| Total | 3,178 (100.0%) | 3,140 (100.0%) |
Monthly Housing Cost Tiers in Roanoke Rapids
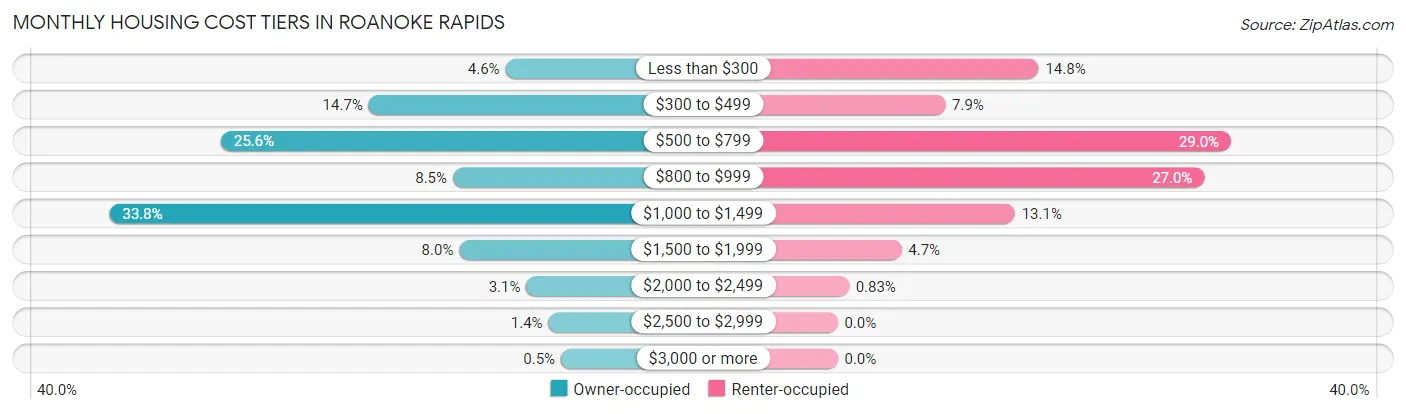
| Monthly Cost | Owner-occupied | Renter-occupied |
| Less than $300 | 146 (4.6%) | 465 (14.8%) |
| $300 to $499 | 466 (14.7%) | 249 (7.9%) |
| $500 to $799 | 812 (25.6%) | 910 (29.0%) |
| $800 to $999 | 269 (8.5%) | 848 (27.0%) |
| $1,000 to $1,499 | 1,073 (33.8%) | 410 (13.1%) |
| $1,500 to $1,999 | 254 (8.0%) | 148 (4.7%) |
| $2,000 to $2,499 | 97 (3.0%) | 26 (0.8%) |
| $2,500 to $2,999 | 45 (1.4%) | 0 (0.0%) |
| $3,000 or more | 16 (0.5%) | 0 (0.0%) |
| Total | 3,178 (100.0%) | 3,140 (100.0%) |
Physical Housing Characteristics in Roanoke Rapids
Housing Structures in Roanoke Rapids
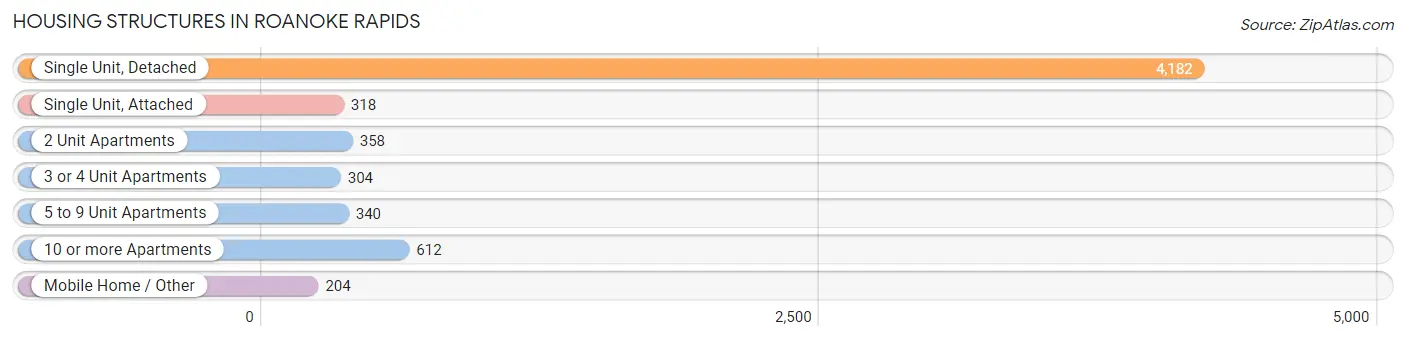
| Structure Type | # Housing Units | % Housing Units |
| Single Unit, Detached | 4,182 | 66.2% |
| Single Unit, Attached | 318 | 5.0% |
| 2 Unit Apartments | 358 | 5.7% |
| 3 or 4 Unit Apartments | 304 | 4.8% |
| 5 to 9 Unit Apartments | 340 | 5.4% |
| 10 or more Apartments | 612 | 9.7% |
| Mobile Home / Other | 204 | 3.2% |
| Total | 6,318 | 100.0% |
Housing Structures by Occupancy in Roanoke Rapids
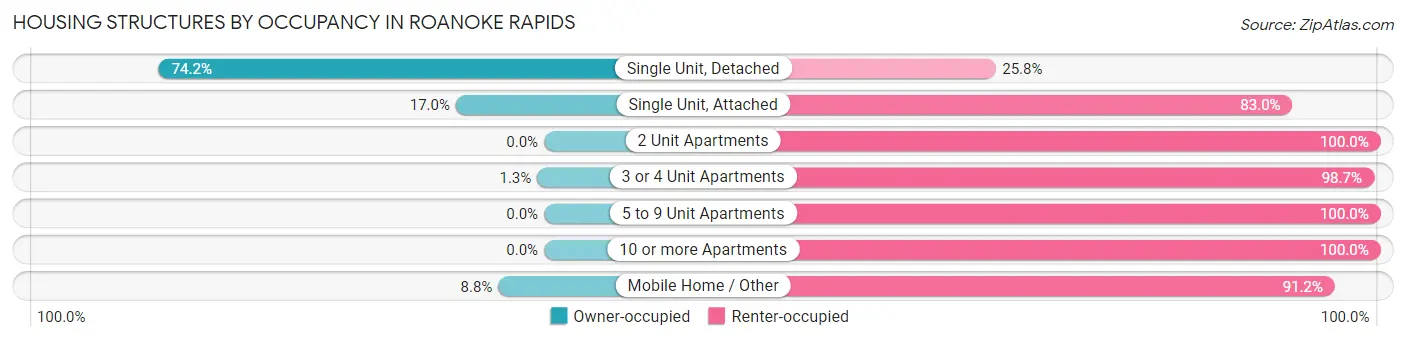
| Structure Type | Owner-occupied | Renter-occupied |
| Single Unit, Detached | 3,102 (74.2%) | 1,080 (25.8%) |
| Single Unit, Attached | 54 (17.0%) | 264 (83.0%) |
| 2 Unit Apartments | 0 (0.0%) | 358 (100.0%) |
| 3 or 4 Unit Apartments | 4 (1.3%) | 300 (98.7%) |
| 5 to 9 Unit Apartments | 0 (0.0%) | 340 (100.0%) |
| 10 or more Apartments | 0 (0.0%) | 612 (100.0%) |
| Mobile Home / Other | 18 (8.8%) | 186 (91.2%) |
| Total | 3,178 (50.3%) | 3,140 (49.7%) |
Housing Structures by Number of Rooms in Roanoke Rapids
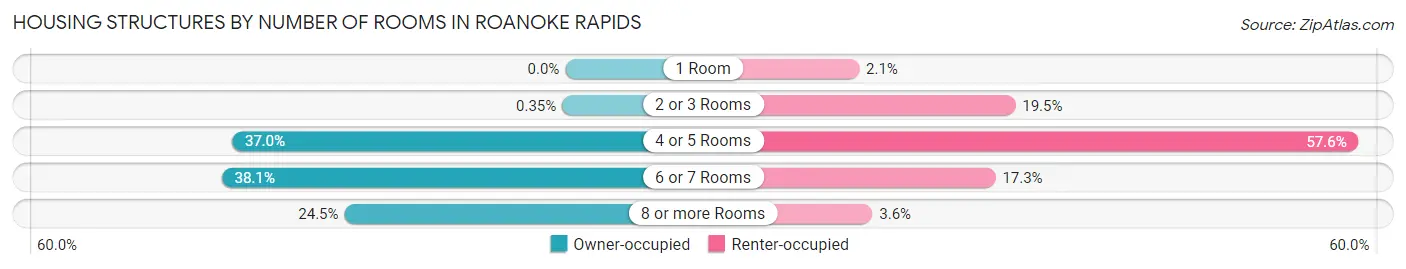
| Number of Rooms | Owner-occupied | Renter-occupied |
| 1 Room | 0 (0.0%) | 67 (2.1%) |
| 2 or 3 Rooms | 11 (0.4%) | 611 (19.5%) |
| 4 or 5 Rooms | 1,176 (37.0%) | 1,807 (57.6%) |
| 6 or 7 Rooms | 1,212 (38.1%) | 542 (17.3%) |
| 8 or more Rooms | 779 (24.5%) | 113 (3.6%) |
| Total | 3,178 (100.0%) | 3,140 (100.0%) |
Housing Structure by Heating Type in Roanoke Rapids
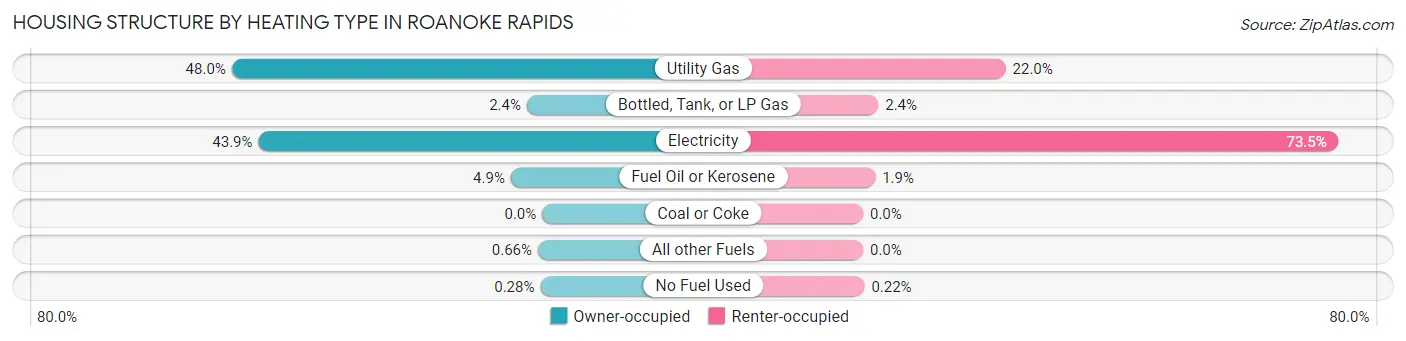
| Heating Type | Owner-occupied | Renter-occupied |
| Utility Gas | 1,525 (48.0%) | 692 (22.0%) |
| Bottled, Tank, or LP Gas | 75 (2.4%) | 74 (2.4%) |
| Electricity | 1,394 (43.9%) | 2,308 (73.5%) |
| Fuel Oil or Kerosene | 154 (4.9%) | 59 (1.9%) |
| Coal or Coke | 0 (0.0%) | 0 (0.0%) |
| All other Fuels | 21 (0.7%) | 0 (0.0%) |
| No Fuel Used | 9 (0.3%) | 7 (0.2%) |
| Total | 3,178 (100.0%) | 3,140 (100.0%) |
Household Vehicle Usage in Roanoke Rapids
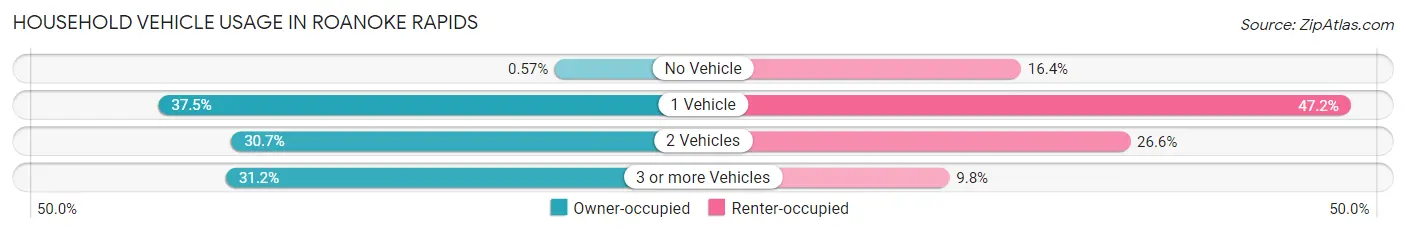
| Vehicles per Household | Owner-occupied | Renter-occupied |
| No Vehicle | 18 (0.6%) | 516 (16.4%) |
| 1 Vehicle | 1,192 (37.5%) | 1,482 (47.2%) |
| 2 Vehicles | 976 (30.7%) | 836 (26.6%) |
| 3 or more Vehicles | 992 (31.2%) | 306 (9.8%) |
| Total | 3,178 (100.0%) | 3,140 (100.0%) |
Real Estate & Mortgages in Roanoke Rapids
Real Estate and Mortgage Overview in Roanoke Rapids
| Characteristic | Without Mortgage | With Mortgage |
| Housing Units | 1,082 | 2,096 |
| Median Property Value | $121,300 | $128,500 |
| Median Household Income | $55,392 | $279 |
| Monthly Housing Costs | $495 | $0 |
| Real Estate Taxes | $1,889 | $9 |
Property Value by Mortgage Status in Roanoke Rapids
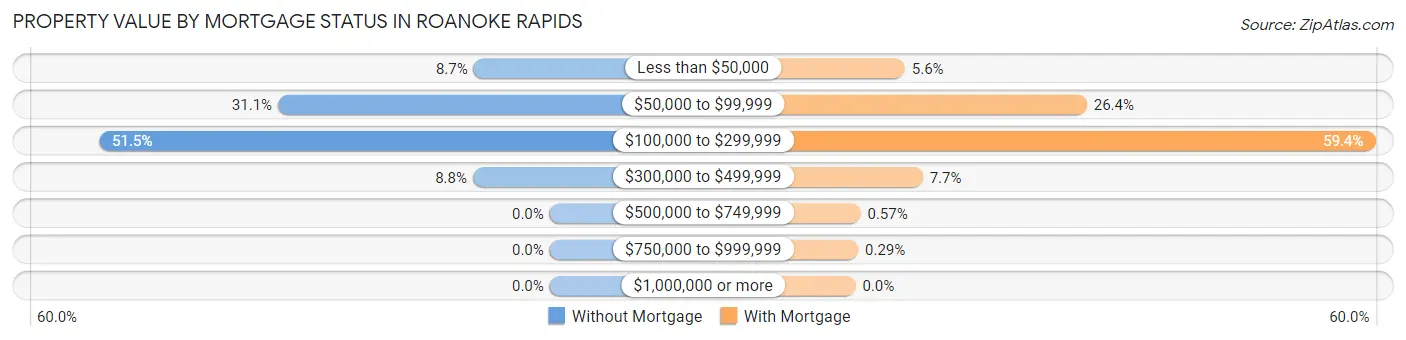
| Property Value | Without Mortgage | With Mortgage |
| Less than $50,000 | 94 (8.7%) | 118 (5.6%) |
| $50,000 to $99,999 | 336 (31.0%) | 554 (26.4%) |
| $100,000 to $299,999 | 557 (51.5%) | 1,245 (59.4%) |
| $300,000 to $499,999 | 95 (8.8%) | 161 (7.7%) |
| $500,000 to $749,999 | 0 (0.0%) | 12 (0.6%) |
| $750,000 to $999,999 | 0 (0.0%) | 6 (0.3%) |
| $1,000,000 or more | 0 (0.0%) | 0 (0.0%) |
| Total | 1,082 (100.0%) | 2,096 (100.0%) |
Household Income by Mortgage Status in Roanoke Rapids
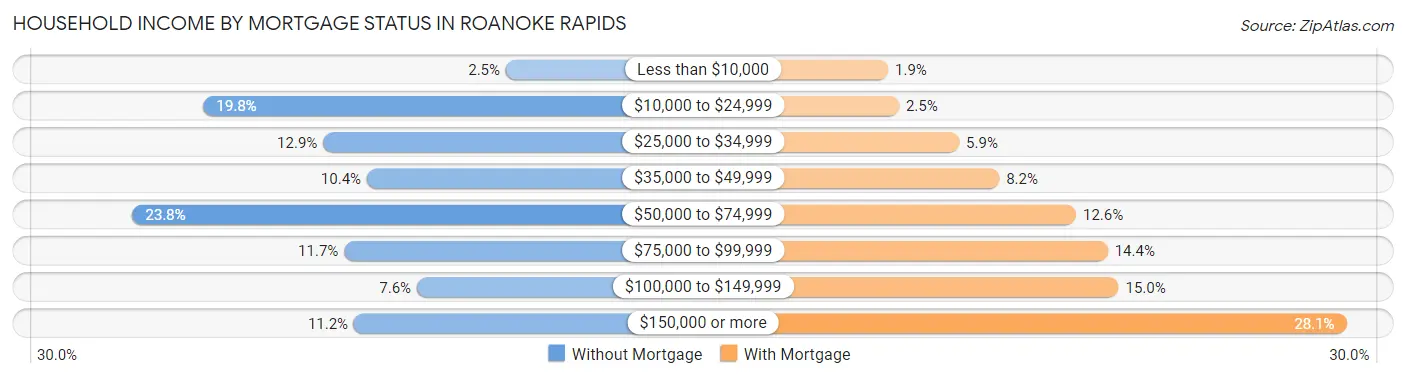
| Household Income | Without Mortgage | With Mortgage |
| Less than $10,000 | 27 (2.5%) | 39 (1.9%) |
| $10,000 to $24,999 | 214 (19.8%) | 52 (2.5%) |
| $25,000 to $34,999 | 140 (12.9%) | 124 (5.9%) |
| $35,000 to $49,999 | 113 (10.4%) | 172 (8.2%) |
| $50,000 to $74,999 | 258 (23.8%) | 264 (12.6%) |
| $75,000 to $99,999 | 127 (11.7%) | 302 (14.4%) |
| $100,000 to $149,999 | 82 (7.6%) | 315 (15.0%) |
| $150,000 or more | 121 (11.2%) | 588 (28.1%) |
| Total | 1,082 (100.0%) | 2,096 (100.0%) |
Property Value to Household Income Ratio in Roanoke Rapids
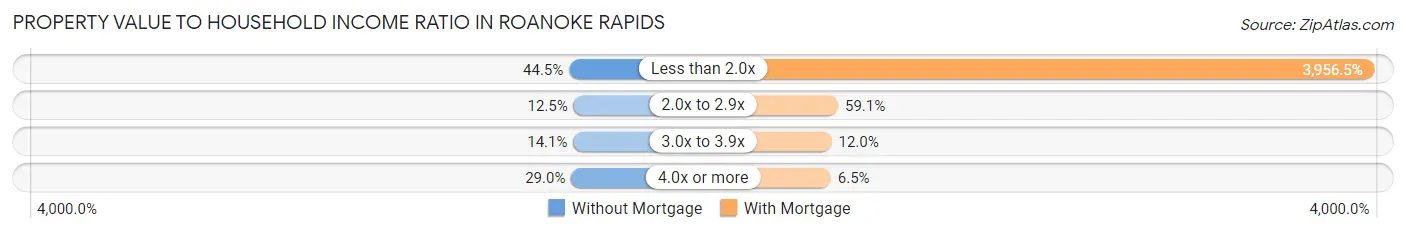
| Value-to-Income Ratio | Without Mortgage | With Mortgage |
| Less than 2.0x | 481 (44.5%) | 82,928 (3,956.5%) |
| 2.0x to 2.9x | 135 (12.5%) | 1,238 (59.1%) |
| 3.0x to 3.9x | 152 (14.1%) | 252 (12.0%) |
| 4.0x or more | 314 (29.0%) | 137 (6.5%) |
| Total | 1,082 (100.0%) | 2,096 (100.0%) |
Real Estate Taxes by Mortgage Status in Roanoke Rapids
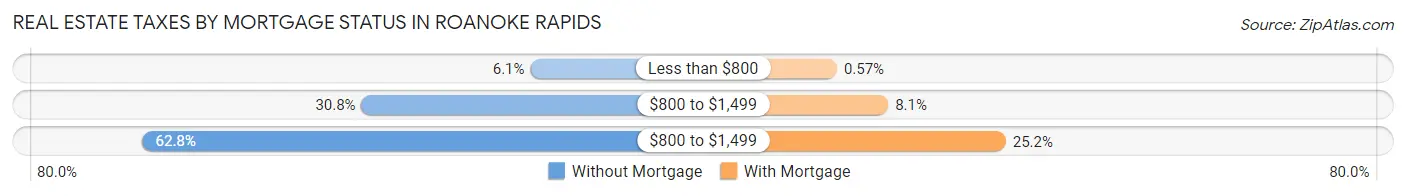
| Property Taxes | Without Mortgage | With Mortgage |
| Less than $800 | 66 (6.1%) | 12 (0.6%) |
| $800 to $1,499 | 333 (30.8%) | 169 (8.1%) |
| $800 to $1,499 | 679 (62.7%) | 529 (25.2%) |
| Total | 1,082 (100.0%) | 2,096 (100.0%) |
Health & Disability in Roanoke Rapids
Health Insurance Coverage by Age in Roanoke Rapids
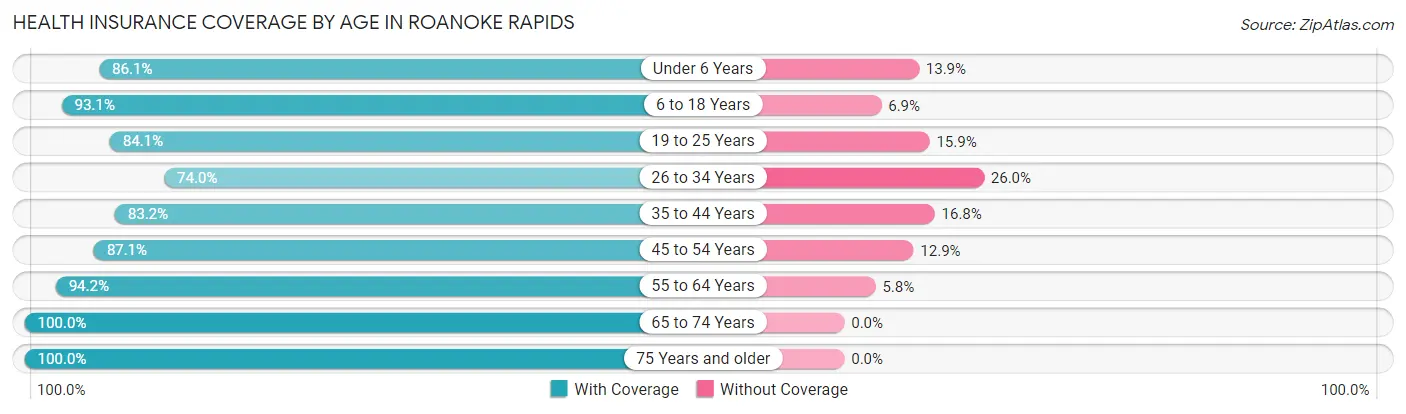
| Age Bracket | With Coverage | Without Coverage |
| Under 6 Years | 917 (86.1%) | 148 (13.9%) |
| 6 to 18 Years | 2,660 (93.1%) | 197 (6.9%) |
| 19 to 25 Years | 990 (84.1%) | 187 (15.9%) |
| 26 to 34 Years | 1,237 (74.0%) | 435 (26.0%) |
| 35 to 44 Years | 1,368 (83.2%) | 277 (16.8%) |
| 45 to 54 Years | 1,473 (87.1%) | 218 (12.9%) |
| 55 to 64 Years | 2,009 (94.2%) | 124 (5.8%) |
| 65 to 74 Years | 1,781 (100.0%) | 0 (0.0%) |
| 75 Years and older | 991 (100.0%) | 0 (0.0%) |
| Total | 13,426 (89.4%) | 1,586 (10.6%) |
Health Insurance Coverage by Citizenship Status in Roanoke Rapids
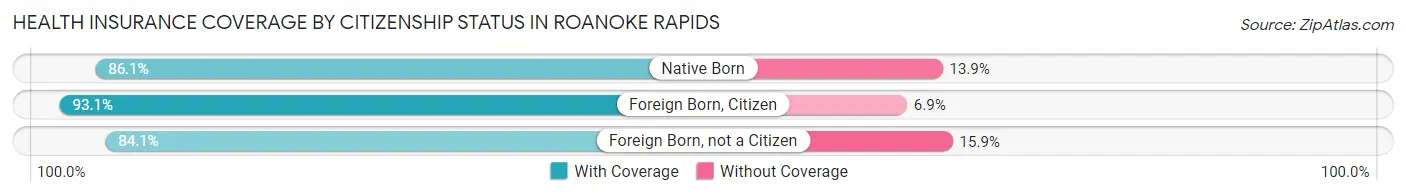
| Citizenship Status | With Coverage | Without Coverage |
| Native Born | 917 (86.1%) | 148 (13.9%) |
| Foreign Born, Citizen | 2,660 (93.1%) | 197 (6.9%) |
| Foreign Born, not a Citizen | 990 (84.1%) | 187 (15.9%) |
Health Insurance Coverage by Household Income in Roanoke Rapids
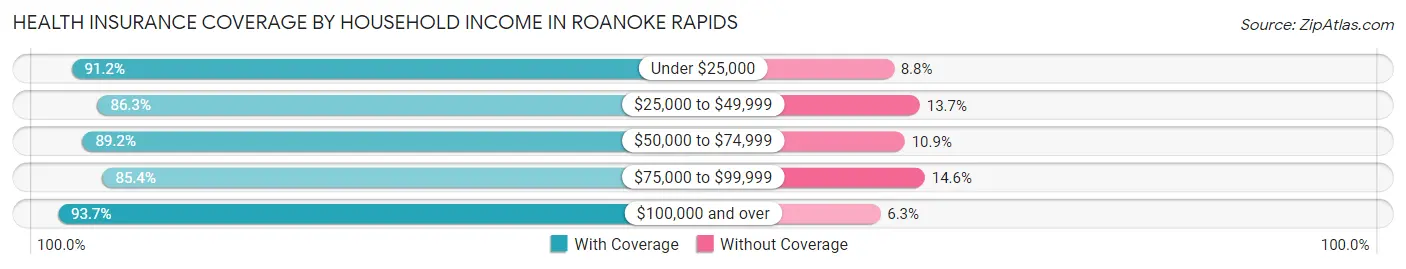
| Household Income | With Coverage | Without Coverage |
| Under $25,000 | 2,738 (91.2%) | 264 (8.8%) |
| $25,000 to $49,999 | 2,770 (86.3%) | 439 (13.7%) |
| $50,000 to $74,999 | 2,153 (89.1%) | 262 (10.8%) |
| $75,000 to $99,999 | 2,267 (85.4%) | 388 (14.6%) |
| $100,000 and over | 3,439 (93.7%) | 230 (6.3%) |
Public vs Private Health Insurance Coverage by Age in Roanoke Rapids
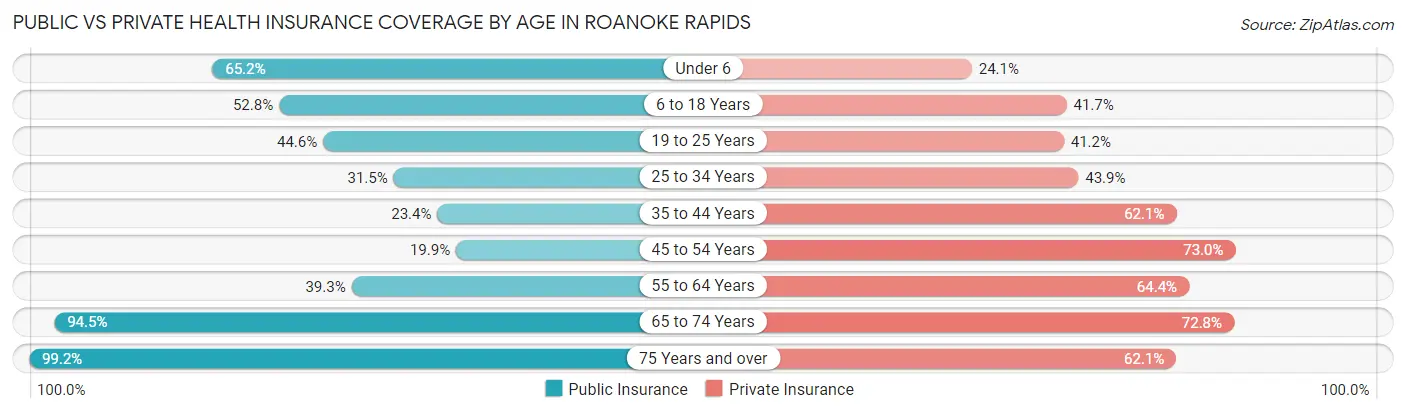
| Age Bracket | Public Insurance | Private Insurance |
| Under 6 | 694 (65.2%) | 257 (24.1%) |
| 6 to 18 Years | 1,508 (52.8%) | 1,192 (41.7%) |
| 19 to 25 Years | 525 (44.6%) | 485 (41.2%) |
| 25 to 34 Years | 527 (31.5%) | 734 (43.9%) |
| 35 to 44 Years | 385 (23.4%) | 1,021 (62.1%) |
| 45 to 54 Years | 337 (19.9%) | 1,235 (73.0%) |
| 55 to 64 Years | 839 (39.3%) | 1,374 (64.4%) |
| 65 to 74 Years | 1,683 (94.5%) | 1,296 (72.8%) |
| 75 Years and over | 983 (99.2%) | 615 (62.1%) |
| Total | 7,481 (49.8%) | 8,209 (54.7%) |
Disability Status by Sex by Age in Roanoke Rapids
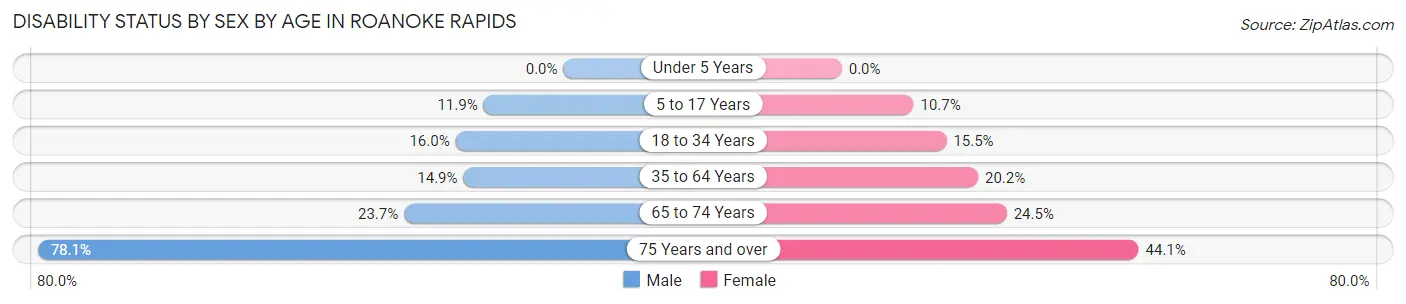
| Age Bracket | Male | Female |
| Under 5 Years | 0 (0.0%) | 0 (0.0%) |
| 5 to 17 Years | 201 (11.9%) | 110 (10.6%) |
| 18 to 34 Years | 260 (16.0%) | 228 (15.5%) |
| 35 to 64 Years | 363 (14.8%) | 612 (20.2%) |
| 65 to 74 Years | 144 (23.6%) | 287 (24.5%) |
| 75 Years and over | 313 (78.0%) | 260 (44.1%) |
Disability Class by Sex by Age in Roanoke Rapids
Disability Class: Hearing Difficulty
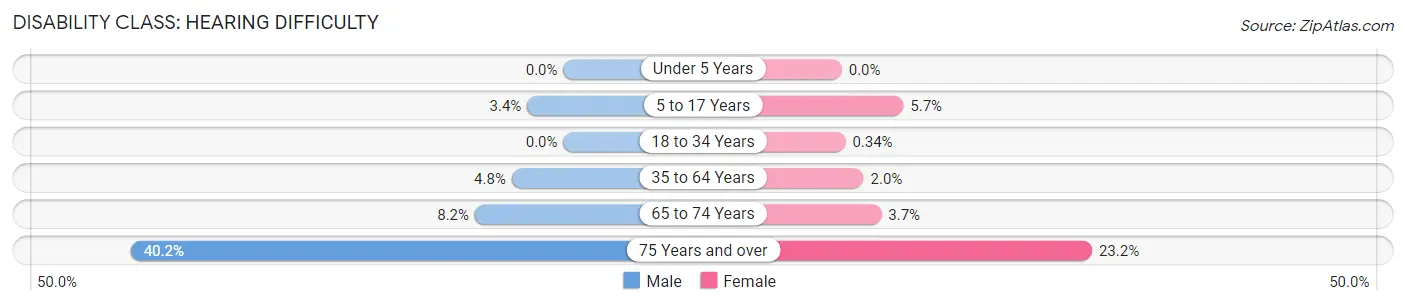
| Age Bracket | Male | Female |
| Under 5 Years | 0 (0.0%) | 0 (0.0%) |
| 5 to 17 Years | 57 (3.4%) | 59 (5.7%) |
| 18 to 34 Years | 0 (0.0%) | 5 (0.3%) |
| 35 to 64 Years | 117 (4.8%) | 61 (2.0%) |
| 65 to 74 Years | 50 (8.2%) | 43 (3.7%) |
| 75 Years and over | 161 (40.2%) | 137 (23.2%) |
Disability Class: Vision Difficulty
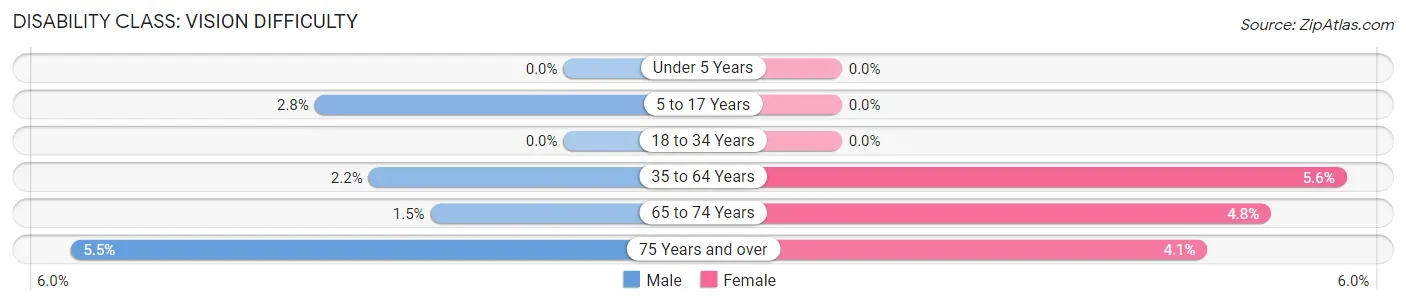
| Age Bracket | Male | Female |
| Under 5 Years | 0 (0.0%) | 0 (0.0%) |
| 5 to 17 Years | 47 (2.8%) | 0 (0.0%) |
| 18 to 34 Years | 0 (0.0%) | 0 (0.0%) |
| 35 to 64 Years | 53 (2.2%) | 170 (5.6%) |
| 65 to 74 Years | 9 (1.5%) | 56 (4.8%) |
| 75 Years and over | 22 (5.5%) | 24 (4.1%) |
Disability Class: Cognitive Difficulty
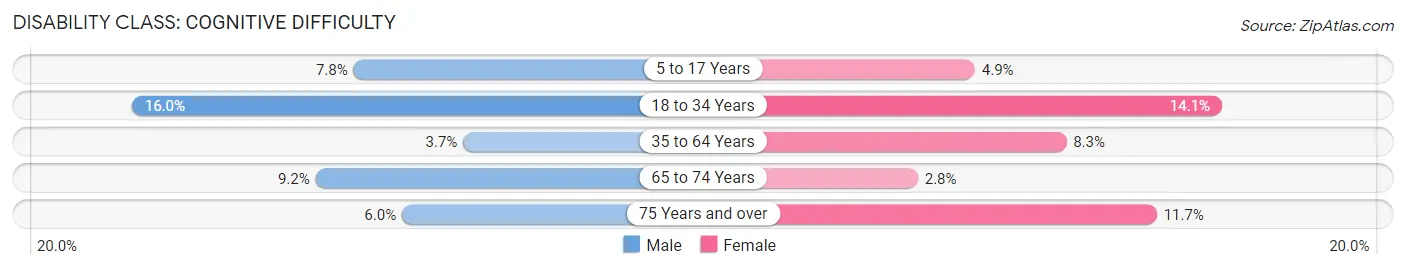
| Age Bracket | Male | Female |
| 5 to 17 Years | 132 (7.8%) | 51 (4.9%) |
| 18 to 34 Years | 260 (16.0%) | 207 (14.1%) |
| 35 to 64 Years | 91 (3.7%) | 252 (8.3%) |
| 65 to 74 Years | 56 (9.2%) | 33 (2.8%) |
| 75 Years and over | 24 (6.0%) | 69 (11.7%) |
Disability Class: Ambulatory Difficulty
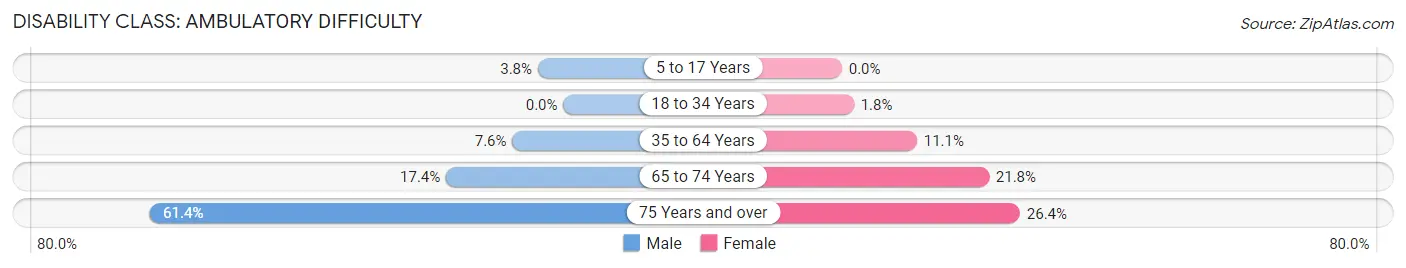
| Age Bracket | Male | Female |
| 5 to 17 Years | 64 (3.8%) | 0 (0.0%) |
| 18 to 34 Years | 0 (0.0%) | 26 (1.8%) |
| 35 to 64 Years | 185 (7.6%) | 337 (11.1%) |
| 65 to 74 Years | 106 (17.4%) | 256 (21.8%) |
| 75 Years and over | 246 (61.4%) | 156 (26.4%) |
Disability Class: Self-Care Difficulty
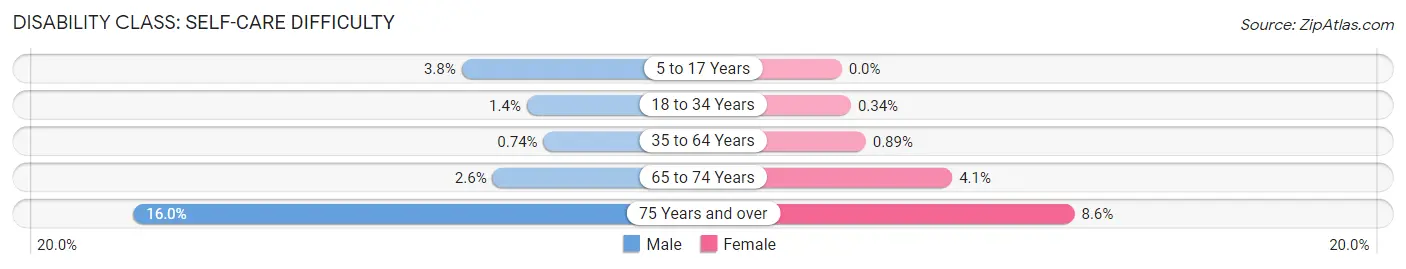
| Age Bracket | Male | Female |
| 5 to 17 Years | 64 (3.8%) | 0 (0.0%) |
| 18 to 34 Years | 22 (1.4%) | 5 (0.3%) |
| 35 to 64 Years | 18 (0.7%) | 27 (0.9%) |
| 65 to 74 Years | 16 (2.6%) | 48 (4.1%) |
| 75 Years and over | 64 (16.0%) | 51 (8.6%) |
Technology Access in Roanoke Rapids
Computing Device Access in Roanoke Rapids
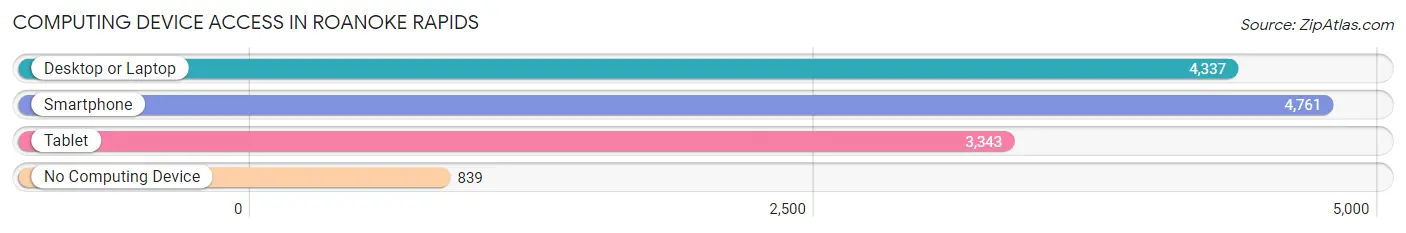
| Device Type | # Households | % Households |
| Desktop or Laptop | 4,337 | 68.6% |
| Smartphone | 4,761 | 75.4% |
| Tablet | 3,343 | 52.9% |
| No Computing Device | 839 | 13.3% |
| Total | 6,318 | 100.0% |
Internet Access in Roanoke Rapids
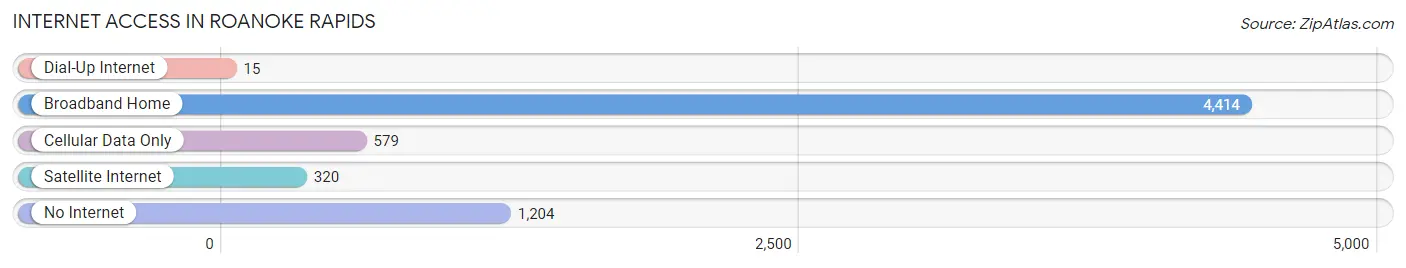
| Internet Type | # Households | % Households |
| Dial-Up Internet | 15 | 0.2% |
| Broadband Home | 4,414 | 69.9% |
| Cellular Data Only | 579 | 9.2% |
| Satellite Internet | 320 | 5.1% |
| No Internet | 1,204 | 19.1% |
| Total | 6,318 | 100.0% |
Roanoke Rapids Summary
Roanoke Rapids is a city located in Halifax County, North Carolina. It is situated on the Roanoke River, approximately 40 miles northeast of Raleigh. The city is part of the Roanoke Valley, which is a region of northeastern North Carolina that includes the cities of Roanoke Rapids, Weldon, and Scotland Neck. The population of Roanoke Rapids was 15,754 as of the 2010 census.
History
The area that is now Roanoke Rapids was first settled in the early 1700s by English colonists. The town was originally known as “Flag Pond” and was located near the present-day town of Weldon. In 1833, the town was renamed “Roanoke Rapids” after the nearby Roanoke River.
The town was incorporated in 1874 and was initially a small farming community. In the late 19th century, the town began to grow as a result of the construction of the Seaboard Air Line Railway. The railway connected Roanoke Rapids to other cities in the region, such as Weldon and Scotland Neck.
In the early 20th century, the town experienced a period of rapid growth as a result of the construction of the Roanoke Rapids Dam. The dam was built in the 1920s to provide hydroelectric power to the region. The dam also created Lake Gaston, which is a popular recreational area.
Geography
Roanoke Rapids is located in the Roanoke Valley region of northeastern North Carolina. The city is situated on the Roanoke River, approximately 40 miles northeast of Raleigh. The city is located at an elevation of approximately 200 feet above sea level.
The city has a total area of 8.3 square miles, of which 8.2 square miles is land and 0.1 square miles is water. The city is located in a humid subtropical climate zone, with hot, humid summers and mild winters.
Economy
The economy of Roanoke Rapids is largely based on manufacturing and tourism. The city is home to several manufacturing companies, including a paper mill, a textile mill, and a furniture factory. The city is also home to several tourist attractions, such as the Roanoke Rapids Theatre and the Roanoke Rapids Dam.
The city is also home to several educational institutions, including Roanoke Rapids High School, Roanoke Rapids Community College, and the Roanoke Valley Early College.
Demographics
As of the 2010 census, the population of Roanoke Rapids was 15,754. The racial makeup of the city was 57.3% White, 37.2% African American, 0.5% Native American, 1.2% Asian, 0.1% Pacific Islander, 1.7% from other races, and 2.2% from two or more races. Hispanic or Latino of any race were 4.2% of the population.
The median household income in Roanoke Rapids was $33,945, and the median family income was $41,945. The per capita income for the city was $17,845. About 17.2% of families and 20.7% of the population were below the poverty line, including 28.2% of those under age 18 and 16.2% of those age 65 or over.
Common Questions
What is Per Capita Income in Roanoke Rapids?
Per Capita income in Roanoke Rapids is $27,714.
What is the Median Family Income in Roanoke Rapids?
Median Family Income in Roanoke Rapids is $60,060.
What is the Median Household income in Roanoke Rapids?
Median Household Income in Roanoke Rapids is $45,732.
What is Income or Wage Gap in Roanoke Rapids?
Income or Wage Gap in Roanoke Rapids is 15.6%.
Women in Roanoke Rapids earn 84.4 cents for every dollar earned by a man.
What is Family Income Deficit in Roanoke Rapids?
Family Income Deficit in Roanoke Rapids is $10,004.
Families that are below poverty line in Roanoke Rapids earn $10,004 less on average than the poverty threshold level.
What is Inequality or Gini Index in Roanoke Rapids?
Inequality or Gini Index in Roanoke Rapids is 0.47.
What is the Total Population of Roanoke Rapids?
Total Population of Roanoke Rapids is 15,143.
What is the Total Male Population of Roanoke Rapids?
Total Male Population of Roanoke Rapids is 7,125.
What is the Total Female Population of Roanoke Rapids?
Total Female Population of Roanoke Rapids is 8,018.
What is the Ratio of Males per 100 Females in Roanoke Rapids?
There are 88.86 Males per 100 Females in Roanoke Rapids.
What is the Ratio of Females per 100 Males in Roanoke Rapids?
There are 112.53 Females per 100 Males in Roanoke Rapids.
What is the Median Population Age in Roanoke Rapids?
Median Population Age in Roanoke Rapids is 40.5 Years.
What is the Average Family Size in Roanoke Rapids
Average Family Size in Roanoke Rapids is 3.0 People.
What is the Average Household Size in Roanoke Rapids
Average Household Size in Roanoke Rapids is 2.4 People.
How Large is the Labor Force in Roanoke Rapids?
There are 6,632 People in the Labor Forcein in Roanoke Rapids.
What is the Percentage of People in the Labor Force in Roanoke Rapids?
55.7% of People are in the Labor Force in Roanoke Rapids.
What is the Unemployment Rate in Roanoke Rapids?
Unemployment Rate in Roanoke Rapids is 6.2%.