Pittsboro, NC Map & Demographics
Pittsboro Map

Pittsboro Overview
$38,256
PER CAPITA INCOME
$110,721
AVG FAMILY INCOME
$62,513
AVG HOUSEHOLD INCOME
11.3%
WAGE / INCOME GAP [ % ]
88.7¢/ $1
WAGE / INCOME GAP [ $ ]
0.45
INEQUALITY / GINI INDEX
4,555
TOTAL POPULATION
1,664
MALE POPULATION
2,891
FEMALE POPULATION
57.56
MALES / 100 FEMALES
173.74
FEMALES / 100 MALES
40.0
MEDIAN AGE
3.0
AVG FAMILY SIZE
2.3
AVG HOUSEHOLD SIZE
2,510
LABOR FORCE [ PEOPLE ]
63.6%
PERCENT IN LABOR FORCE
3.1%
UNEMPLOYMENT RATE
Pittsboro Zip Codes
Pittsboro Area Codes
Income in Pittsboro
Income Overview in Pittsboro
Per Capita Income in Pittsboro is $38,256, while median incomes of families and households are $110,721 and $62,513 respectively.
| Characteristic | Number | Measure |
| Per Capita Income | 4,555 | $38,256 |
| Median Family Income | 1,073 | $110,721 |
| Mean Family Income | 1,073 | $115,992 |
| Median Household Income | 1,939 | $62,513 |
| Mean Household Income | 1,939 | $86,858 |
| Income Deficit | 1,073 | $0 |
| Wage / Income Gap (%) | 4,555 | 11.29% |
| Wage / Income Gap ($) | 4,555 | 88.71¢ per $1 |
| Gini / Inequality Index | 4,555 | 0.45 |
Earnings by Sex in Pittsboro
Average Earnings in Pittsboro are $45,561, $50,956 for men and $45,202 for women, a difference of 11.3%.
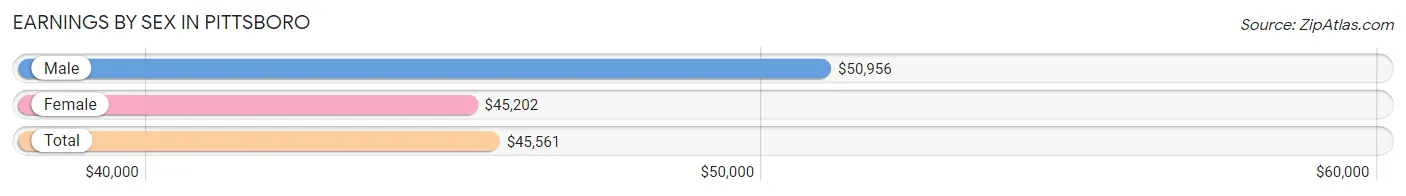
| Sex | Number | Average Earnings |
| Male | 1,163 (46.7%) | $50,956 |
| Female | 1,326 (53.3%) | $45,202 |
| Total | 2,489 (100.0%) | $45,561 |
Earnings by Sex by Income Bracket in Pittsboro
The most common earnings brackets in Pittsboro are $100,000+ for men (210 | 18.1%) and $30,000 to $34,999 for women (172 | 13.0%).
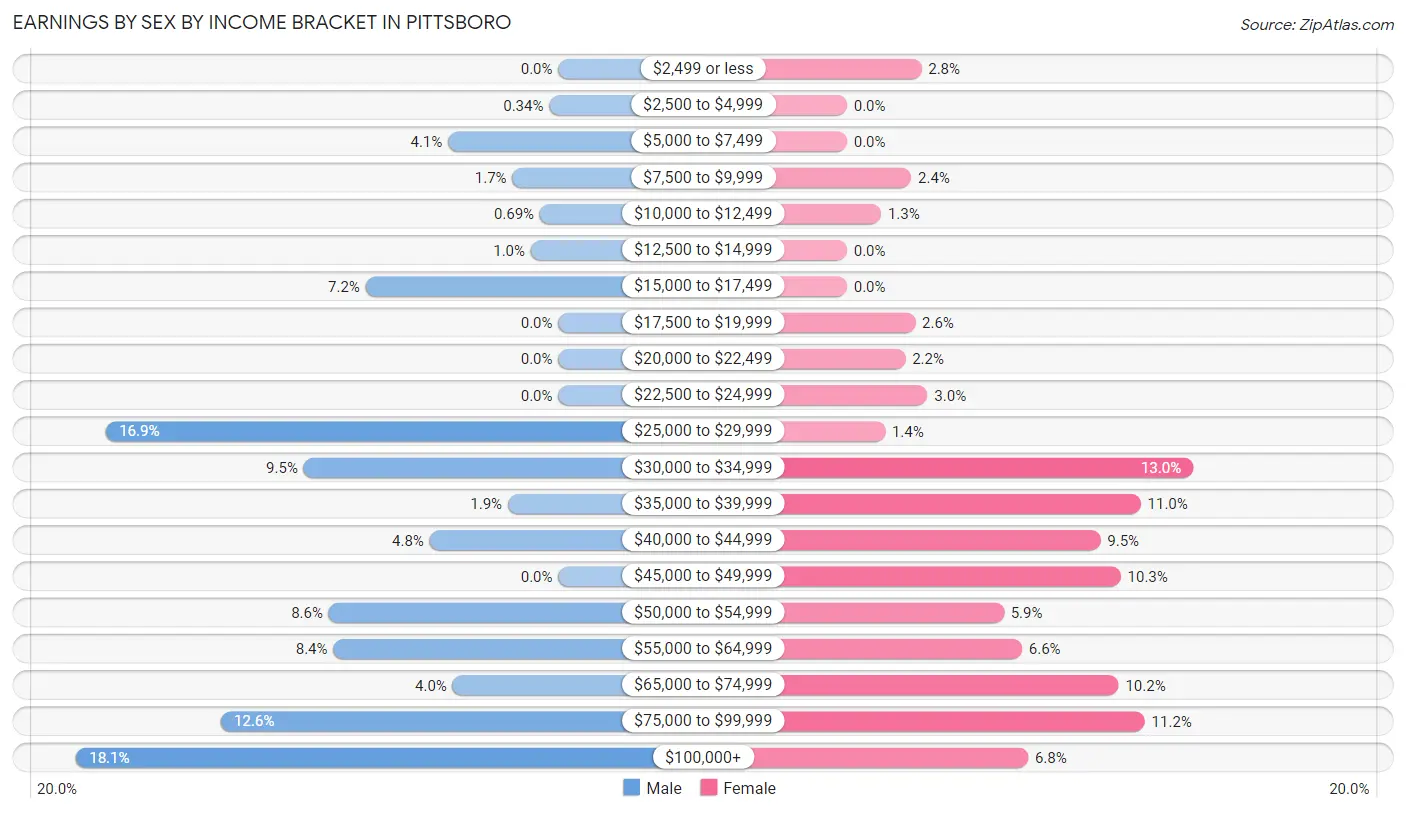
| Income | Male | Female |
| $2,499 or less | 0 (0.0%) | 37 (2.8%) |
| $2,500 to $4,999 | 4 (0.3%) | 0 (0.0%) |
| $5,000 to $7,499 | 48 (4.1%) | 0 (0.0%) |
| $7,500 to $9,999 | 20 (1.7%) | 32 (2.4%) |
| $10,000 to $12,499 | 8 (0.7%) | 17 (1.3%) |
| $12,500 to $14,999 | 12 (1.0%) | 0 (0.0%) |
| $15,000 to $17,499 | 84 (7.2%) | 0 (0.0%) |
| $17,500 to $19,999 | 0 (0.0%) | 34 (2.6%) |
| $20,000 to $22,499 | 0 (0.0%) | 29 (2.2%) |
| $22,500 to $24,999 | 0 (0.0%) | 40 (3.0%) |
| $25,000 to $29,999 | 197 (16.9%) | 19 (1.4%) |
| $30,000 to $34,999 | 111 (9.5%) | 172 (13.0%) |
| $35,000 to $39,999 | 22 (1.9%) | 146 (11.0%) |
| $40,000 to $44,999 | 56 (4.8%) | 126 (9.5%) |
| $45,000 to $49,999 | 0 (0.0%) | 136 (10.3%) |
| $50,000 to $54,999 | 100 (8.6%) | 78 (5.9%) |
| $55,000 to $64,999 | 98 (8.4%) | 87 (6.6%) |
| $65,000 to $74,999 | 46 (4.0%) | 135 (10.2%) |
| $75,000 to $99,999 | 147 (12.6%) | 148 (11.2%) |
| $100,000+ | 210 (18.1%) | 90 (6.8%) |
| Total | 1,163 (100.0%) | 1,326 (100.0%) |
Earnings by Sex by Educational Attainment in Pittsboro
Average earnings in Pittsboro are $61,389 for men and $50,186 for women, a difference of 18.2%. Men with an educational attainment of graduate degree enjoy the highest average annual earnings of $105,722, while those with high school diploma education earn the least with $50,123. Women with an educational attainment of graduate degree earn the most with the average annual earnings of $56,094, while those with college or associate's degree education have the smallest earnings of $43,711.
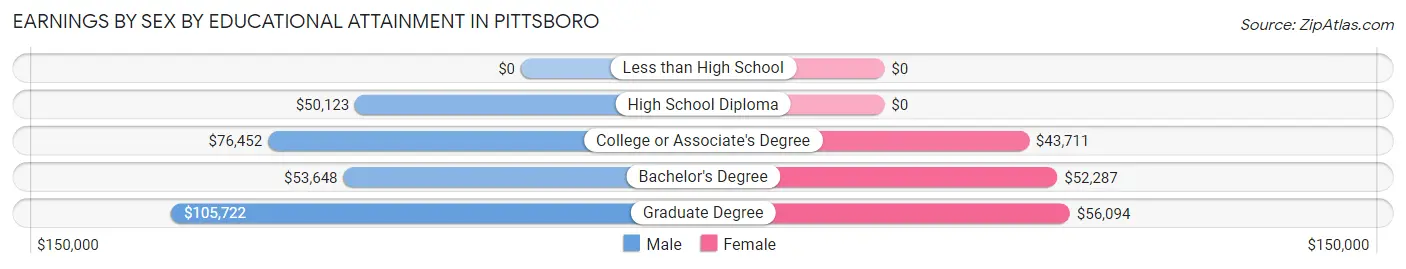
| Educational Attainment | Male Income | Female Income |
| Less than High School | - | - |
| High School Diploma | $50,123 | $0 |
| College or Associate's Degree | $76,452 | $43,711 |
| Bachelor's Degree | $53,648 | $52,287 |
| Graduate Degree | $105,722 | $56,094 |
| Total | $61,389 | $50,186 |
Family Income in Pittsboro
Family Income Brackets in Pittsboro
According to the Pittsboro family income data, there are 230 families falling into the $100,000 to $149,999 income range, which is the most common income bracket and makes up 21.4% of all families.
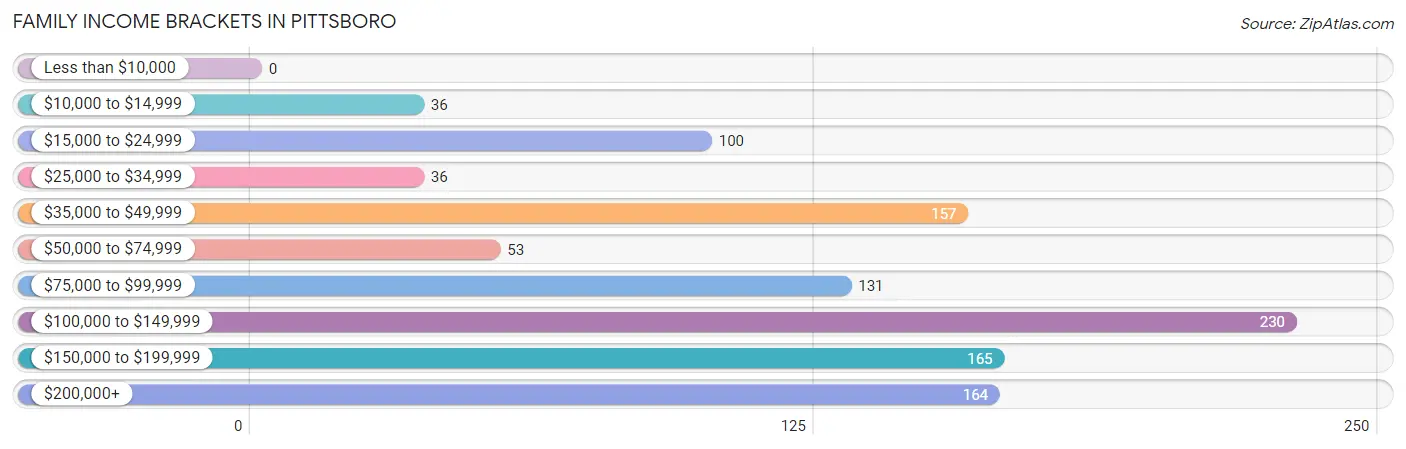
| Income Bracket | # Families | % Families |
| Less than $10,000 | 0 | 0.0% |
| $10,000 to $14,999 | 36 | 3.4% |
| $15,000 to $24,999 | 100 | 9.3% |
| $25,000 to $34,999 | 36 | 3.4% |
| $35,000 to $49,999 | 157 | 14.6% |
| $50,000 to $74,999 | 53 | 4.9% |
| $75,000 to $99,999 | 131 | 12.2% |
| $100,000 to $149,999 | 230 | 21.4% |
| $150,000 to $199,999 | 165 | 15.4% |
| $200,000+ | 164 | 15.3% |
Family Income by Famaliy Size in Pittsboro
4-person families (146 | 13.6%) account for the highest median family income in Pittsboro with $172,979 per family, while 4-person families (146 | 13.6%) have the highest median income of $43,245 per family member.
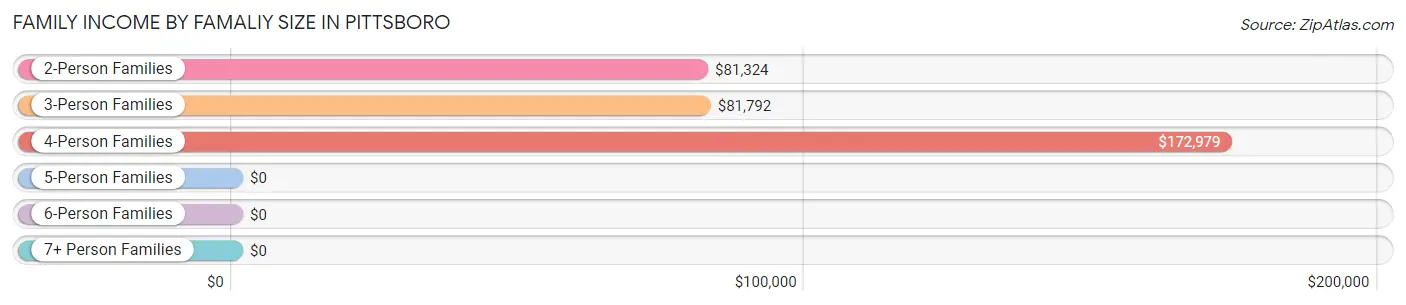
| Income Bracket | # Families | Median Income |
| 2-Person Families | 530 (49.4%) | $81,324 |
| 3-Person Families | 353 (32.9%) | $81,792 |
| 4-Person Families | 146 (13.6%) | $172,979 |
| 5-Person Families | 0 (0.0%) | $0 |
| 6-Person Families | 0 (0.0%) | $0 |
| 7+ Person Families | 44 (4.1%) | $0 |
| Total | 1,073 (100.0%) | $110,721 |
Family Income by Number of Earners in Pittsboro
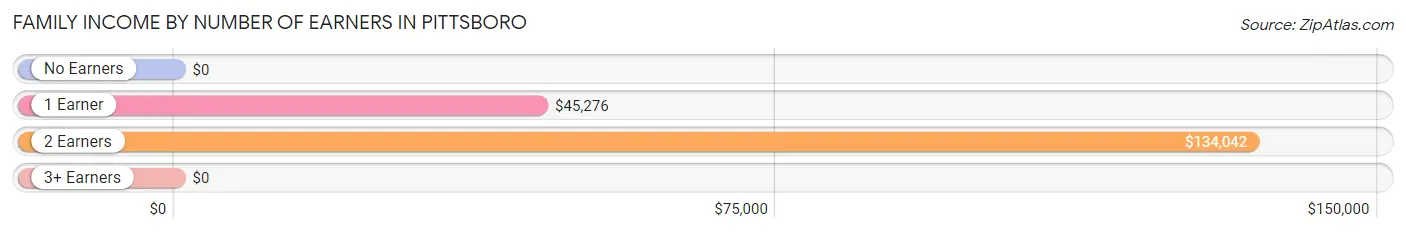
| Number of Earners | # Families | Median Income |
| No Earners | 130 (12.1%) | $0 |
| 1 Earner | 274 (25.5%) | $45,276 |
| 2 Earners | 587 (54.7%) | $134,042 |
| 3+ Earners | 82 (7.6%) | $0 |
| Total | 1,073 (100.0%) | $110,721 |
Household Income in Pittsboro
Household Income Brackets in Pittsboro
With 347 households falling in the category, the $35,000 to $49,999 income range is the most frequent in Pittsboro, accounting for 17.9% of all households.
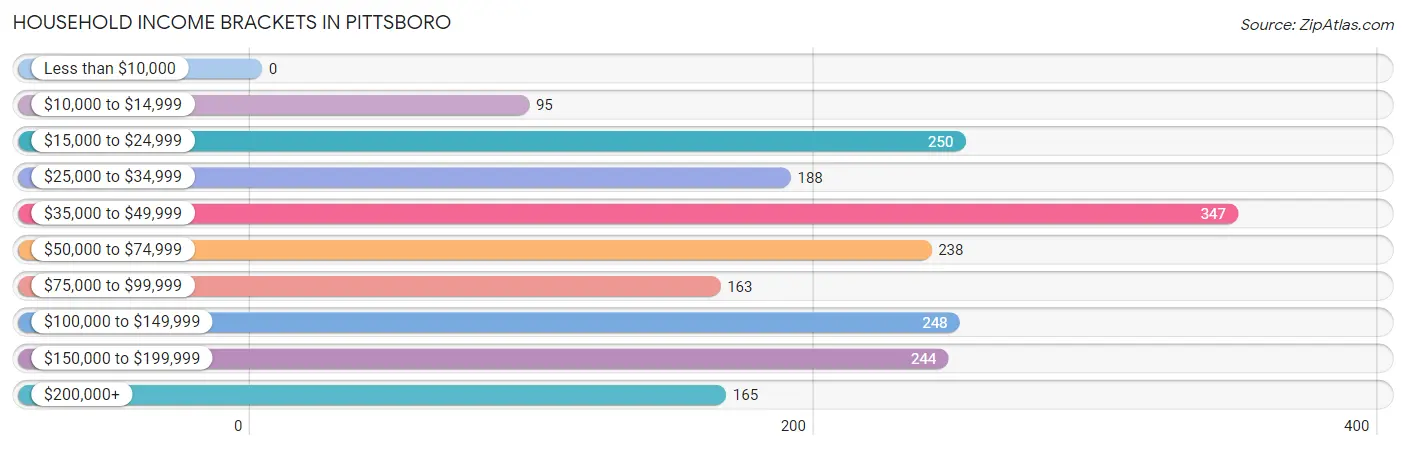
| Income Bracket | # Households | % Households |
| Less than $10,000 | 0 | 0.0% |
| $10,000 to $14,999 | 95 | 4.9% |
| $15,000 to $24,999 | 250 | 12.9% |
| $25,000 to $34,999 | 188 | 9.7% |
| $35,000 to $49,999 | 347 | 17.9% |
| $50,000 to $74,999 | 238 | 12.3% |
| $75,000 to $99,999 | 163 | 8.4% |
| $100,000 to $149,999 | 248 | 12.8% |
| $150,000 to $199,999 | 244 | 12.6% |
| $200,000+ | 165 | 8.5% |
Household Income by Householder Age in Pittsboro
The median household income in Pittsboro is $62,513, with the highest median household income of $137,300 found in the 45 to 64 years age bracket for the primary householder. A total of 596 households (30.7%) fall into this category. Meanwhile, the 65+ years age bracket for the primary householder has the lowest median household income of $35,494, with 705 households (36.4%) in this group.
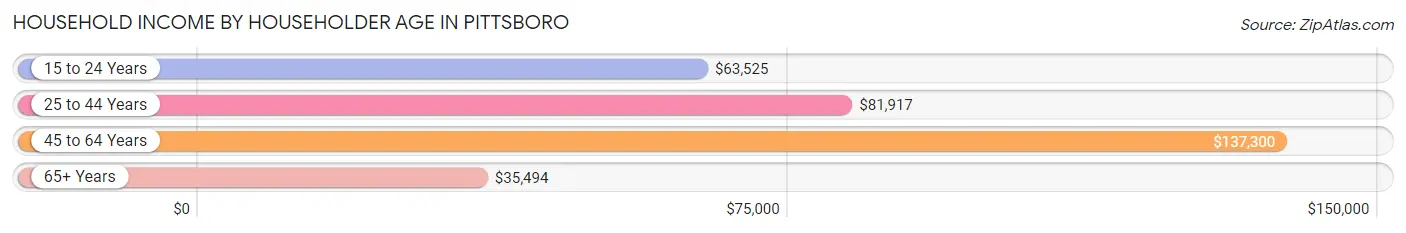
| Income Bracket | # Households | Median Income |
| 15 to 24 Years | 138 (7.1%) | $63,525 |
| 25 to 44 Years | 500 (25.8%) | $81,917 |
| 45 to 64 Years | 596 (30.7%) | $137,300 |
| 65+ Years | 705 (36.4%) | $35,494 |
| Total | 1,939 (100.0%) | $62,513 |
Poverty in Pittsboro
Income Below Poverty by Sex and Age in Pittsboro
With 7.0% poverty level for males and 9.5% for females among the residents of Pittsboro, under 5 year old males and 65 to 74 year old females are the most vulnerable to poverty, with 22 males (45.8%) and 50 females (24.6%) in their respective age groups living below the poverty level.
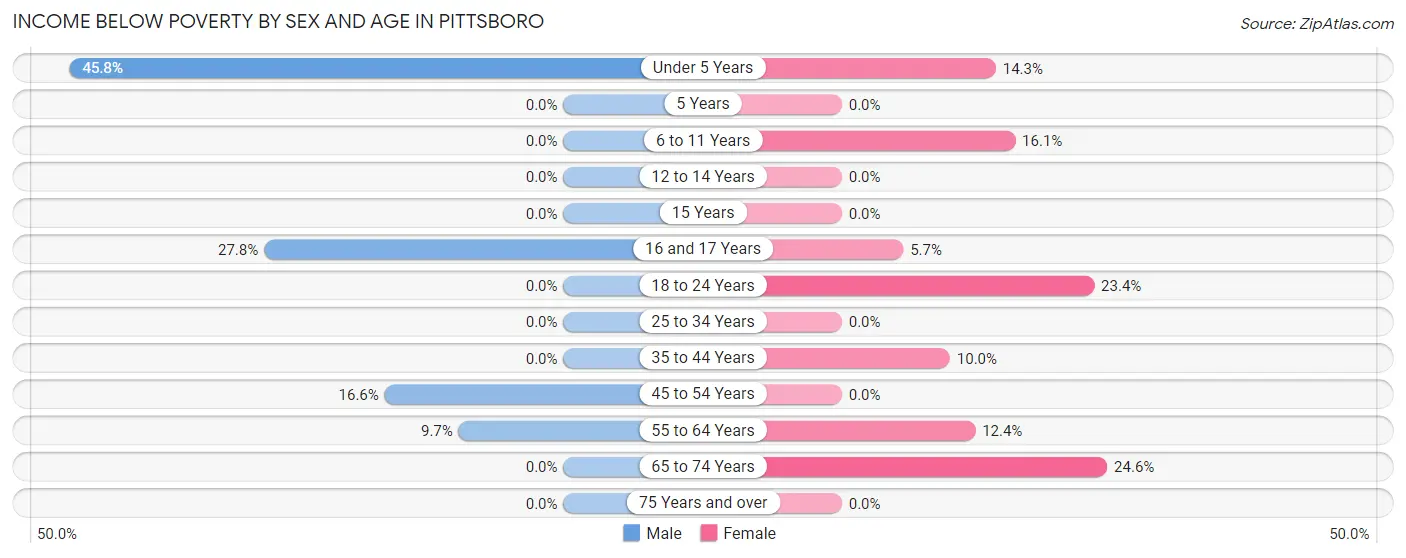
| Age Bracket | Male | Female |
| Under 5 Years | 22 (45.8%) | 20 (14.3%) |
| 5 Years | 0 (0.0%) | 0 (0.0%) |
| 6 to 11 Years | 0 (0.0%) | 28 (16.1%) |
| 12 to 14 Years | 0 (0.0%) | 0 (0.0%) |
| 15 Years | 0 (0.0%) | 0 (0.0%) |
| 16 and 17 Years | 25 (27.8%) | 18 (5.7%) |
| 18 to 24 Years | 0 (0.0%) | 78 (23.4%) |
| 25 to 34 Years | 0 (0.0%) | 0 (0.0%) |
| 35 to 44 Years | 0 (0.0%) | 34 (10.0%) |
| 45 to 54 Years | 37 (16.6%) | 0 (0.0%) |
| 55 to 64 Years | 28 (9.7%) | 39 (12.4%) |
| 65 to 74 Years | 0 (0.0%) | 50 (24.6%) |
| 75 Years and over | 0 (0.0%) | 0 (0.0%) |
| Total | 112 (7.0%) | 267 (9.5%) |
Income Above Poverty by Sex and Age in Pittsboro
According to the poverty statistics in Pittsboro, males aged 6 to 11 years and females aged 12 to 14 years are the age groups that are most secure financially, with 100.0% of males and 100.0% of females in these age groups living above the poverty line.
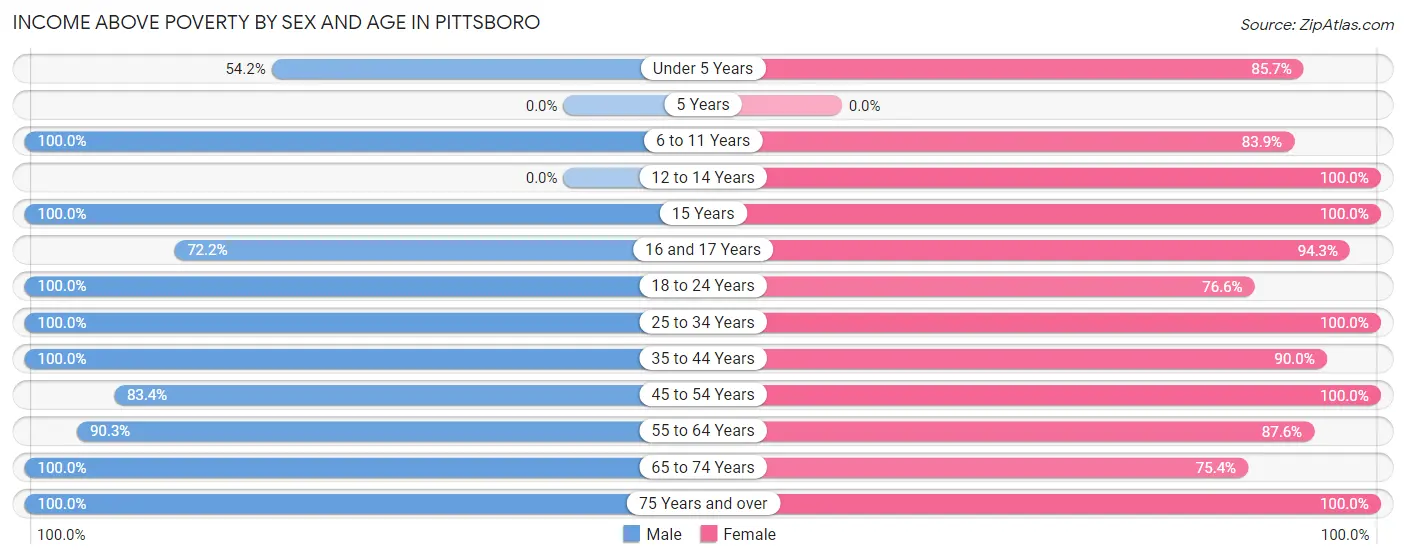
| Age Bracket | Male | Female |
| Under 5 Years | 26 (54.2%) | 120 (85.7%) |
| 5 Years | 0 (0.0%) | 0 (0.0%) |
| 6 to 11 Years | 124 (100.0%) | 146 (83.9%) |
| 12 to 14 Years | 0 (0.0%) | 94 (100.0%) |
| 15 Years | 5 (100.0%) | 24 (100.0%) |
| 16 and 17 Years | 65 (72.2%) | 298 (94.3%) |
| 18 to 24 Years | 185 (100.0%) | 255 (76.6%) |
| 25 to 34 Years | 160 (100.0%) | 254 (100.0%) |
| 35 to 44 Years | 260 (100.0%) | 305 (90.0%) |
| 45 to 54 Years | 186 (83.4%) | 231 (100.0%) |
| 55 to 64 Years | 260 (90.3%) | 276 (87.6%) |
| 65 to 74 Years | 131 (100.0%) | 153 (75.4%) |
| 75 Years and over | 83 (100.0%) | 396 (100.0%) |
| Total | 1,485 (93.0%) | 2,552 (90.5%) |
Income Below Poverty Among Married-Couple Families in Pittsboro
The poverty statistics for married-couple families in Pittsboro show that 2.6% or 20 of the total 769 families live below the poverty line. Families with 1 or 2 children have the highest poverty rate of 6.6%, comprising of 20 families. On the other hand, families with no children have the lowest poverty rate of 0.0%, which includes 0 families.
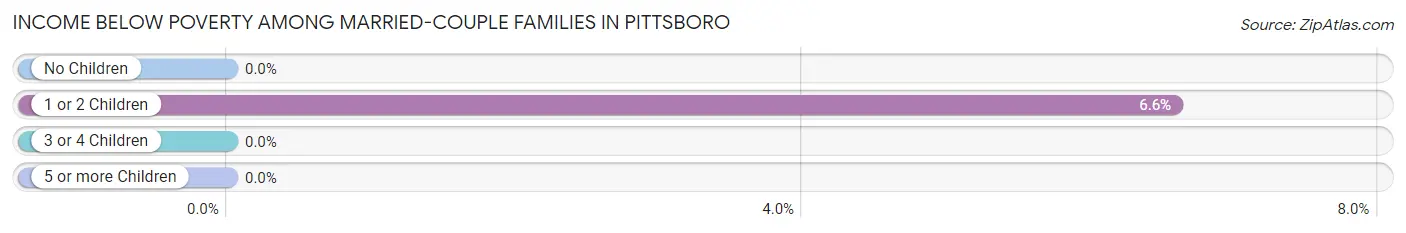
| Children | Above Poverty | Below Poverty |
| No Children | 421 (100.0%) | 0 (0.0%) |
| 1 or 2 Children | 284 (93.4%) | 20 (6.6%) |
| 3 or 4 Children | 0 (0.0%) | 0 (0.0%) |
| 5 or more Children | 44 (100.0%) | 0 (0.0%) |
| Total | 749 (97.4%) | 20 (2.6%) |
Income Below Poverty Among Single-Parent Households in Pittsboro
According to the poverty data in Pittsboro, 92.5% or 37 single-father households and 20.1% or 53 single-mother households are living below the poverty line. Among single-father households, those with no children have the highest poverty rate, with 37 households (92.5%) experiencing poverty. Likewise, among single-mother households, those with 1 or 2 children have the highest poverty rate, with 53 households (22.8%) falling below the poverty line.
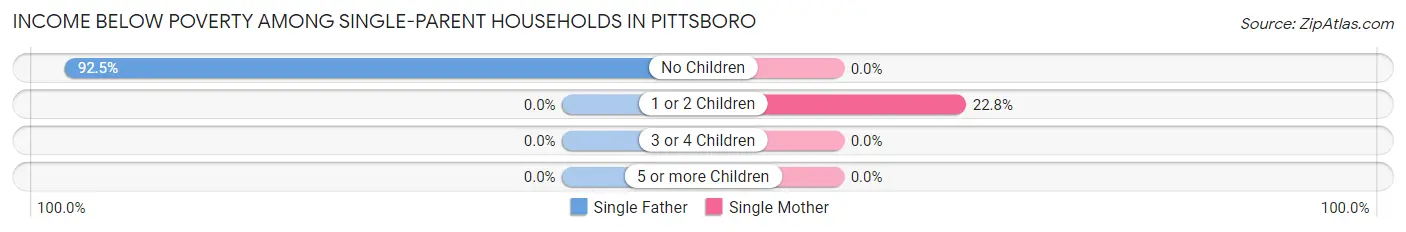
| Children | Single Father | Single Mother |
| No Children | 37 (92.5%) | 0 (0.0%) |
| 1 or 2 Children | 0 (0.0%) | 53 (22.8%) |
| 3 or 4 Children | 0 (0.0%) | 0 (0.0%) |
| 5 or more Children | 0 (0.0%) | 0 (0.0%) |
| Total | 37 (92.5%) | 53 (20.1%) |
Income Below Poverty Among Married-Couple vs Single-Parent Households in Pittsboro
The poverty data for Pittsboro shows that 20 of the married-couple family households (2.6%) and 90 of the single-parent households (29.6%) are living below the poverty level. Within the married-couple family households, those with 1 or 2 children have the highest poverty rate, with 20 households (6.6%) falling below the poverty line. Among the single-parent households, those with no children have the highest poverty rate, with 37 household (52.1%) living below poverty.
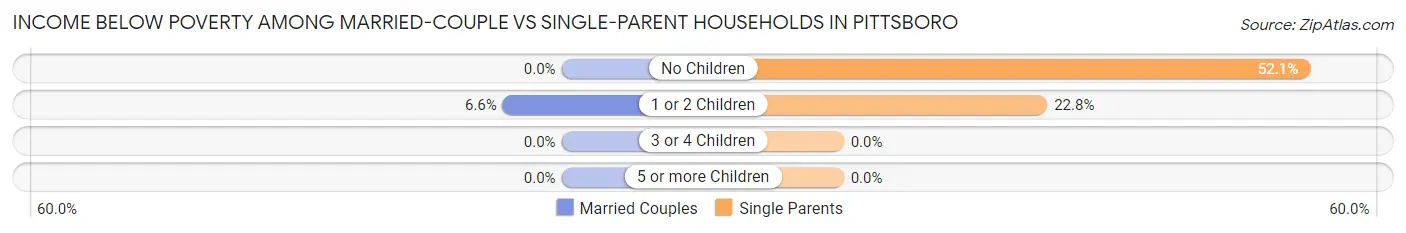
| Children | Married-Couple Families | Single-Parent Households |
| No Children | 0 (0.0%) | 37 (52.1%) |
| 1 or 2 Children | 20 (6.6%) | 53 (22.8%) |
| 3 or 4 Children | 0 (0.0%) | 0 (0.0%) |
| 5 or more Children | 0 (0.0%) | 0 (0.0%) |
| Total | 20 (2.6%) | 90 (29.6%) |
Race in Pittsboro
The most populous races in Pittsboro are White / Caucasian (3,133 | 68.8%), Black / African American (1,049 | 23.0%), and Hispanic or Latino (305 | 6.7%).
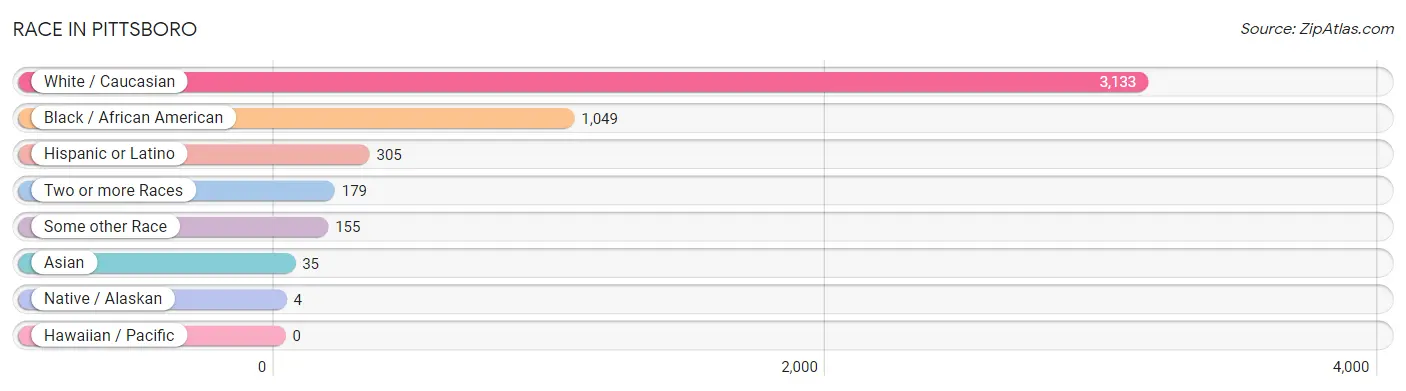
| Race | # Population | % Population |
| Asian | 35 | 0.8% |
| Black / African American | 1,049 | 23.0% |
| Hawaiian / Pacific | 0 | 0.0% |
| Hispanic or Latino | 305 | 6.7% |
| Native / Alaskan | 4 | 0.1% |
| White / Caucasian | 3,133 | 68.8% |
| Two or more Races | 179 | 3.9% |
| Some other Race | 155 | 3.4% |
| Total | 4,555 | 100.0% |
Ancestry in Pittsboro
The most populous ancestries reported in Pittsboro are English (958 | 21.0%), German (712 | 15.6%), American (342 | 7.5%), Scotch-Irish (238 | 5.2%), and Irish (214 | 4.7%), together accounting for 54.1% of all Pittsboro residents.
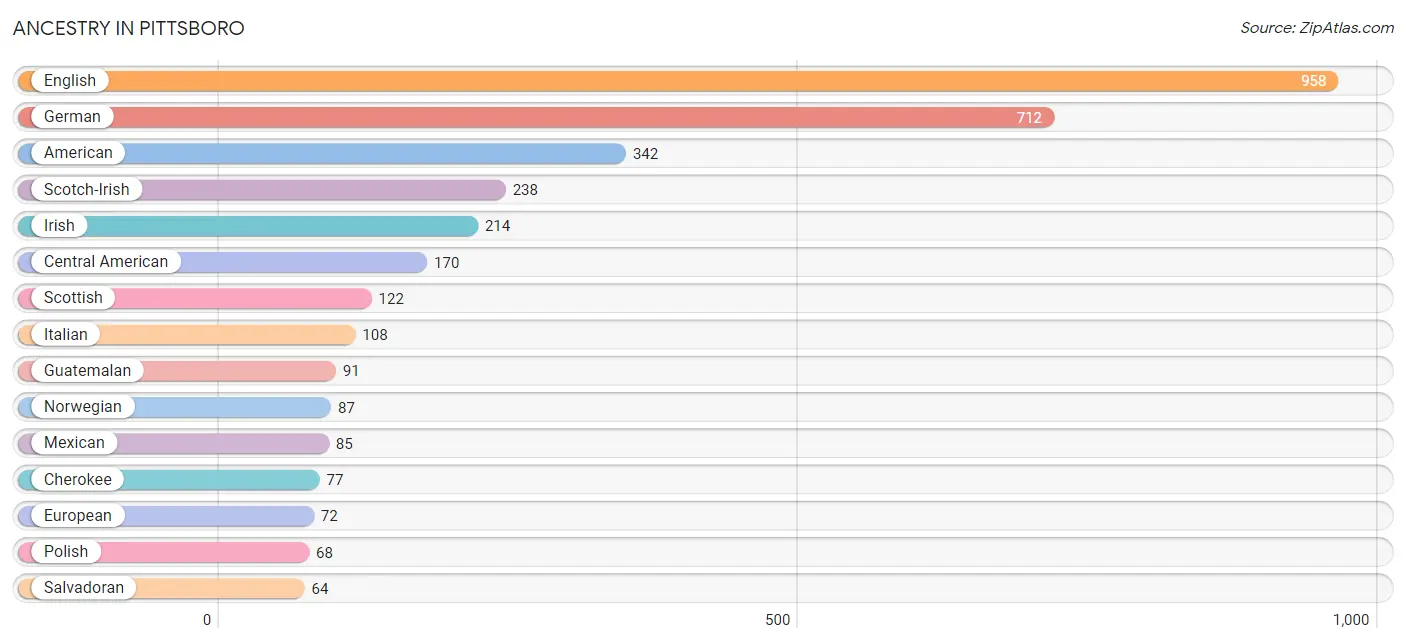
| Ancestry | # Population | % Population |
| American | 342 | 7.5% |
| Belgian | 16 | 0.4% |
| Central American | 170 | 3.7% |
| Cherokee | 77 | 1.7% |
| English | 958 | 21.0% |
| European | 72 | 1.6% |
| French | 48 | 1.1% |
| French Canadian | 11 | 0.2% |
| German | 712 | 15.6% |
| Guatemalan | 91 | 2.0% |
| Haitian | 42 | 0.9% |
| Hungarian | 15 | 0.3% |
| Irish | 214 | 4.7% |
| Italian | 108 | 2.4% |
| Jamaican | 50 | 1.1% |
| Mexican | 85 | 1.9% |
| Norwegian | 87 | 1.9% |
| Panamanian | 15 | 0.3% |
| Polish | 68 | 1.5% |
| Romanian | 16 | 0.4% |
| Russian | 13 | 0.3% |
| Salvadoran | 64 | 1.4% |
| Scotch-Irish | 238 | 5.2% |
| Scottish | 122 | 2.7% |
| Spanish | 50 | 1.1% |
| Swedish | 48 | 1.1% |
| Thai | 35 | 0.8% |
| Welsh | 40 | 0.9% | View All 28 Rows |
Immigrants in Pittsboro
The most numerous immigrant groups reported in Pittsboro came from Latin America (206 | 4.5%), Central America (129 | 2.8%), Guatemala (91 | 2.0%), Caribbean (77 | 1.7%), and Haiti (42 | 0.9%), together accounting for 12.0% of all Pittsboro residents.
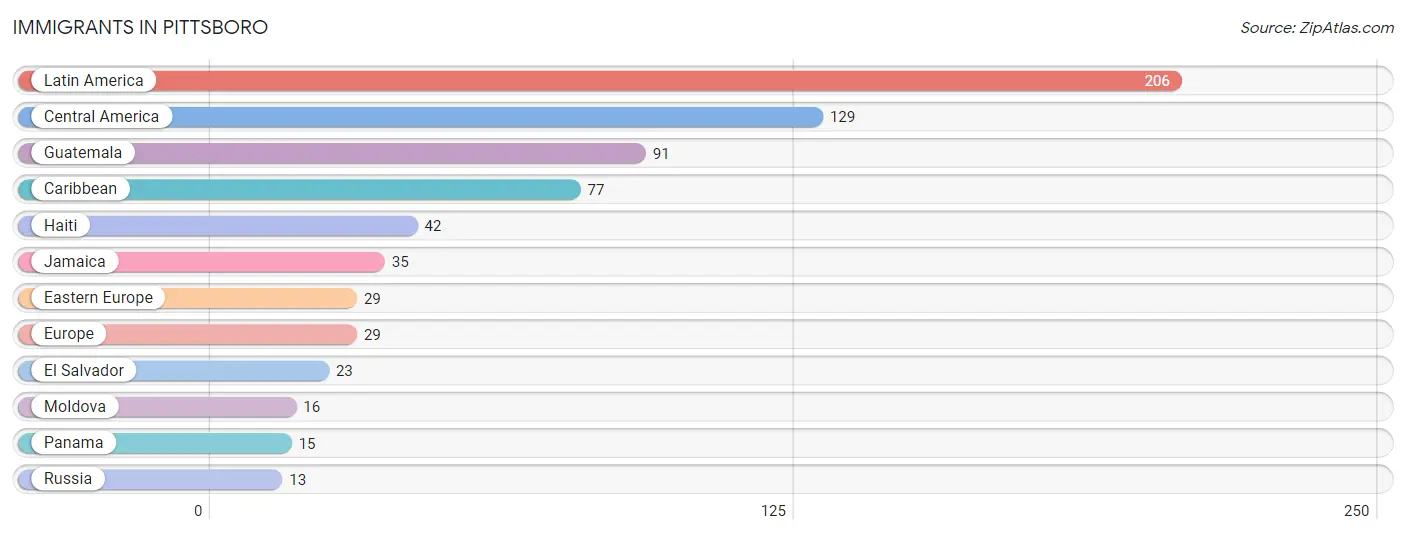
| Immigration Origin | # Population | % Population |
| Caribbean | 77 | 1.7% |
| Central America | 129 | 2.8% |
| Eastern Europe | 29 | 0.6% |
| El Salvador | 23 | 0.5% |
| Europe | 29 | 0.6% |
| Guatemala | 91 | 2.0% |
| Haiti | 42 | 0.9% |
| Jamaica | 35 | 0.8% |
| Latin America | 206 | 4.5% |
| Moldova | 16 | 0.4% |
| Panama | 15 | 0.3% |
| Russia | 13 | 0.3% | View All 12 Rows |
Sex and Age in Pittsboro
Sex and Age in Pittsboro
The most populous age groups in Pittsboro are 60 to 64 Years (226 | 13.6%) for men and 15 to 19 Years (356 | 12.3%) for women.
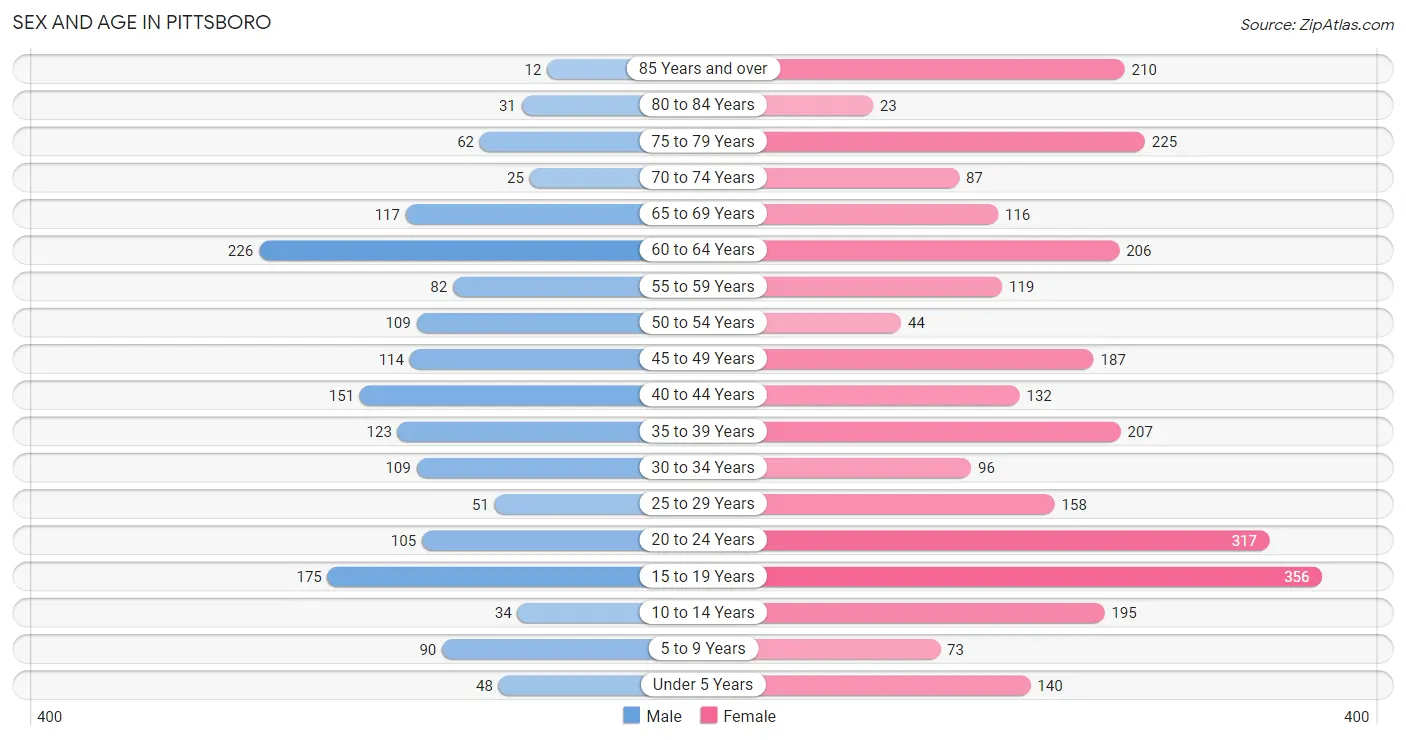
| Age Bracket | Male | Female |
| Under 5 Years | 48 (2.9%) | 140 (4.8%) |
| 5 to 9 Years | 90 (5.4%) | 73 (2.5%) |
| 10 to 14 Years | 34 (2.0%) | 195 (6.8%) |
| 15 to 19 Years | 175 (10.5%) | 356 (12.3%) |
| 20 to 24 Years | 105 (6.3%) | 317 (11.0%) |
| 25 to 29 Years | 51 (3.1%) | 158 (5.5%) |
| 30 to 34 Years | 109 (6.6%) | 96 (3.3%) |
| 35 to 39 Years | 123 (7.4%) | 207 (7.2%) |
| 40 to 44 Years | 151 (9.1%) | 132 (4.6%) |
| 45 to 49 Years | 114 (6.9%) | 187 (6.5%) |
| 50 to 54 Years | 109 (6.6%) | 44 (1.5%) |
| 55 to 59 Years | 82 (4.9%) | 119 (4.1%) |
| 60 to 64 Years | 226 (13.6%) | 206 (7.1%) |
| 65 to 69 Years | 117 (7.0%) | 116 (4.0%) |
| 70 to 74 Years | 25 (1.5%) | 87 (3.0%) |
| 75 to 79 Years | 62 (3.7%) | 225 (7.8%) |
| 80 to 84 Years | 31 (1.9%) | 23 (0.8%) |
| 85 Years and over | 12 (0.7%) | 210 (7.3%) |
| Total | 1,664 (100.0%) | 2,891 (100.0%) |
Families and Households in Pittsboro
Median Family Size in Pittsboro
The median family size in Pittsboro is 3.04 persons per family, with married-couple families (769 | 71.7%) accounting for the largest median family size of 3.08 persons per family. On the other hand, single male/father families (40 | 3.7%) represent the smallest median family size with 2.18 persons per family.
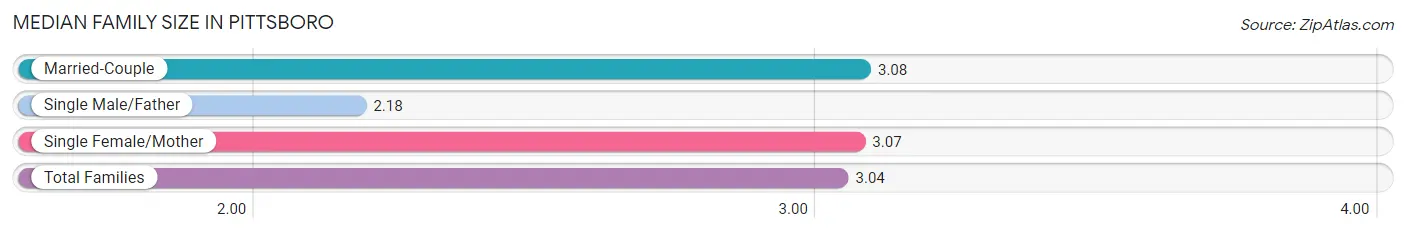
| Family Type | # Families | Family Size |
| Married-Couple | 769 (71.7%) | 3.08 |
| Single Male/Father | 40 (3.7%) | 2.18 |
| Single Female/Mother | 264 (24.6%) | 3.07 |
| Total Families | 1,073 (100.0%) | 3.04 |
Median Household Size in Pittsboro
The median household size in Pittsboro is 2.28 persons per household, with married-couple households (769 | 39.7%) accounting for the largest median household size of 3.1 persons per household. non-family households (866 | 44.7%) represent the smallest median household size with 1.30 persons per household.
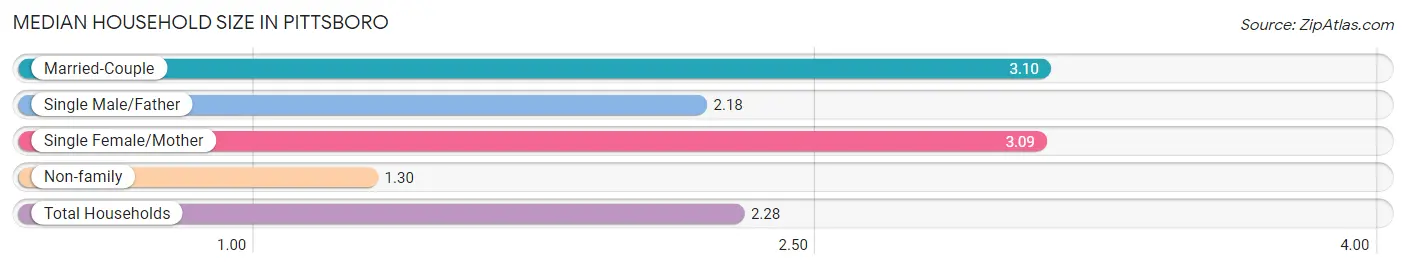
| Household Type | # Households | Household Size |
| Married-Couple | 769 (39.7%) | 3.10 |
| Single Male/Father | 40 (2.1%) | 2.18 |
| Single Female/Mother | 264 (13.6%) | 3.09 |
| Non-family | 866 (44.7%) | 1.30 |
| Total Households | 1,939 (100.0%) | 2.28 |
Household Size by Marriage Status in Pittsboro
Out of a total of 1,939 households in Pittsboro, 1,073 (55.3%) are family households, while 866 (44.7%) are nonfamily households. The most numerous type of family households are 2-person households, comprising 514, and the most common type of nonfamily households are 1-person households, comprising 684.
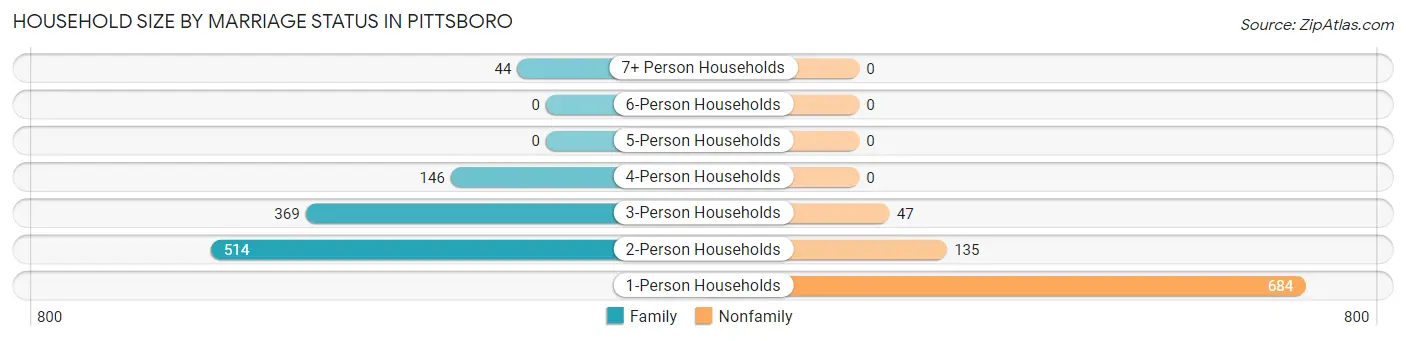
| Household Size | Family Households | Nonfamily Households |
| 1-Person Households | - | 684 (35.3%) |
| 2-Person Households | 514 (26.5%) | 135 (7.0%) |
| 3-Person Households | 369 (19.0%) | 47 (2.4%) |
| 4-Person Households | 146 (7.5%) | 0 (0.0%) |
| 5-Person Households | 0 (0.0%) | 0 (0.0%) |
| 6-Person Households | 0 (0.0%) | 0 (0.0%) |
| 7+ Person Households | 44 (2.3%) | 0 (0.0%) |
| Total | 1,073 (55.3%) | 866 (44.7%) |
Female Fertility in Pittsboro
Fertility by Age in Pittsboro
Average fertility rate in Pittsboro is 13.0 births per 1,000 women. Women in the age bracket of 20 to 34 years have the highest fertility rate with 33.0 births per 1,000 women. Women in the age bracket of 20 to 34 years acount for 100.0% of all women with births.
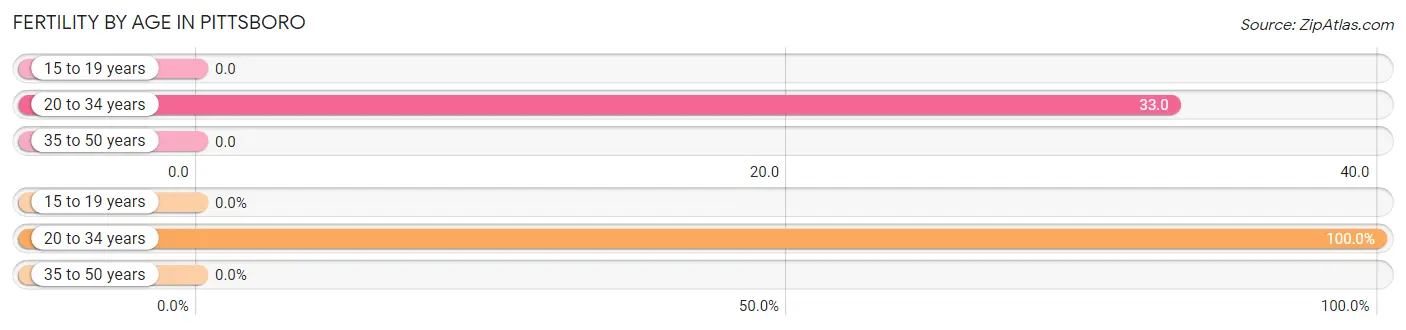
| Age Bracket | Women with Births | Births / 1,000 Women |
| 15 to 19 years | 0 (0.0%) | 0.0 |
| 20 to 34 years | 19 (100.0%) | 33.0 |
| 35 to 50 years | 0 (0.0%) | 0.0 |
| Total | 19 (100.0%) | 13.0 |
Fertility by Age by Marriage Status in Pittsboro
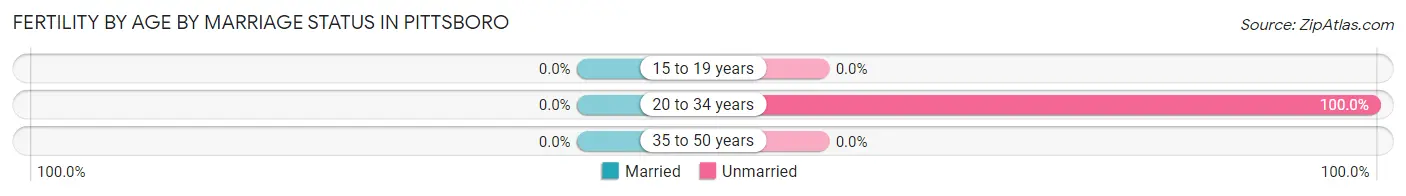
| Age Bracket | Married | Unmarried |
| 15 to 19 years | 0 (0.0%) | 0 (0.0%) |
| 20 to 34 years | 0 (0.0%) | 19 (100.0%) |
| 35 to 50 years | 0 (0.0%) | 0 (0.0%) |
| Total | 0 (0.0%) | 19 (100.0%) |
Fertility by Education in Pittsboro
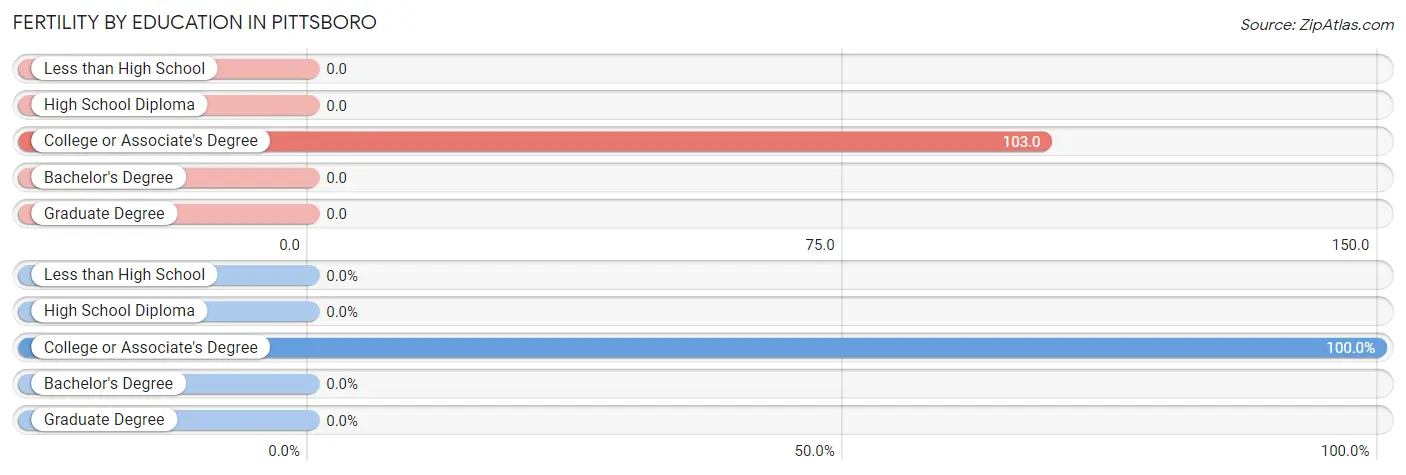
| Educational Attainment | Women with Births | Births / 1,000 Women |
| Less than High School | 0 (0.0%) | 0.0 |
| High School Diploma | 0 (0.0%) | 0.0 |
| College or Associate's Degree | 19 (100.0%) | 103.0 |
| Bachelor's Degree | 0 (0.0%) | 0.0 |
| Graduate Degree | 0 (0.0%) | 0.0 |
| Total | 19 (100.0%) | 13.0 |
Fertility by Education by Marriage Status in Pittsboro
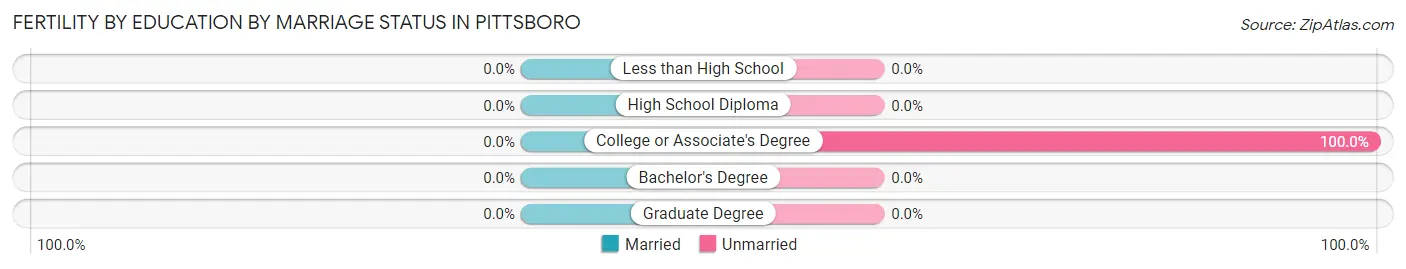
| Educational Attainment | Married | Unmarried |
| Less than High School | 0 (0.0%) | 0 (0.0%) |
| High School Diploma | 0 (0.0%) | 0 (0.0%) |
| College or Associate's Degree | 0 (0.0%) | 19 (100.0%) |
| Bachelor's Degree | 0 (0.0%) | 0 (0.0%) |
| Graduate Degree | 0 (0.0%) | 0 (0.0%) |
| Total | 0 (0.0%) | 19 (100.0%) |
Employment Characteristics in Pittsboro
Employment by Class of Employer in Pittsboro
Among the 2,432 employed individuals in Pittsboro, private company employees (1,522 | 62.6%), state government employees (384 | 15.8%), and local government employees (238 | 9.8%) make up the most common classes of employment.
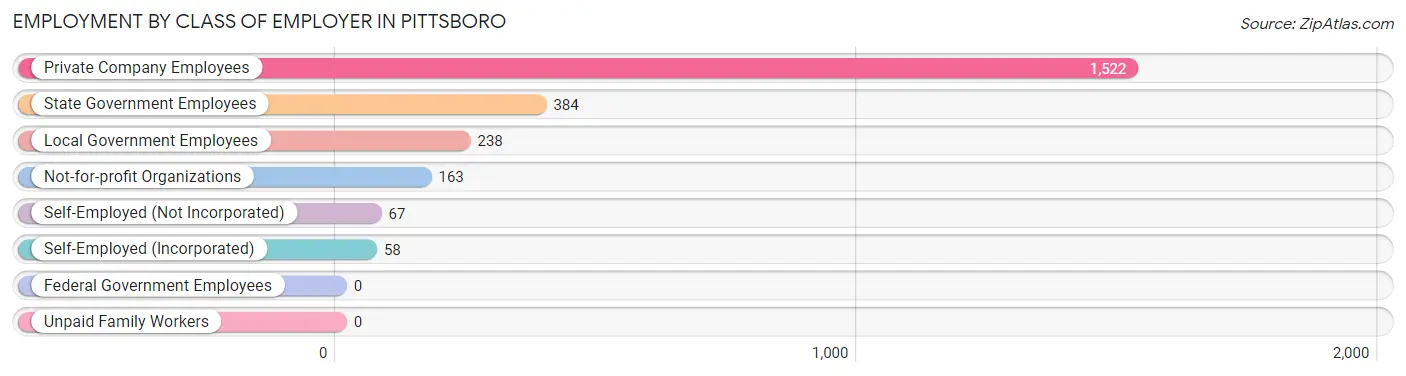
| Employer Class | # Employees | % Employees |
| Private Company Employees | 1,522 | 62.6% |
| Self-Employed (Incorporated) | 58 | 2.4% |
| Self-Employed (Not Incorporated) | 67 | 2.8% |
| Not-for-profit Organizations | 163 | 6.7% |
| Local Government Employees | 238 | 9.8% |
| State Government Employees | 384 | 15.8% |
| Federal Government Employees | 0 | 0.0% |
| Unpaid Family Workers | 0 | 0.0% |
| Total | 2,432 | 100.0% |
Employment Status by Age in Pittsboro
According to the labor force statistics for Pittsboro, out of the total population over 16 years of age (3,946), 63.6% or 2,510 individuals are in the labor force, with 3.1% or 78 of them unemployed. The age group with the highest labor force participation rate is 30 to 34 years, with 100.0% or 205 individuals in the labor force. Within the labor force, the 65 to 74 years age range has the highest percentage of unemployed individuals, with 41.1% or 46 of them being unemployed.
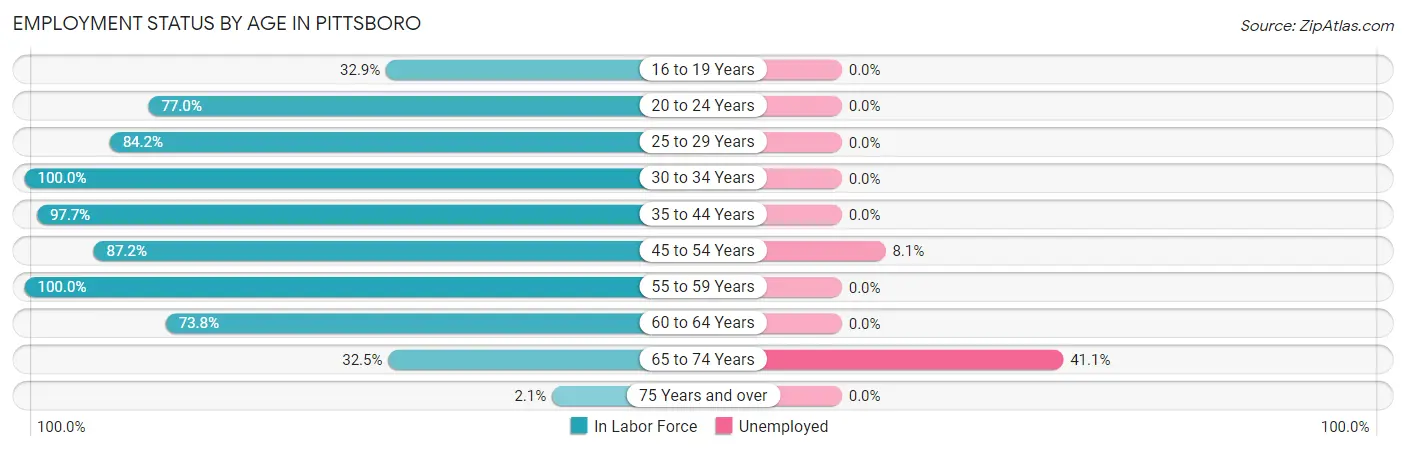
| Age Bracket | In Labor Force | Unemployed |
| 16 to 19 Years | 165 (32.9%) | 0 (0.0%) |
| 20 to 24 Years | 325 (77.0%) | 0 (0.0%) |
| 25 to 29 Years | 176 (84.2%) | 0 (0.0%) |
| 30 to 34 Years | 205 (100.0%) | 0 (0.0%) |
| 35 to 44 Years | 599 (97.7%) | 0 (0.0%) |
| 45 to 54 Years | 396 (87.2%) | 32 (8.1%) |
| 55 to 59 Years | 201 (100.0%) | 0 (0.0%) |
| 60 to 64 Years | 319 (73.8%) | 0 (0.0%) |
| 65 to 74 Years | 112 (32.5%) | 46 (41.1%) |
| 75 Years and over | 12 (2.1%) | 0 (0.0%) |
| Total | 2,510 (63.6%) | 78 (3.1%) |
Employment Status by Educational Attainment in Pittsboro
According to labor force statistics for Pittsboro, 89.7% of individuals (1,896) out of the total population between 25 and 64 years of age (2,114) are in the labor force, with 1.7% or 32 of them being unemployed. The group with the highest labor force participation rate are those with the educational attainment of college / associate degree, with 97.8% or 440 individuals in the labor force. Within the labor force, individuals with bachelor's degree or higher education have the highest percentage of unemployment, with 2.8% or 32 of them being unemployed.
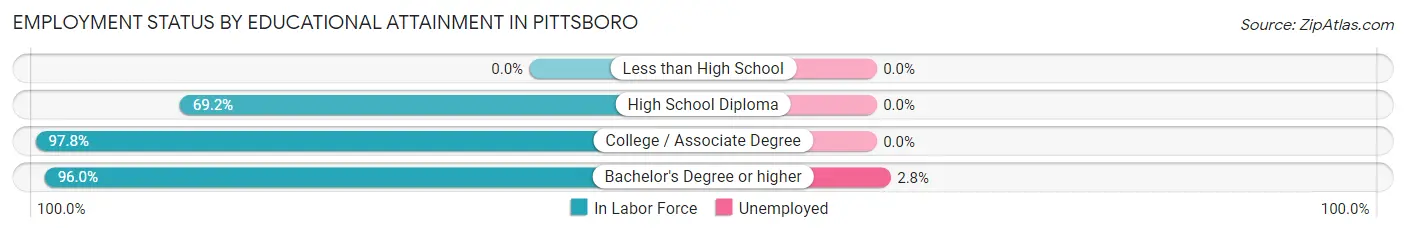
| Educational Attainment | In Labor Force | Unemployed |
| Less than High School | 0 (0.0%) | 0 (0.0%) |
| High School Diploma | 330 (69.2%) | 0 (0.0%) |
| College / Associate Degree | 440 (97.8%) | 0 (0.0%) |
| Bachelor's Degree or higher | 1,126 (96.0%) | 33 (2.8%) |
| Total | 1,896 (89.7%) | 36 (1.7%) |
Employment Occupations by Sex in Pittsboro
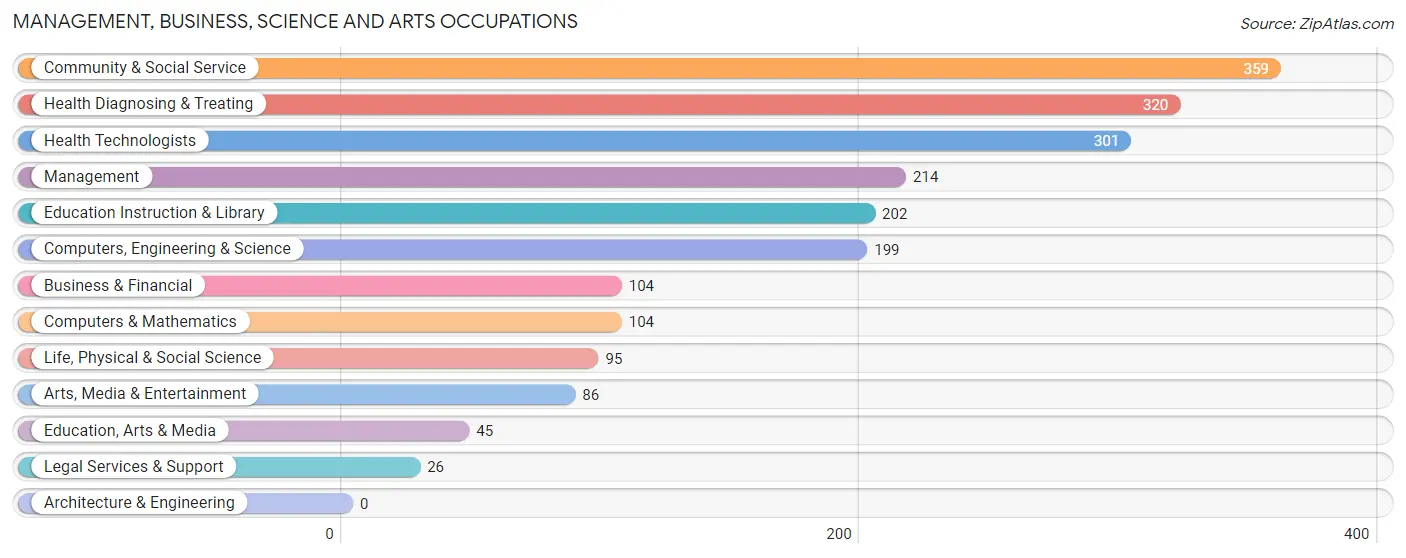
Management, Business, Science and Arts Occupations
The most common Management, Business, Science and Arts occupations in Pittsboro are Community & Social Service (359 | 14.8%), Health Diagnosing & Treating (320 | 13.2%), Health Technologists (301 | 12.4%), Management (214 | 8.8%), and Education Instruction & Library (202 | 8.3%).
Management, Business, Science and Arts Occupations by Sex
Within the Management, Business, Science and Arts occupations in Pittsboro, the most male-oriented occupations are Legal Services & Support (100.0%), Management (78.5%), and Arts, Media & Entertainment (62.8%), while the most female-oriented occupations are Health Diagnosing & Treating (85.9%), Health Technologists (85.1%), and Computers & Mathematics (69.2%).
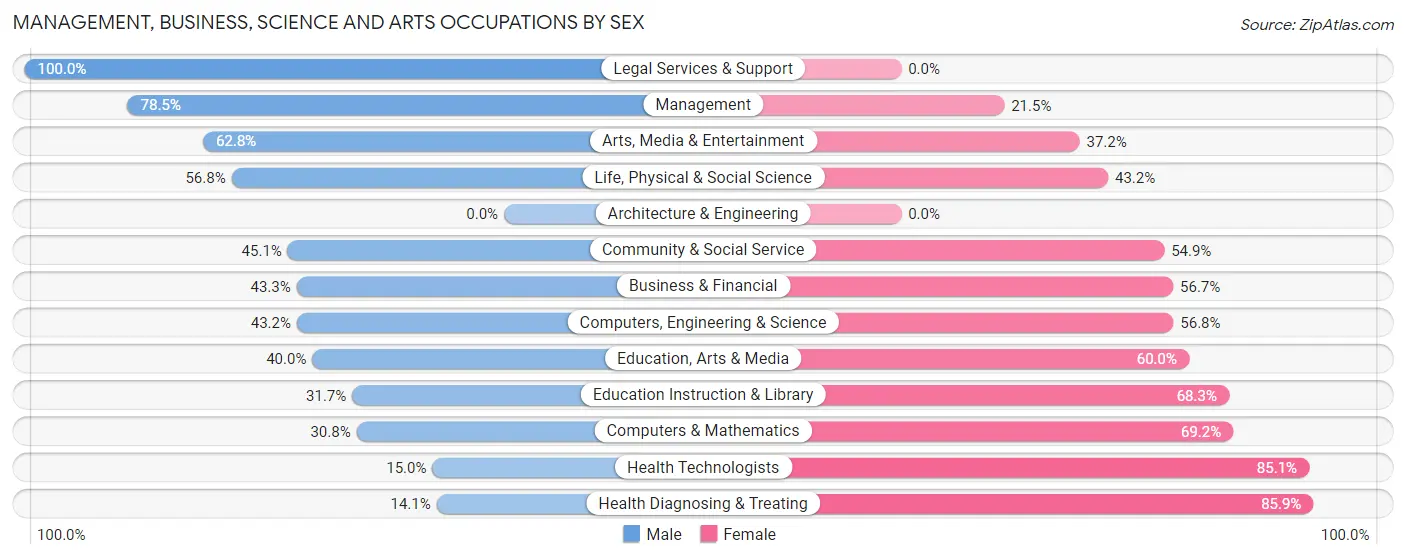
| Occupation | Male | Female |
| Management | 168 (78.5%) | 46 (21.5%) |
| Business & Financial | 45 (43.3%) | 59 (56.7%) |
| Computers, Engineering & Science | 86 (43.2%) | 113 (56.8%) |
| Computers & Mathematics | 32 (30.8%) | 72 (69.2%) |
| Architecture & Engineering | 0 (0.0%) | 0 (0.0%) |
| Life, Physical & Social Science | 54 (56.8%) | 41 (43.2%) |
| Community & Social Service | 162 (45.1%) | 197 (54.9%) |
| Education, Arts & Media | 18 (40.0%) | 27 (60.0%) |
| Legal Services & Support | 26 (100.0%) | 0 (0.0%) |
| Education Instruction & Library | 64 (31.7%) | 138 (68.3%) |
| Arts, Media & Entertainment | 54 (62.8%) | 32 (37.2%) |
| Health Diagnosing & Treating | 45 (14.1%) | 275 (85.9%) |
| Health Technologists | 45 (14.9%) | 256 (85.1%) |
| Total (Category) | 506 (42.3%) | 690 (57.7%) |
| Total (Overall) | 1,138 (46.8%) | 1,294 (53.2%) |
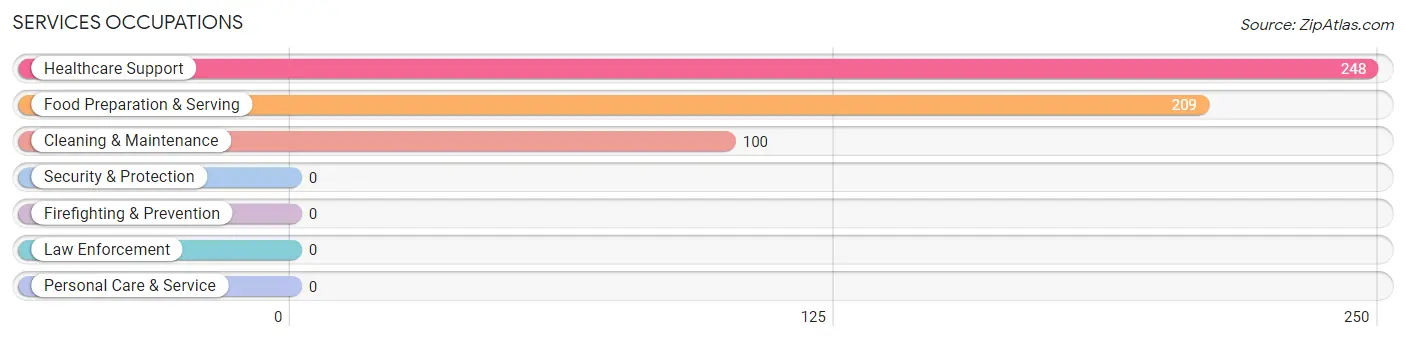
Services Occupations
The most common Services occupations in Pittsboro are Healthcare Support (248 | 10.2%), Food Preparation & Serving (209 | 8.6%), and Cleaning & Maintenance (100 | 4.1%).
Services Occupations by Sex
Within the Services occupations in Pittsboro, the most male-oriented occupations are Food Preparation & Serving (90.9%), and Cleaning & Maintenance (77.0%), while the most female-oriented occupations are Healthcare Support (100.0%), Cleaning & Maintenance (23.0%), and Food Preparation & Serving (9.1%).
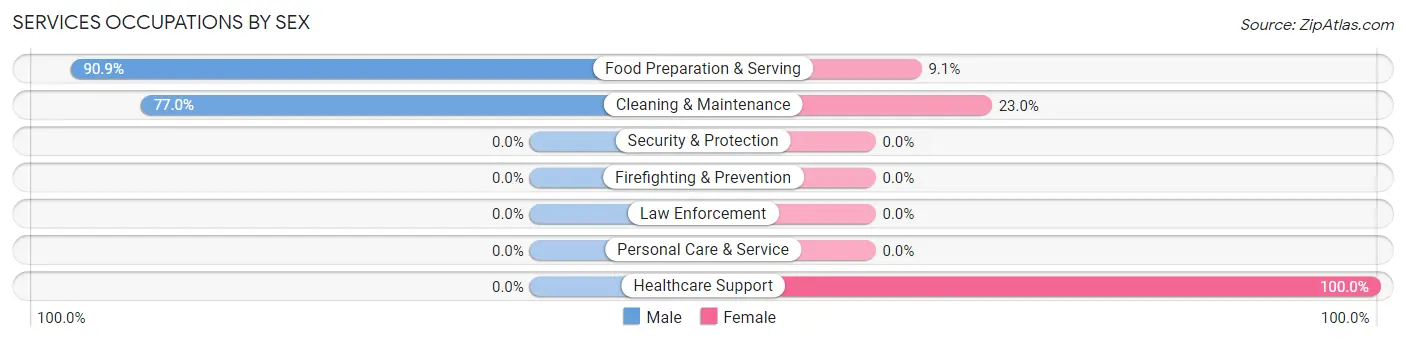
| Occupation | Male | Female |
| Healthcare Support | 0 (0.0%) | 248 (100.0%) |
| Security & Protection | 0 (0.0%) | 0 (0.0%) |
| Firefighting & Prevention | 0 (0.0%) | 0 (0.0%) |
| Law Enforcement | 0 (0.0%) | 0 (0.0%) |
| Food Preparation & Serving | 190 (90.9%) | 19 (9.1%) |
| Cleaning & Maintenance | 77 (77.0%) | 23 (23.0%) |
| Personal Care & Service | 0 (0.0%) | 0 (0.0%) |
| Total (Category) | 267 (47.9%) | 290 (52.1%) |
| Total (Overall) | 1,138 (46.8%) | 1,294 (53.2%) |
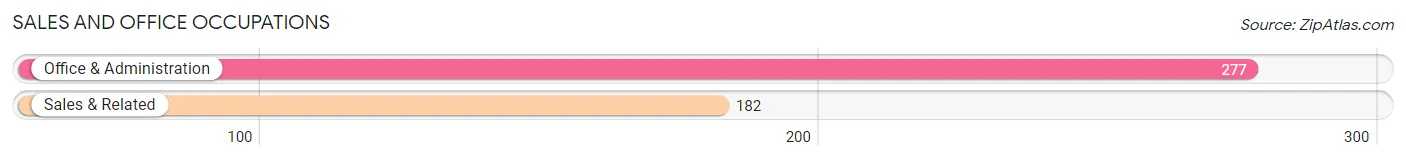
Sales and Office Occupations
The most common Sales and Office occupations in Pittsboro are Office & Administration (277 | 11.4%), and Sales & Related (182 | 7.5%).
Sales and Office Occupations by Sex
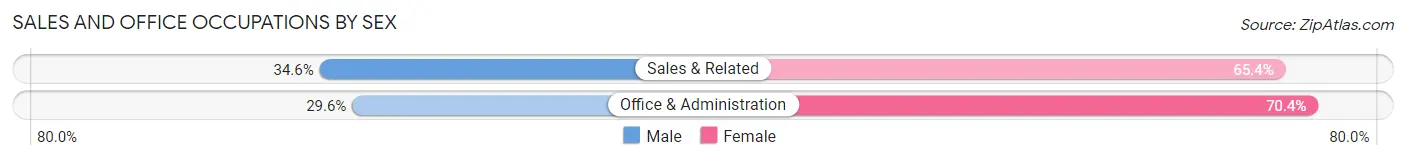
| Occupation | Male | Female |
| Sales & Related | 63 (34.6%) | 119 (65.4%) |
| Office & Administration | 82 (29.6%) | 195 (70.4%) |
| Total (Category) | 145 (31.6%) | 314 (68.4%) |
| Total (Overall) | 1,138 (46.8%) | 1,294 (53.2%) |
Natural Resources, Construction and Maintenance Occupations
The most common Natural Resources, Construction and Maintenance occupations in Pittsboro are , and Construction & Extraction (27 | 1.1%).
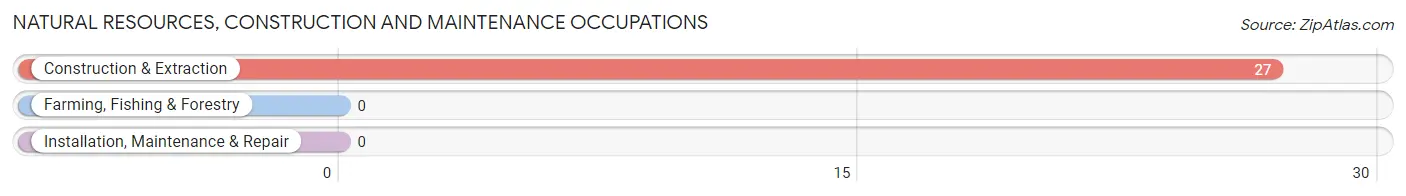
Natural Resources, Construction and Maintenance Occupations by Sex
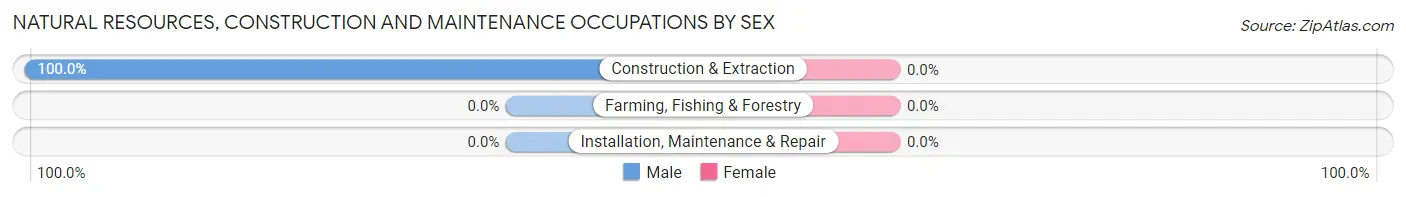
| Occupation | Male | Female |
| Farming, Fishing & Forestry | 0 (0.0%) | 0 (0.0%) |
| Construction & Extraction | 27 (100.0%) | 0 (0.0%) |
| Installation, Maintenance & Repair | 0 (0.0%) | 0 (0.0%) |
| Total (Category) | 27 (100.0%) | 0 (0.0%) |
| Total (Overall) | 1,138 (46.8%) | 1,294 (53.2%) |
Production, Transportation and Moving Occupations
The most common Production, Transportation and Moving occupations in Pittsboro are Production (109 | 4.5%), Transportation (54 | 2.2%), and Material Moving (30 | 1.2%).
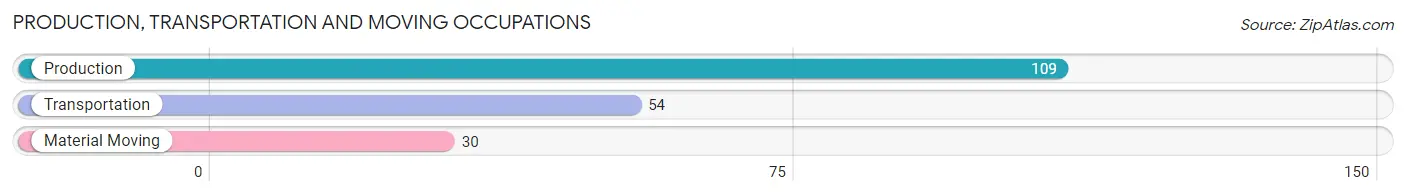
Production, Transportation and Moving Occupations by Sex
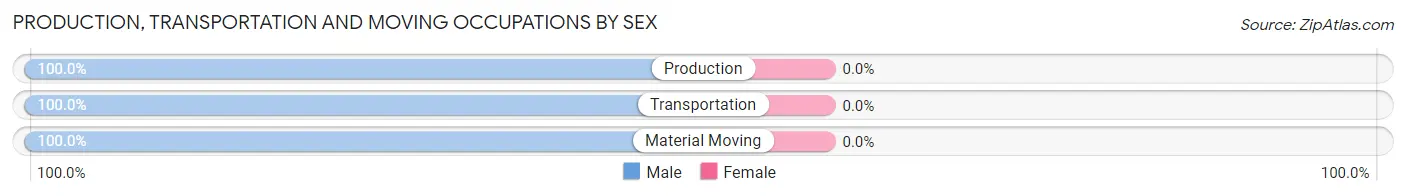
| Occupation | Male | Female |
| Production | 109 (100.0%) | 0 (0.0%) |
| Transportation | 54 (100.0%) | 0 (0.0%) |
| Material Moving | 30 (100.0%) | 0 (0.0%) |
| Total (Category) | 193 (100.0%) | 0 (0.0%) |
| Total (Overall) | 1,138 (46.8%) | 1,294 (53.2%) |
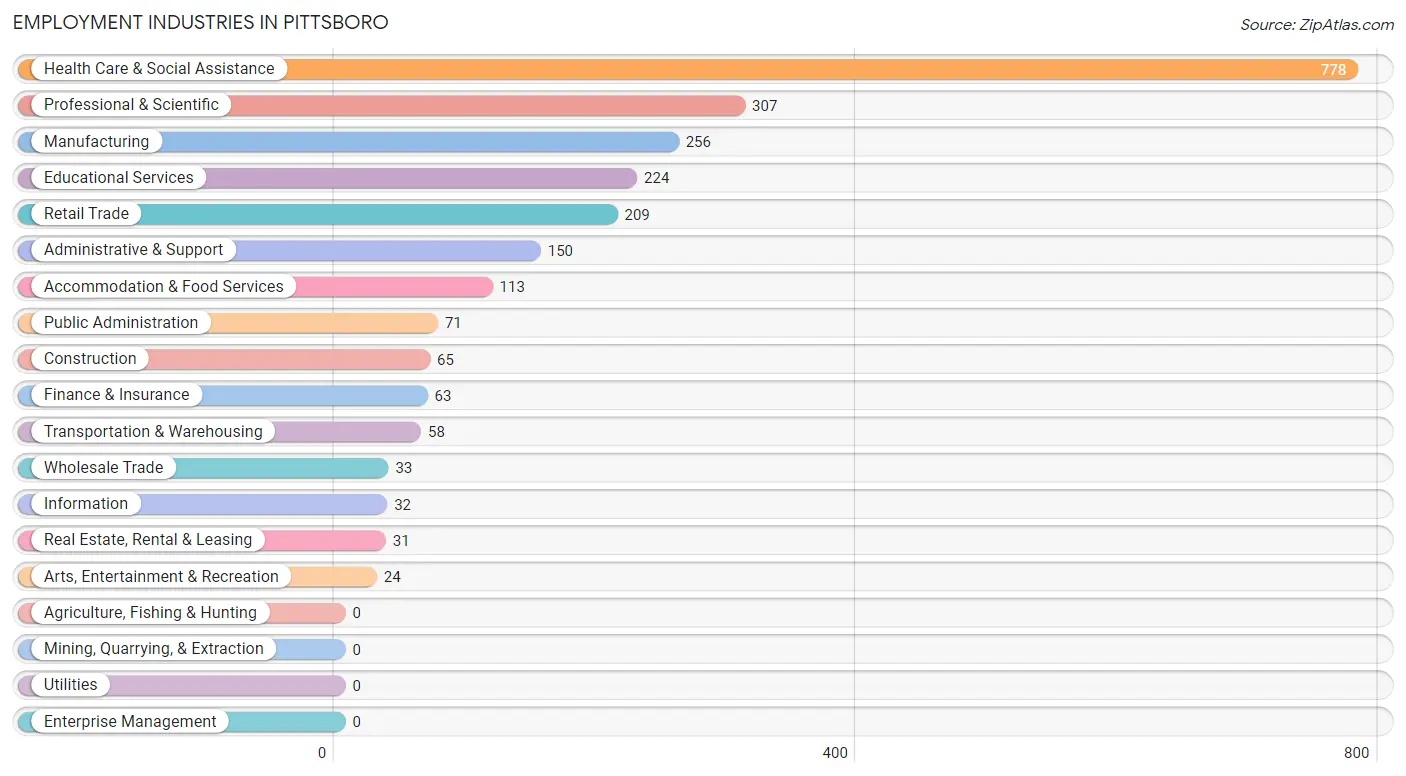
Employment Industries by Sex in Pittsboro
Employment Industries in Pittsboro
The major employment industries in Pittsboro include Health Care & Social Assistance (778 | 32.0%), Professional & Scientific (307 | 12.6%), Manufacturing (256 | 10.5%), Educational Services (224 | 9.2%), and Retail Trade (209 | 8.6%).
Employment Industries by Sex in Pittsboro
The Pittsboro industries that see more men than women are Transportation & Warehousing (100.0%), Real Estate, Rental & Leasing (100.0%), and Arts, Entertainment & Recreation (100.0%), whereas the industries that tend to have a higher number of women are Information (100.0%), Finance & Insurance (100.0%), and Wholesale Trade (90.9%).
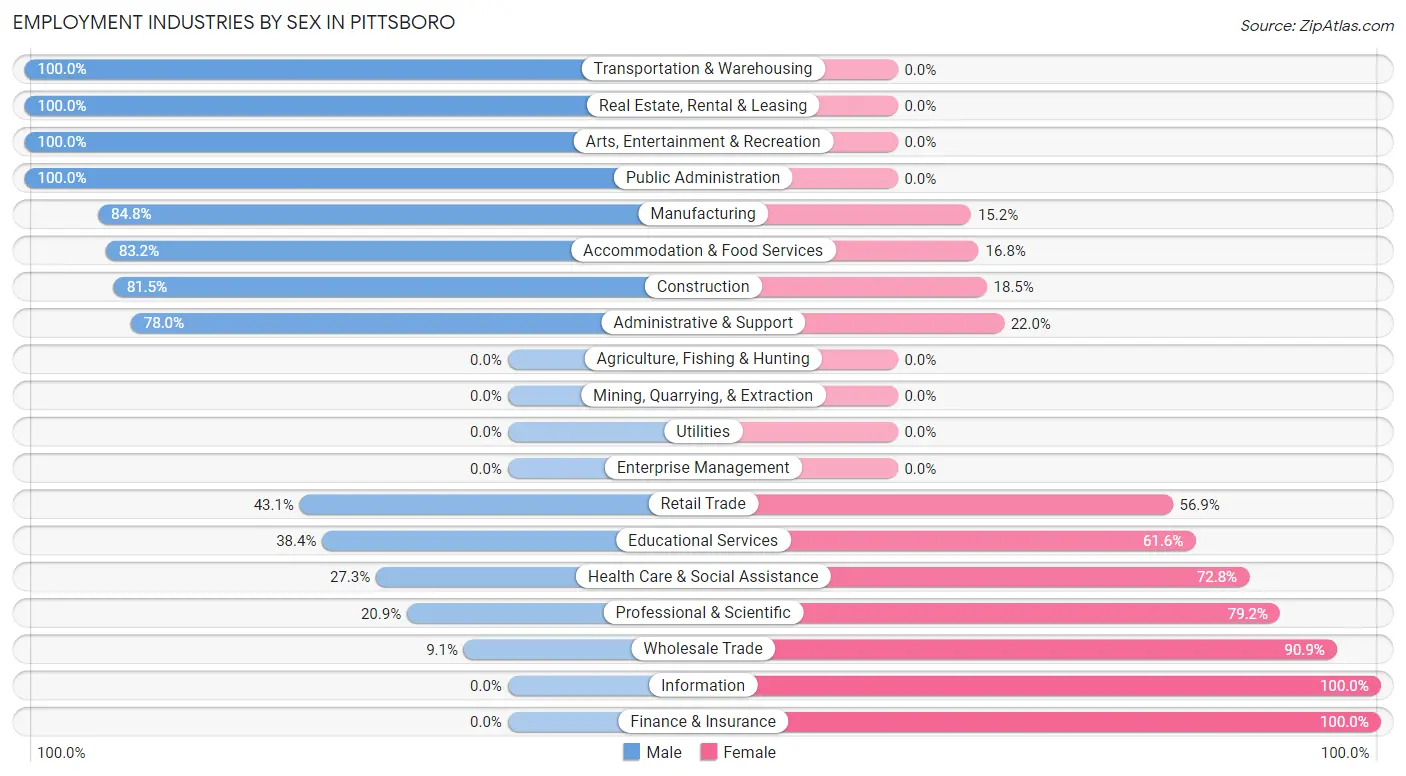
| Industry | Male | Female |
| Agriculture, Fishing & Hunting | 0 (0.0%) | 0 (0.0%) |
| Mining, Quarrying, & Extraction | 0 (0.0%) | 0 (0.0%) |
| Construction | 53 (81.5%) | 12 (18.5%) |
| Manufacturing | 217 (84.8%) | 39 (15.2%) |
| Wholesale Trade | 3 (9.1%) | 30 (90.9%) |
| Retail Trade | 90 (43.1%) | 119 (56.9%) |
| Transportation & Warehousing | 58 (100.0%) | 0 (0.0%) |
| Utilities | 0 (0.0%) | 0 (0.0%) |
| Information | 0 (0.0%) | 32 (100.0%) |
| Finance & Insurance | 0 (0.0%) | 63 (100.0%) |
| Real Estate, Rental & Leasing | 31 (100.0%) | 0 (0.0%) |
| Professional & Scientific | 64 (20.8%) | 243 (79.1%) |
| Enterprise Management | 0 (0.0%) | 0 (0.0%) |
| Administrative & Support | 117 (78.0%) | 33 (22.0%) |
| Educational Services | 86 (38.4%) | 138 (61.6%) |
| Health Care & Social Assistance | 212 (27.3%) | 566 (72.8%) |
| Arts, Entertainment & Recreation | 24 (100.0%) | 0 (0.0%) |
| Accommodation & Food Services | 94 (83.2%) | 19 (16.8%) |
| Public Administration | 71 (100.0%) | 0 (0.0%) |
| Total | 1,138 (46.8%) | 1,294 (53.2%) |
Education in Pittsboro
School Enrollment in Pittsboro
The most common levels of schooling among the 1,022 students in Pittsboro are high school (435 | 42.6%), elementary school (197 | 19.3%), and middle school (153 | 15.0%).
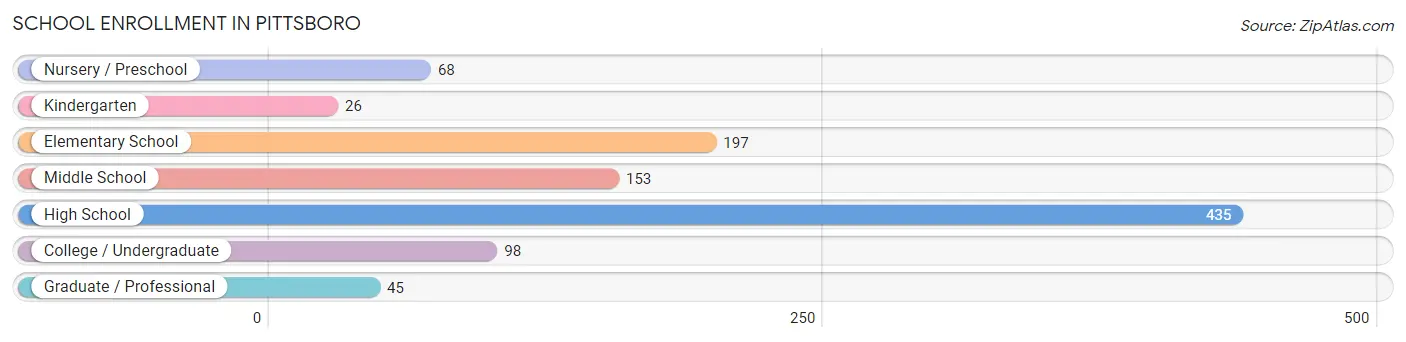
| School Level | # Students | % Students |
| Nursery / Preschool | 68 | 6.7% |
| Kindergarten | 26 | 2.5% |
| Elementary School | 197 | 19.3% |
| Middle School | 153 | 15.0% |
| High School | 435 | 42.6% |
| College / Undergraduate | 98 | 9.6% |
| Graduate / Professional | 45 | 4.4% |
| Total | 1,022 | 100.0% |
School Enrollment by Age by Funding Source in Pittsboro
Out of a total of 1,022 students who are enrolled in schools in Pittsboro, 112 (11.0%) attend a private institution, while the remaining 910 (89.0%) are enrolled in public schools. The age group of 3 to 4 year olds has the highest likelihood of being enrolled in private schools, with 52 (100.0% in the age bracket) enrolled. Conversely, the age group of 10 to 14 year olds has the lowest likelihood of being enrolled in a private school, with 229 (100.0% in the age bracket) attending a public institution.
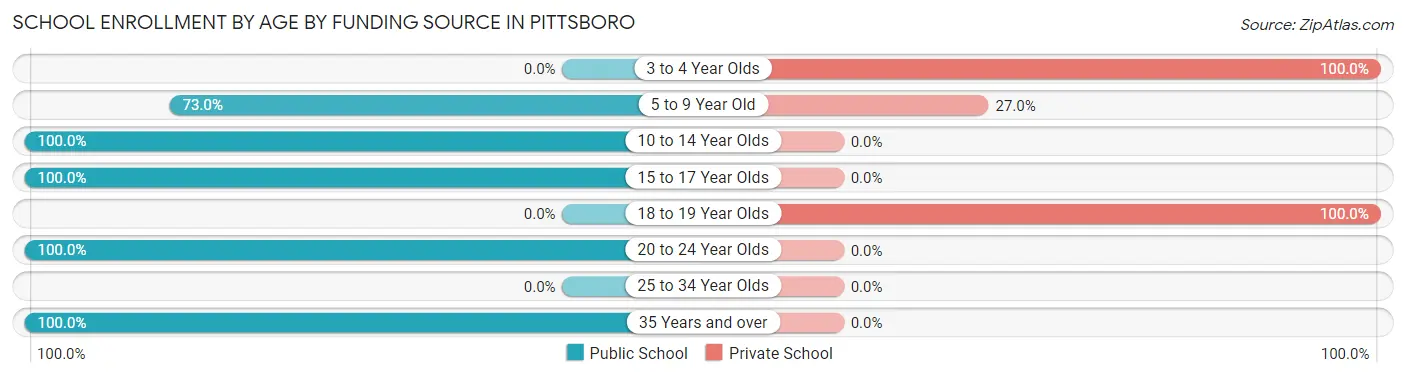
| Age Bracket | Public School | Private School |
| 3 to 4 Year Olds | 0 (0.0%) | 52 (100.0%) |
| 5 to 9 Year Old | 119 (73.0%) | 44 (27.0%) |
| 10 to 14 Year Olds | 229 (100.0%) | 0 (0.0%) |
| 15 to 17 Year Olds | 435 (100.0%) | 0 (0.0%) |
| 18 to 19 Year Olds | 0 (0.0%) | 16 (100.0%) |
| 20 to 24 Year Olds | 96 (100.0%) | 0 (0.0%) |
| 25 to 34 Year Olds | 0 (0.0%) | 0 (0.0%) |
| 35 Years and over | 31 (100.0%) | 0 (0.0%) |
| Total | 910 (89.0%) | 112 (11.0%) |
Educational Attainment by Field of Study in Pittsboro
Science & technology (353 | 24.1%), business (325 | 22.2%), education (163 | 11.1%), bio, nature & agricultural (160 | 10.9%), and communications (78 | 5.3%) are the most common fields of study among 1,467 individuals in Pittsboro who have obtained a bachelor's degree or higher.
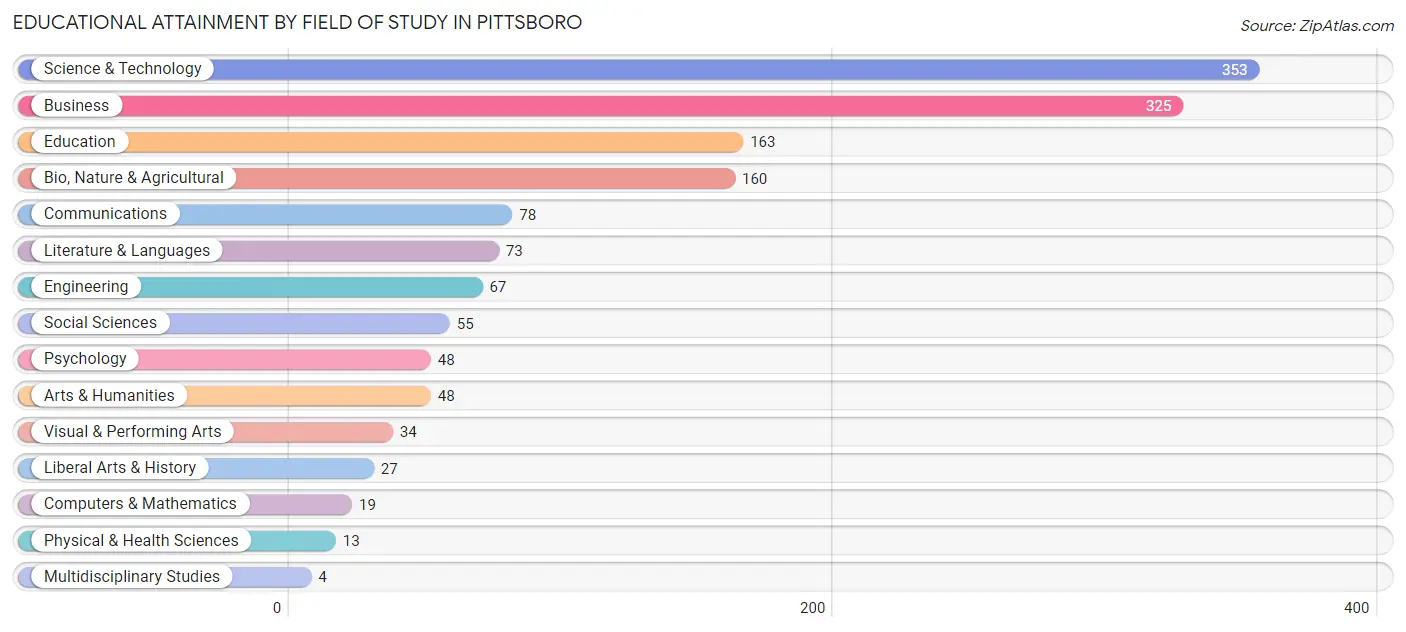
| Field of Study | # Graduates | % Graduates |
| Computers & Mathematics | 19 | 1.3% |
| Bio, Nature & Agricultural | 160 | 10.9% |
| Physical & Health Sciences | 13 | 0.9% |
| Psychology | 48 | 3.3% |
| Social Sciences | 55 | 3.7% |
| Engineering | 67 | 4.6% |
| Multidisciplinary Studies | 4 | 0.3% |
| Science & Technology | 353 | 24.1% |
| Business | 325 | 22.2% |
| Education | 163 | 11.1% |
| Literature & Languages | 73 | 5.0% |
| Liberal Arts & History | 27 | 1.8% |
| Visual & Performing Arts | 34 | 2.3% |
| Communications | 78 | 5.3% |
| Arts & Humanities | 48 | 3.3% |
| Total | 1,467 | 100.0% |
Transportation & Commute in Pittsboro
Vehicle Availability by Sex in Pittsboro
The most prevalent vehicle ownership categories in Pittsboro are males with 2 vehicles (474, accounting for 41.6%) and females with 2 vehicles (551, making up 36.6%).
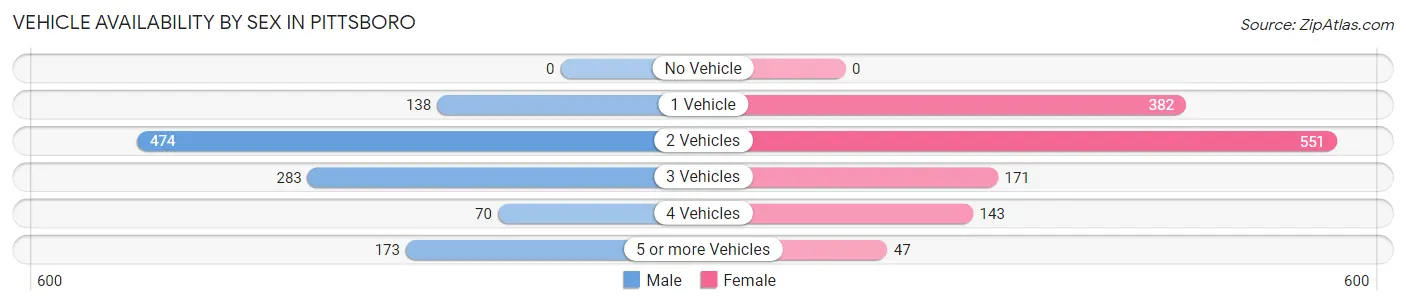
| Vehicles Available | Male | Female |
| No Vehicle | 0 (0.0%) | 0 (0.0%) |
| 1 Vehicle | 138 (12.1%) | 382 (29.5%) |
| 2 Vehicles | 474 (41.6%) | 551 (42.6%) |
| 3 Vehicles | 283 (24.9%) | 171 (13.2%) |
| 4 Vehicles | 70 (6.1%) | 143 (11.1%) |
| 5 or more Vehicles | 173 (15.2%) | 47 (3.6%) |
| Total | 1,138 (100.0%) | 1,294 (100.0%) |
Commute Time in Pittsboro
The most frequently occuring commute durations in Pittsboro are 25 to 29 minutes (511 commuters, 24.2%), 20 to 24 minutes (340 commuters, 16.1%), and 30 to 34 minutes (304 commuters, 14.4%).
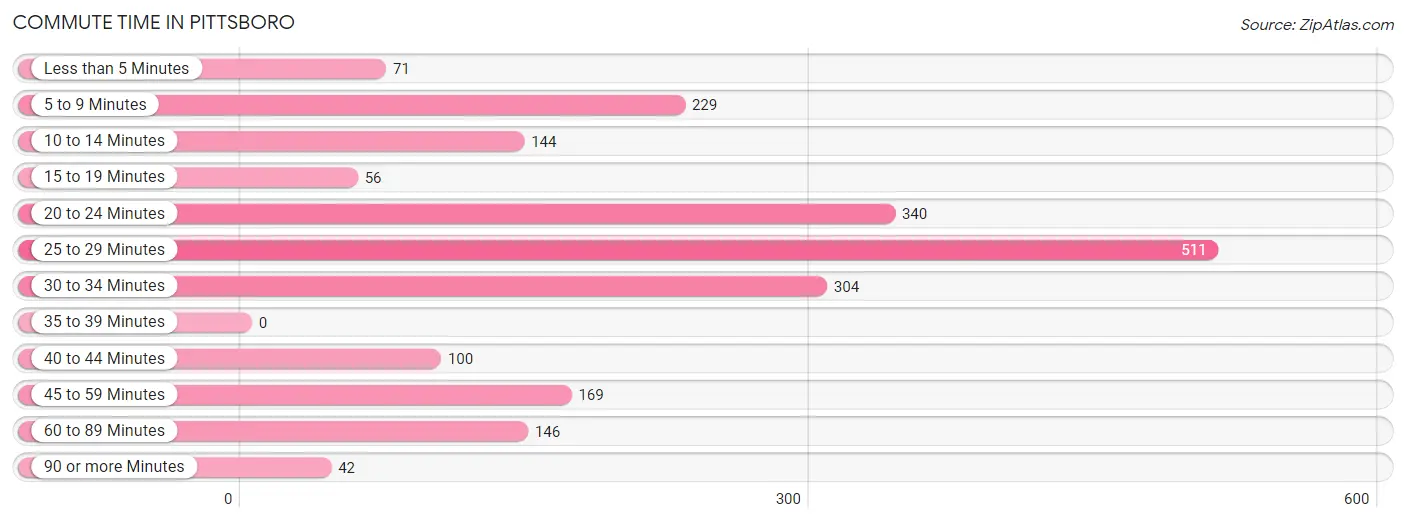
| Commute Time | # Commuters | % Commuters |
| Less than 5 Minutes | 71 | 3.4% |
| 5 to 9 Minutes | 229 | 10.8% |
| 10 to 14 Minutes | 144 | 6.8% |
| 15 to 19 Minutes | 56 | 2.6% |
| 20 to 24 Minutes | 340 | 16.1% |
| 25 to 29 Minutes | 511 | 24.2% |
| 30 to 34 Minutes | 304 | 14.4% |
| 35 to 39 Minutes | 0 | 0.0% |
| 40 to 44 Minutes | 100 | 4.7% |
| 45 to 59 Minutes | 169 | 8.0% |
| 60 to 89 Minutes | 146 | 6.9% |
| 90 or more Minutes | 42 | 2.0% |
Commute Time by Sex in Pittsboro
The most common commute times in Pittsboro are 25 to 29 minutes (286 commuters, 28.3%) for males and 20 to 24 minutes (245 commuters, 22.2%) for females.
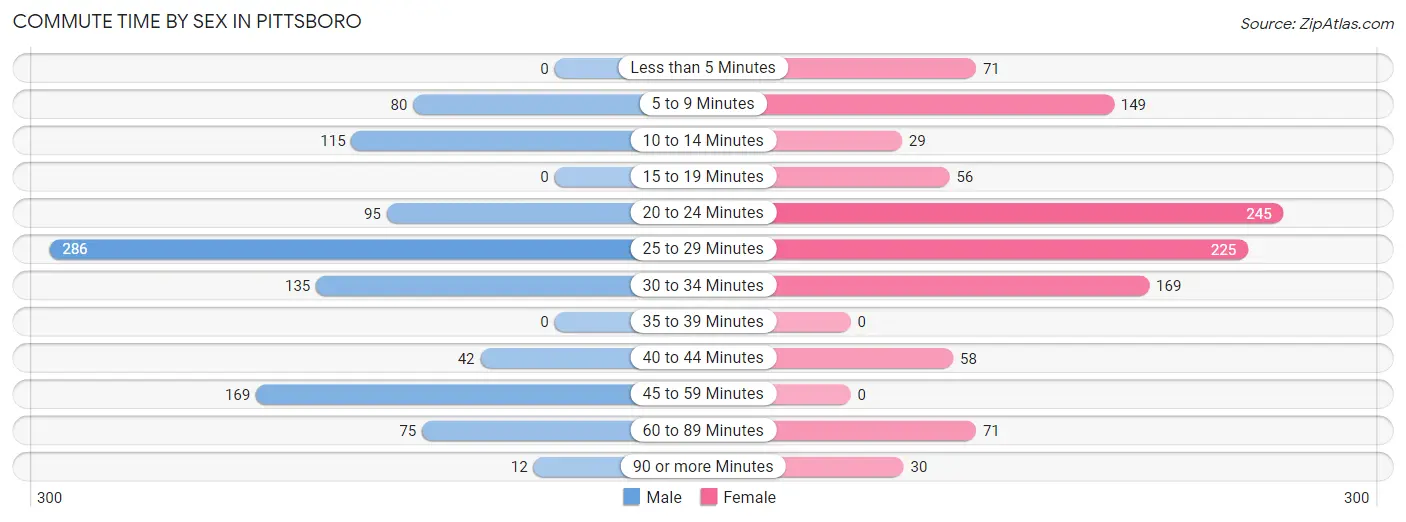
| Commute Time | Male | Female |
| Less than 5 Minutes | 0 (0.0%) | 71 (6.4%) |
| 5 to 9 Minutes | 80 (7.9%) | 149 (13.5%) |
| 10 to 14 Minutes | 115 (11.4%) | 29 (2.6%) |
| 15 to 19 Minutes | 0 (0.0%) | 56 (5.1%) |
| 20 to 24 Minutes | 95 (9.4%) | 245 (22.2%) |
| 25 to 29 Minutes | 286 (28.3%) | 225 (20.4%) |
| 30 to 34 Minutes | 135 (13.4%) | 169 (15.3%) |
| 35 to 39 Minutes | 0 (0.0%) | 0 (0.0%) |
| 40 to 44 Minutes | 42 (4.2%) | 58 (5.3%) |
| 45 to 59 Minutes | 169 (16.8%) | 0 (0.0%) |
| 60 to 89 Minutes | 75 (7.4%) | 71 (6.4%) |
| 90 or more Minutes | 12 (1.2%) | 30 (2.7%) |
Time of Departure to Work by Sex in Pittsboro
The most frequent times of departure to work in Pittsboro are 7:00 AM to 7:29 AM (265, 26.3%) for males and 7:00 AM to 7:29 AM (438, 39.7%) for females.

| Time of Departure | Male | Female |
| 12:00 AM to 4:59 AM | 30 (3.0%) | 65 (5.9%) |
| 5:00 AM to 5:29 AM | 32 (3.2%) | 0 (0.0%) |
| 5:30 AM to 5:59 AM | 77 (7.6%) | 35 (3.2%) |
| 6:00 AM to 6:29 AM | 98 (9.7%) | 65 (5.9%) |
| 6:30 AM to 6:59 AM | 57 (5.7%) | 23 (2.1%) |
| 7:00 AM to 7:29 AM | 265 (26.3%) | 438 (39.7%) |
| 7:30 AM to 7:59 AM | 71 (7.0%) | 102 (9.2%) |
| 8:00 AM to 8:29 AM | 36 (3.6%) | 23 (2.1%) |
| 8:30 AM to 8:59 AM | 14 (1.4%) | 0 (0.0%) |
| 9:00 AM to 9:59 AM | 104 (10.3%) | 107 (9.7%) |
| 10:00 AM to 10:59 AM | 80 (7.9%) | 49 (4.4%) |
| 11:00 AM to 11:59 AM | 85 (8.4%) | 0 (0.0%) |
| 12:00 PM to 3:59 PM | 48 (4.8%) | 37 (3.4%) |
| 4:00 PM to 11:59 PM | 12 (1.2%) | 159 (14.4%) |
| Total | 1,009 (100.0%) | 1,103 (100.0%) |
Housing Occupancy in Pittsboro
Occupancy by Ownership in Pittsboro
Of the total 1,939 dwellings in Pittsboro, owner-occupied units account for 1,176 (60.7%), while renter-occupied units make up 763 (39.4%).
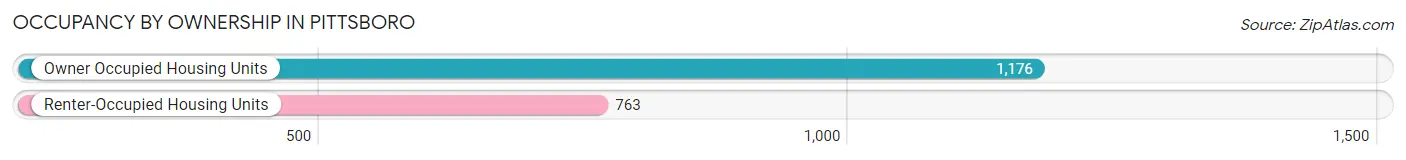
| Occupancy | # Housing Units | % Housing Units |
| Owner Occupied Housing Units | 1,176 | 60.7% |
| Renter-Occupied Housing Units | 763 | 39.4% |
| Total Occupied Housing Units | 1,939 | 100.0% |
Occupancy by Household Size in Pittsboro
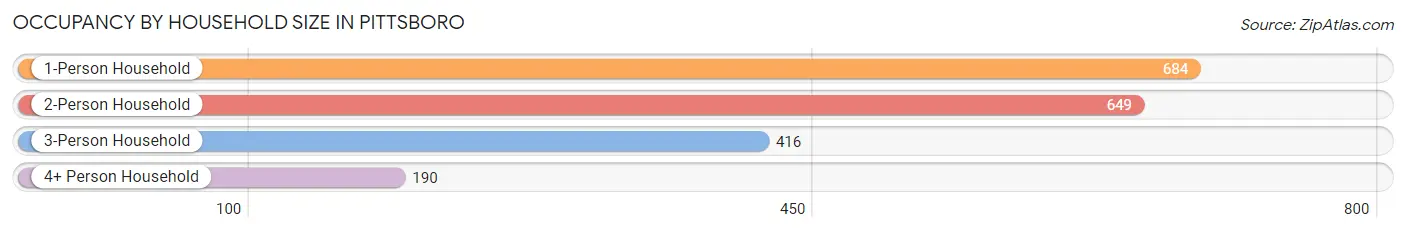
| Household Size | # Housing Units | % Housing Units |
| 1-Person Household | 684 | 35.3% |
| 2-Person Household | 649 | 33.5% |
| 3-Person Household | 416 | 21.4% |
| 4+ Person Household | 190 | 9.8% |
| Total Housing Units | 1,939 | 100.0% |
Occupancy by Ownership by Household Size in Pittsboro
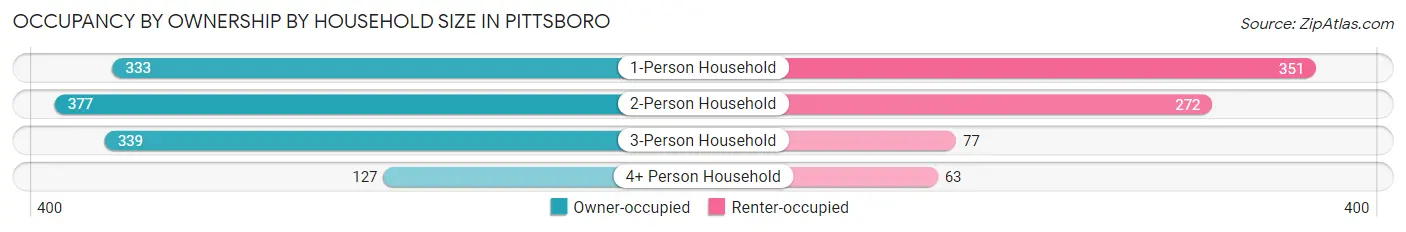
| Household Size | Owner-occupied | Renter-occupied |
| 1-Person Household | 333 (48.7%) | 351 (51.3%) |
| 2-Person Household | 377 (58.1%) | 272 (41.9%) |
| 3-Person Household | 339 (81.5%) | 77 (18.5%) |
| 4+ Person Household | 127 (66.8%) | 63 (33.2%) |
| Total Housing Units | 1,176 (60.7%) | 763 (39.4%) |
Occupancy by Educational Attainment in Pittsboro
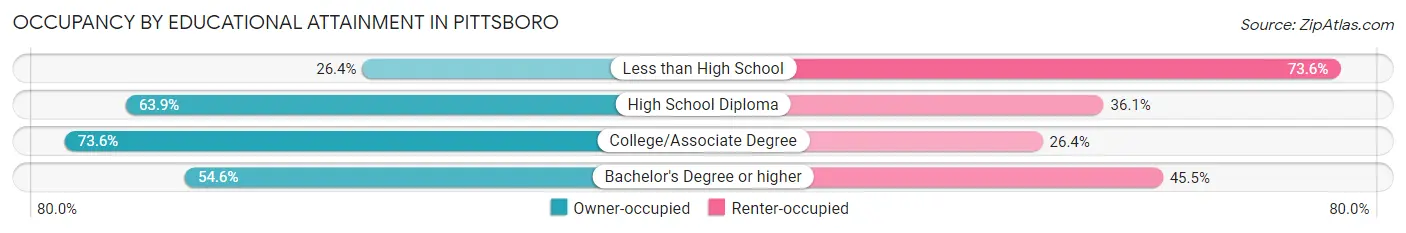
| Household Size | Owner-occupied | Renter-occupied |
| Less than High School | 23 (26.4%) | 64 (73.6%) |
| High School Diploma | 349 (63.9%) | 197 (36.1%) |
| College/Associate Degree | 354 (73.6%) | 127 (26.4%) |
| Bachelor's Degree or higher | 450 (54.5%) | 375 (45.5%) |
Occupancy by Age of Householder in Pittsboro
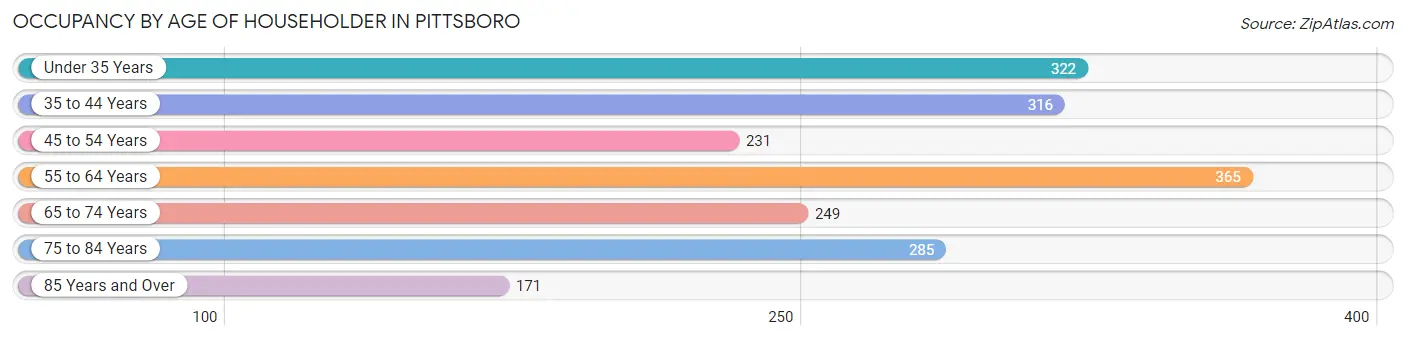
| Age Bracket | # Households | % Households |
| Under 35 Years | 322 | 16.6% |
| 35 to 44 Years | 316 | 16.3% |
| 45 to 54 Years | 231 | 11.9% |
| 55 to 64 Years | 365 | 18.8% |
| 65 to 74 Years | 249 | 12.8% |
| 75 to 84 Years | 285 | 14.7% |
| 85 Years and Over | 171 | 8.8% |
| Total | 1,939 | 100.0% |
Housing Finances in Pittsboro
Median Income by Occupancy in Pittsboro
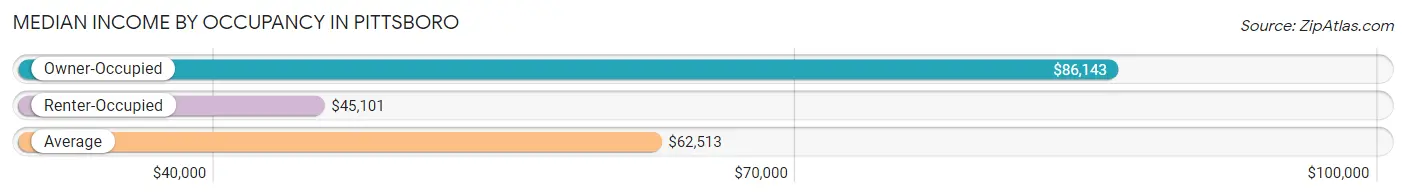
| Occupancy Type | # Households | Median Income |
| Owner-Occupied | 1,176 (60.7%) | $86,143 |
| Renter-Occupied | 763 (39.4%) | $45,101 |
| Average | 1,939 (100.0%) | $62,513 |
Occupancy by Householder Income Bracket in Pittsboro
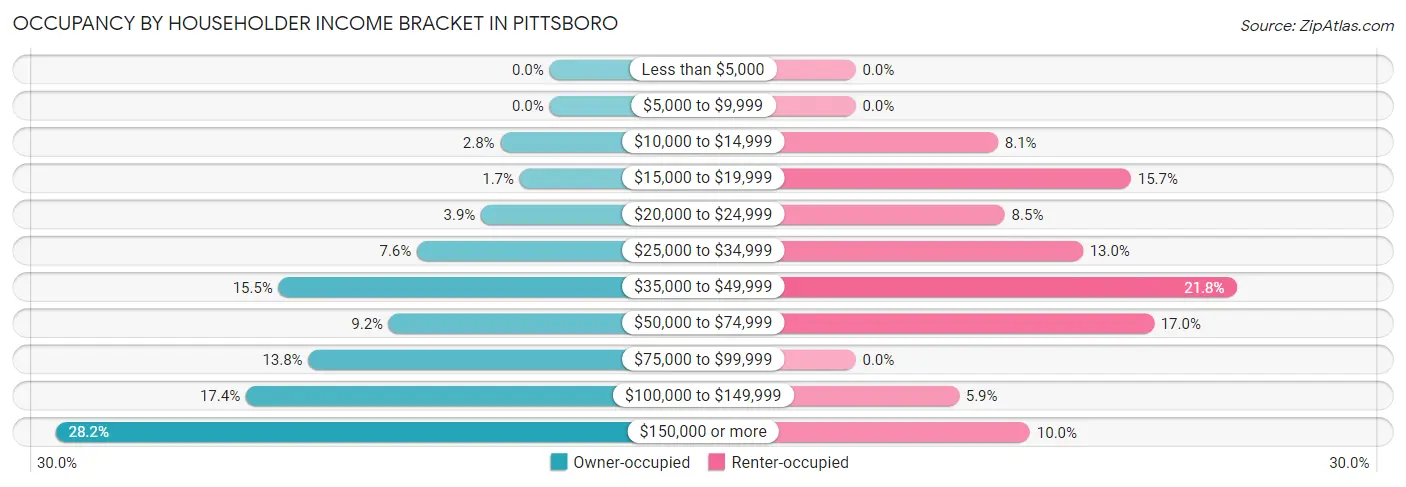
| Income Bracket | Owner-occupied | Renter-occupied |
| Less than $5,000 | 0 (0.0%) | 0 (0.0%) |
| $5,000 to $9,999 | 0 (0.0%) | 0 (0.0%) |
| $10,000 to $14,999 | 33 (2.8%) | 62 (8.1%) |
| $15,000 to $19,999 | 20 (1.7%) | 120 (15.7%) |
| $20,000 to $24,999 | 46 (3.9%) | 65 (8.5%) |
| $25,000 to $34,999 | 89 (7.6%) | 99 (13.0%) |
| $35,000 to $49,999 | 182 (15.5%) | 166 (21.8%) |
| $50,000 to $74,999 | 108 (9.2%) | 130 (17.0%) |
| $75,000 to $99,999 | 162 (13.8%) | 0 (0.0%) |
| $100,000 to $149,999 | 204 (17.3%) | 45 (5.9%) |
| $150,000 or more | 332 (28.2%) | 76 (10.0%) |
| Total | 1,176 (100.0%) | 763 (100.0%) |
Monthly Housing Cost Tiers in Pittsboro
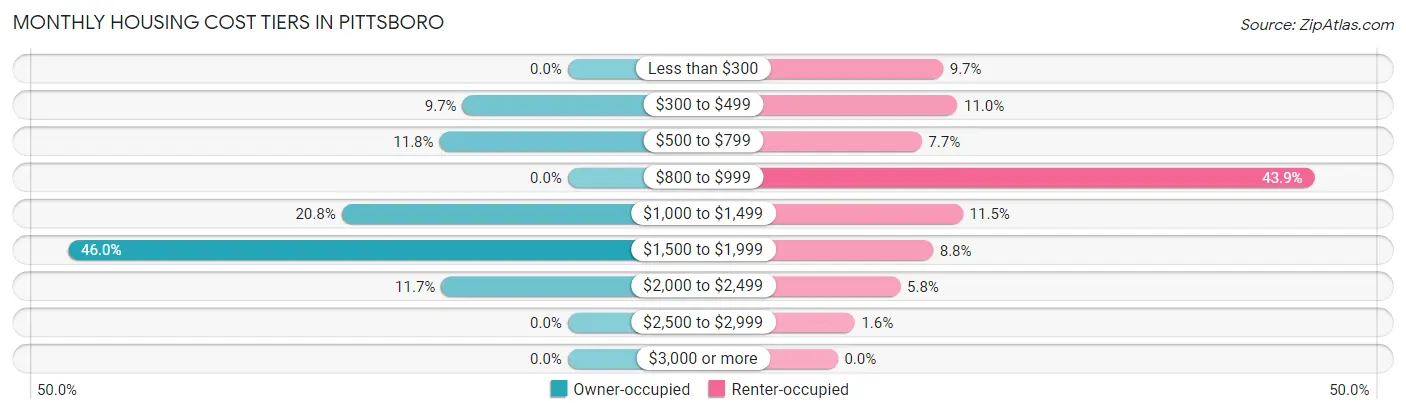
| Monthly Cost | Owner-occupied | Renter-occupied |
| Less than $300 | 0 (0.0%) | 74 (9.7%) |
| $300 to $499 | 114 (9.7%) | 84 (11.0%) |
| $500 to $799 | 139 (11.8%) | 59 (7.7%) |
| $800 to $999 | 0 (0.0%) | 335 (43.9%) |
| $1,000 to $1,499 | 245 (20.8%) | 88 (11.5%) |
| $1,500 to $1,999 | 541 (46.0%) | 67 (8.8%) |
| $2,000 to $2,499 | 137 (11.7%) | 44 (5.8%) |
| $2,500 to $2,999 | 0 (0.0%) | 12 (1.6%) |
| $3,000 or more | 0 (0.0%) | 0 (0.0%) |
| Total | 1,176 (100.0%) | 763 (100.0%) |
Physical Housing Characteristics in Pittsboro
Housing Structures in Pittsboro
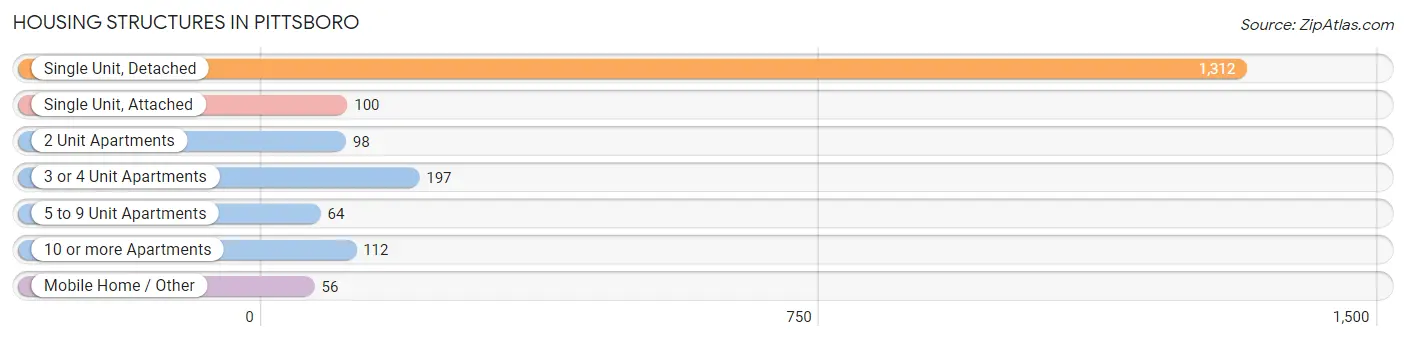
| Structure Type | # Housing Units | % Housing Units |
| Single Unit, Detached | 1,312 | 67.7% |
| Single Unit, Attached | 100 | 5.2% |
| 2 Unit Apartments | 98 | 5.1% |
| 3 or 4 Unit Apartments | 197 | 10.2% |
| 5 to 9 Unit Apartments | 64 | 3.3% |
| 10 or more Apartments | 112 | 5.8% |
| Mobile Home / Other | 56 | 2.9% |
| Total | 1,939 | 100.0% |
Housing Structures by Occupancy in Pittsboro
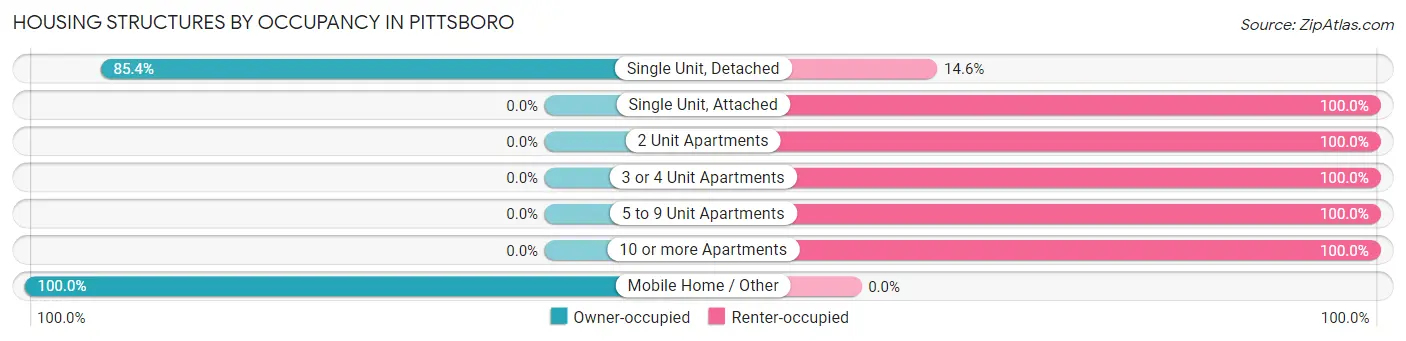
| Structure Type | Owner-occupied | Renter-occupied |
| Single Unit, Detached | 1,120 (85.4%) | 192 (14.6%) |
| Single Unit, Attached | 0 (0.0%) | 100 (100.0%) |
| 2 Unit Apartments | 0 (0.0%) | 98 (100.0%) |
| 3 or 4 Unit Apartments | 0 (0.0%) | 197 (100.0%) |
| 5 to 9 Unit Apartments | 0 (0.0%) | 64 (100.0%) |
| 10 or more Apartments | 0 (0.0%) | 112 (100.0%) |
| Mobile Home / Other | 56 (100.0%) | 0 (0.0%) |
| Total | 1,176 (60.7%) | 763 (39.4%) |
Housing Structures by Number of Rooms in Pittsboro
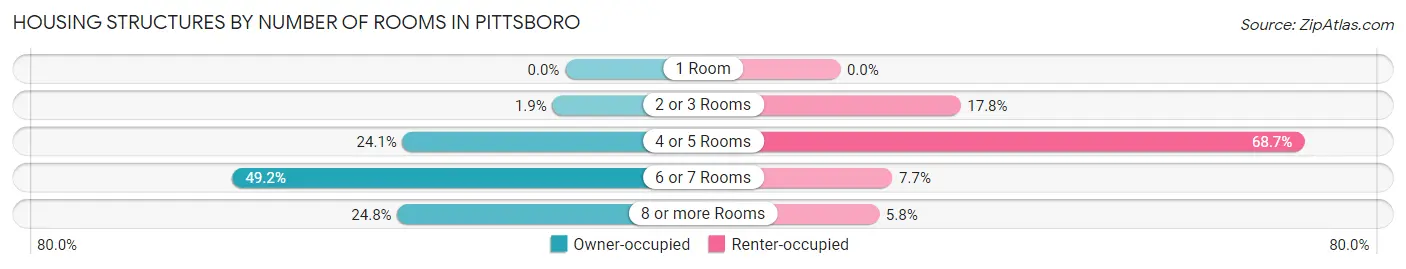
| Number of Rooms | Owner-occupied | Renter-occupied |
| 1 Room | 0 (0.0%) | 0 (0.0%) |
| 2 or 3 Rooms | 22 (1.9%) | 136 (17.8%) |
| 4 or 5 Rooms | 283 (24.1%) | 524 (68.7%) |
| 6 or 7 Rooms | 579 (49.2%) | 59 (7.7%) |
| 8 or more Rooms | 292 (24.8%) | 44 (5.8%) |
| Total | 1,176 (100.0%) | 763 (100.0%) |
Housing Structure by Heating Type in Pittsboro
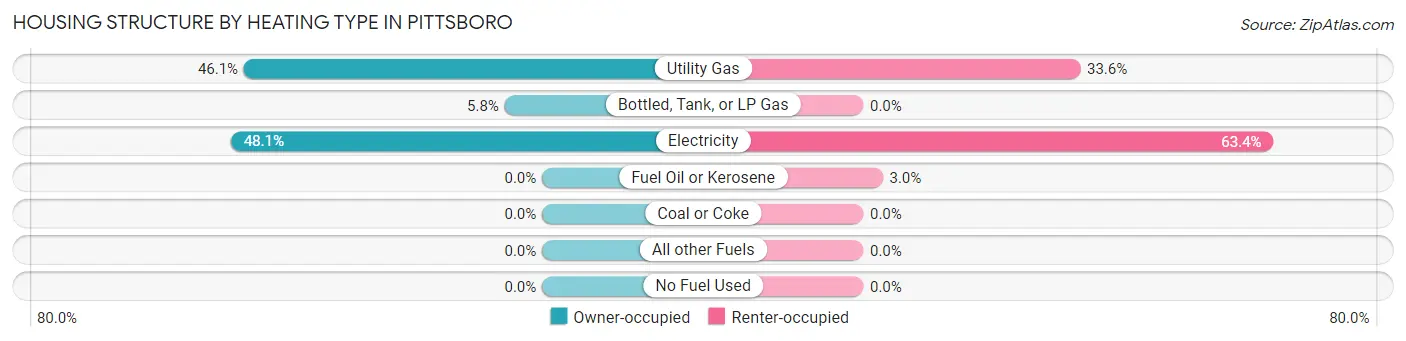
| Heating Type | Owner-occupied | Renter-occupied |
| Utility Gas | 542 (46.1%) | 256 (33.6%) |
| Bottled, Tank, or LP Gas | 68 (5.8%) | 0 (0.0%) |
| Electricity | 566 (48.1%) | 484 (63.4%) |
| Fuel Oil or Kerosene | 0 (0.0%) | 23 (3.0%) |
| Coal or Coke | 0 (0.0%) | 0 (0.0%) |
| All other Fuels | 0 (0.0%) | 0 (0.0%) |
| No Fuel Used | 0 (0.0%) | 0 (0.0%) |
| Total | 1,176 (100.0%) | 763 (100.0%) |
Household Vehicle Usage in Pittsboro
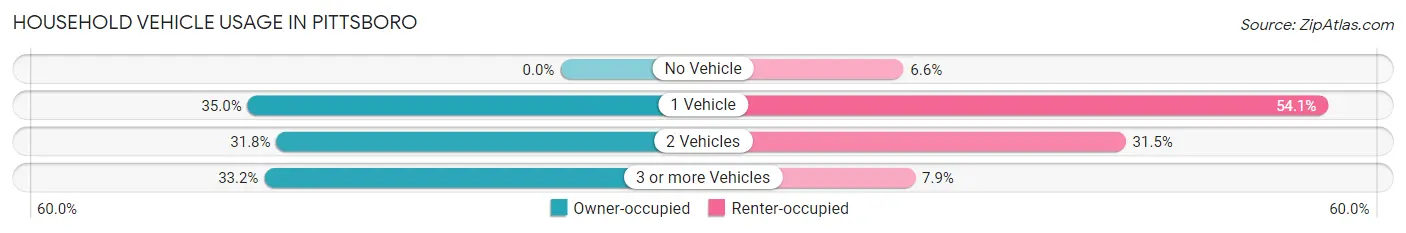
| Vehicles per Household | Owner-occupied | Renter-occupied |
| No Vehicle | 0 (0.0%) | 50 (6.6%) |
| 1 Vehicle | 412 (35.0%) | 413 (54.1%) |
| 2 Vehicles | 374 (31.8%) | 240 (31.5%) |
| 3 or more Vehicles | 390 (33.2%) | 60 (7.9%) |
| Total | 1,176 (100.0%) | 763 (100.0%) |
Real Estate & Mortgages in Pittsboro
Real Estate and Mortgage Overview in Pittsboro
| Characteristic | Without Mortgage | With Mortgage |
| Housing Units | 251 | 925 |
| Median Property Value | $87,900 | $341,800 |
| Median Household Income | $32,880 | $329 |
| Monthly Housing Costs | $516 | $0 |
| Real Estate Taxes | $1,394 | $0 |
Property Value by Mortgage Status in Pittsboro
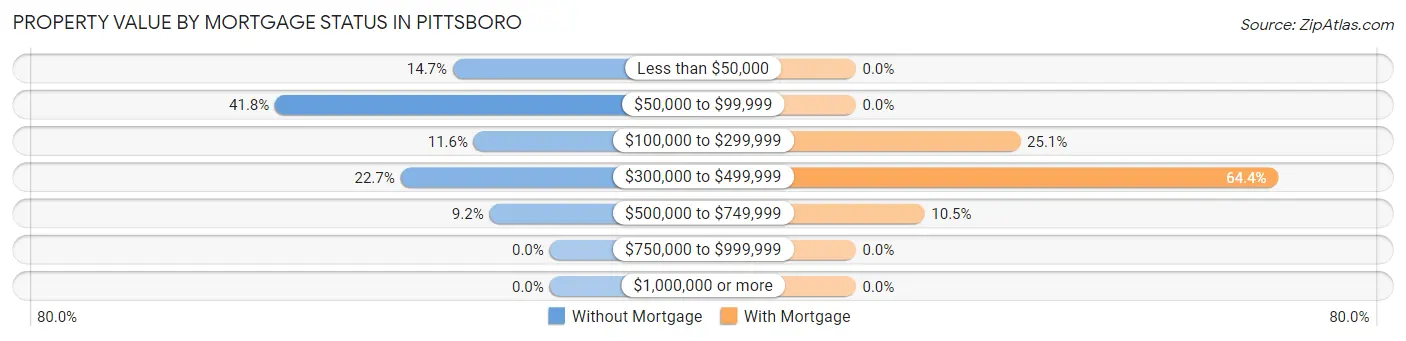
| Property Value | Without Mortgage | With Mortgage |
| Less than $50,000 | 37 (14.7%) | 0 (0.0%) |
| $50,000 to $99,999 | 105 (41.8%) | 0 (0.0%) |
| $100,000 to $299,999 | 29 (11.6%) | 232 (25.1%) |
| $300,000 to $499,999 | 57 (22.7%) | 596 (64.4%) |
| $500,000 to $749,999 | 23 (9.2%) | 97 (10.5%) |
| $750,000 to $999,999 | 0 (0.0%) | 0 (0.0%) |
| $1,000,000 or more | 0 (0.0%) | 0 (0.0%) |
| Total | 251 (100.0%) | 925 (100.0%) |
Household Income by Mortgage Status in Pittsboro
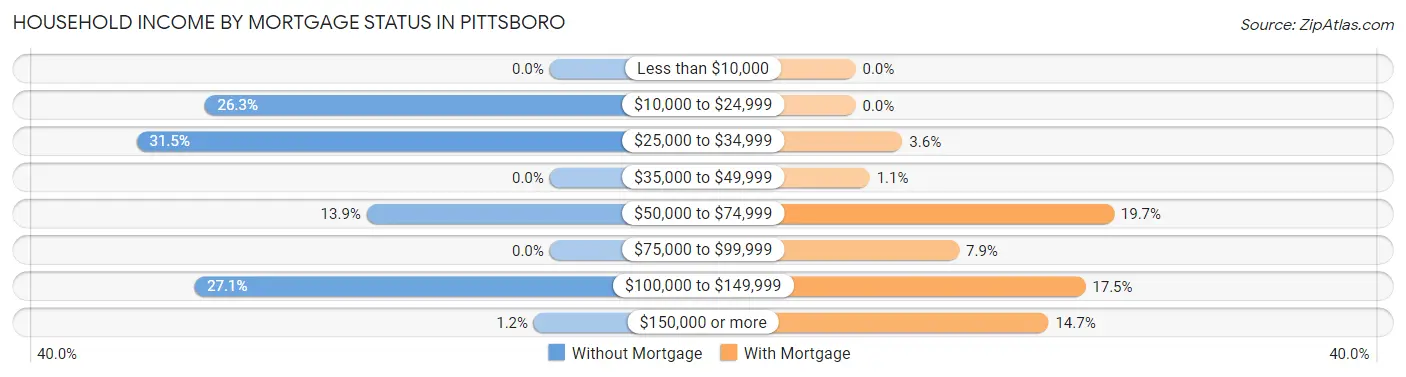
| Household Income | Without Mortgage | With Mortgage |
| Less than $10,000 | 0 (0.0%) | 0 (0.0%) |
| $10,000 to $24,999 | 66 (26.3%) | 0 (0.0%) |
| $25,000 to $34,999 | 79 (31.5%) | 33 (3.6%) |
| $35,000 to $49,999 | 0 (0.0%) | 10 (1.1%) |
| $50,000 to $74,999 | 35 (13.9%) | 182 (19.7%) |
| $75,000 to $99,999 | 0 (0.0%) | 73 (7.9%) |
| $100,000 to $149,999 | 68 (27.1%) | 162 (17.5%) |
| $150,000 or more | 3 (1.2%) | 136 (14.7%) |
| Total | 251 (100.0%) | 925 (100.0%) |
Property Value to Household Income Ratio in Pittsboro
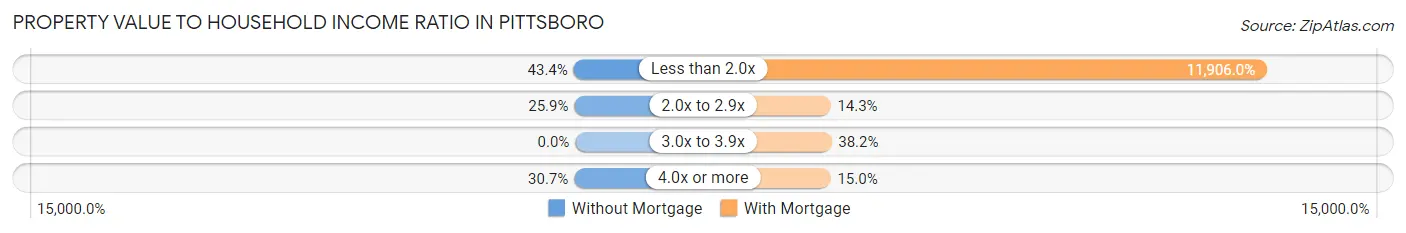
| Value-to-Income Ratio | Without Mortgage | With Mortgage |
| Less than 2.0x | 109 (43.4%) | 110,130 (11,905.9%) |
| 2.0x to 2.9x | 65 (25.9%) | 132 (14.3%) |
| 3.0x to 3.9x | 0 (0.0%) | 353 (38.2%) |
| 4.0x or more | 77 (30.7%) | 139 (15.0%) |
| Total | 251 (100.0%) | 925 (100.0%) |
Real Estate Taxes by Mortgage Status in Pittsboro
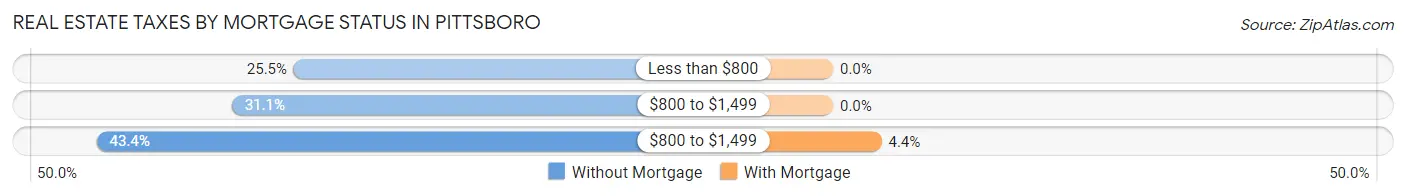
| Property Taxes | Without Mortgage | With Mortgage |
| Less than $800 | 64 (25.5%) | 0 (0.0%) |
| $800 to $1,499 | 78 (31.1%) | 0 (0.0%) |
| $800 to $1,499 | 109 (43.4%) | 41 (4.4%) |
| Total | 251 (100.0%) | 925 (100.0%) |
Health & Disability in Pittsboro
Health Insurance Coverage by Age in Pittsboro
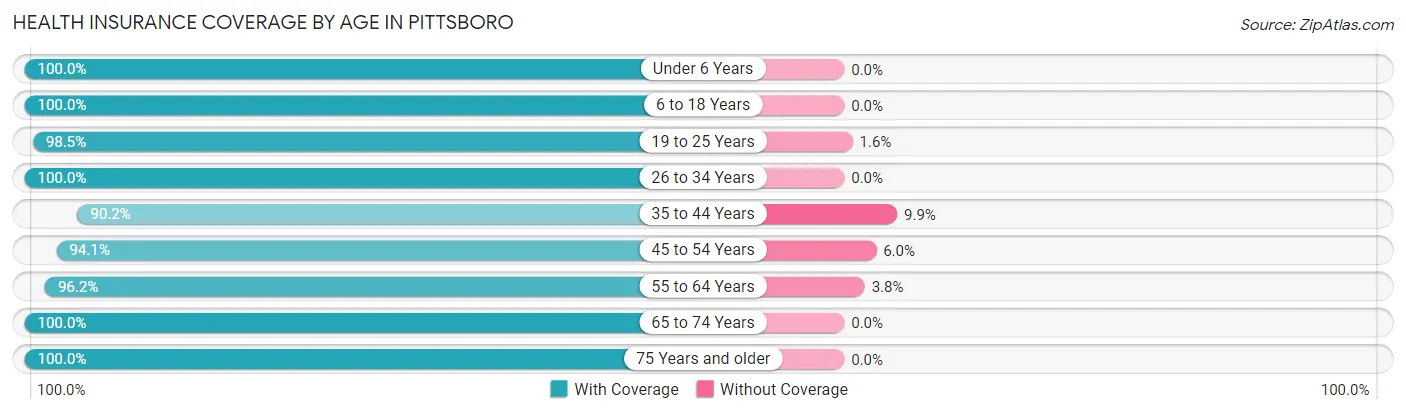
| Age Bracket | With Coverage | Without Coverage |
| Under 6 Years | 188 (100.0%) | 0 (0.0%) |
| 6 to 18 Years | 843 (100.0%) | 0 (0.0%) |
| 19 to 25 Years | 571 (98.5%) | 9 (1.5%) |
| 26 to 34 Years | 336 (100.0%) | 0 (0.0%) |
| 35 to 44 Years | 540 (90.1%) | 59 (9.9%) |
| 45 to 54 Years | 427 (94.1%) | 27 (5.9%) |
| 55 to 64 Years | 580 (96.2%) | 23 (3.8%) |
| 65 to 74 Years | 334 (100.0%) | 0 (0.0%) |
| 75 Years and older | 479 (100.0%) | 0 (0.0%) |
| Total | 4,298 (97.3%) | 118 (2.7%) |
Health Insurance Coverage by Citizenship Status in Pittsboro
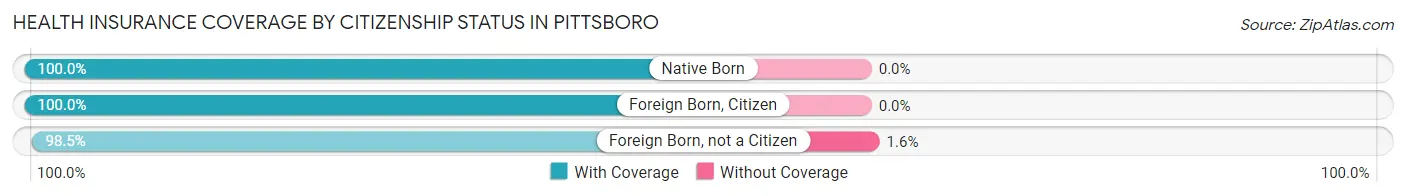
| Citizenship Status | With Coverage | Without Coverage |
| Native Born | 188 (100.0%) | 0 (0.0%) |
| Foreign Born, Citizen | 843 (100.0%) | 0 (0.0%) |
| Foreign Born, not a Citizen | 571 (98.5%) | 9 (1.5%) |
Health Insurance Coverage by Household Income in Pittsboro
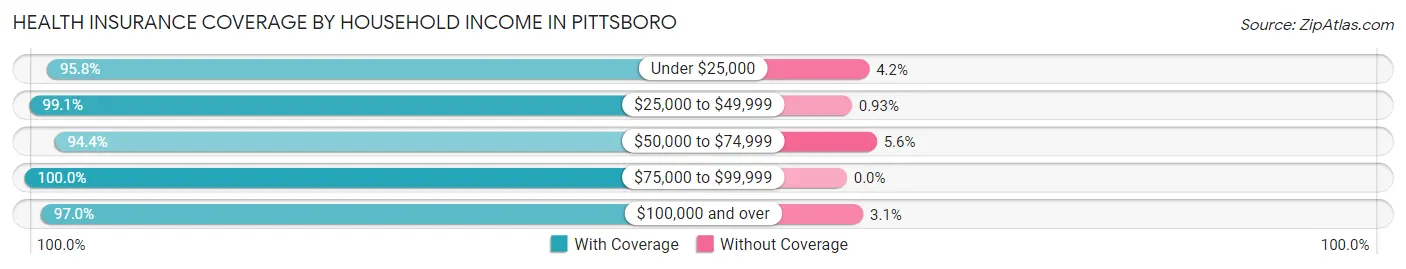
| Household Income | With Coverage | Without Coverage |
| Under $25,000 | 525 (95.8%) | 23 (4.2%) |
| $25,000 to $49,999 | 954 (99.1%) | 9 (0.9%) |
| $50,000 to $74,999 | 388 (94.4%) | 23 (5.6%) |
| $75,000 to $99,999 | 427 (100.0%) | 0 (0.0%) |
| $100,000 and over | 2,004 (97.0%) | 63 (3.0%) |
Public vs Private Health Insurance Coverage by Age in Pittsboro
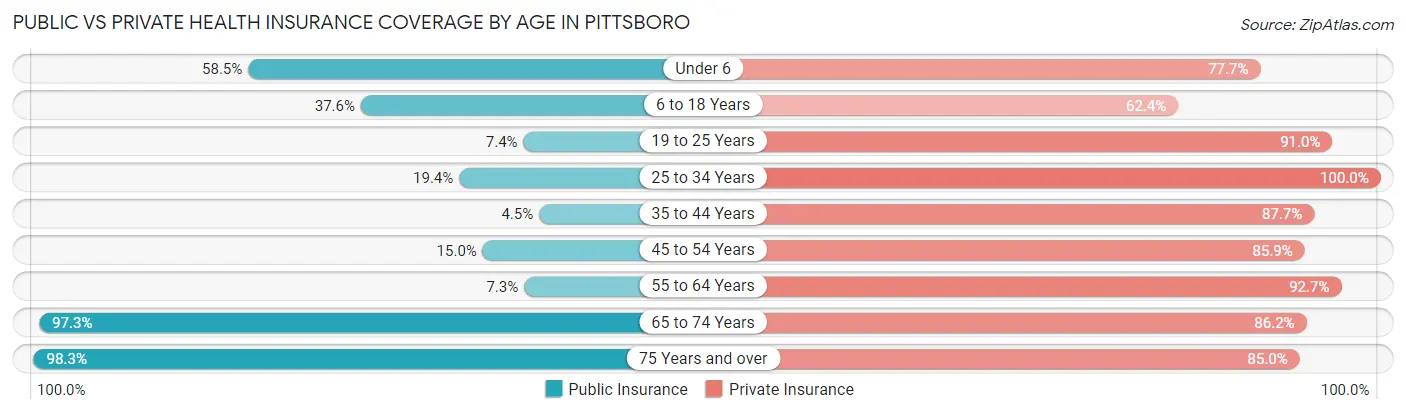
| Age Bracket | Public Insurance | Private Insurance |
| Under 6 | 110 (58.5%) | 146 (77.7%) |
| 6 to 18 Years | 317 (37.6%) | 526 (62.4%) |
| 19 to 25 Years | 43 (7.4%) | 528 (91.0%) |
| 25 to 34 Years | 65 (19.4%) | 336 (100.0%) |
| 35 to 44 Years | 27 (4.5%) | 525 (87.6%) |
| 45 to 54 Years | 68 (15.0%) | 390 (85.9%) |
| 55 to 64 Years | 44 (7.3%) | 559 (92.7%) |
| 65 to 74 Years | 325 (97.3%) | 288 (86.2%) |
| 75 Years and over | 471 (98.3%) | 407 (85.0%) |
| Total | 1,470 (33.3%) | 3,705 (83.9%) |
Disability Status by Sex by Age in Pittsboro
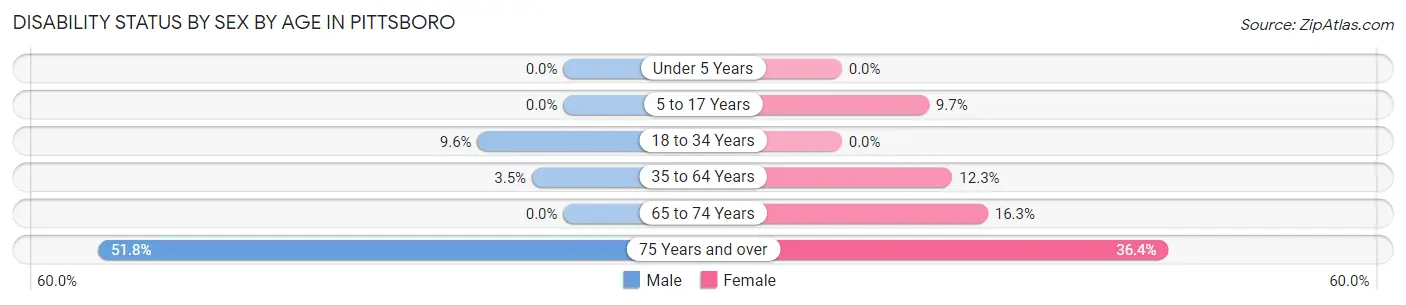
| Age Bracket | Male | Female |
| Under 5 Years | 0 (0.0%) | 0 (0.0%) |
| 5 to 17 Years | 0 (0.0%) | 59 (9.7%) |
| 18 to 34 Years | 33 (9.6%) | 0 (0.0%) |
| 35 to 64 Years | 27 (3.5%) | 109 (12.3%) |
| 65 to 74 Years | 0 (0.0%) | 33 (16.3%) |
| 75 Years and over | 43 (51.8%) | 144 (36.4%) |
Disability Class by Sex by Age in Pittsboro
Disability Class: Hearing Difficulty
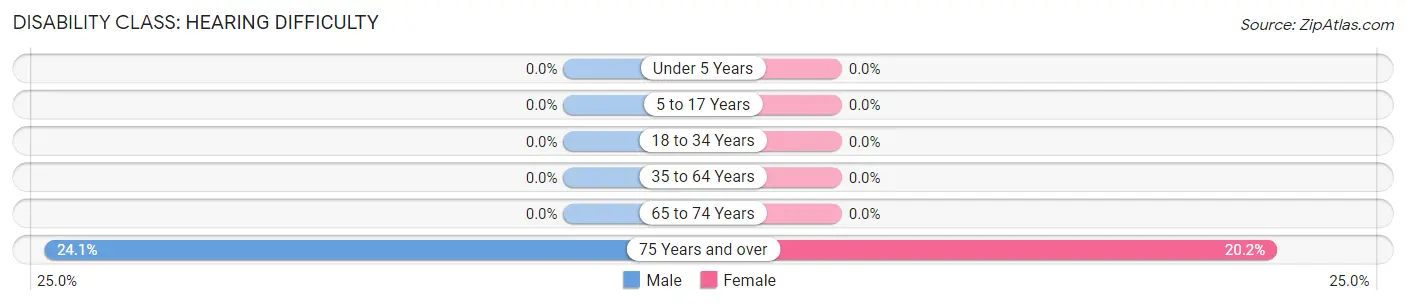
| Age Bracket | Male | Female |
| Under 5 Years | 0 (0.0%) | 0 (0.0%) |
| 5 to 17 Years | 0 (0.0%) | 0 (0.0%) |
| 18 to 34 Years | 0 (0.0%) | 0 (0.0%) |
| 35 to 64 Years | 0 (0.0%) | 0 (0.0%) |
| 65 to 74 Years | 0 (0.0%) | 0 (0.0%) |
| 75 Years and over | 20 (24.1%) | 80 (20.2%) |
Disability Class: Vision Difficulty
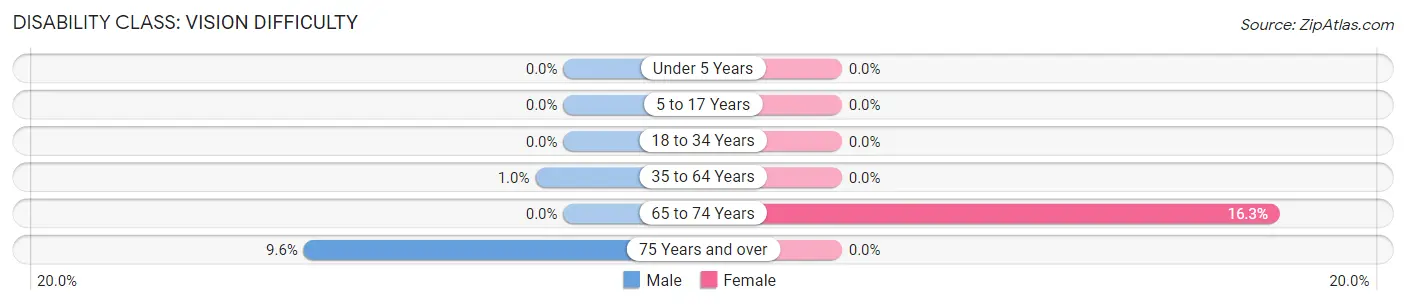
| Age Bracket | Male | Female |
| Under 5 Years | 0 (0.0%) | 0 (0.0%) |
| 5 to 17 Years | 0 (0.0%) | 0 (0.0%) |
| 18 to 34 Years | 0 (0.0%) | 0 (0.0%) |
| 35 to 64 Years | 8 (1.0%) | 0 (0.0%) |
| 65 to 74 Years | 0 (0.0%) | 33 (16.3%) |
| 75 Years and over | 8 (9.6%) | 0 (0.0%) |
Disability Class: Cognitive Difficulty
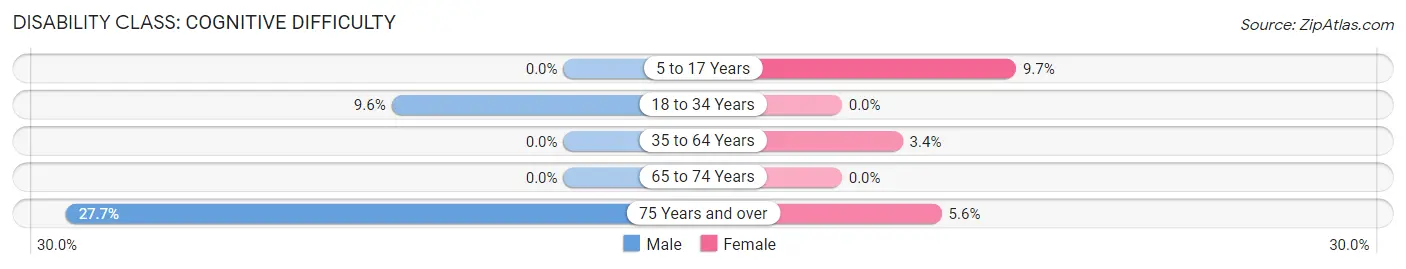
| Age Bracket | Male | Female |
| 5 to 17 Years | 0 (0.0%) | 59 (9.7%) |
| 18 to 34 Years | 33 (9.6%) | 0 (0.0%) |
| 35 to 64 Years | 0 (0.0%) | 30 (3.4%) |
| 65 to 74 Years | 0 (0.0%) | 0 (0.0%) |
| 75 Years and over | 23 (27.7%) | 22 (5.6%) |
Disability Class: Ambulatory Difficulty
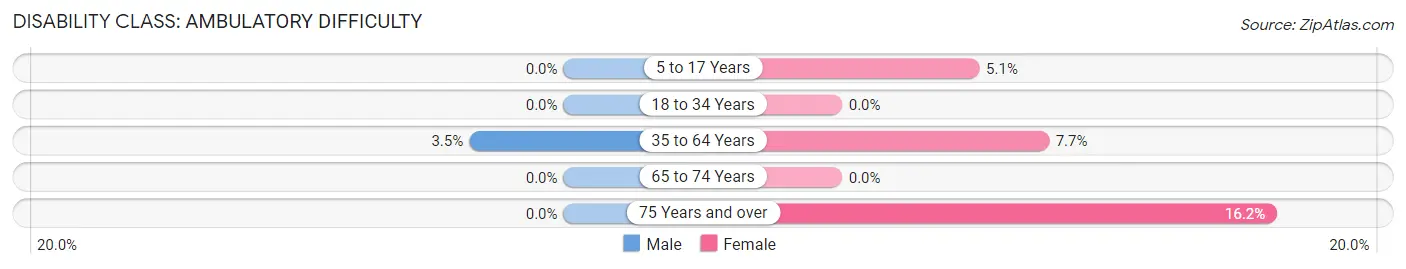
| Age Bracket | Male | Female |
| 5 to 17 Years | 0 (0.0%) | 31 (5.1%) |
| 18 to 34 Years | 0 (0.0%) | 0 (0.0%) |
| 35 to 64 Years | 27 (3.5%) | 68 (7.7%) |
| 65 to 74 Years | 0 (0.0%) | 0 (0.0%) |
| 75 Years and over | 0 (0.0%) | 64 (16.2%) |
Disability Class: Self-Care Difficulty
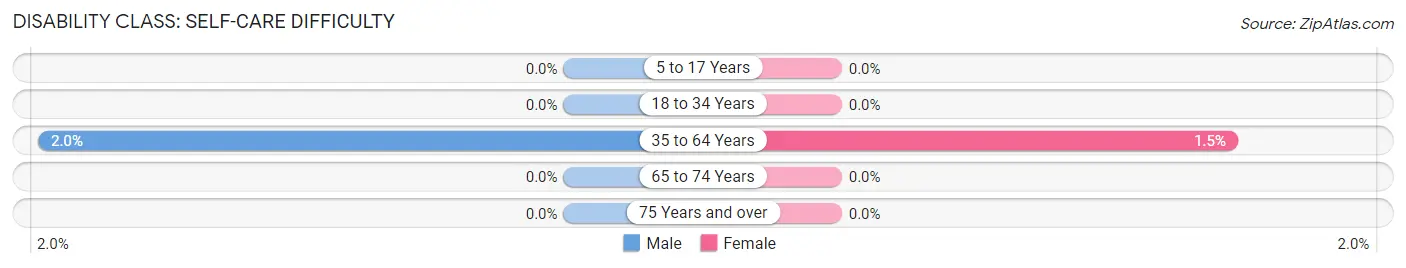
| Age Bracket | Male | Female |
| 5 to 17 Years | 0 (0.0%) | 0 (0.0%) |
| 18 to 34 Years | 0 (0.0%) | 0 (0.0%) |
| 35 to 64 Years | 15 (1.9%) | 13 (1.5%) |
| 65 to 74 Years | 0 (0.0%) | 0 (0.0%) |
| 75 Years and over | 0 (0.0%) | 0 (0.0%) |
Technology Access in Pittsboro
Computing Device Access in Pittsboro
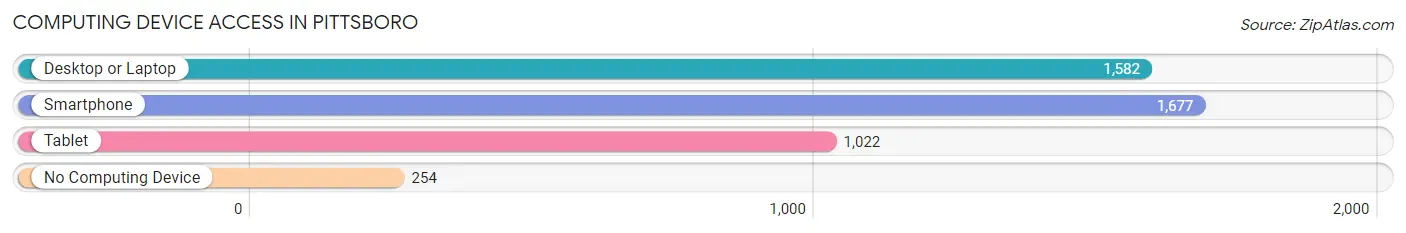
| Device Type | # Households | % Households |
| Desktop or Laptop | 1,582 | 81.6% |
| Smartphone | 1,677 | 86.5% |
| Tablet | 1,022 | 52.7% |
| No Computing Device | 254 | 13.1% |
| Total | 1,939 | 100.0% |
Internet Access in Pittsboro
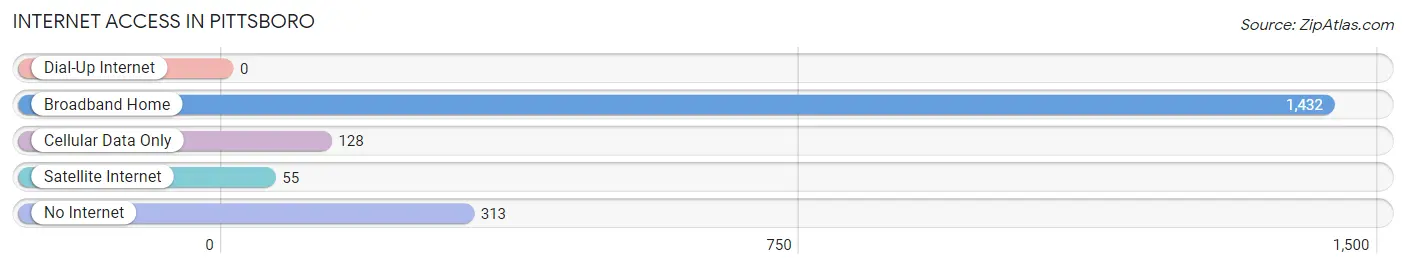
| Internet Type | # Households | % Households |
| Dial-Up Internet | 0 | 0.0% |
| Broadband Home | 1,432 | 73.9% |
| Cellular Data Only | 128 | 6.6% |
| Satellite Internet | 55 | 2.8% |
| No Internet | 313 | 16.1% |
| Total | 1,939 | 100.0% |
Pittsboro Summary
Pittsboro, North Carolina is a small town located in Chatham County, North Carolina. It is situated in the heart of the Triangle region of North Carolina, which includes the cities of Raleigh, Durham, and Chapel Hill. The town is located approximately 30 miles southwest of Raleigh and is part of the Raleigh-Durham-Chapel Hill Metropolitan Statistical Area. The population of Pittsboro was estimated to be 2,717 in 2019.
History
Pittsboro was founded in 1785 and was named after William Pitt, the Earl of Chatham. The town was originally a trading post and was the county seat of Chatham County. In the early 19th century, Pittsboro was a major center for the production of cotton and tobacco. The town was also home to several mills, including a gristmill, a sawmill, and a cotton gin.
In the late 19th century, Pittsboro experienced a period of growth and development. The town was incorporated in 1868 and the first public school was established in 1871. The town also saw the construction of several churches, including the Pittsboro Presbyterian Church, which was built in 1872.
Geography
Pittsboro is located in the Piedmont region of North Carolina. The town is situated on the banks of the Haw River and is surrounded by rolling hills and forests. The town is located approximately 30 miles southwest of Raleigh and is part of the Raleigh-Durham-Chapel Hill Metropolitan Statistical Area.
The climate in Pittsboro is mild and humid. The average temperature in the summer is around 80 degrees Fahrenheit and the average temperature in the winter is around 40 degrees Fahrenheit. The town receives an average of 48 inches of rain per year.
Economy
The economy of Pittsboro is largely based on agriculture and manufacturing. The town is home to several farms, including dairy farms, vegetable farms, and livestock farms. The town is also home to several manufacturing companies, including a furniture factory, a textile mill, and a paper mill.
The town is also home to several small businesses, including restaurants, shops, and galleries. The town is also home to several wineries and breweries, which attract tourists from all over the region.
Demographics
The population of Pittsboro was estimated to be 2,717 in 2019. The town has a population that is predominantly white (90.2%) and African American (7.2%). The median household income in Pittsboro is $50,945 and the median home value is $213,400. The town has a poverty rate of 11.2%.
The town is served by the Chatham County School System, which includes four elementary schools, one middle school, and one high school. The town is also home to several colleges and universities, including the University of North Carolina at Chapel Hill and North Carolina State University.
Conclusion
Pittsboro, North Carolina is a small town located in Chatham County, North Carolina. It is situated in the heart of the Triangle region of North Carolina, which includes the cities of Raleigh, Durham, and Chapel Hill. The town is located approximately 30 miles southwest of Raleigh and is part of the Raleigh-Durham-Chapel Hill Metropolitan Statistical Area. The population of Pittsboro was estimated to be 2,717 in 2019. The town has a population that is predominantly white (90.2%) and African American (7.2%). The economy of Pittsboro is largely based on agriculture and manufacturing. The town is also home to several small businesses, including restaurants, shops, and galleries. The town is served by the Chatham County School System, which includes four elementary schools, one middle school, and one high school. Pittsboro is a small town with a rich history and a vibrant economy.
Common Questions
What is Per Capita Income in Pittsboro?
Per Capita income in Pittsboro is $38,256.
What is the Median Family Income in Pittsboro?
Median Family Income in Pittsboro is $110,721.
What is the Median Household income in Pittsboro?
Median Household Income in Pittsboro is $62,513.
What is Income or Wage Gap in Pittsboro?
Income or Wage Gap in Pittsboro is 11.3%.
Women in Pittsboro earn 88.7 cents for every dollar earned by a man.
What is Inequality or Gini Index in Pittsboro?
Inequality or Gini Index in Pittsboro is 0.45.
What is the Total Population of Pittsboro?
Total Population of Pittsboro is 4,555.
What is the Total Male Population of Pittsboro?
Total Male Population of Pittsboro is 1,664.
What is the Total Female Population of Pittsboro?
Total Female Population of Pittsboro is 2,891.
What is the Ratio of Males per 100 Females in Pittsboro?
There are 57.56 Males per 100 Females in Pittsboro.
What is the Ratio of Females per 100 Males in Pittsboro?
There are 173.74 Females per 100 Males in Pittsboro.
What is the Median Population Age in Pittsboro?
Median Population Age in Pittsboro is 40.0 Years.
What is the Average Family Size in Pittsboro
Average Family Size in Pittsboro is 3.0 People.
What is the Average Household Size in Pittsboro
Average Household Size in Pittsboro is 2.3 People.
How Large is the Labor Force in Pittsboro?
There are 2,510 People in the Labor Forcein in Pittsboro.
What is the Percentage of People in the Labor Force in Pittsboro?
63.6% of People are in the Labor Force in Pittsboro.
What is the Unemployment Rate in Pittsboro?
Unemployment Rate in Pittsboro is 3.1%.