Cities with the Highest Percentage of Population Taking Public Transit to Work in Michigan
RELATED REPORTS & OPTIONS
Public Transit
Michigan
Compare Cities
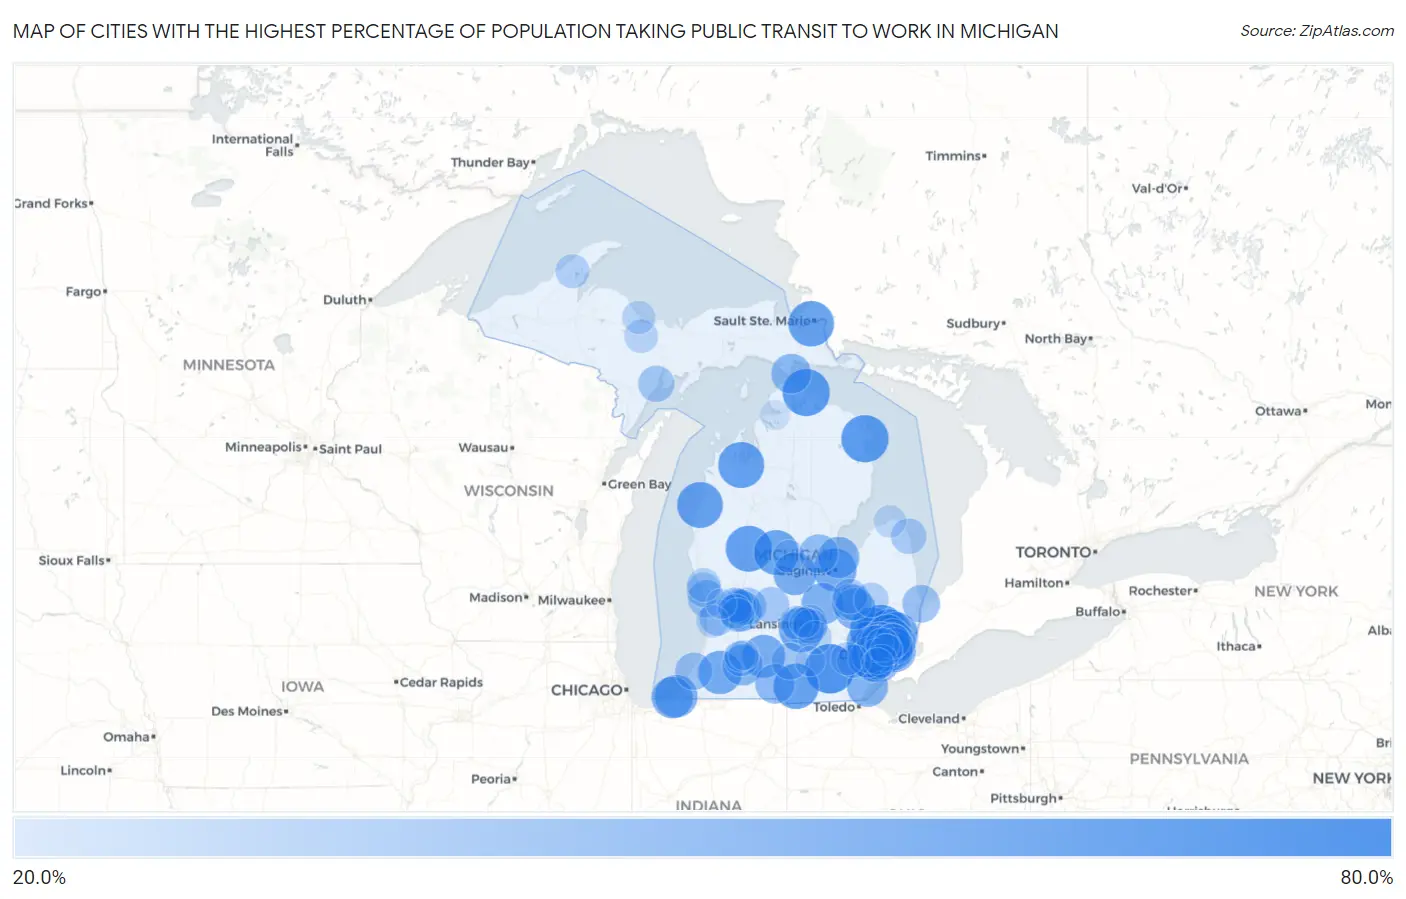
Map of Cities with the Highest Percentage of Population Taking Public Transit to Work in Michigan
0.0%
80.0%
Cities with the Highest Percentage of Population Taking Public Transit to Work in Michigan
| City | % Public Transit | vs State | vs National | |
| 1. | Hazel Park | 64.3% | 34.1%(+30.2)#1 | 38.5%(+25.8)#66 |
| 2. | Manchester | 63.9% | 34.1%(+29.8)#2 | 38.5%(+25.4)#74 |
| 3. | Highland Park | 62.3% | 34.1%(+28.2)#3 | 38.5%(+23.8)#96 |
| 4. | Rochester Hills | 60.1% | 34.1%(+26.0)#4 | 38.5%(+21.6)#167 |
| 5. | Alpena | 59.1% | 34.1%(+25.0)#5 | 38.5%(+20.6)#199 |
| 6. | Cheboygan | 59.0% | 34.1%(+24.9)#6 | 38.5%(+20.5)#209 |
| 7. | Troy | 57.9% | 34.1%(+23.8)#7 | 38.5%(+19.4)#261 |
| 8. | Big Rapids | 56.3% | 34.1%(+22.2)#8 | 38.5%(+17.8)#357 |
| 9. | Traverse City | 56.2% | 34.1%(+22.1)#9 | 38.5%(+17.7)#368 |
| 10. | Manistee | 55.7% | 34.1%(+21.6)#10 | 38.5%(+17.2)#399 |
| 11. | Sault Ste Marie | 55.3% | 34.1%(+21.2)#11 | 38.5%(+16.8)#422 |
| 12. | Hillsdale | 54.7% | 34.1%(+20.6)#12 | 38.5%(+16.2)#466 |
| 13. | Pontiac | 54.4% | 34.1%(+20.3)#13 | 38.5%(+15.9)#482 |
| 14. | Dearborn Heights | 53.5% | 34.1%(+19.4)#14 | 38.5%(+15.0)#554 |
| 15. | Lake Isabella | 53.5% | 34.1%(+19.4)#15 | 38.5%(+15.0)#560 |
| 16. | Holt | 52.6% | 34.1%(+18.5)#16 | 38.5%(+14.1)#634 |
| 17. | Utica | 51.6% | 34.1%(+17.5)#17 | 38.5%(+13.1)#709 |
| 18. | Mount Clemens | 50.4% | 34.1%(+16.3)#18 | 38.5%(+11.9)#835 |
| 19. | Decatur | 50.3% | 34.1%(+16.2)#19 | 38.5%(+11.8)#854 |
| 20. | Inkster | 49.6% | 34.1%(+15.5)#20 | 38.5%(+11.1)#930 |
| 21. | Saginaw | 49.5% | 34.1%(+15.4)#21 | 38.5%(+11.0)#949 |
| 22. | Battle Creek | 49.3% | 34.1%(+15.2)#22 | 38.5%(+10.8)#987 |
| 23. | Alma | 49.3% | 34.1%(+15.2)#23 | 38.5%(+10.8)#997 |
| 24. | New Buffalo | 48.4% | 34.1%(+14.3)#24 | 38.5%(+9.90)#1,127 |
| 25. | Westland | 48.2% | 34.1%(+14.1)#25 | 38.5%(+9.70)#1,150 |
| 26. | Livonia | 47.5% | 34.1%(+13.4)#26 | 38.5%(+9.00)#1,244 |
| 27. | Farmington Hills | 46.7% | 34.1%(+12.6)#27 | 38.5%(+8.20)#1,381 |
| 28. | Owosso | 46.7% | 34.1%(+12.6)#28 | 38.5%(+8.20)#1,384 |
| 29. | Lincoln Park | 46.5% | 34.1%(+12.4)#29 | 38.5%(+8.00)#1,411 |
| 30. | Harper Woods | 46.4% | 34.1%(+12.3)#30 | 38.5%(+7.90)#1,441 |
| 31. | Grosse Pointe | 46.3% | 34.1%(+12.2)#31 | 38.5%(+7.80)#1,458 |
| 32. | Michiana | 46.0% | 34.1%(+11.9)#32 | 38.5%(+7.50)#1,505 |
| 33. | St Clair Shores | 45.4% | 34.1%(+11.3)#33 | 38.5%(+6.90)#1,588 |
| 34. | Bay City | 45.4% | 34.1%(+11.3)#34 | 38.5%(+6.90)#1,591 |
| 35. | Monroe | 45.2% | 34.1%(+11.1)#35 | 38.5%(+6.70)#1,634 |
| 36. | Sterling Heights | 45.0% | 34.1%(+10.9)#36 | 38.5%(+6.50)#1,662 |
| 37. | Grand Blanc | 44.9% | 34.1%(+10.8)#37 | 38.5%(+6.40)#1,686 |
| 38. | Portage | 44.4% | 34.1%(+10.3)#38 | 38.5%(+5.90)#1,759 |
| 39. | Warren | 44.0% | 34.1%(+9.90)#39 | 38.5%(+5.50)#1,832 |
| 40. | Kentwood | 43.7% | 34.1%(+9.60)#40 | 38.5%(+5.20)#1,874 |
| 41. | St Ignace | 42.4% | 34.1%(+8.30)#41 | 38.5%(+3.90)#2,136 |
| 42. | Fraser | 41.7% | 34.1%(+7.60)#42 | 38.5%(+3.20)#2,232 |
| 43. | Coldwater | 41.7% | 34.1%(+7.60)#43 | 38.5%(+3.20)#2,233 |
| 44. | Eastpointe | 41.4% | 34.1%(+7.30)#44 | 38.5%(+2.90)#2,280 |
| 45. | Midland | 40.4% | 34.1%(+6.30)#45 | 38.5%(+1.90)#2,462 |
| 46. | Taylor | 40.1% | 34.1%(+6.00)#46 | 38.5%(+1.60)#2,516 |
| 47. | Royal Oak | 39.6% | 34.1%(+5.50)#47 | 38.5%(+1.10)#2,603 |
| 48. | Grosse Pointe Park | 38.7% | 34.1%(+4.60)#48 | 38.5%(+0.200)#2,772 |
| 49. | Wayne | 37.8% | 34.1%(+3.70)#49 | 38.5%(-0.700)#2,894 |
| 50. | Oak Park | 37.4% | 34.1%(+3.30)#50 | 38.5%(-1.10)#2,951 |
| 51. | Port Huron | 37.3% | 34.1%(+3.20)#51 | 38.5%(-1.20)#2,970 |
| 52. | Detroit | 37.1% | 34.1%(+3.00)#52 | 38.5%(-1.40)#2,992 |
| 53. | Benton Harbor | 36.7% | 34.1%(+2.60)#53 | 38.5%(-1.80)#3,069 |
| 54. | Lansing | 36.6% | 34.1%(+2.50)#54 | 38.5%(-1.90)#3,073 |
| 55. | Flint | 36.2% | 34.1%(+2.10)#55 | 38.5%(-2.30)#3,136 |
| 56. | Forest Hills | 36.2% | 34.1%(+2.10)#56 | 38.5%(-2.30)#3,138 |
| 57. | Garden City | 35.7% | 34.1%(+1.60)#57 | 38.5%(-2.80)#3,206 |
| 58. | Grand Haven | 35.7% | 34.1%(+1.60)#58 | 38.5%(-2.80)#3,214 |
| 59. | Albion | 35.5% | 34.1%(+1.40)#59 | 38.5%(-3.00)#3,245 |
| 60. | Grosse Pointe Woods | 35.2% | 34.1%(+1.10)#60 | 38.5%(-3.30)#3,289 |
| 61. | Southfield | 35.1% | 34.1%(+1.00)#61 | 38.5%(-3.40)#3,300 |
| 62. | Escanaba | 34.3% | 34.1%(+0.200)#62 | 38.5%(-4.20)#3,428 |
| 63. | East Grand Rapids | 34.1% | 34.1%(=0.000)#63 | 38.5%(-4.40)#3,442 |
| 64. | Zeeland | 33.9% | 34.1%(-0.200)#64 | 38.5%(-4.60)#3,469 |
| 65. | Ionia | 33.8% | 34.1%(-0.300)#65 | 38.5%(-4.70)#3,481 |
| 66. | Burton | 33.3% | 34.1%(-0.800)#66 | 38.5%(-5.20)#3,539 |
| 67. | Dearborn | 33.2% | 34.1%(-0.900)#67 | 38.5%(-5.30)#3,550 |
| 68. | Roseville | 32.6% | 34.1%(-1.50)#68 | 38.5%(-5.90)#3,616 |
| 69. | Harbor Beach | 32.4% | 34.1%(-1.70)#69 | 38.5%(-6.10)#3,653 |
| 70. | Haslett | 32.3% | 34.1%(-1.80)#70 | 38.5%(-6.20)#3,659 |
| 71. | Kalamazoo | 31.6% | 34.1%(-2.50)#71 | 38.5%(-6.90)#3,729 |
| 72. | Grand Rapids | 31.3% | 34.1%(-2.80)#72 | 38.5%(-7.20)#3,752 |
| 73. | Walker | 31.3% | 34.1%(-2.80)#73 | 38.5%(-7.20)#3,754 |
| 74. | Okemos | 30.8% | 34.1%(-3.30)#74 | 38.5%(-7.70)#3,807 |
| 75. | Norton Shores | 30.8% | 34.1%(-3.30)#75 | 38.5%(-7.70)#3,808 |
| 76. | Beecher | 30.6% | 34.1%(-3.50)#76 | 38.5%(-7.90)#3,831 |
| 77. | Lapeer | 30.5% | 34.1%(-3.60)#77 | 38.5%(-8.00)#3,835 |
| 78. | Wyoming | 29.9% | 34.1%(-4.20)#78 | 38.5%(-8.60)#3,877 |
| 79. | Houghton | 29.2% | 34.1%(-4.90)#79 | 38.5%(-9.30)#3,946 |
| 80. | Cutlerville | 28.9% | 34.1%(-5.20)#80 | 38.5%(-9.60)#3,975 |
| 81. | Muskegon | 28.7% | 34.1%(-5.40)#81 | 38.5%(-9.80)#3,998 |
| 82. | Ferndale | 28.7% | 34.1%(-5.40)#82 | 38.5%(-9.80)#4,001 |
| 83. | Waverly | 28.3% | 34.1%(-5.80)#83 | 38.5%(-10.2)#4,038 |
| 84. | Ypsilanti | 28.0% | 34.1%(-6.10)#84 | 38.5%(-10.5)#4,055 |
| 85. | K I Sawyer | 28.0% | 34.1%(-6.10)#85 | 38.5%(-10.5)#4,059 |
| 86. | Dansville | 28.0% | 34.1%(-6.10)#86 | 38.5%(-10.5)#4,060 |
| 87. | Marquette | 27.3% | 34.1%(-6.80)#87 | 38.5%(-11.2)#4,113 |
| 88. | Ann Arbor | 27.1% | 34.1%(-7.00)#88 | 38.5%(-11.4)#4,122 |
| 89. | Ecorse | 27.1% | 34.1%(-7.00)#89 | 38.5%(-11.4)#4,124 |
| 90. | Holland | 26.3% | 34.1%(-7.80)#90 | 38.5%(-12.2)#4,175 |
| 91. | Port Austin | 25.7% | 34.1%(-8.40)#91 | 38.5%(-12.8)#4,210 |
| 92. | Mount Pleasant | 25.6% | 34.1%(-8.50)#92 | 38.5%(-12.9)#4,215 |
| 93. | Hamtramck | 24.5% | 34.1%(-9.60)#93 | 38.5%(-14.0)#4,282 |
| 94. | Southgate | 23.8% | 34.1%(-10.3)#94 | 38.5%(-14.7)#4,316 |
| 95. | Westwood | 22.3% | 34.1%(-11.8)#95 | 38.5%(-16.2)#4,410 |
| 96. | East Lansing | 21.4% | 34.1%(-12.7)#96 | 38.5%(-17.1)#4,440 |
| 97. | Allendale | 21.0% | 34.1%(-13.1)#97 | 38.5%(-17.5)#4,451 |
| 98. | Parchment | 20.9% | 34.1%(-13.2)#98 | 38.5%(-17.6)#4,467 |
| 99. | Jackson | 20.8% | 34.1%(-13.3)#99 | 38.5%(-17.7)#4,470 |
| 100. | Petoskey | 20.7% | 34.1%(-13.4)#100 | 38.5%(-17.8)#4,476 |
Common Questions
What are the Top 10 Cities with the Highest Percentage of Population Taking Public Transit to Work in Michigan?
Top 10 Cities with the Highest Percentage of Population Taking Public Transit to Work in Michigan are:
#1
64.3%
#2
63.9%
#3
62.3%
#4
60.1%
#5
59.1%
#6
59.0%
#7
57.9%
#8
56.3%
#9
56.2%
#10
55.7%
What city has the Highest Percentage of Population Taking Public Transit to Work in Michigan?
Hazel Park has the Highest Percentage of Population Taking Public Transit to Work in Michigan with 64.3%.
What is the Percentage of Population Taking Public Transit to Work in the State of Michigan?
Percentage of Population Taking Public Transit to Work in Michigan is 34.1%.
What is the Percentage of Population Taking Public Transit to Work in the United States?
Percentage of Population Taking Public Transit to Work in the United States is 38.5%.