Lapeer, MI Map & Demographics
Lapeer Map
Lapeer Overview
$29,527
PER CAPITA INCOME
$69,737
AVG FAMILY INCOME
$50,510
AVG HOUSEHOLD INCOME
26.5%
WAGE / INCOME GAP [ % ]
73.5¢/ $1
WAGE / INCOME GAP [ $ ]
$15,639
FAMILY INCOME DEFICIT
0.52
INEQUALITY / GINI INDEX
9,034
TOTAL POPULATION
4,957
MALE POPULATION
4,077
FEMALE POPULATION
121.58
MALES / 100 FEMALES
82.25
FEMALES / 100 MALES
40.3
MEDIAN AGE
2.8
AVG FAMILY SIZE
2.1
AVG HOUSEHOLD SIZE
3,594
LABOR FORCE [ PEOPLE ]
47.7%
PERCENT IN LABOR FORCE
4.3%
UNEMPLOYMENT RATE
Lapeer Zip Codes
Lapeer Area Codes
Income in Lapeer
Income Overview in Lapeer
Per Capita Income in Lapeer is $29,527, while median incomes of families and households are $69,737 and $50,510 respectively.
| Characteristic | Number | Measure |
| Per Capita Income | 9,034 | $29,527 |
| Median Family Income | 1,898 | $69,737 |
| Mean Family Income | 1,898 | $96,436 |
| Median Household Income | 3,652 | $50,510 |
| Mean Household Income | 3,652 | $69,727 |
| Income Deficit | 1,898 | $15,639 |
| Wage / Income Gap (%) | 9,034 | 26.48% |
| Wage / Income Gap ($) | 9,034 | 73.52¢ per $1 |
| Gini / Inequality Index | 9,034 | 0.52 |
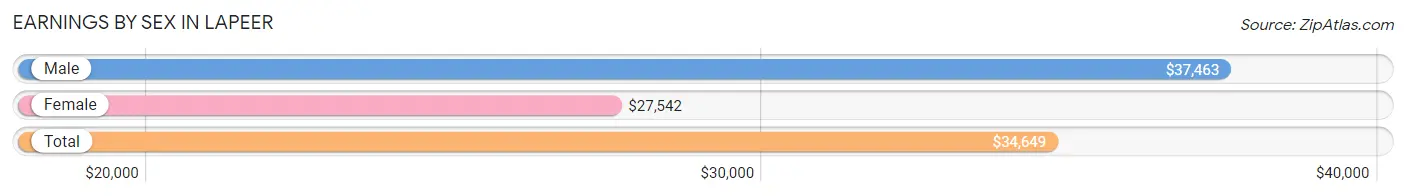
Earnings by Sex in Lapeer
Average Earnings in Lapeer are $34,649, $37,463 for men and $27,542 for women, a difference of 26.5%.
| Sex | Number | Average Earnings |
| Male | 2,030 (53.3%) | $37,463 |
| Female | 1,777 (46.7%) | $27,542 |
| Total | 3,807 (100.0%) | $34,649 |
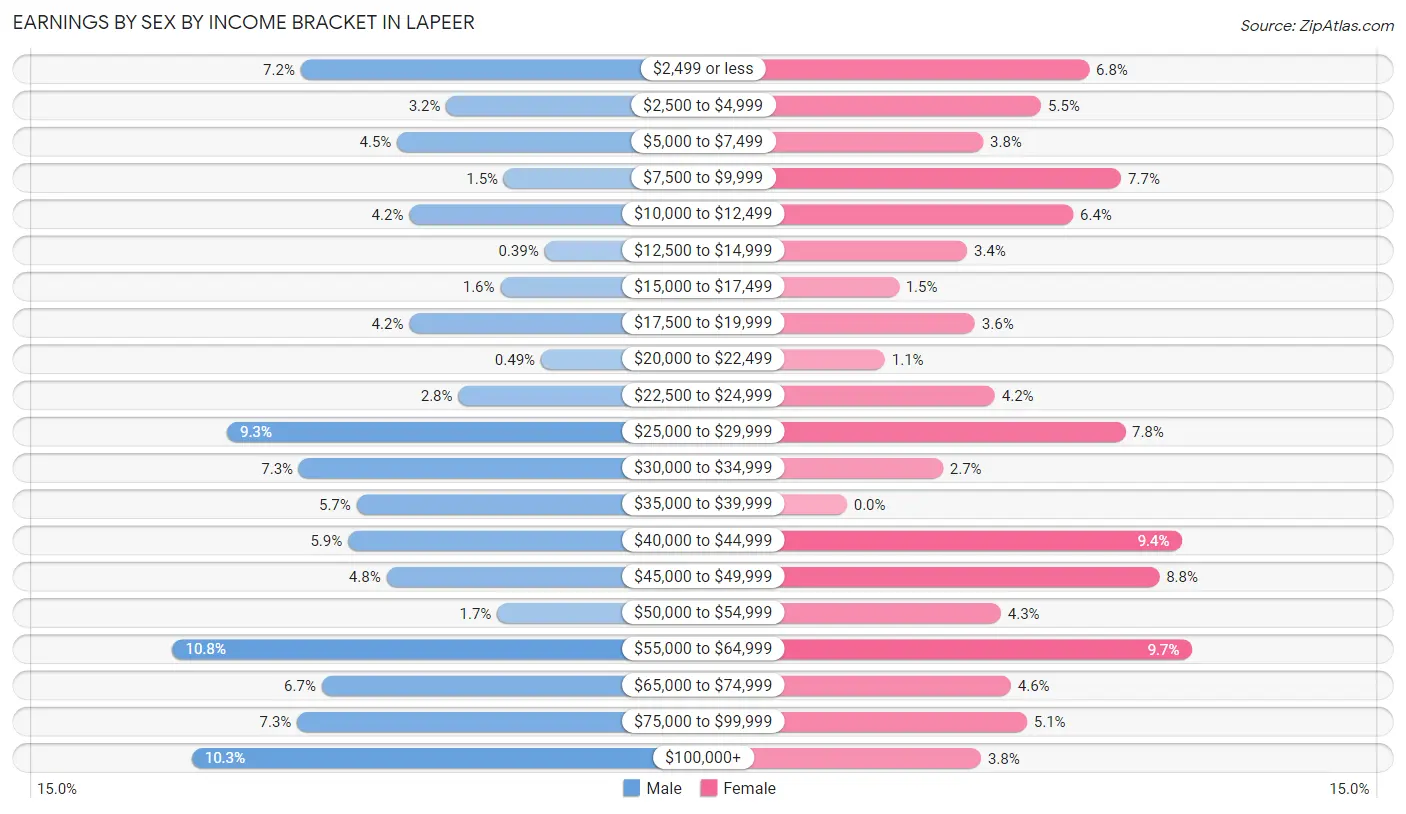
Earnings by Sex by Income Bracket in Lapeer
The most common earnings brackets in Lapeer are $55,000 to $64,999 for men (220 | 10.8%) and $55,000 to $64,999 for women (172 | 9.7%).
| Income | Male | Female |
| $2,499 or less | 147 (7.2%) | 121 (6.8%) |
| $2,500 to $4,999 | 64 (3.2%) | 97 (5.5%) |
| $5,000 to $7,499 | 92 (4.5%) | 68 (3.8%) |
| $7,500 to $9,999 | 31 (1.5%) | 137 (7.7%) |
| $10,000 to $12,499 | 85 (4.2%) | 113 (6.4%) |
| $12,500 to $14,999 | 8 (0.4%) | 60 (3.4%) |
| $15,000 to $17,499 | 33 (1.6%) | 26 (1.5%) |
| $17,500 to $19,999 | 85 (4.2%) | 64 (3.6%) |
| $20,000 to $22,499 | 10 (0.5%) | 19 (1.1%) |
| $22,500 to $24,999 | 57 (2.8%) | 74 (4.2%) |
| $25,000 to $29,999 | 189 (9.3%) | 139 (7.8%) |
| $30,000 to $34,999 | 148 (7.3%) | 48 (2.7%) |
| $35,000 to $39,999 | 115 (5.7%) | 0 (0.0%) |
| $40,000 to $44,999 | 120 (5.9%) | 167 (9.4%) |
| $45,000 to $49,999 | 98 (4.8%) | 156 (8.8%) |
| $50,000 to $54,999 | 35 (1.7%) | 77 (4.3%) |
| $55,000 to $64,999 | 220 (10.8%) | 172 (9.7%) |
| $65,000 to $74,999 | 135 (6.7%) | 82 (4.6%) |
| $75,000 to $99,999 | 149 (7.3%) | 90 (5.1%) |
| $100,000+ | 209 (10.3%) | 67 (3.8%) |
| Total | 2,030 (100.0%) | 1,777 (100.0%) |
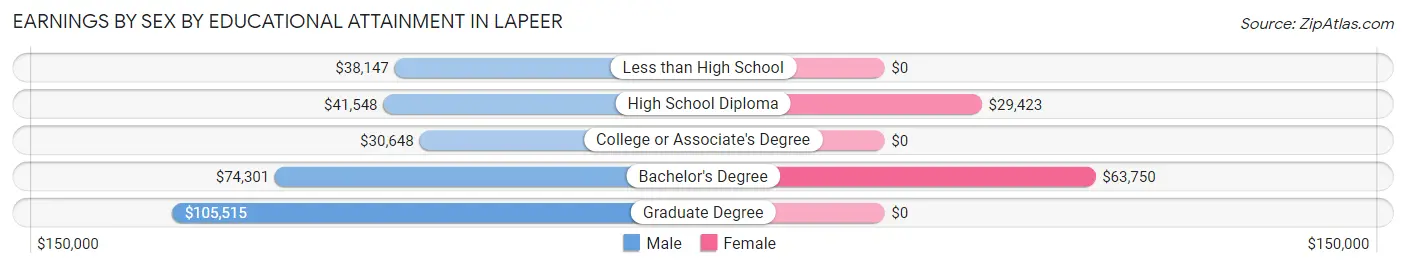
Earnings by Sex by Educational Attainment in Lapeer
Average earnings in Lapeer are $43,641 for men and $40,699 for women, a difference of 6.7%. Men with an educational attainment of graduate degree enjoy the highest average annual earnings of $105,515, while those with college or associate's degree education earn the least with $30,648. Women with an educational attainment of bachelor's degree earn the most with the average annual earnings of $63,750, while those with high school diploma education have the smallest earnings of $29,423.
| Educational Attainment | Male Income | Female Income |
| Less than High School | $38,147 | $0 |
| High School Diploma | $41,548 | $29,423 |
| College or Associate's Degree | $30,648 | $0 |
| Bachelor's Degree | $74,301 | $63,750 |
| Graduate Degree | $105,515 | $0 |
| Total | $43,641 | $40,699 |
Family Income in Lapeer
Family Income Brackets in Lapeer
According to the Lapeer family income data, there are 402 families falling into the $50,000 to $74,999 income range, which is the most common income bracket and makes up 21.2% of all families. Conversely, the $10,000 to $14,999 income bracket is the least frequent group with only 70 families (3.7%) belonging to this category.
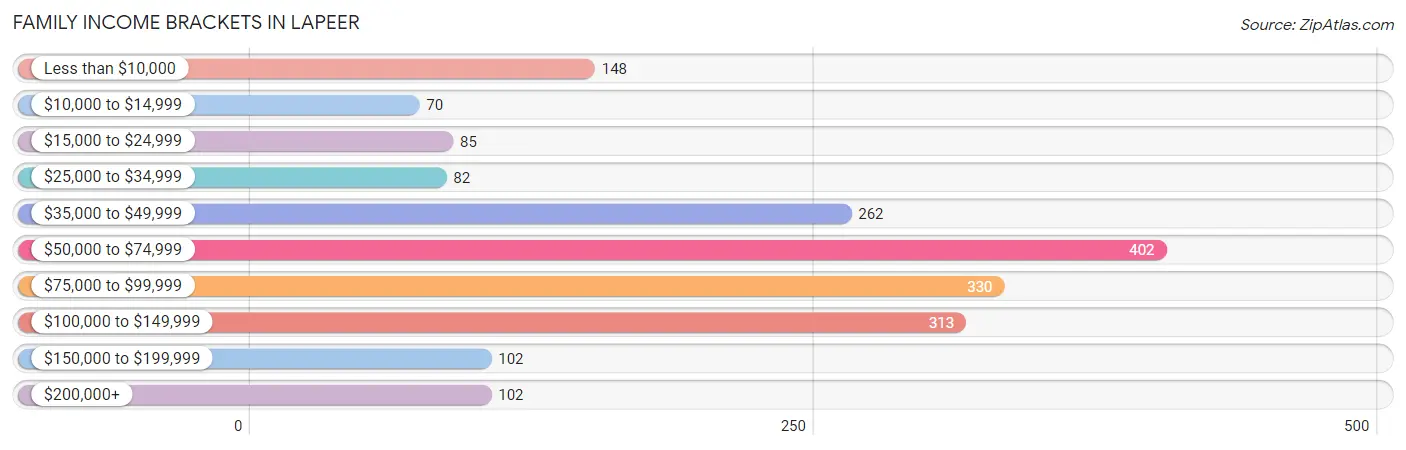
| Income Bracket | # Families | % Families |
| Less than $10,000 | 148 | 7.8% |
| $10,000 to $14,999 | 70 | 3.7% |
| $15,000 to $24,999 | 85 | 4.5% |
| $25,000 to $34,999 | 82 | 4.3% |
| $35,000 to $49,999 | 262 | 13.8% |
| $50,000 to $74,999 | 402 | 21.2% |
| $75,000 to $99,999 | 330 | 17.4% |
| $100,000 to $149,999 | 313 | 16.5% |
| $150,000 to $199,999 | 102 | 5.4% |
| $200,000+ | 102 | 5.4% |
Family Income by Famaliy Size in Lapeer
4-person families (205 | 10.8%) account for the highest median family income in Lapeer with $111,314 per family, while 2-person families (978 | 51.5%) have the highest median income of $32,175 per family member.
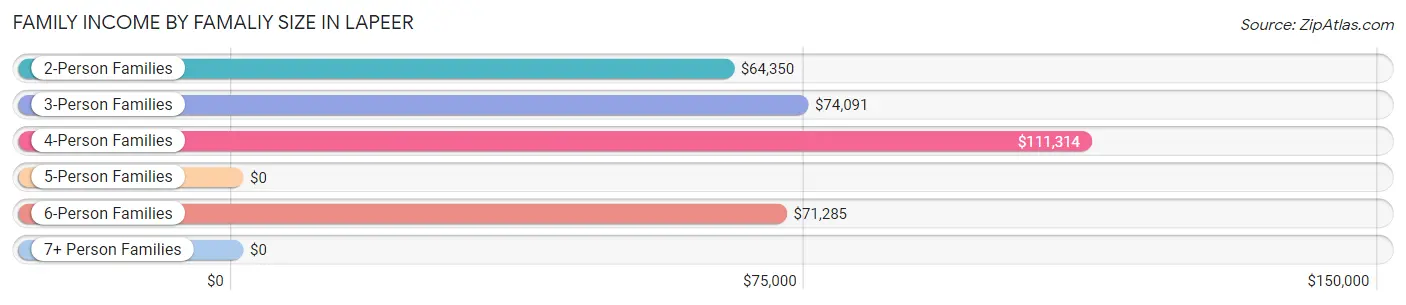
| Income Bracket | # Families | Median Income |
| 2-Person Families | 978 (51.5%) | $64,350 |
| 3-Person Families | 474 (25.0%) | $74,091 |
| 4-Person Families | 205 (10.8%) | $111,314 |
| 5-Person Families | 171 (9.0%) | $0 |
| 6-Person Families | 63 (3.3%) | $71,285 |
| 7+ Person Families | 7 (0.4%) | $0 |
| Total | 1,898 (100.0%) | $69,737 |
Family Income by Number of Earners in Lapeer
The median family income in Lapeer is $69,737, with families comprising 2 earners (908) having the highest median family income of $86,270, while families with no earners (287) have the lowest median family income of $25,096, accounting for 47.8% and 15.1% of families, respectively.
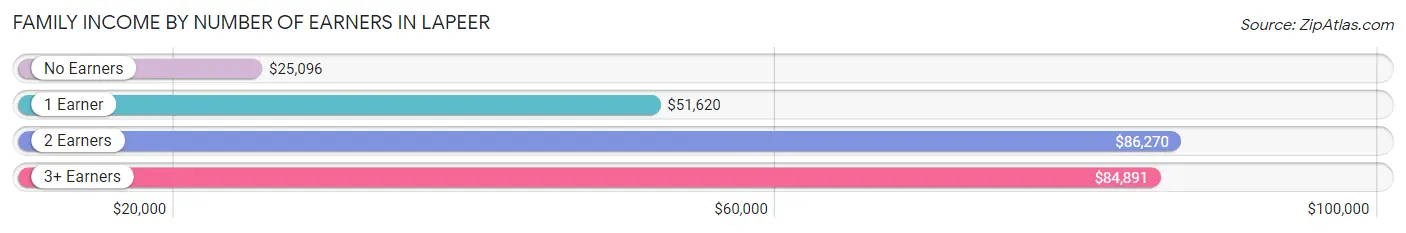
| Number of Earners | # Families | Median Income |
| No Earners | 287 (15.1%) | $25,096 |
| 1 Earner | 583 (30.7%) | $51,620 |
| 2 Earners | 908 (47.8%) | $86,270 |
| 3+ Earners | 120 (6.3%) | $84,891 |
| Total | 1,898 (100.0%) | $69,737 |
Household Income in Lapeer
Household Income Brackets in Lapeer
With 694 households falling in the category, the $50,000 to $74,999 income range is the most frequent in Lapeer, accounting for 19.0% of all households. In contrast, only 102 households (2.8%) fall into the $200,000+ income bracket, making it the least populous group.
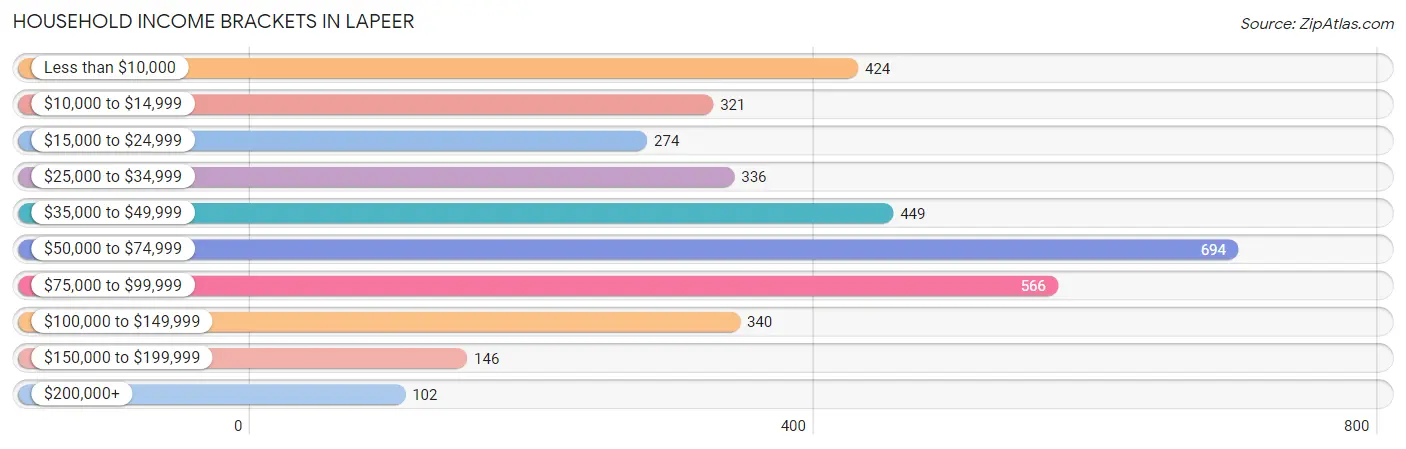
| Income Bracket | # Households | % Households |
| Less than $10,000 | 424 | 11.6% |
| $10,000 to $14,999 | 321 | 8.8% |
| $15,000 to $24,999 | 274 | 7.5% |
| $25,000 to $34,999 | 336 | 9.2% |
| $35,000 to $49,999 | 449 | 12.3% |
| $50,000 to $74,999 | 694 | 19.0% |
| $75,000 to $99,999 | 566 | 15.5% |
| $100,000 to $149,999 | 340 | 9.3% |
| $150,000 to $199,999 | 146 | 4.0% |
| $200,000+ | 102 | 2.8% |
Household Income by Householder Age in Lapeer
The median household income in Lapeer is $50,510, with the highest median household income of $61,552 found in the 45 to 64 years age bracket for the primary householder. A total of 1,540 households (42.2%) fall into this category. Meanwhile, the 65+ years age bracket for the primary householder has the lowest median household income of $35,240, with 925 households (25.3%) in this group.
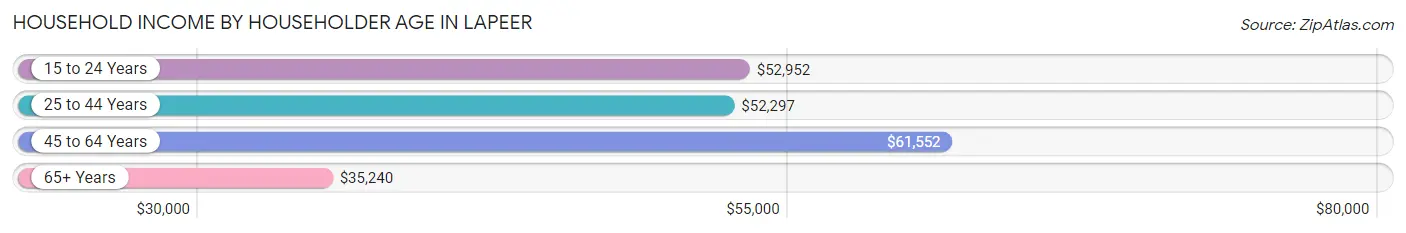
| Income Bracket | # Households | Median Income |
| 15 to 24 Years | 174 (4.8%) | $52,952 |
| 25 to 44 Years | 1,013 (27.7%) | $52,297 |
| 45 to 64 Years | 1,540 (42.2%) | $61,552 |
| 65+ Years | 925 (25.3%) | $35,240 |
| Total | 3,652 (100.0%) | $50,510 |
Poverty in Lapeer
Income Below Poverty by Sex and Age in Lapeer
With 21.0% poverty level for males and 26.7% for females among the residents of Lapeer, 5 year old males and 5 year old females are the most vulnerable to poverty, with 38 males (80.8%) and 34 females (52.3%) in their respective age groups living below the poverty level.
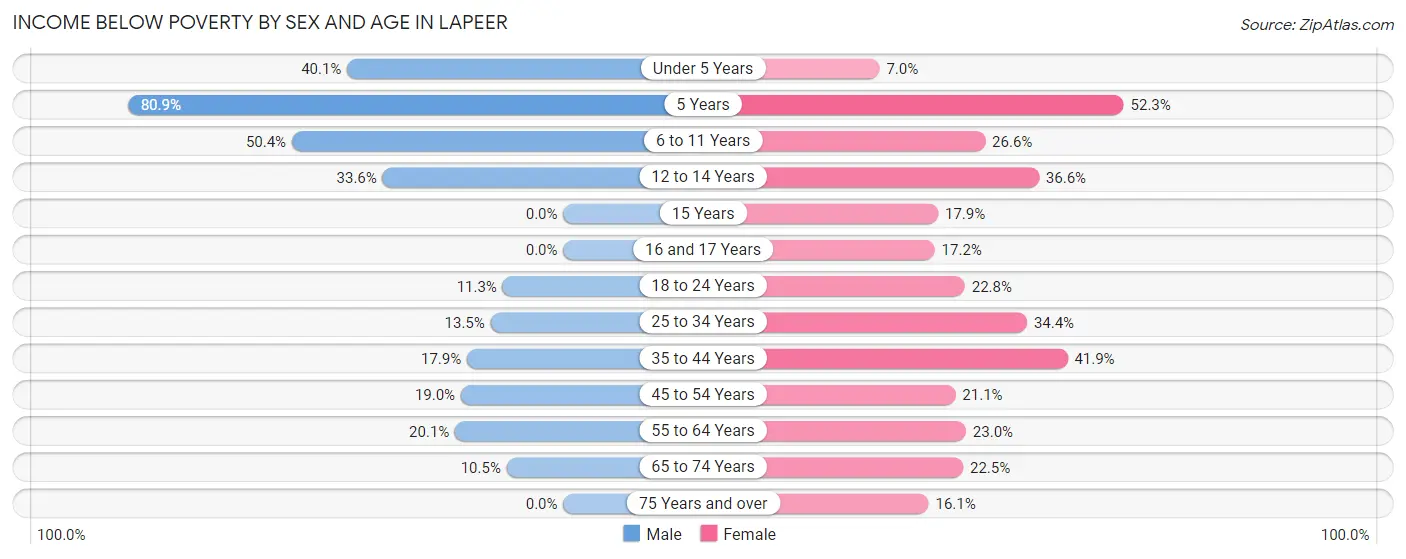
| Age Bracket | Male | Female |
| Under 5 Years | 136 (40.1%) | 7 (7.0%) |
| 5 Years | 38 (80.8%) | 34 (52.3%) |
| 6 to 11 Years | 133 (50.4%) | 87 (26.6%) |
| 12 to 14 Years | 52 (33.6%) | 30 (36.6%) |
| 15 Years | 0 (0.0%) | 10 (17.9%) |
| 16 and 17 Years | 0 (0.0%) | 5 (17.2%) |
| 18 to 24 Years | 33 (11.3%) | 71 (22.8%) |
| 25 to 34 Years | 79 (13.5%) | 199 (34.4%) |
| 35 to 44 Years | 79 (17.9%) | 209 (41.9%) |
| 45 to 54 Years | 81 (19.0%) | 93 (21.1%) |
| 55 to 64 Years | 97 (20.1%) | 165 (23.0%) |
| 65 to 74 Years | 33 (10.5%) | 99 (22.5%) |
| 75 Years and over | 0 (0.0%) | 53 (16.1%) |
| Total | 761 (21.0%) | 1,062 (26.7%) |
Income Above Poverty by Sex and Age in Lapeer
According to the poverty statistics in Lapeer, males aged 16 and 17 years and females aged under 5 years are the age groups that are most secure financially, with 100.0% of males and 93.0% of females in these age groups living above the poverty line.
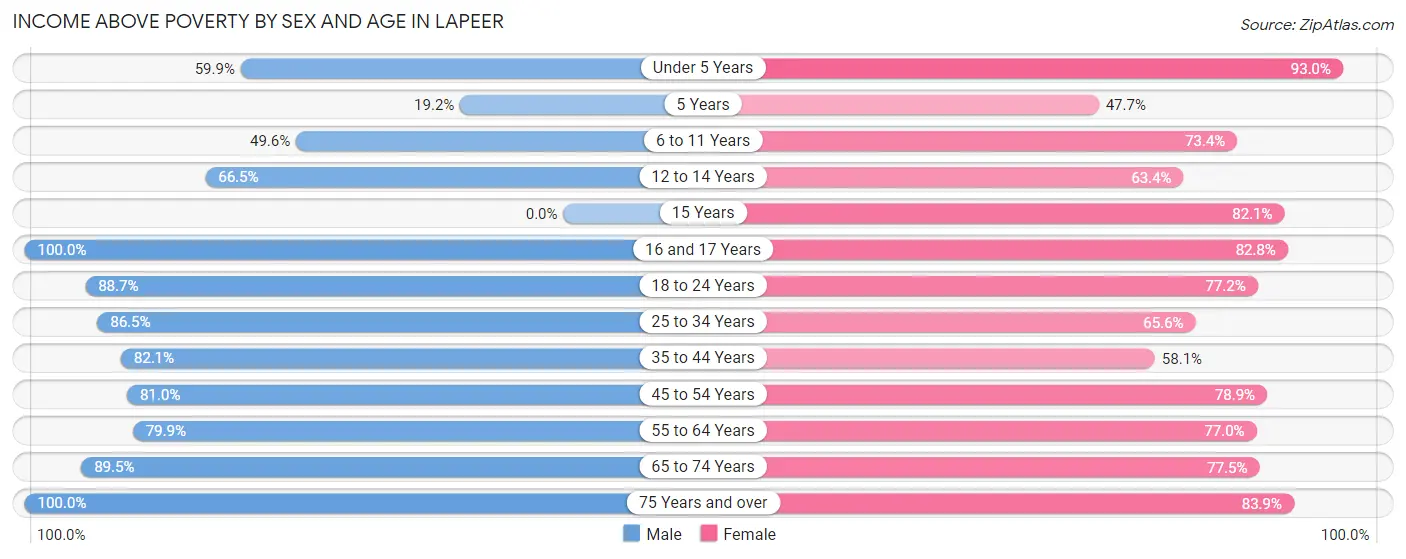
| Age Bracket | Male | Female |
| Under 5 Years | 203 (59.9%) | 93 (93.0%) |
| 5 Years | 9 (19.2%) | 31 (47.7%) |
| 6 to 11 Years | 131 (49.6%) | 240 (73.4%) |
| 12 to 14 Years | 103 (66.4%) | 52 (63.4%) |
| 15 Years | 0 (0.0%) | 46 (82.1%) |
| 16 and 17 Years | 53 (100.0%) | 24 (82.8%) |
| 18 to 24 Years | 260 (88.7%) | 240 (77.2%) |
| 25 to 34 Years | 506 (86.5%) | 380 (65.6%) |
| 35 to 44 Years | 363 (82.1%) | 290 (58.1%) |
| 45 to 54 Years | 345 (81.0%) | 348 (78.9%) |
| 55 to 64 Years | 386 (79.9%) | 551 (77.0%) |
| 65 to 74 Years | 281 (89.5%) | 341 (77.5%) |
| 75 Years and over | 222 (100.0%) | 276 (83.9%) |
| Total | 2,862 (79.0%) | 2,912 (73.3%) |
Income Below Poverty Among Married-Couple Families in Lapeer
The poverty statistics for married-couple families in Lapeer show that 6.0% or 69 of the total 1,152 families live below the poverty line. Families with 5 or more children have the highest poverty rate of 100.0%, comprising of 7 families. On the other hand, families with no children have the lowest poverty rate of 1.1%, which includes 8 families.
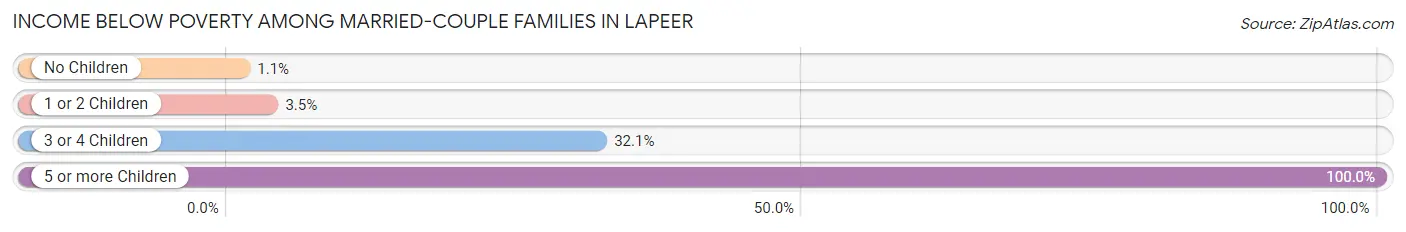
| Children | Above Poverty | Below Poverty |
| No Children | 741 (98.9%) | 8 (1.1%) |
| 1 or 2 Children | 247 (96.5%) | 9 (3.5%) |
| 3 or 4 Children | 95 (67.9%) | 45 (32.1%) |
| 5 or more Children | 0 (0.0%) | 7 (100.0%) |
| Total | 1,083 (94.0%) | 69 (6.0%) |
Income Below Poverty Among Single-Parent Households in Lapeer
According to the poverty data in Lapeer, 13.5% or 23 single-father households and 36.2% or 208 single-mother households are living below the poverty line. Among single-father households, those with no children have the highest poverty rate, with 14 households (25.5%) experiencing poverty. Likewise, among single-mother households, those with 3 or 4 children have the highest poverty rate, with 55 households (85.9%) falling below the poverty line.
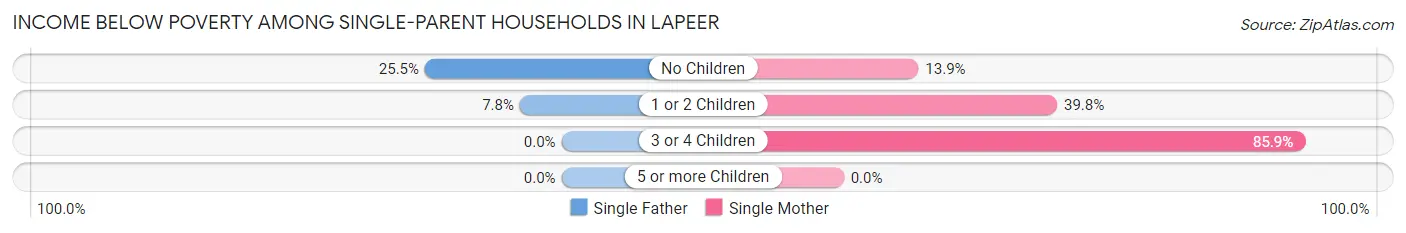
| Children | Single Father | Single Mother |
| No Children | 14 (25.5%) | 27 (13.9%) |
| 1 or 2 Children | 9 (7.8%) | 126 (39.8%) |
| 3 or 4 Children | 0 (0.0%) | 55 (85.9%) |
| 5 or more Children | 0 (0.0%) | 0 (0.0%) |
| Total | 23 (13.5%) | 208 (36.2%) |
Income Below Poverty Among Married-Couple vs Single-Parent Households in Lapeer
The poverty data for Lapeer shows that 69 of the married-couple family households (6.0%) and 231 of the single-parent households (31.0%) are living below the poverty level. Within the married-couple family households, those with 5 or more children have the highest poverty rate, with 7 households (100.0%) falling below the poverty line. Among the single-parent households, those with 3 or 4 children have the highest poverty rate, with 55 household (85.9%) living below poverty.
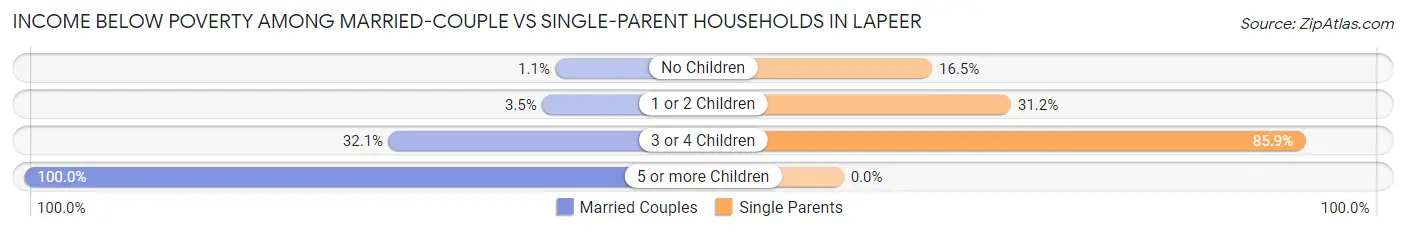
| Children | Married-Couple Families | Single-Parent Households |
| No Children | 8 (1.1%) | 41 (16.5%) |
| 1 or 2 Children | 9 (3.5%) | 135 (31.2%) |
| 3 or 4 Children | 45 (32.1%) | 55 (85.9%) |
| 5 or more Children | 7 (100.0%) | 0 (0.0%) |
| Total | 69 (6.0%) | 231 (31.0%) |
Race in Lapeer
The most populous races in Lapeer are White / Caucasian (7,348 | 81.3%), Black / African American (885 | 9.8%), and Two or more Races (748 | 8.3%).
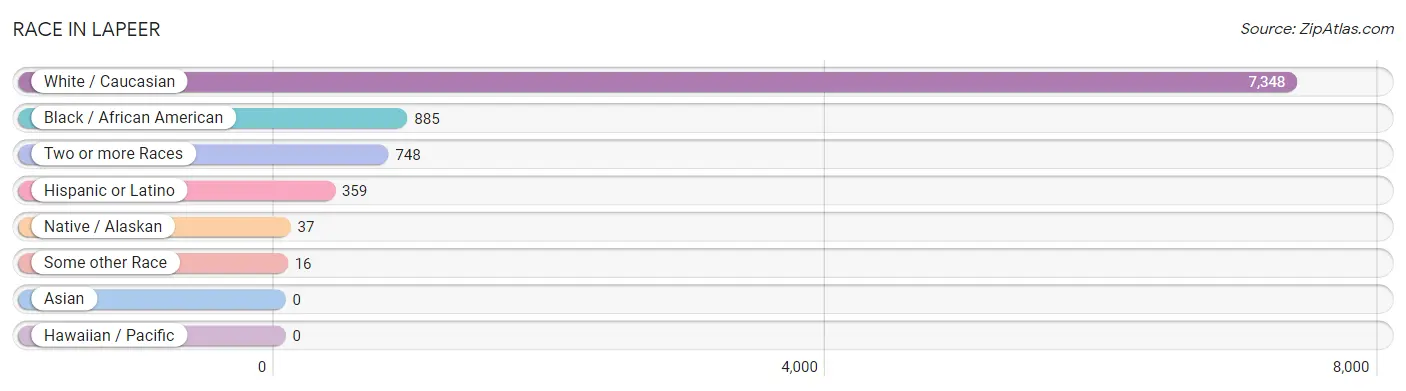
| Race | # Population | % Population |
| Asian | 0 | 0.0% |
| Black / African American | 885 | 9.8% |
| Hawaiian / Pacific | 0 | 0.0% |
| Hispanic or Latino | 359 | 4.0% |
| Native / Alaskan | 37 | 0.4% |
| White / Caucasian | 7,348 | 81.3% |
| Two or more Races | 748 | 8.3% |
| Some other Race | 16 | 0.2% |
| Total | 9,034 | 100.0% |
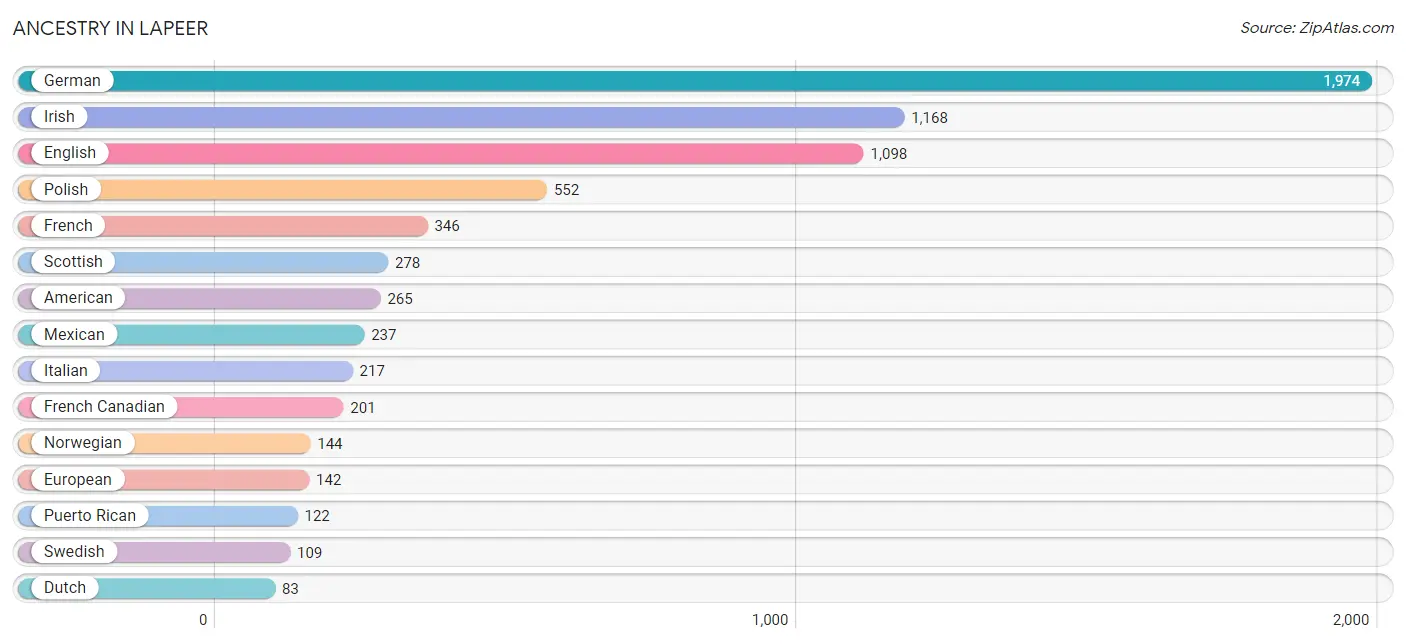
Ancestry in Lapeer
The most populous ancestries reported in Lapeer are German (1,974 | 21.8%), Irish (1,168 | 12.9%), English (1,098 | 12.1%), Polish (552 | 6.1%), and French (346 | 3.8%), together accounting for 56.9% of all Lapeer residents.
| Ancestry | # Population | % Population |
| African | 10 | 0.1% |
| American | 265 | 2.9% |
| Arab | 5 | 0.1% |
| Assyrian / Chaldean / Syriac | 6 | 0.1% |
| Austrian | 7 | 0.1% |
| Belgian | 70 | 0.8% |
| Blackfeet | 40 | 0.4% |
| British | 7 | 0.1% |
| Canadian | 20 | 0.2% |
| Celtic | 11 | 0.1% |
| Cherokee | 41 | 0.4% |
| Chippewa | 30 | 0.3% |
| Czech | 27 | 0.3% |
| Czechoslovakian | 31 | 0.3% |
| Danish | 48 | 0.5% |
| Dutch | 83 | 0.9% |
| Eastern European | 20 | 0.2% |
| English | 1,098 | 12.1% |
| European | 142 | 1.6% |
| Finnish | 34 | 0.4% |
| French | 346 | 3.8% |
| French Canadian | 201 | 2.2% |
| German | 1,974 | 21.8% |
| Hungarian | 44 | 0.5% |
| Irish | 1,168 | 12.9% |
| Iroquois | 13 | 0.1% |
| Italian | 217 | 2.4% |
| Korean | 30 | 0.3% |
| Lithuanian | 9 | 0.1% |
| Maltese | 12 | 0.1% |
| Mexican | 237 | 2.6% |
| Moroccan | 5 | 0.1% |
| Norwegian | 144 | 1.6% |
| Polish | 552 | 6.1% |
| Portuguese | 10 | 0.1% |
| Puerto Rican | 122 | 1.3% |
| Russian | 17 | 0.2% |
| Scandinavian | 6 | 0.1% |
| Scotch-Irish | 19 | 0.2% |
| Scottish | 278 | 3.1% |
| Serbian | 22 | 0.2% |
| Slovene | 10 | 0.1% |
| Subsaharan African | 10 | 0.1% |
| Swedish | 109 | 1.2% |
| Thai | 21 | 0.2% |
| Ukrainian | 19 | 0.2% |
| Welsh | 60 | 0.7% |
| Yugoslavian | 33 | 0.4% | View All 48 Rows |
Immigrants in Lapeer
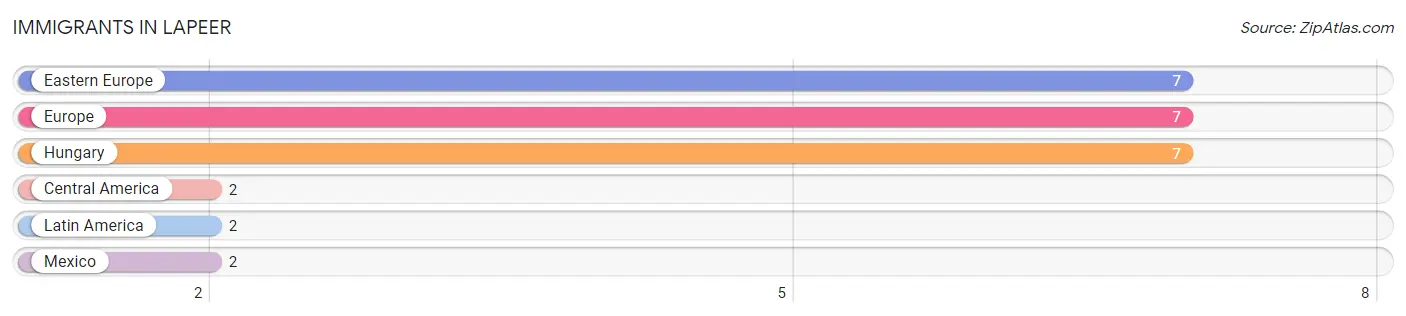
The most numerous immigrant groups reported in Lapeer came from Eastern Europe (7 | 0.1%), Europe (7 | 0.1%), Hungary (7 | 0.1%), Central America (2 | 0.0%), and Latin America (2 | 0.0%), together accounting for 0.3% of all Lapeer residents.
| Immigration Origin | # Population | % Population |
| Central America | 2 | 0.0% |
| Eastern Europe | 7 | 0.1% |
| Europe | 7 | 0.1% |
| Hungary | 7 | 0.1% |
| Latin America | 2 | 0.0% |
| Mexico | 2 | 0.0% | View All 6 Rows |
Sex and Age in Lapeer
Sex and Age in Lapeer
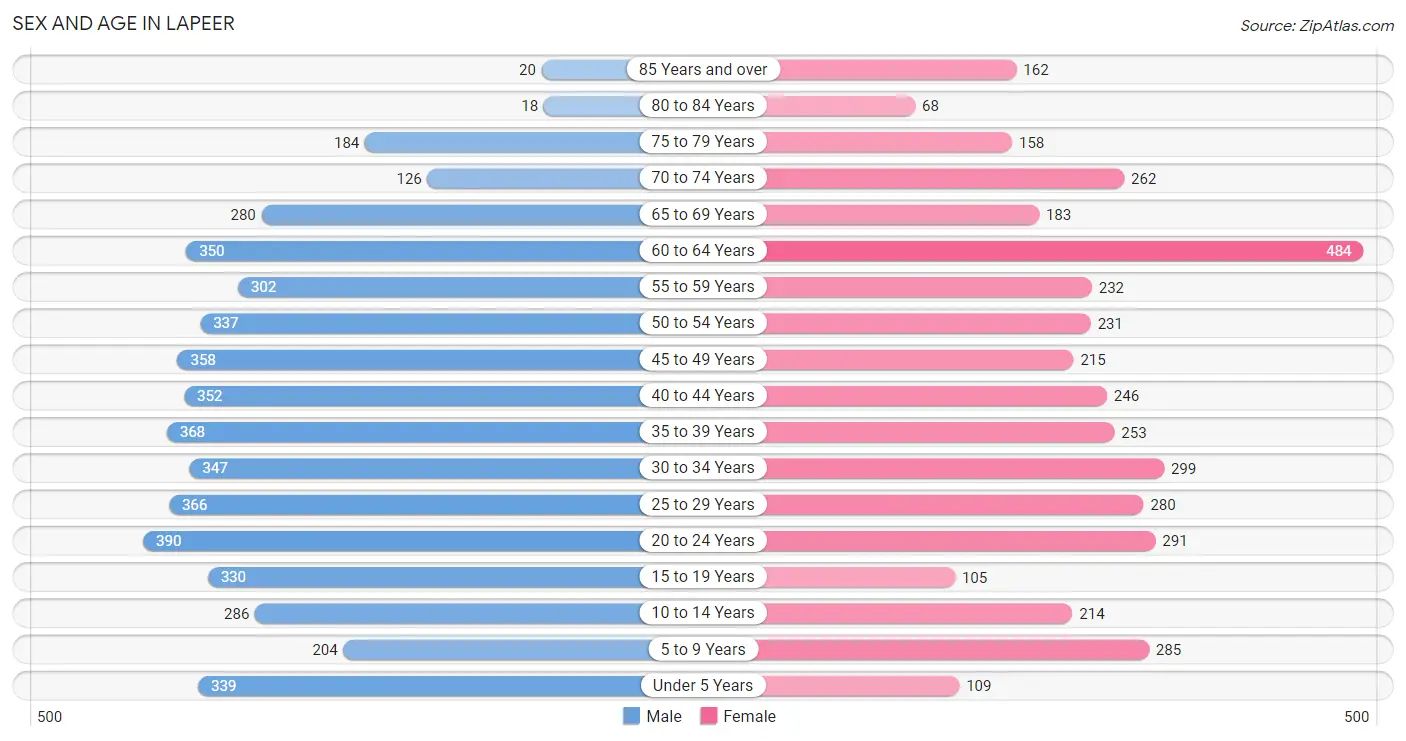
The most populous age groups in Lapeer are 20 to 24 Years (390 | 7.9%) for men and 60 to 64 Years (484 | 11.9%) for women.
| Age Bracket | Male | Female |
| Under 5 Years | 339 (6.8%) | 109 (2.7%) |
| 5 to 9 Years | 204 (4.1%) | 285 (7.0%) |
| 10 to 14 Years | 286 (5.8%) | 214 (5.2%) |
| 15 to 19 Years | 330 (6.7%) | 105 (2.6%) |
| 20 to 24 Years | 390 (7.9%) | 291 (7.1%) |
| 25 to 29 Years | 366 (7.4%) | 280 (6.9%) |
| 30 to 34 Years | 347 (7.0%) | 299 (7.3%) |
| 35 to 39 Years | 368 (7.4%) | 253 (6.2%) |
| 40 to 44 Years | 352 (7.1%) | 246 (6.0%) |
| 45 to 49 Years | 358 (7.2%) | 215 (5.3%) |
| 50 to 54 Years | 337 (6.8%) | 231 (5.7%) |
| 55 to 59 Years | 302 (6.1%) | 232 (5.7%) |
| 60 to 64 Years | 350 (7.1%) | 484 (11.9%) |
| 65 to 69 Years | 280 (5.7%) | 183 (4.5%) |
| 70 to 74 Years | 126 (2.5%) | 262 (6.4%) |
| 75 to 79 Years | 184 (3.7%) | 158 (3.9%) |
| 80 to 84 Years | 18 (0.4%) | 68 (1.7%) |
| 85 Years and over | 20 (0.4%) | 162 (4.0%) |
| Total | 4,957 (100.0%) | 4,077 (100.0%) |
Families and Households in Lapeer
Median Family Size in Lapeer
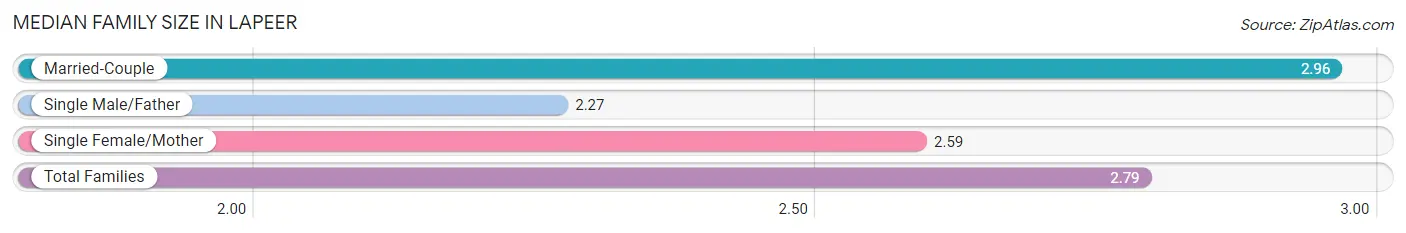
The median family size in Lapeer is 2.79 persons per family, with married-couple families (1,152 | 60.7%) accounting for the largest median family size of 2.96 persons per family. On the other hand, single male/father families (171 | 9.0%) represent the smallest median family size with 2.27 persons per family.
| Family Type | # Families | Family Size |
| Married-Couple | 1,152 (60.7%) | 2.96 |
| Single Male/Father | 171 (9.0%) | 2.27 |
| Single Female/Mother | 575 (30.3%) | 2.59 |
| Total Families | 1,898 (100.0%) | 2.79 |
Median Household Size in Lapeer
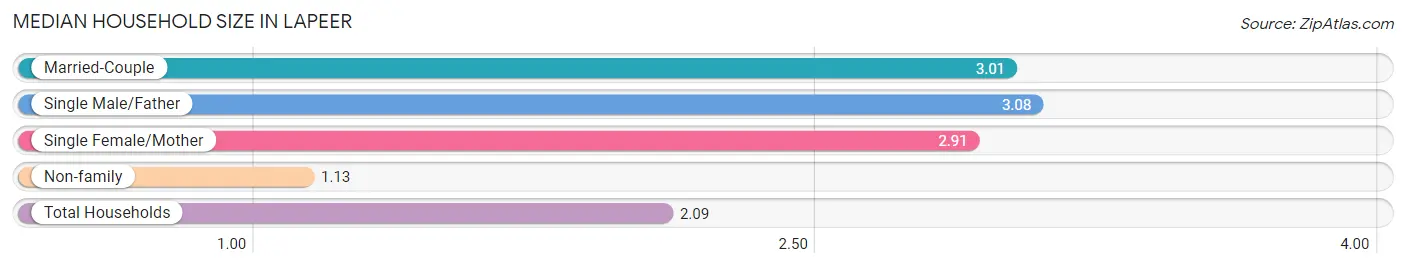
The median household size in Lapeer is 2.09 persons per household, with single male/father households (171 | 4.7%) accounting for the largest median household size of 3.08 persons per household. non-family households (1,754 | 48.0%) represent the smallest median household size with 1.13 persons per household.
| Household Type | # Households | Household Size |
| Married-Couple | 1,152 (31.5%) | 3.01 |
| Single Male/Father | 171 (4.7%) | 3.08 |
| Single Female/Mother | 575 (15.7%) | 2.91 |
| Non-family | 1,754 (48.0%) | 1.13 |
| Total Households | 3,652 (100.0%) | 2.09 |
Household Size by Marriage Status in Lapeer
Out of a total of 3,652 households in Lapeer, 1,898 (52.0%) are family households, while 1,754 (48.0%) are nonfamily households. The most numerous type of family households are 2-person households, comprising 814, and the most common type of nonfamily households are 1-person households, comprising 1,564.
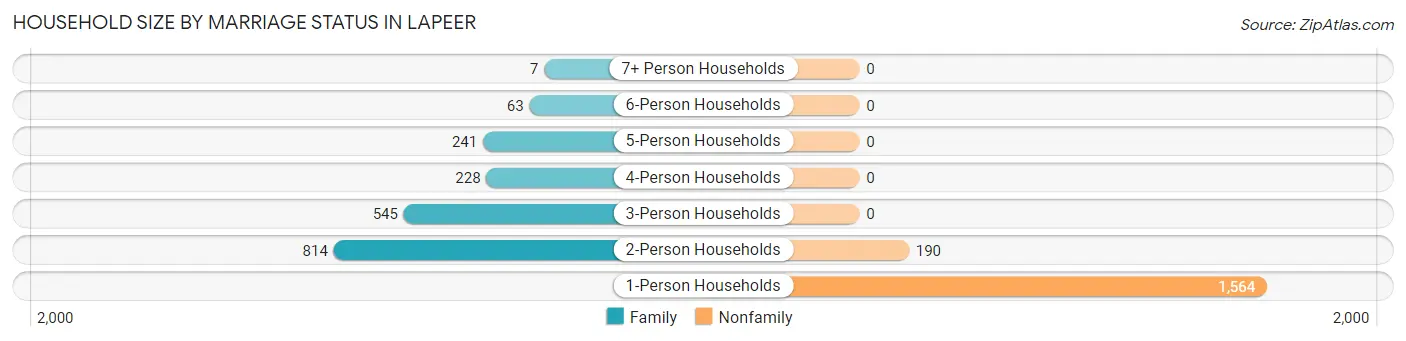
| Household Size | Family Households | Nonfamily Households |
| 1-Person Households | - | 1,564 (42.8%) |
| 2-Person Households | 814 (22.3%) | 190 (5.2%) |
| 3-Person Households | 545 (14.9%) | 0 (0.0%) |
| 4-Person Households | 228 (6.2%) | 0 (0.0%) |
| 5-Person Households | 241 (6.6%) | 0 (0.0%) |
| 6-Person Households | 63 (1.7%) | 0 (0.0%) |
| 7+ Person Households | 7 (0.2%) | 0 (0.0%) |
| Total | 1,898 (52.0%) | 1,754 (48.0%) |
Female Fertility in Lapeer
Fertility by Age in Lapeer
Average fertility rate in Lapeer is 88.0 births per 1,000 women. Women in the age bracket of 20 to 34 years have the highest fertility rate with 121.0 births per 1,000 women. Women in the age bracket of 20 to 34 years acount for 71.0% of all women with births.
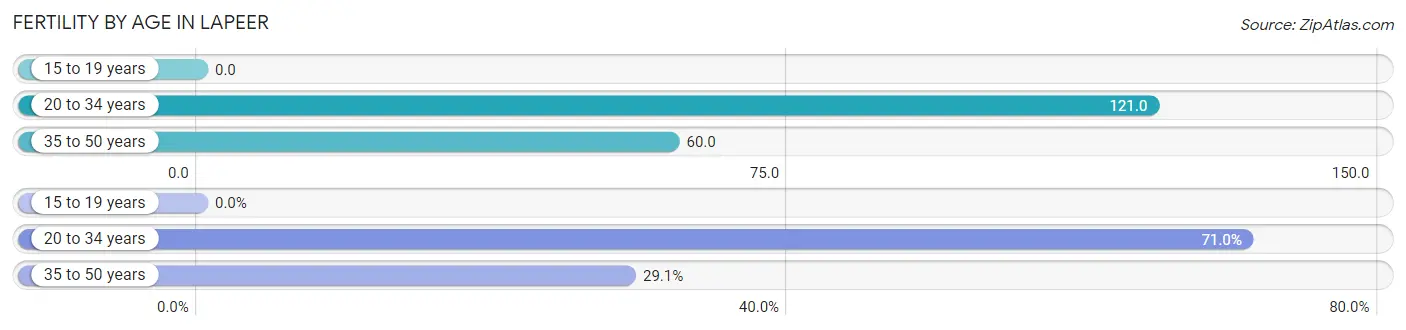
| Age Bracket | Women with Births | Births / 1,000 Women |
| 15 to 19 years | 0 (0.0%) | 0.0 |
| 20 to 34 years | 105 (71.0%) | 121.0 |
| 35 to 50 years | 43 (29.0%) | 60.0 |
| Total | 148 (100.0%) | 88.0 |
Fertility by Age by Marriage Status in Lapeer
46.6% of women with births (148) in Lapeer are married. The highest percentage of unmarried women with births falls into 20 to 34 years age bracket with 75.2% of them unmarried at the time of birth, while the lowest percentage of unmarried women with births belong to 35 to 50 years age bracket with 0.0% of them unmarried.
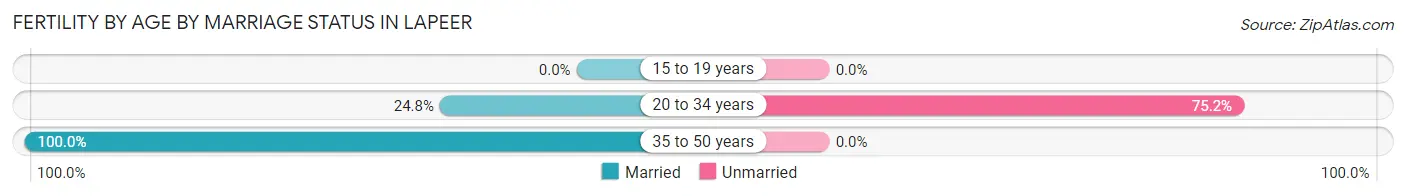
| Age Bracket | Married | Unmarried |
| 15 to 19 years | 0 (0.0%) | 0 (0.0%) |
| 20 to 34 years | 26 (24.8%) | 79 (75.2%) |
| 35 to 50 years | 43 (100.0%) | 0 (0.0%) |
| Total | 69 (46.6%) | 79 (53.4%) |
Fertility by Education in Lapeer
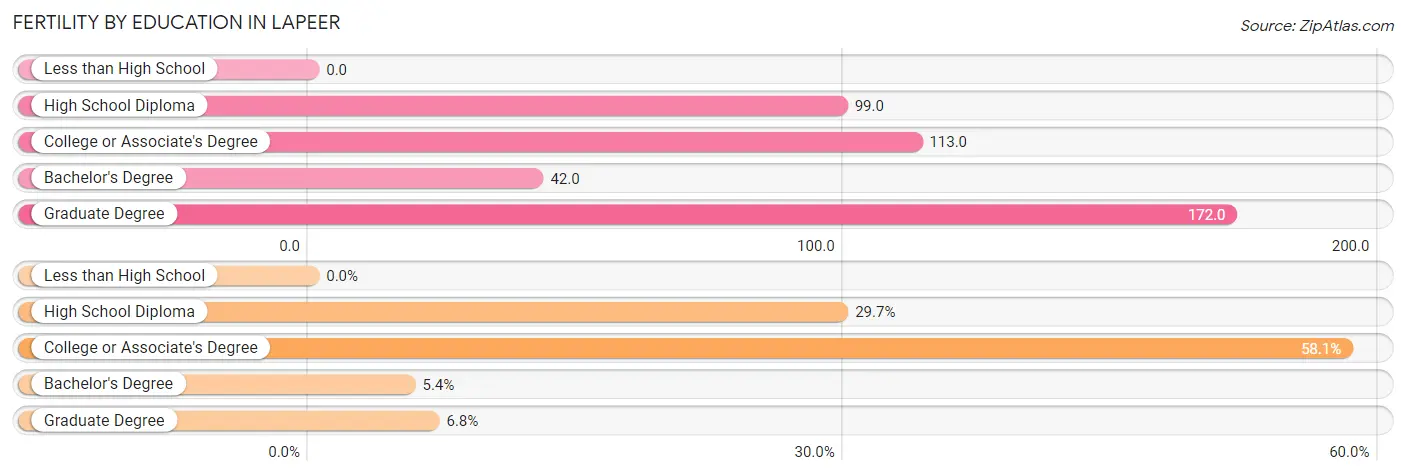
| Educational Attainment | Women with Births | Births / 1,000 Women |
| Less than High School | 0 (0.0%) | 0.0 |
| High School Diploma | 44 (29.7%) | 99.0 |
| College or Associate's Degree | 86 (58.1%) | 113.0 |
| Bachelor's Degree | 8 (5.4%) | 42.0 |
| Graduate Degree | 10 (6.8%) | 172.0 |
| Total | 148 (100.0%) | 88.0 |
Fertility by Education by Marriage Status in Lapeer
53.4% of women with births in Lapeer are unmarried. Women with the educational attainment of bachelor's degree are most likely to be married with 100.0% of them married at childbirth, while women with the educational attainment of graduate degree are least likely to be married with 100.0% of them unmarried at childbirth.
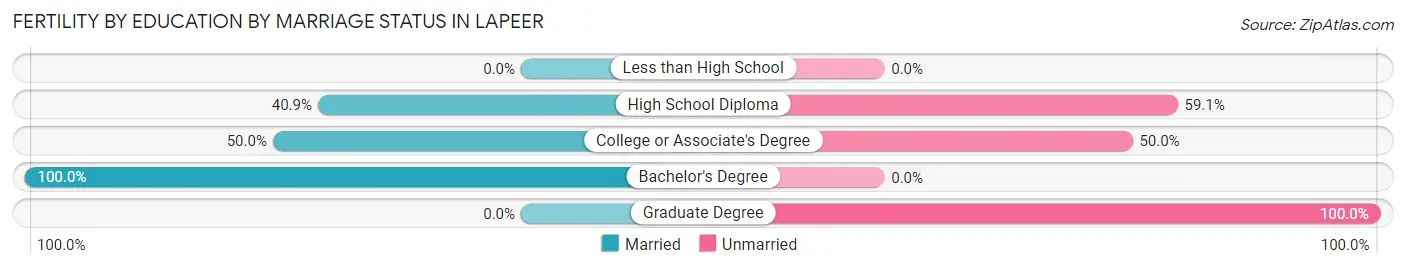
| Educational Attainment | Married | Unmarried |
| Less than High School | 0 (0.0%) | 0 (0.0%) |
| High School Diploma | 18 (40.9%) | 26 (59.1%) |
| College or Associate's Degree | 43 (50.0%) | 43 (50.0%) |
| Bachelor's Degree | 8 (100.0%) | 0 (0.0%) |
| Graduate Degree | 0 (0.0%) | 10 (100.0%) |
| Total | 69 (46.6%) | 79 (53.4%) |
Employment Characteristics in Lapeer
Employment by Class of Employer in Lapeer
Among the 3,389 employed individuals in Lapeer, private company employees (2,559 | 75.5%), self-employed (not incorporated) (306 | 9.0%), and not-for-profit organizations (226 | 6.7%) make up the most common classes of employment.
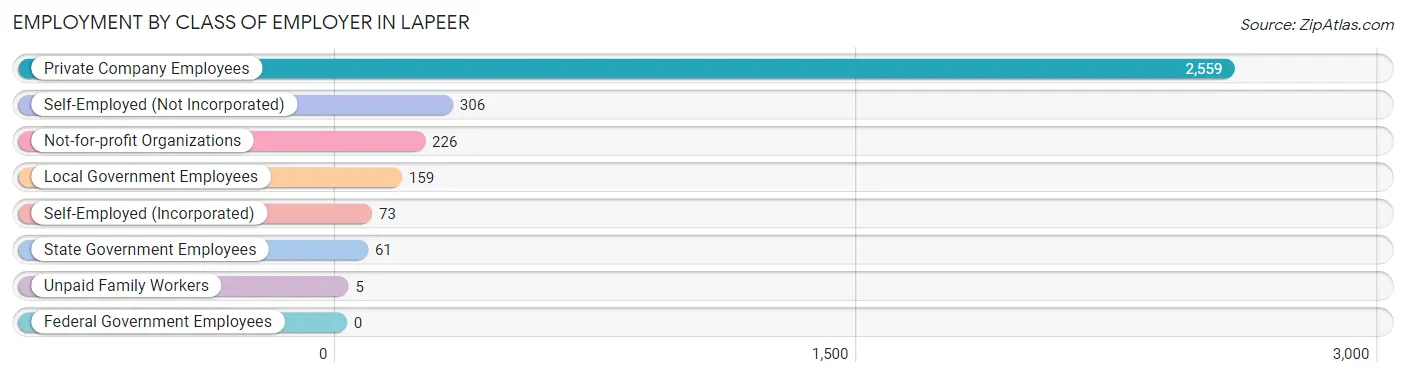
| Employer Class | # Employees | % Employees |
| Private Company Employees | 2,559 | 75.5% |
| Self-Employed (Incorporated) | 73 | 2.1% |
| Self-Employed (Not Incorporated) | 306 | 9.0% |
| Not-for-profit Organizations | 226 | 6.7% |
| Local Government Employees | 159 | 4.7% |
| State Government Employees | 61 | 1.8% |
| Federal Government Employees | 0 | 0.0% |
| Unpaid Family Workers | 5 | 0.2% |
| Total | 3,389 | 100.0% |
Employment Status by Age in Lapeer
According to the labor force statistics for Lapeer, out of the total population over 16 years of age (7,534), 47.7% or 3,594 individuals are in the labor force, with 4.3% or 155 of them unemployed. The age group with the highest labor force participation rate is 25 to 29 years, with 85.9% or 555 individuals in the labor force. Within the labor force, the 16 to 19 years age range has the highest percentage of unemployed individuals, with 13.3% or 12 of them being unemployed.
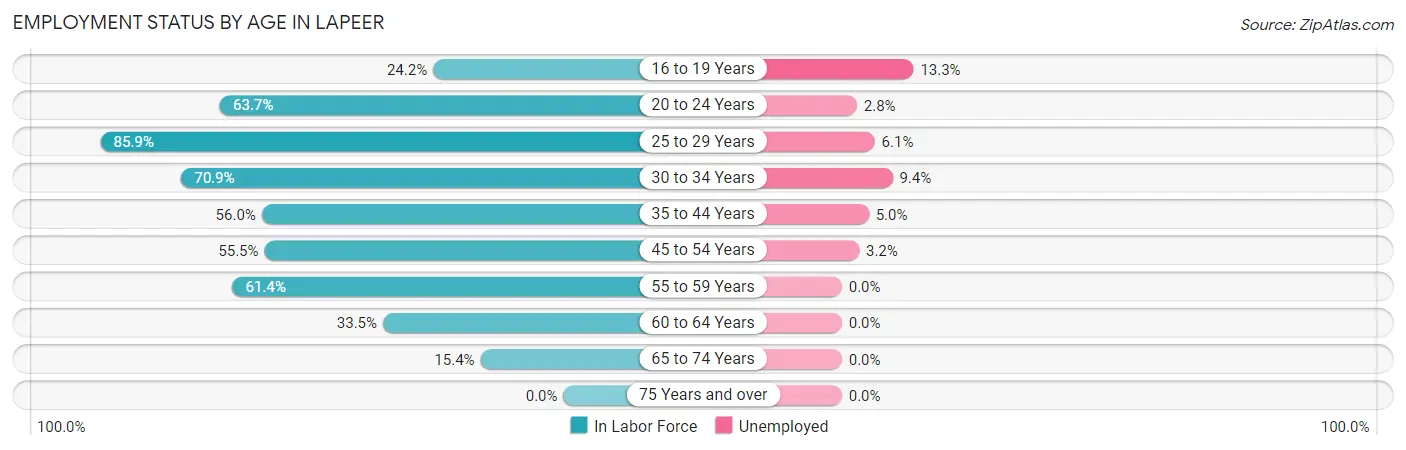
| Age Bracket | In Labor Force | Unemployed |
| 16 to 19 Years | 90 (24.2%) | 12 (13.3%) |
| 20 to 24 Years | 434 (63.7%) | 12 (2.8%) |
| 25 to 29 Years | 555 (85.9%) | 34 (6.1%) |
| 30 to 34 Years | 458 (70.9%) | 43 (9.4%) |
| 35 to 44 Years | 683 (56.0%) | 34 (5.0%) |
| 45 to 54 Years | 633 (55.5%) | 20 (3.2%) |
| 55 to 59 Years | 328 (61.4%) | 0 (0.0%) |
| 60 to 64 Years | 279 (33.5%) | 0 (0.0%) |
| 65 to 74 Years | 131 (15.4%) | 0 (0.0%) |
| 75 Years and over | 0 (0.0%) | 0 (0.0%) |
| Total | 3,594 (47.7%) | 155 (4.3%) |
Employment Status by Educational Attainment in Lapeer
According to labor force statistics for Lapeer, 58.5% of individuals (2,937) out of the total population between 25 and 64 years of age (5,020) are in the labor force, with 4.5% or 132 of them being unemployed. The group with the highest labor force participation rate are those with the educational attainment of bachelor's degree or higher, with 89.7% or 615 individuals in the labor force. Within the labor force, individuals with high school diploma education have the highest percentage of unemployment, with 6.0% or 64 of them being unemployed.
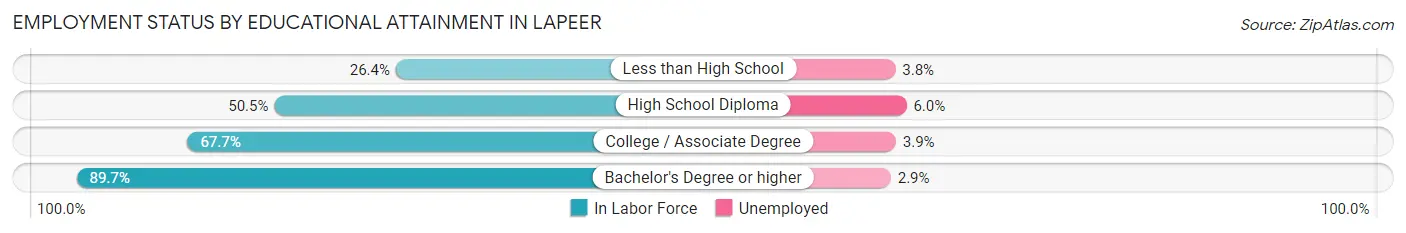
| Educational Attainment | In Labor Force | Unemployed |
| Less than High School | 158 (26.4%) | 23 (3.8%) |
| High School Diploma | 1,075 (50.5%) | 128 (6.0%) |
| College / Associate Degree | 1,087 (67.7%) | 63 (3.9%) |
| Bachelor's Degree or higher | 615 (89.7%) | 20 (2.9%) |
| Total | 2,937 (58.5%) | 226 (4.5%) |
Employment Occupations by Sex in Lapeer
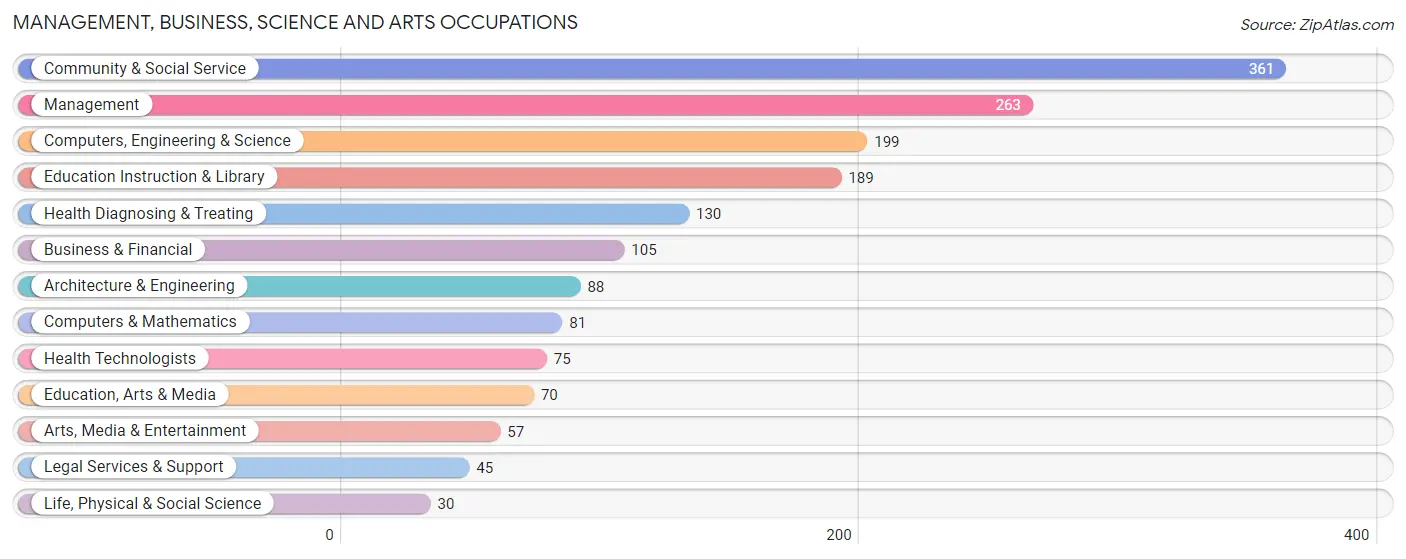
Management, Business, Science and Arts Occupations
The most common Management, Business, Science and Arts occupations in Lapeer are Community & Social Service (361 | 10.5%), Management (263 | 7.6%), Computers, Engineering & Science (199 | 5.8%), Education Instruction & Library (189 | 5.5%), and Health Diagnosing & Treating (130 | 3.8%).
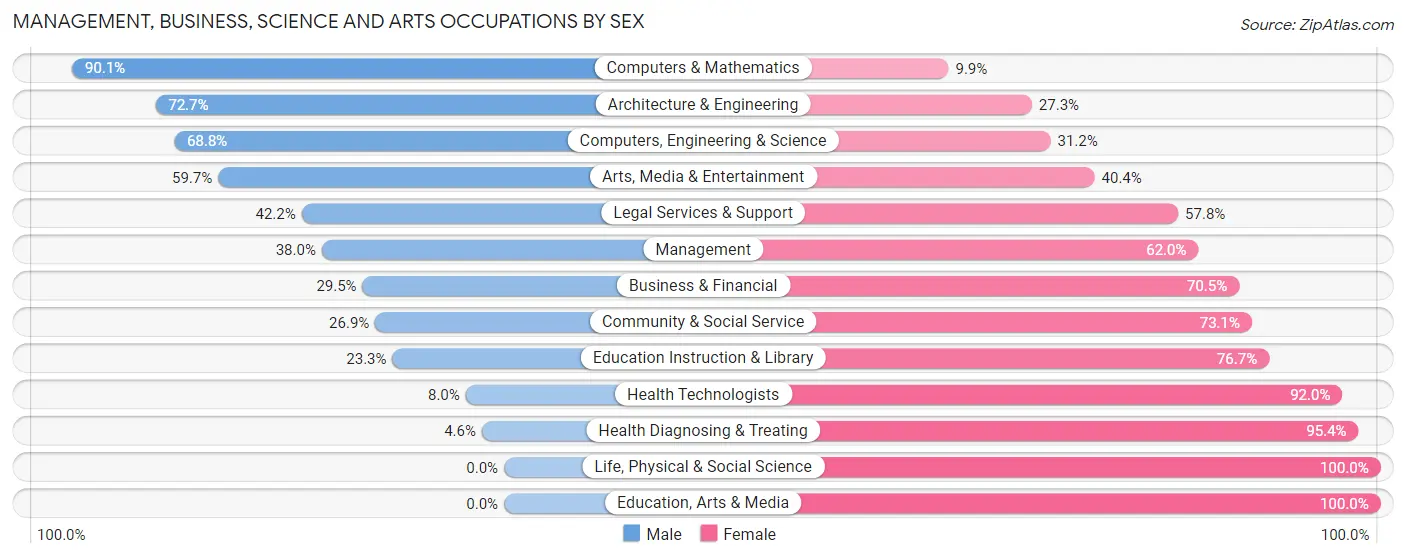
Management, Business, Science and Arts Occupations by Sex
Within the Management, Business, Science and Arts occupations in Lapeer, the most male-oriented occupations are Computers & Mathematics (90.1%), Architecture & Engineering (72.7%), and Computers, Engineering & Science (68.8%), while the most female-oriented occupations are Life, Physical & Social Science (100.0%), Education, Arts & Media (100.0%), and Health Diagnosing & Treating (95.4%).
| Occupation | Male | Female |
| Management | 100 (38.0%) | 163 (62.0%) |
| Business & Financial | 31 (29.5%) | 74 (70.5%) |
| Computers, Engineering & Science | 137 (68.8%) | 62 (31.2%) |
| Computers & Mathematics | 73 (90.1%) | 8 (9.9%) |
| Architecture & Engineering | 64 (72.7%) | 24 (27.3%) |
| Life, Physical & Social Science | 0 (0.0%) | 30 (100.0%) |
| Community & Social Service | 97 (26.9%) | 264 (73.1%) |
| Education, Arts & Media | 0 (0.0%) | 70 (100.0%) |
| Legal Services & Support | 19 (42.2%) | 26 (57.8%) |
| Education Instruction & Library | 44 (23.3%) | 145 (76.7%) |
| Arts, Media & Entertainment | 34 (59.7%) | 23 (40.4%) |
| Health Diagnosing & Treating | 6 (4.6%) | 124 (95.4%) |
| Health Technologists | 6 (8.0%) | 69 (92.0%) |
| Total (Category) | 371 (35.1%) | 687 (64.9%) |
| Total (Overall) | 1,794 (52.2%) | 1,642 (47.8%) |
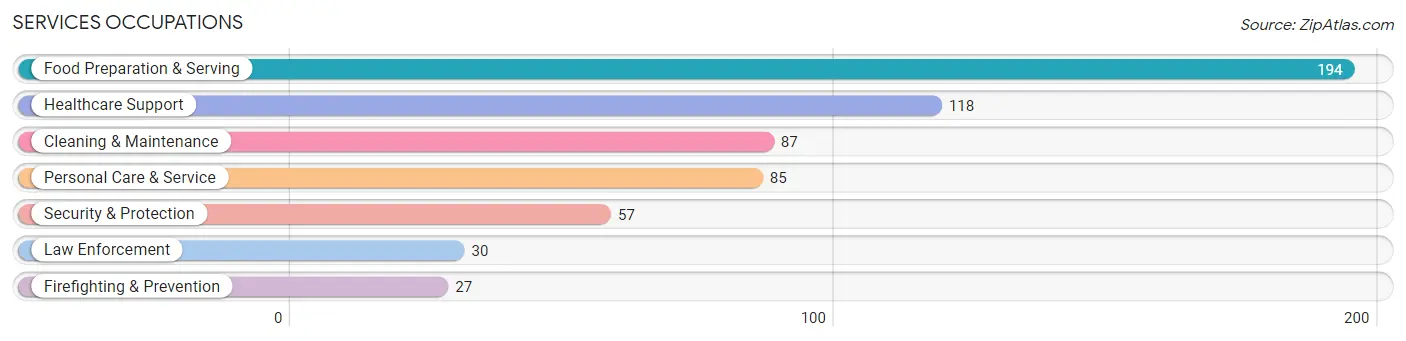
Services Occupations
The most common Services occupations in Lapeer are Food Preparation & Serving (194 | 5.7%), Healthcare Support (118 | 3.4%), Cleaning & Maintenance (87 | 2.5%), Personal Care & Service (85 | 2.5%), and Security & Protection (57 | 1.7%).
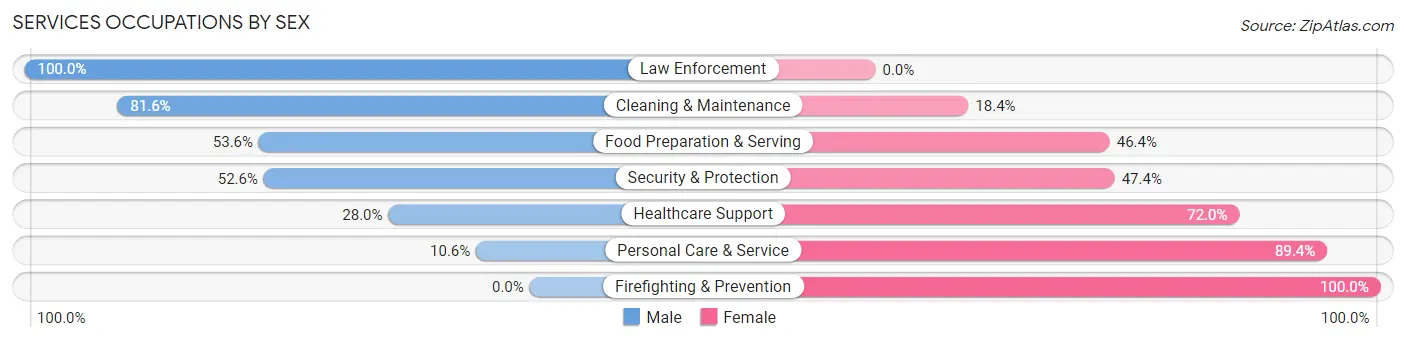
Services Occupations by Sex
Within the Services occupations in Lapeer, the most male-oriented occupations are Law Enforcement (100.0%), Cleaning & Maintenance (81.6%), and Food Preparation & Serving (53.6%), while the most female-oriented occupations are Firefighting & Prevention (100.0%), Personal Care & Service (89.4%), and Healthcare Support (72.0%).
| Occupation | Male | Female |
| Healthcare Support | 33 (28.0%) | 85 (72.0%) |
| Security & Protection | 30 (52.6%) | 27 (47.4%) |
| Firefighting & Prevention | 0 (0.0%) | 27 (100.0%) |
| Law Enforcement | 30 (100.0%) | 0 (0.0%) |
| Food Preparation & Serving | 104 (53.6%) | 90 (46.4%) |
| Cleaning & Maintenance | 71 (81.6%) | 16 (18.4%) |
| Personal Care & Service | 9 (10.6%) | 76 (89.4%) |
| Total (Category) | 247 (45.7%) | 294 (54.3%) |
| Total (Overall) | 1,794 (52.2%) | 1,642 (47.8%) |
Sales and Office Occupations
The most common Sales and Office occupations in Lapeer are Sales & Related (381 | 11.1%), and Office & Administration (324 | 9.4%).

Sales and Office Occupations by Sex
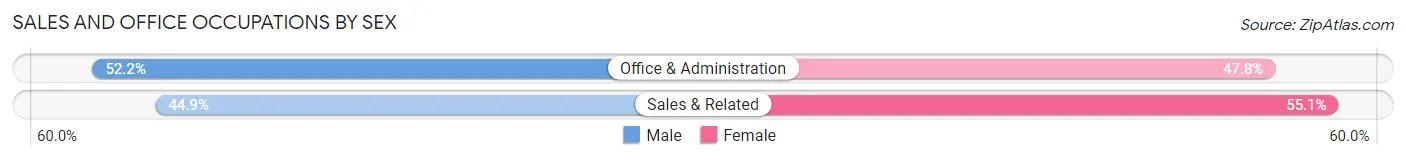
| Occupation | Male | Female |
| Sales & Related | 171 (44.9%) | 210 (55.1%) |
| Office & Administration | 169 (52.2%) | 155 (47.8%) |
| Total (Category) | 340 (48.2%) | 365 (51.8%) |
| Total (Overall) | 1,794 (52.2%) | 1,642 (47.8%) |
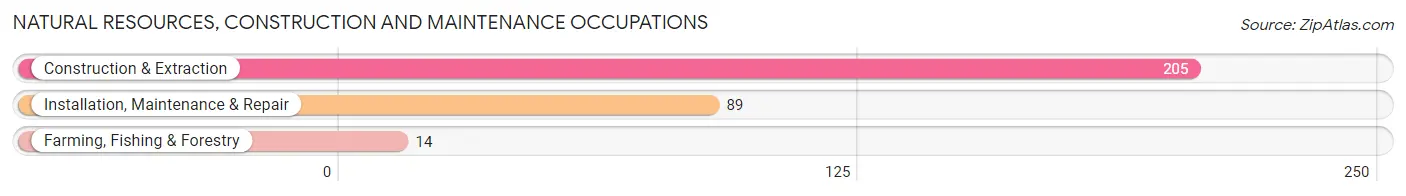
Natural Resources, Construction and Maintenance Occupations
The most common Natural Resources, Construction and Maintenance occupations in Lapeer are Construction & Extraction (205 | 6.0%), Installation, Maintenance & Repair (89 | 2.6%), and Farming, Fishing & Forestry (14 | 0.4%).
Natural Resources, Construction and Maintenance Occupations by Sex
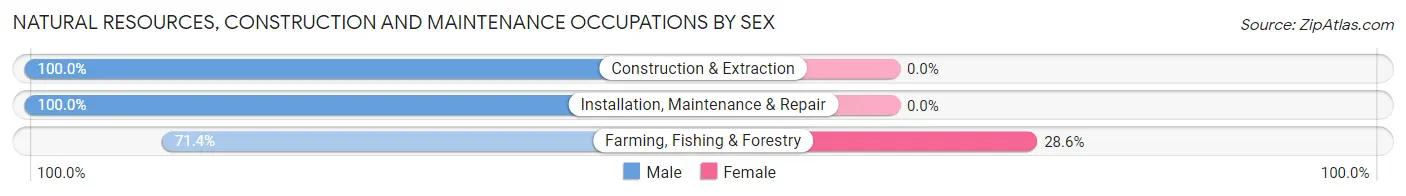
| Occupation | Male | Female |
| Farming, Fishing & Forestry | 10 (71.4%) | 4 (28.6%) |
| Construction & Extraction | 205 (100.0%) | 0 (0.0%) |
| Installation, Maintenance & Repair | 89 (100.0%) | 0 (0.0%) |
| Total (Category) | 304 (98.7%) | 4 (1.3%) |
| Total (Overall) | 1,794 (52.2%) | 1,642 (47.8%) |
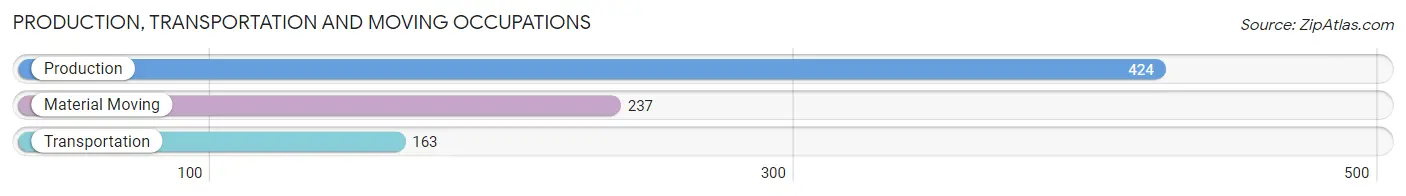
Production, Transportation and Moving Occupations
The most common Production, Transportation and Moving occupations in Lapeer are Production (424 | 12.3%), Material Moving (237 | 6.9%), and Transportation (163 | 4.7%).
Production, Transportation and Moving Occupations by Sex
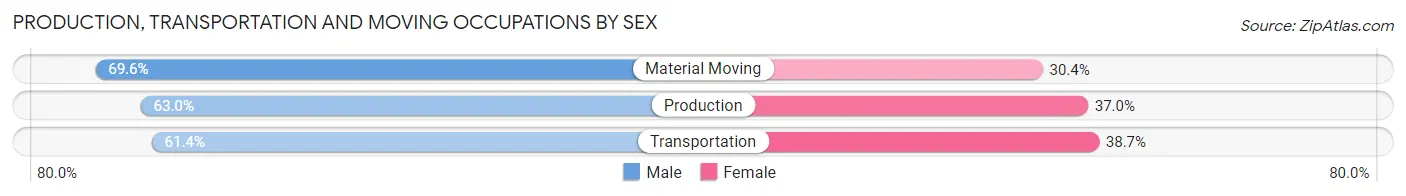
| Occupation | Male | Female |
| Production | 267 (63.0%) | 157 (37.0%) |
| Transportation | 100 (61.4%) | 63 (38.7%) |
| Material Moving | 165 (69.6%) | 72 (30.4%) |
| Total (Category) | 532 (64.6%) | 292 (35.4%) |
| Total (Overall) | 1,794 (52.2%) | 1,642 (47.8%) |
Employment Industries by Sex in Lapeer
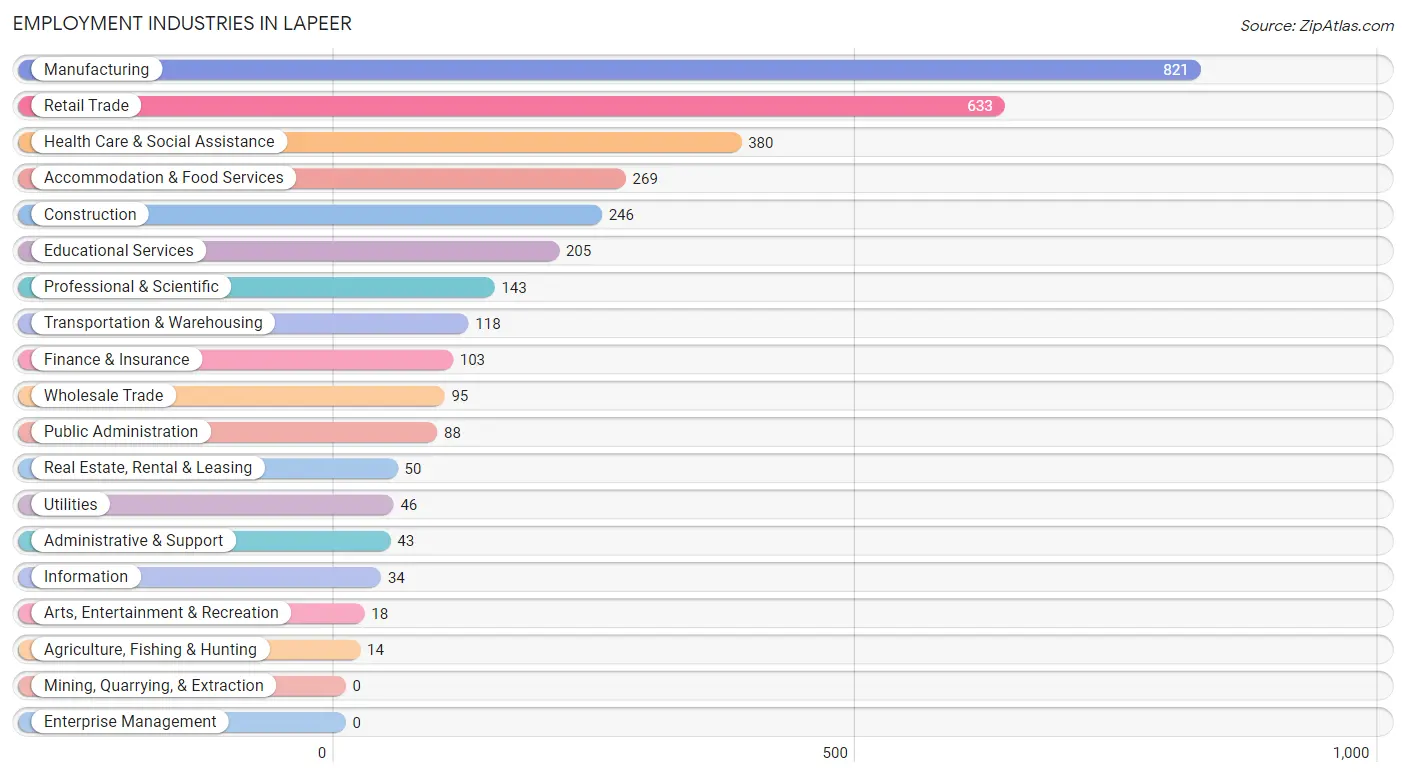
Employment Industries in Lapeer
The major employment industries in Lapeer include Manufacturing (821 | 23.9%), Retail Trade (633 | 18.4%), Health Care & Social Assistance (380 | 11.1%), Accommodation & Food Services (269 | 7.8%), and Construction (246 | 7.2%).
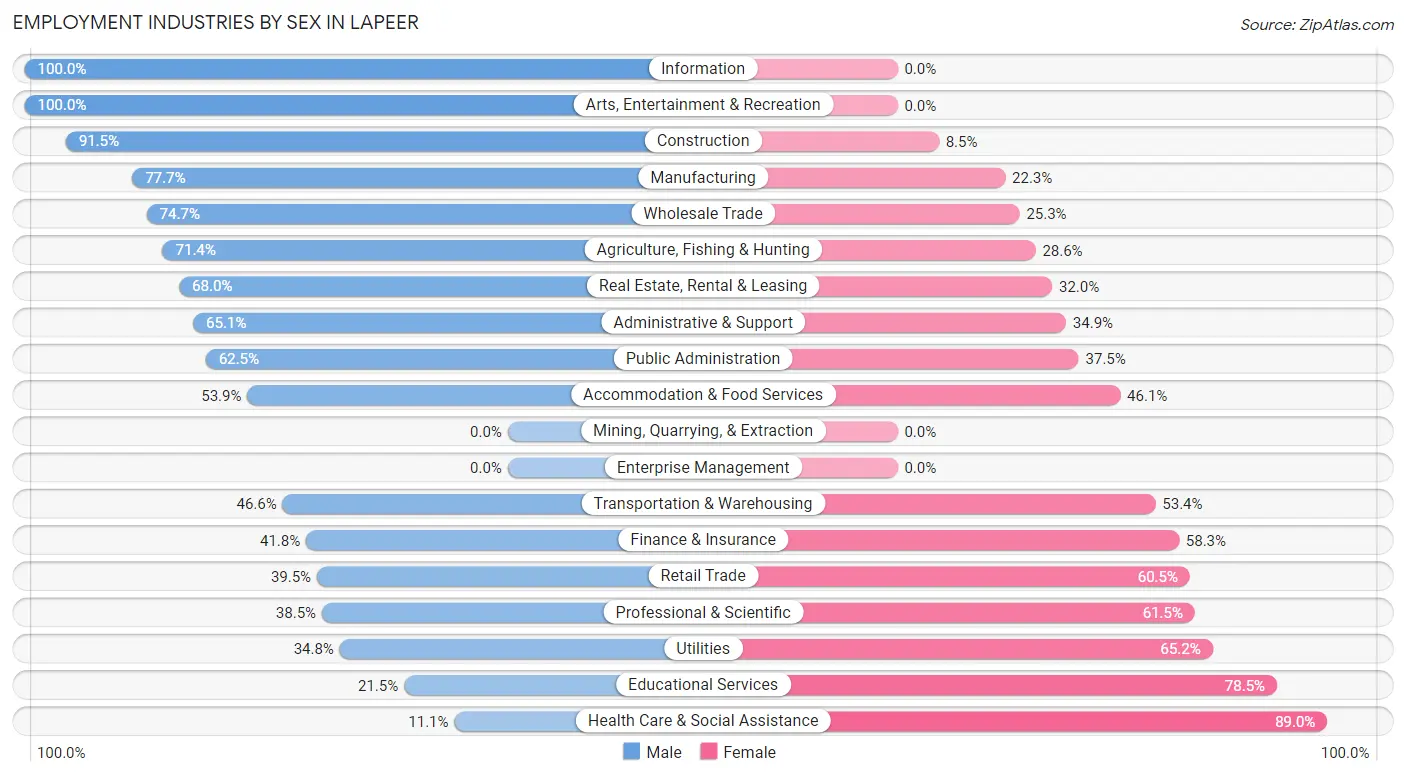
Employment Industries by Sex in Lapeer
The Lapeer industries that see more men than women are Information (100.0%), Arts, Entertainment & Recreation (100.0%), and Construction (91.5%), whereas the industries that tend to have a higher number of women are Health Care & Social Assistance (88.9%), Educational Services (78.5%), and Utilities (65.2%).
| Industry | Male | Female |
| Agriculture, Fishing & Hunting | 10 (71.4%) | 4 (28.6%) |
| Mining, Quarrying, & Extraction | 0 (0.0%) | 0 (0.0%) |
| Construction | 225 (91.5%) | 21 (8.5%) |
| Manufacturing | 638 (77.7%) | 183 (22.3%) |
| Wholesale Trade | 71 (74.7%) | 24 (25.3%) |
| Retail Trade | 250 (39.5%) | 383 (60.5%) |
| Transportation & Warehousing | 55 (46.6%) | 63 (53.4%) |
| Utilities | 16 (34.8%) | 30 (65.2%) |
| Information | 34 (100.0%) | 0 (0.0%) |
| Finance & Insurance | 43 (41.7%) | 60 (58.3%) |
| Real Estate, Rental & Leasing | 34 (68.0%) | 16 (32.0%) |
| Professional & Scientific | 55 (38.5%) | 88 (61.5%) |
| Enterprise Management | 0 (0.0%) | 0 (0.0%) |
| Administrative & Support | 28 (65.1%) | 15 (34.9%) |
| Educational Services | 44 (21.5%) | 161 (78.5%) |
| Health Care & Social Assistance | 42 (11.1%) | 338 (88.9%) |
| Arts, Entertainment & Recreation | 18 (100.0%) | 0 (0.0%) |
| Accommodation & Food Services | 145 (53.9%) | 124 (46.1%) |
| Public Administration | 55 (62.5%) | 33 (37.5%) |
| Total | 1,794 (52.2%) | 1,642 (47.8%) |
Education in Lapeer
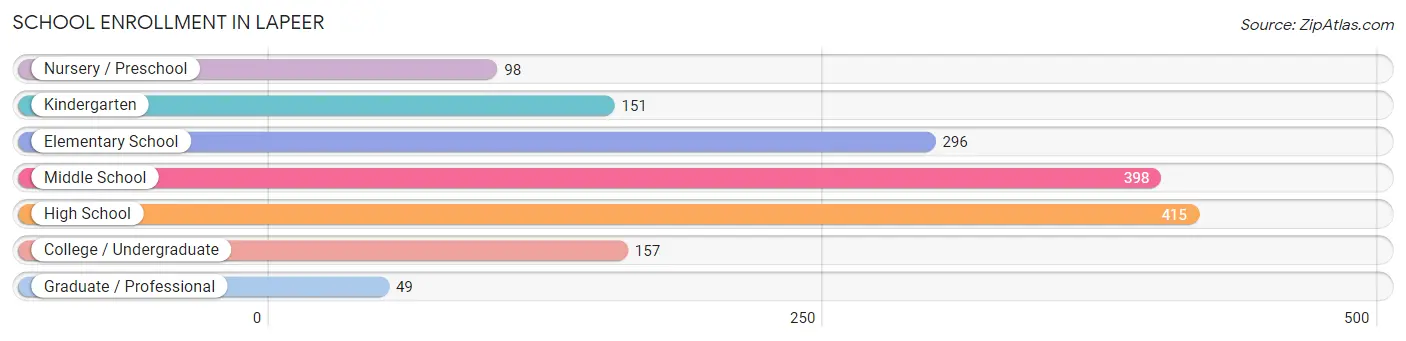
School Enrollment in Lapeer
The most common levels of schooling among the 1,564 students in Lapeer are high school (415 | 26.5%), middle school (398 | 25.5%), and elementary school (296 | 18.9%).
| School Level | # Students | % Students |
| Nursery / Preschool | 98 | 6.3% |
| Kindergarten | 151 | 9.7% |
| Elementary School | 296 | 18.9% |
| Middle School | 398 | 25.5% |
| High School | 415 | 26.5% |
| College / Undergraduate | 157 | 10.0% |
| Graduate / Professional | 49 | 3.1% |
| Total | 1,564 | 100.0% |
School Enrollment by Age by Funding Source in Lapeer
Out of a total of 1,564 students who are enrolled in schools in Lapeer, 380 (24.3%) attend a private institution, while the remaining 1,184 (75.7%) are enrolled in public schools. The age group of 3 to 4 year olds has the highest likelihood of being enrolled in private schools, with 36 (69.2% in the age bracket) enrolled. Conversely, the age group of 25 to 34 year olds has the lowest likelihood of being enrolled in a private school, with 27 (100.0% in the age bracket) attending a public institution.
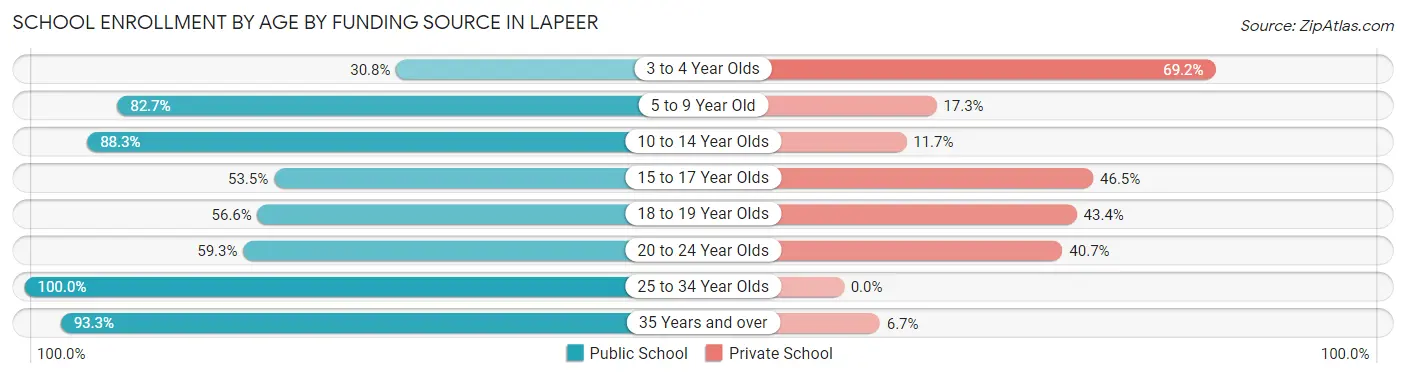
| Age Bracket | Public School | Private School |
| 3 to 4 Year Olds | 16 (30.8%) | 36 (69.2%) |
| 5 to 9 Year Old | 359 (82.7%) | 75 (17.3%) |
| 10 to 14 Year Olds | 424 (88.3%) | 56 (11.7%) |
| 15 to 17 Year Olds | 121 (53.5%) | 105 (46.5%) |
| 18 to 19 Year Olds | 60 (56.6%) | 46 (43.4%) |
| 20 to 24 Year Olds | 80 (59.3%) | 55 (40.7%) |
| 25 to 34 Year Olds | 27 (100.0%) | 0 (0.0%) |
| 35 Years and over | 97 (93.3%) | 7 (6.7%) |
| Total | 1,184 (75.7%) | 380 (24.3%) |
Educational Attainment by Field of Study in Lapeer
Business (170 | 17.0%), education (169 | 16.9%), science & technology (128 | 12.8%), arts & humanities (97 | 9.7%), and engineering (81 | 8.1%) are the most common fields of study among 1,003 individuals in Lapeer who have obtained a bachelor's degree or higher.
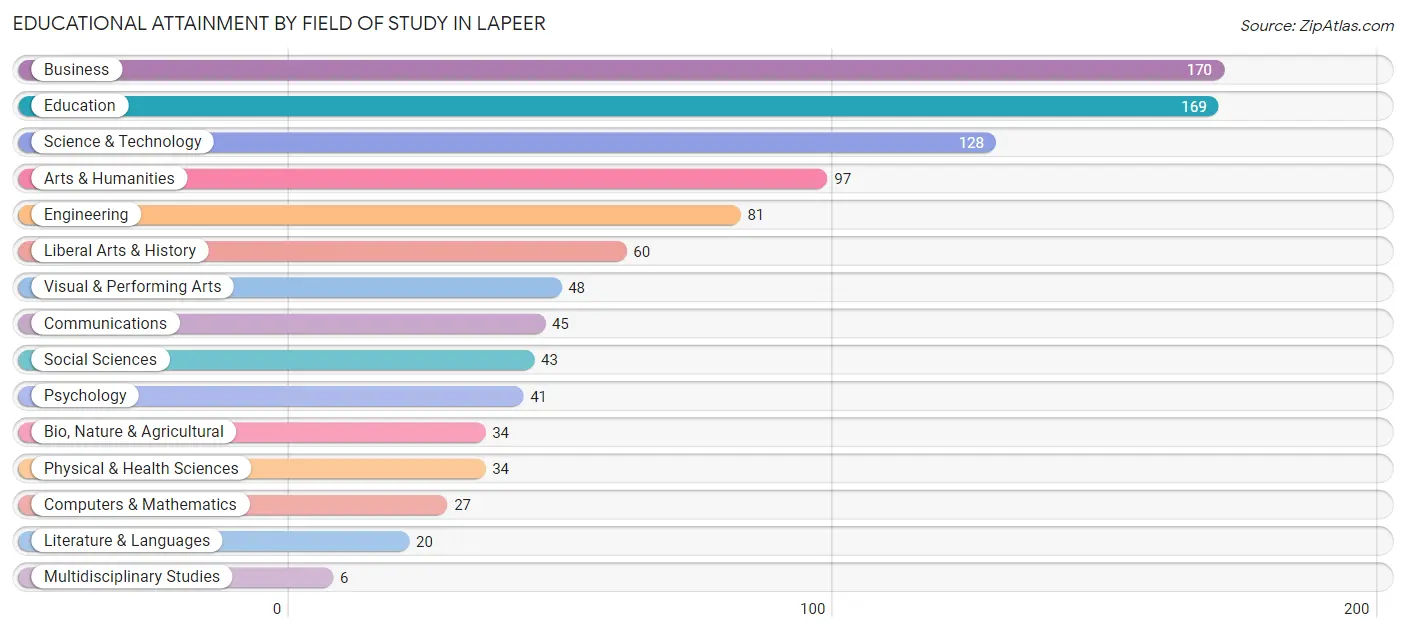
| Field of Study | # Graduates | % Graduates |
| Computers & Mathematics | 27 | 2.7% |
| Bio, Nature & Agricultural | 34 | 3.4% |
| Physical & Health Sciences | 34 | 3.4% |
| Psychology | 41 | 4.1% |
| Social Sciences | 43 | 4.3% |
| Engineering | 81 | 8.1% |
| Multidisciplinary Studies | 6 | 0.6% |
| Science & Technology | 128 | 12.8% |
| Business | 170 | 17.0% |
| Education | 169 | 16.9% |
| Literature & Languages | 20 | 2.0% |
| Liberal Arts & History | 60 | 6.0% |
| Visual & Performing Arts | 48 | 4.8% |
| Communications | 45 | 4.5% |
| Arts & Humanities | 97 | 9.7% |
| Total | 1,003 | 100.0% |
Transportation & Commute in Lapeer
Vehicle Availability by Sex in Lapeer
The most prevalent vehicle ownership categories in Lapeer are males with 2 vehicles (812, accounting for 45.5%) and females with 2 vehicles (716, making up 50.8%).
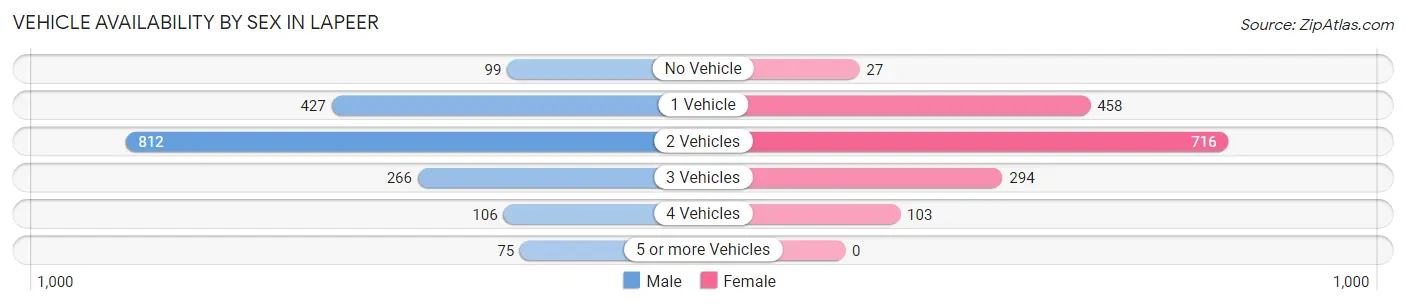
| Vehicles Available | Male | Female |
| No Vehicle | 99 (5.6%) | 27 (1.7%) |
| 1 Vehicle | 427 (23.9%) | 458 (28.7%) |
| 2 Vehicles | 812 (45.5%) | 716 (44.8%) |
| 3 Vehicles | 266 (14.9%) | 294 (18.4%) |
| 4 Vehicles | 106 (5.9%) | 103 (6.5%) |
| 5 or more Vehicles | 75 (4.2%) | 0 (0.0%) |
| Total | 1,785 (100.0%) | 1,598 (100.0%) |
Commute Time in Lapeer
The most frequently occuring commute durations in Lapeer are 10 to 14 minutes (592 commuters, 18.4%), 5 to 9 minutes (510 commuters, 15.8%), and 45 to 59 minutes (311 commuters, 9.7%).
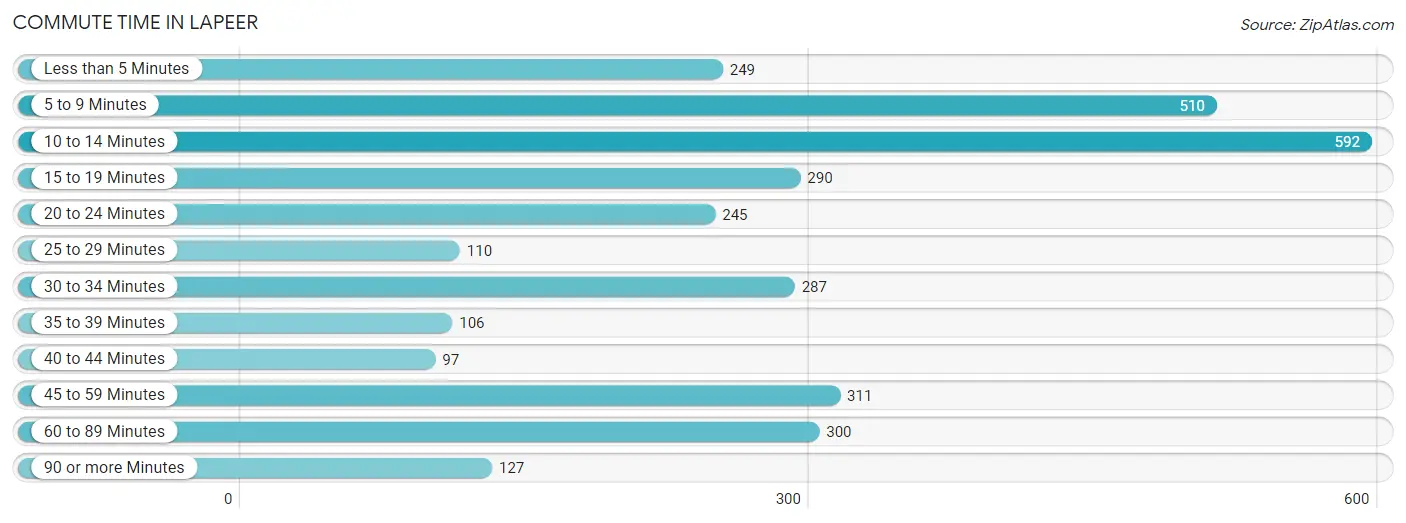
| Commute Time | # Commuters | % Commuters |
| Less than 5 Minutes | 249 | 7.7% |
| 5 to 9 Minutes | 510 | 15.8% |
| 10 to 14 Minutes | 592 | 18.4% |
| 15 to 19 Minutes | 290 | 9.0% |
| 20 to 24 Minutes | 245 | 7.6% |
| 25 to 29 Minutes | 110 | 3.4% |
| 30 to 34 Minutes | 287 | 8.9% |
| 35 to 39 Minutes | 106 | 3.3% |
| 40 to 44 Minutes | 97 | 3.0% |
| 45 to 59 Minutes | 311 | 9.7% |
| 60 to 89 Minutes | 300 | 9.3% |
| 90 or more Minutes | 127 | 3.9% |
Commute Time by Sex in Lapeer
The most common commute times in Lapeer are 10 to 14 minutes (326 commuters, 18.7%) for males and 10 to 14 minutes (266 commuters, 18.0%) for females.
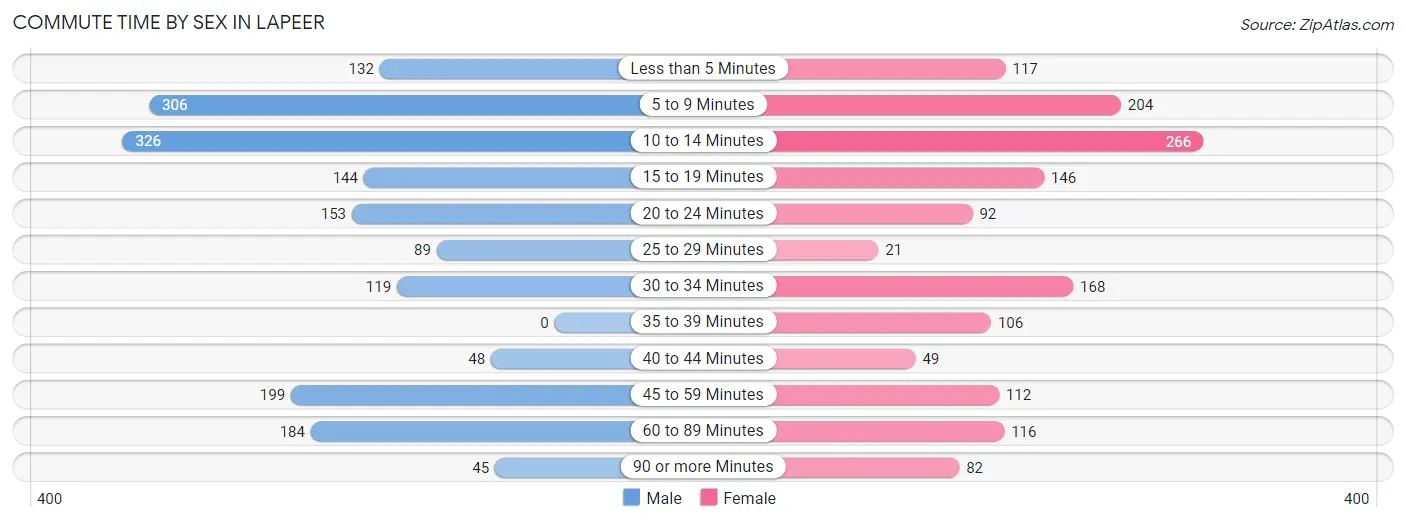
| Commute Time | Male | Female |
| Less than 5 Minutes | 132 (7.6%) | 117 (7.9%) |
| 5 to 9 Minutes | 306 (17.5%) | 204 (13.8%) |
| 10 to 14 Minutes | 326 (18.7%) | 266 (18.0%) |
| 15 to 19 Minutes | 144 (8.3%) | 146 (9.9%) |
| 20 to 24 Minutes | 153 (8.8%) | 92 (6.2%) |
| 25 to 29 Minutes | 89 (5.1%) | 21 (1.4%) |
| 30 to 34 Minutes | 119 (6.8%) | 168 (11.4%) |
| 35 to 39 Minutes | 0 (0.0%) | 106 (7.2%) |
| 40 to 44 Minutes | 48 (2.8%) | 49 (3.3%) |
| 45 to 59 Minutes | 199 (11.4%) | 112 (7.6%) |
| 60 to 89 Minutes | 184 (10.5%) | 116 (7.8%) |
| 90 or more Minutes | 45 (2.6%) | 82 (5.5%) |
Time of Departure to Work by Sex in Lapeer
The most frequent times of departure to work in Lapeer are 7:00 AM to 7:29 AM (228, 13.1%) for males and 7:30 AM to 7:59 AM (221, 14.9%) for females.
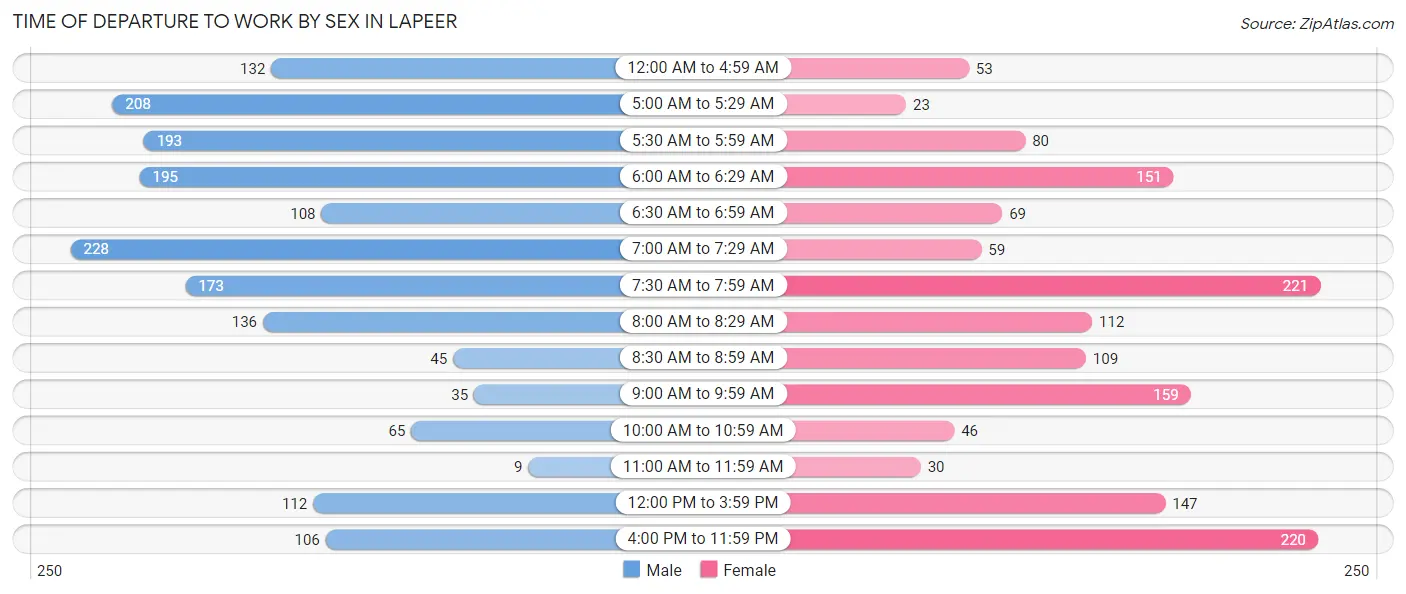
| Time of Departure | Male | Female |
| 12:00 AM to 4:59 AM | 132 (7.6%) | 53 (3.6%) |
| 5:00 AM to 5:29 AM | 208 (11.9%) | 23 (1.6%) |
| 5:30 AM to 5:59 AM | 193 (11.1%) | 80 (5.4%) |
| 6:00 AM to 6:29 AM | 195 (11.2%) | 151 (10.2%) |
| 6:30 AM to 6:59 AM | 108 (6.2%) | 69 (4.7%) |
| 7:00 AM to 7:29 AM | 228 (13.1%) | 59 (4.0%) |
| 7:30 AM to 7:59 AM | 173 (9.9%) | 221 (14.9%) |
| 8:00 AM to 8:29 AM | 136 (7.8%) | 112 (7.6%) |
| 8:30 AM to 8:59 AM | 45 (2.6%) | 109 (7.4%) |
| 9:00 AM to 9:59 AM | 35 (2.0%) | 159 (10.7%) |
| 10:00 AM to 10:59 AM | 65 (3.7%) | 46 (3.1%) |
| 11:00 AM to 11:59 AM | 9 (0.5%) | 30 (2.0%) |
| 12:00 PM to 3:59 PM | 112 (6.4%) | 147 (9.9%) |
| 4:00 PM to 11:59 PM | 106 (6.1%) | 220 (14.9%) |
| Total | 1,745 (100.0%) | 1,479 (100.0%) |
Housing Occupancy in Lapeer
Occupancy by Ownership in Lapeer
Of the total 3,652 dwellings in Lapeer, owner-occupied units account for 1,827 (50.0%), while renter-occupied units make up 1,825 (50.0%).
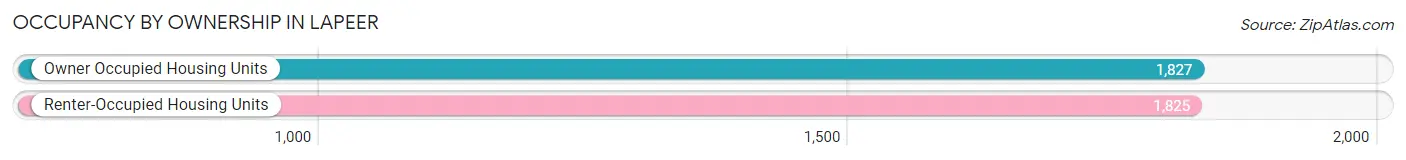
| Occupancy | # Housing Units | % Housing Units |
| Owner Occupied Housing Units | 1,827 | 50.0% |
| Renter-Occupied Housing Units | 1,825 | 50.0% |
| Total Occupied Housing Units | 3,652 | 100.0% |
Occupancy by Household Size in Lapeer
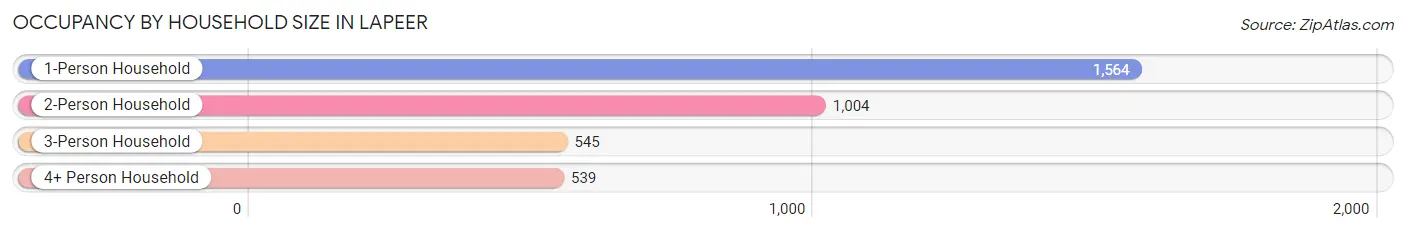
| Household Size | # Housing Units | % Housing Units |
| 1-Person Household | 1,564 | 42.8% |
| 2-Person Household | 1,004 | 27.5% |
| 3-Person Household | 545 | 14.9% |
| 4+ Person Household | 539 | 14.8% |
| Total Housing Units | 3,652 | 100.0% |
Occupancy by Ownership by Household Size in Lapeer
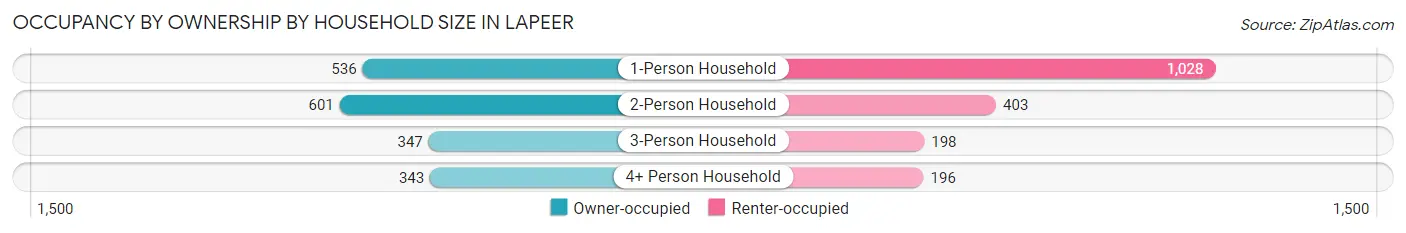
| Household Size | Owner-occupied | Renter-occupied |
| 1-Person Household | 536 (34.3%) | 1,028 (65.7%) |
| 2-Person Household | 601 (59.9%) | 403 (40.1%) |
| 3-Person Household | 347 (63.7%) | 198 (36.3%) |
| 4+ Person Household | 343 (63.6%) | 196 (36.4%) |
| Total Housing Units | 1,827 (50.0%) | 1,825 (50.0%) |
Occupancy by Educational Attainment in Lapeer
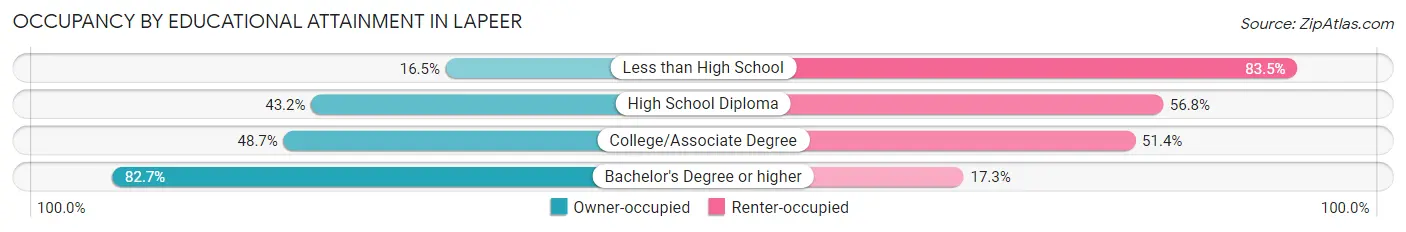
| Household Size | Owner-occupied | Renter-occupied |
| Less than High School | 62 (16.5%) | 314 (83.5%) |
| High School Diploma | 508 (43.2%) | 669 (56.8%) |
| College/Associate Degree | 684 (48.6%) | 722 (51.3%) |
| Bachelor's Degree or higher | 573 (82.7%) | 120 (17.3%) |
Occupancy by Age of Householder in Lapeer
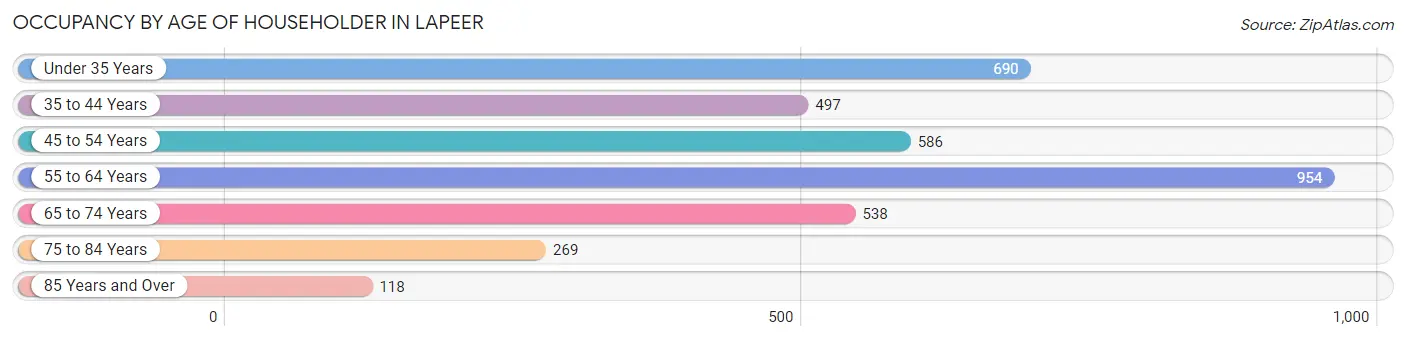
| Age Bracket | # Households | % Households |
| Under 35 Years | 690 | 18.9% |
| 35 to 44 Years | 497 | 13.6% |
| 45 to 54 Years | 586 | 16.1% |
| 55 to 64 Years | 954 | 26.1% |
| 65 to 74 Years | 538 | 14.7% |
| 75 to 84 Years | 269 | 7.4% |
| 85 Years and Over | 118 | 3.2% |
| Total | 3,652 | 100.0% |
Housing Finances in Lapeer
Median Income by Occupancy in Lapeer
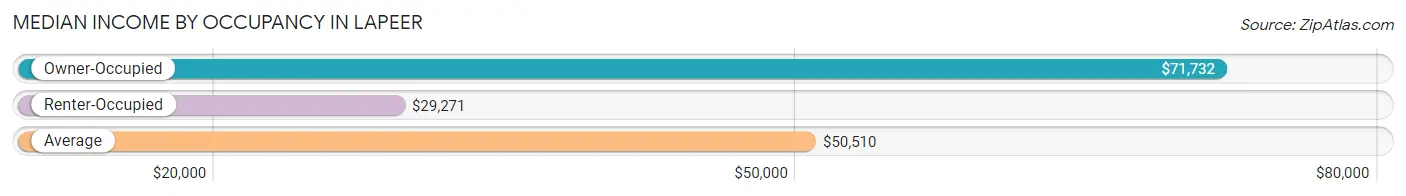
| Occupancy Type | # Households | Median Income |
| Owner-Occupied | 1,827 (50.0%) | $71,732 |
| Renter-Occupied | 1,825 (50.0%) | $29,271 |
| Average | 3,652 (100.0%) | $50,510 |
Occupancy by Householder Income Bracket in Lapeer
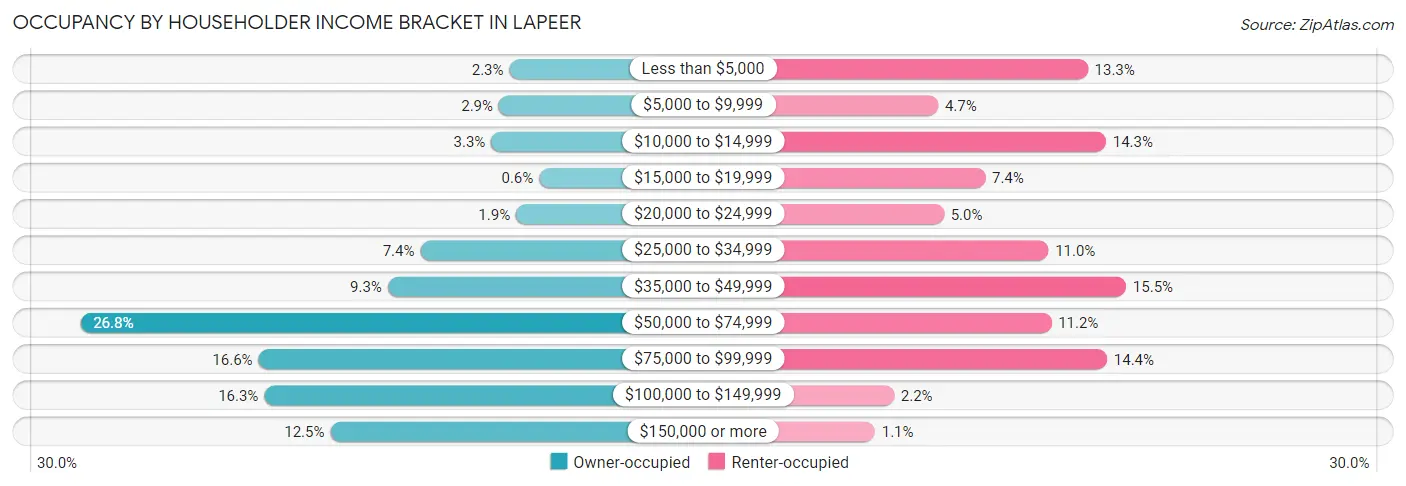
| Income Bracket | Owner-occupied | Renter-occupied |
| Less than $5,000 | 42 (2.3%) | 242 (13.3%) |
| $5,000 to $9,999 | 53 (2.9%) | 86 (4.7%) |
| $10,000 to $14,999 | 61 (3.3%) | 261 (14.3%) |
| $15,000 to $19,999 | 11 (0.6%) | 135 (7.4%) |
| $20,000 to $24,999 | 35 (1.9%) | 92 (5.0%) |
| $25,000 to $34,999 | 135 (7.4%) | 201 (11.0%) |
| $35,000 to $49,999 | 169 (9.2%) | 282 (15.4%) |
| $50,000 to $74,999 | 490 (26.8%) | 204 (11.2%) |
| $75,000 to $99,999 | 304 (16.6%) | 262 (14.4%) |
| $100,000 to $149,999 | 298 (16.3%) | 40 (2.2%) |
| $150,000 or more | 229 (12.5%) | 20 (1.1%) |
| Total | 1,827 (100.0%) | 1,825 (100.0%) |
Monthly Housing Cost Tiers in Lapeer
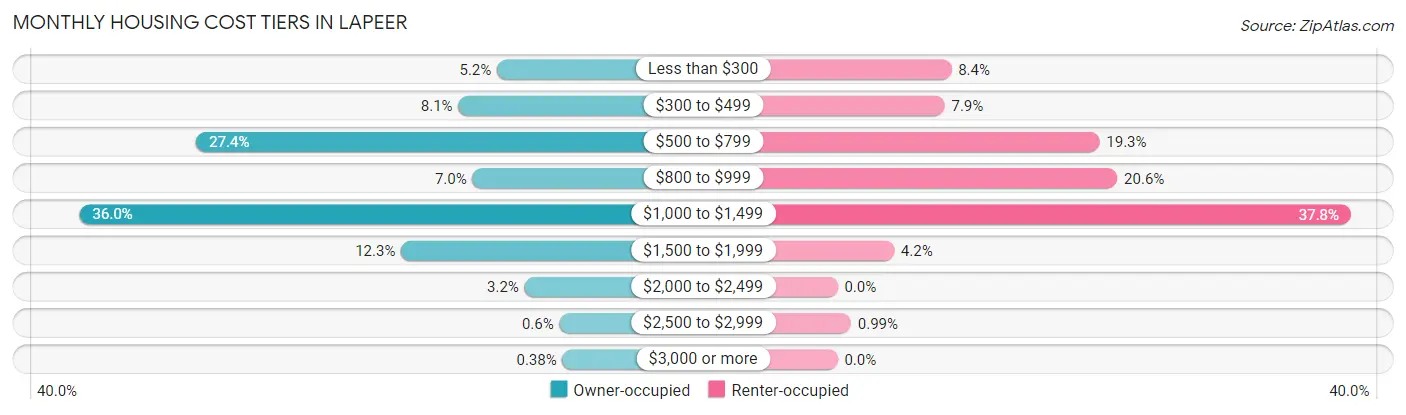
| Monthly Cost | Owner-occupied | Renter-occupied |
| Less than $300 | 95 (5.2%) | 153 (8.4%) |
| $300 to $499 | 147 (8.1%) | 144 (7.9%) |
| $500 to $799 | 500 (27.4%) | 352 (19.3%) |
| $800 to $999 | 128 (7.0%) | 376 (20.6%) |
| $1,000 to $1,499 | 657 (36.0%) | 690 (37.8%) |
| $1,500 to $1,999 | 224 (12.3%) | 76 (4.2%) |
| $2,000 to $2,499 | 58 (3.2%) | 0 (0.0%) |
| $2,500 to $2,999 | 11 (0.6%) | 18 (1.0%) |
| $3,000 or more | 7 (0.4%) | 0 (0.0%) |
| Total | 1,827 (100.0%) | 1,825 (100.0%) |
Physical Housing Characteristics in Lapeer
Housing Structures in Lapeer
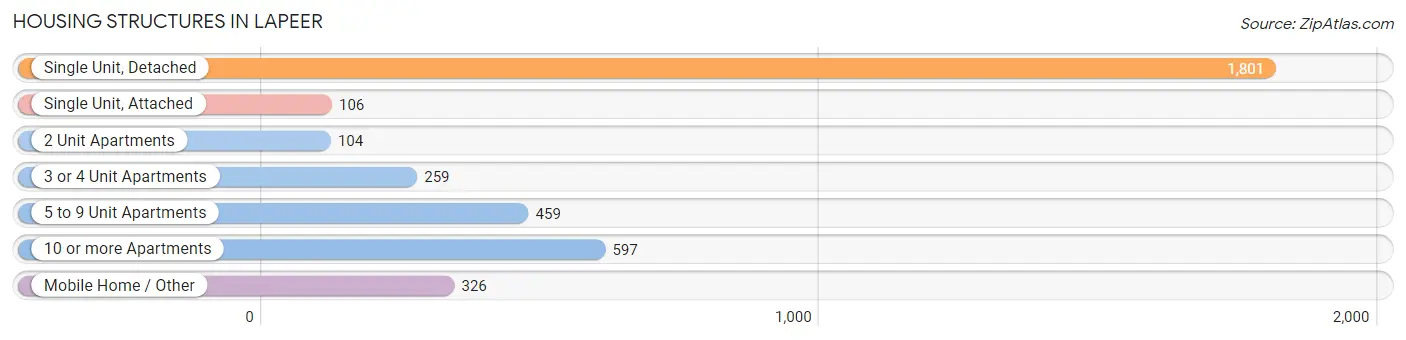
| Structure Type | # Housing Units | % Housing Units |
| Single Unit, Detached | 1,801 | 49.3% |
| Single Unit, Attached | 106 | 2.9% |
| 2 Unit Apartments | 104 | 2.9% |
| 3 or 4 Unit Apartments | 259 | 7.1% |
| 5 to 9 Unit Apartments | 459 | 12.6% |
| 10 or more Apartments | 597 | 16.4% |
| Mobile Home / Other | 326 | 8.9% |
| Total | 3,652 | 100.0% |
Housing Structures by Occupancy in Lapeer
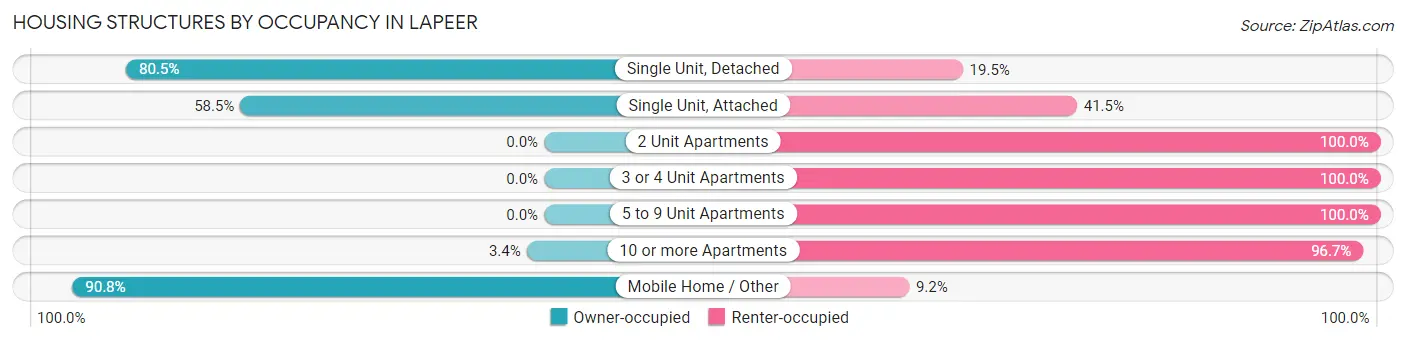
| Structure Type | Owner-occupied | Renter-occupied |
| Single Unit, Detached | 1,449 (80.5%) | 352 (19.5%) |
| Single Unit, Attached | 62 (58.5%) | 44 (41.5%) |
| 2 Unit Apartments | 0 (0.0%) | 104 (100.0%) |
| 3 or 4 Unit Apartments | 0 (0.0%) | 259 (100.0%) |
| 5 to 9 Unit Apartments | 0 (0.0%) | 459 (100.0%) |
| 10 or more Apartments | 20 (3.4%) | 577 (96.7%) |
| Mobile Home / Other | 296 (90.8%) | 30 (9.2%) |
| Total | 1,827 (50.0%) | 1,825 (50.0%) |
Housing Structures by Number of Rooms in Lapeer
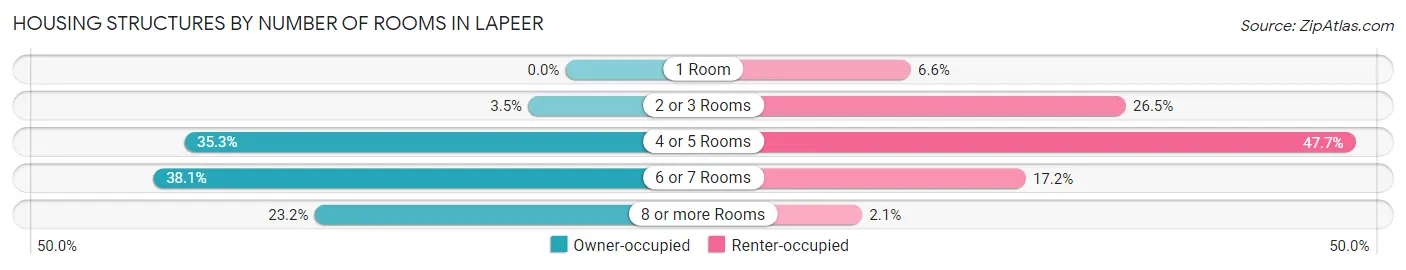
| Number of Rooms | Owner-occupied | Renter-occupied |
| 1 Room | 0 (0.0%) | 120 (6.6%) |
| 2 or 3 Rooms | 63 (3.5%) | 483 (26.5%) |
| 4 or 5 Rooms | 644 (35.2%) | 870 (47.7%) |
| 6 or 7 Rooms | 696 (38.1%) | 314 (17.2%) |
| 8 or more Rooms | 424 (23.2%) | 38 (2.1%) |
| Total | 1,827 (100.0%) | 1,825 (100.0%) |
Housing Structure by Heating Type in Lapeer
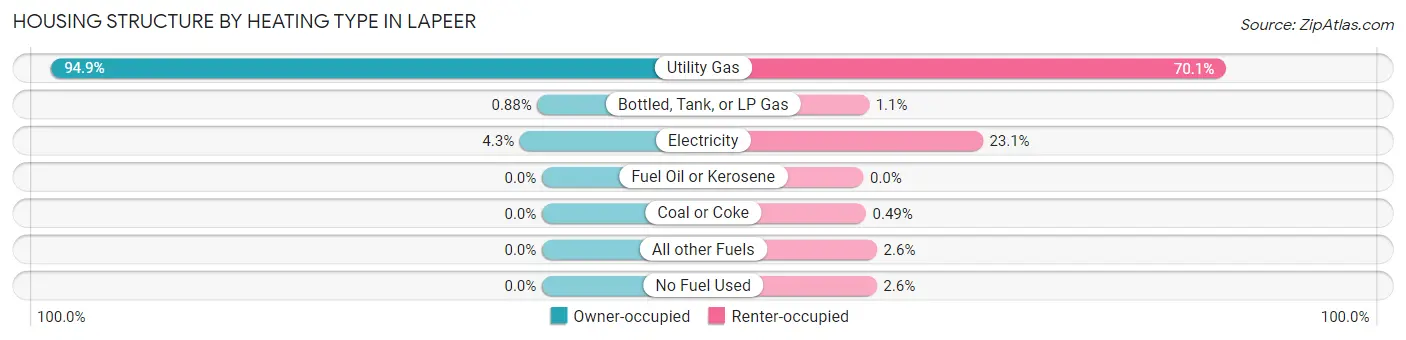
| Heating Type | Owner-occupied | Renter-occupied |
| Utility Gas | 1,733 (94.9%) | 1,280 (70.1%) |
| Bottled, Tank, or LP Gas | 16 (0.9%) | 20 (1.1%) |
| Electricity | 78 (4.3%) | 421 (23.1%) |
| Fuel Oil or Kerosene | 0 (0.0%) | 0 (0.0%) |
| Coal or Coke | 0 (0.0%) | 9 (0.5%) |
| All other Fuels | 0 (0.0%) | 48 (2.6%) |
| No Fuel Used | 0 (0.0%) | 47 (2.6%) |
| Total | 1,827 (100.0%) | 1,825 (100.0%) |
Household Vehicle Usage in Lapeer
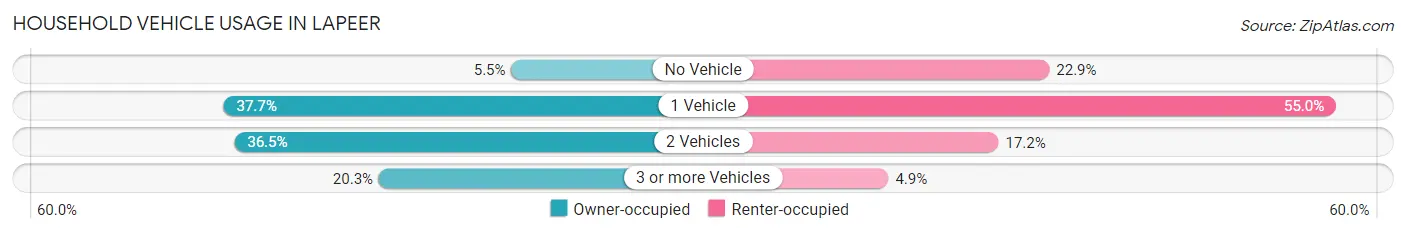
| Vehicles per Household | Owner-occupied | Renter-occupied |
| No Vehicle | 100 (5.5%) | 418 (22.9%) |
| 1 Vehicle | 689 (37.7%) | 1,004 (55.0%) |
| 2 Vehicles | 667 (36.5%) | 314 (17.2%) |
| 3 or more Vehicles | 371 (20.3%) | 89 (4.9%) |
| Total | 1,827 (100.0%) | 1,825 (100.0%) |
Real Estate & Mortgages in Lapeer
Real Estate and Mortgage Overview in Lapeer
| Characteristic | Without Mortgage | With Mortgage |
| Housing Units | 683 | 1,144 |
| Median Property Value | $100,200 | $162,400 |
| Median Household Income | $46,827 | $171 |
| Monthly Housing Costs | $549 | $7 |
| Real Estate Taxes | $2,019 | $123 |
Property Value by Mortgage Status in Lapeer
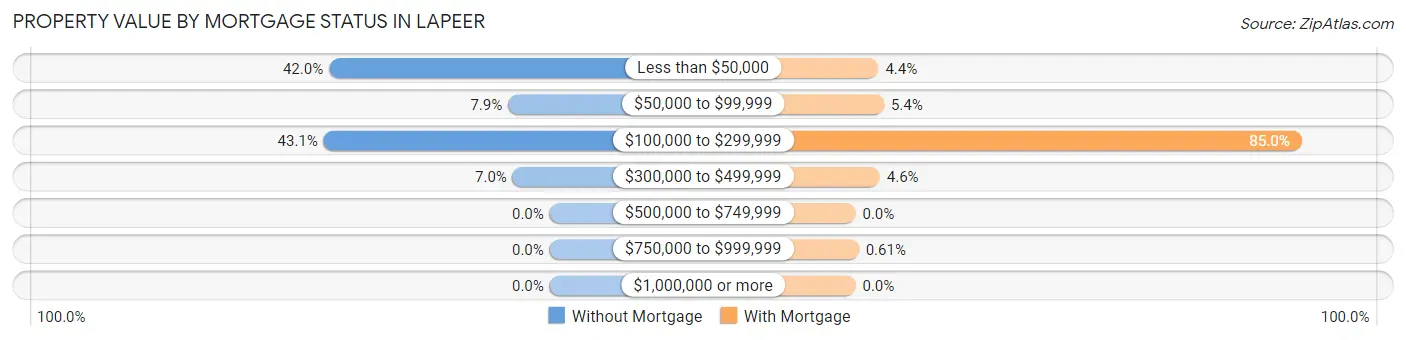
| Property Value | Without Mortgage | With Mortgage |
| Less than $50,000 | 287 (42.0%) | 50 (4.4%) |
| $50,000 to $99,999 | 54 (7.9%) | 62 (5.4%) |
| $100,000 to $299,999 | 294 (43.0%) | 972 (85.0%) |
| $300,000 to $499,999 | 48 (7.0%) | 53 (4.6%) |
| $500,000 to $749,999 | 0 (0.0%) | 0 (0.0%) |
| $750,000 to $999,999 | 0 (0.0%) | 7 (0.6%) |
| $1,000,000 or more | 0 (0.0%) | 0 (0.0%) |
| Total | 683 (100.0%) | 1,144 (100.0%) |
Household Income by Mortgage Status in Lapeer
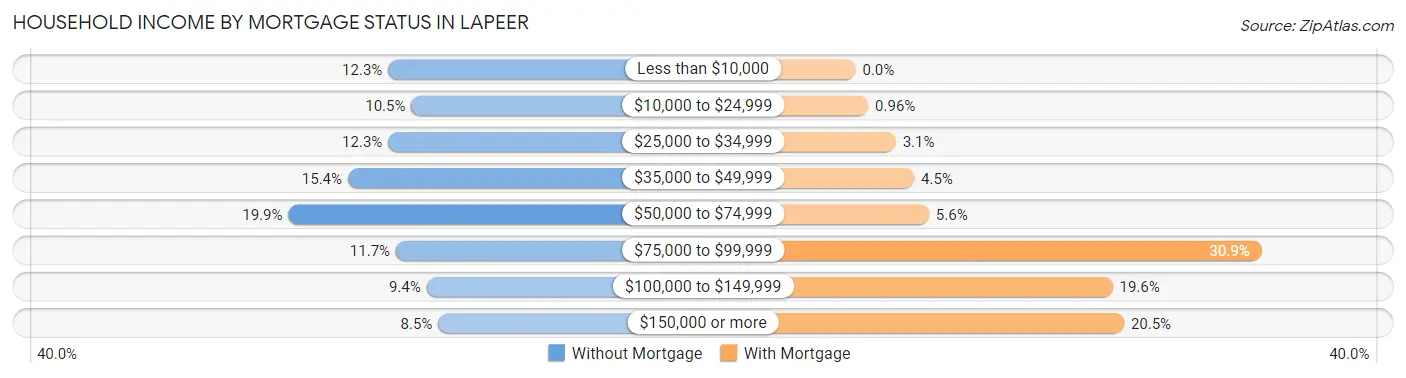
| Household Income | Without Mortgage | With Mortgage |
| Less than $10,000 | 84 (12.3%) | 0 (0.0%) |
| $10,000 to $24,999 | 72 (10.5%) | 11 (1.0%) |
| $25,000 to $34,999 | 84 (12.3%) | 35 (3.1%) |
| $35,000 to $49,999 | 105 (15.4%) | 51 (4.5%) |
| $50,000 to $74,999 | 136 (19.9%) | 64 (5.6%) |
| $75,000 to $99,999 | 80 (11.7%) | 354 (30.9%) |
| $100,000 to $149,999 | 64 (9.4%) | 224 (19.6%) |
| $150,000 or more | 58 (8.5%) | 234 (20.4%) |
| Total | 683 (100.0%) | 1,144 (100.0%) |
Property Value to Household Income Ratio in Lapeer
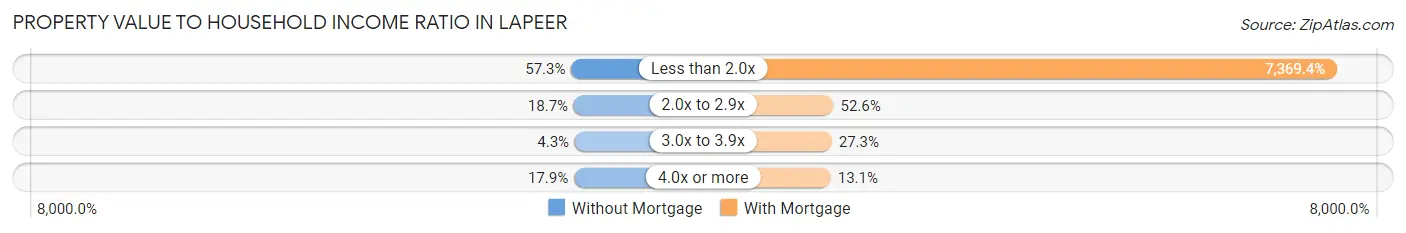
| Value-to-Income Ratio | Without Mortgage | With Mortgage |
| Less than 2.0x | 391 (57.3%) | 84,306 (7,369.4%) |
| 2.0x to 2.9x | 128 (18.7%) | 602 (52.6%) |
| 3.0x to 3.9x | 29 (4.3%) | 312 (27.3%) |
| 4.0x or more | 122 (17.9%) | 150 (13.1%) |
| Total | 683 (100.0%) | 1,144 (100.0%) |
Real Estate Taxes by Mortgage Status in Lapeer
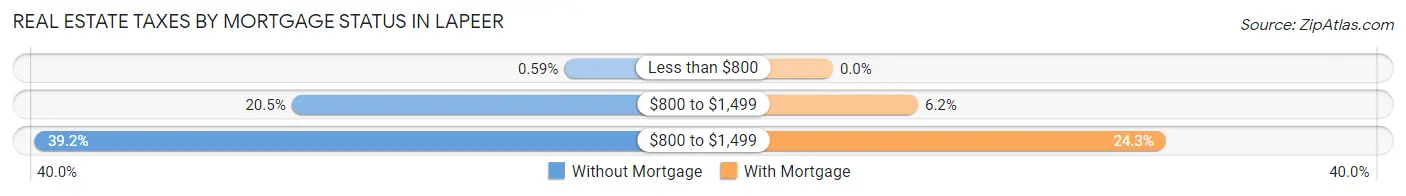
| Property Taxes | Without Mortgage | With Mortgage |
| Less than $800 | 4 (0.6%) | 0 (0.0%) |
| $800 to $1,499 | 140 (20.5%) | 71 (6.2%) |
| $800 to $1,499 | 268 (39.2%) | 278 (24.3%) |
| Total | 683 (100.0%) | 1,144 (100.0%) |
Health & Disability in Lapeer
Health Insurance Coverage by Age in Lapeer
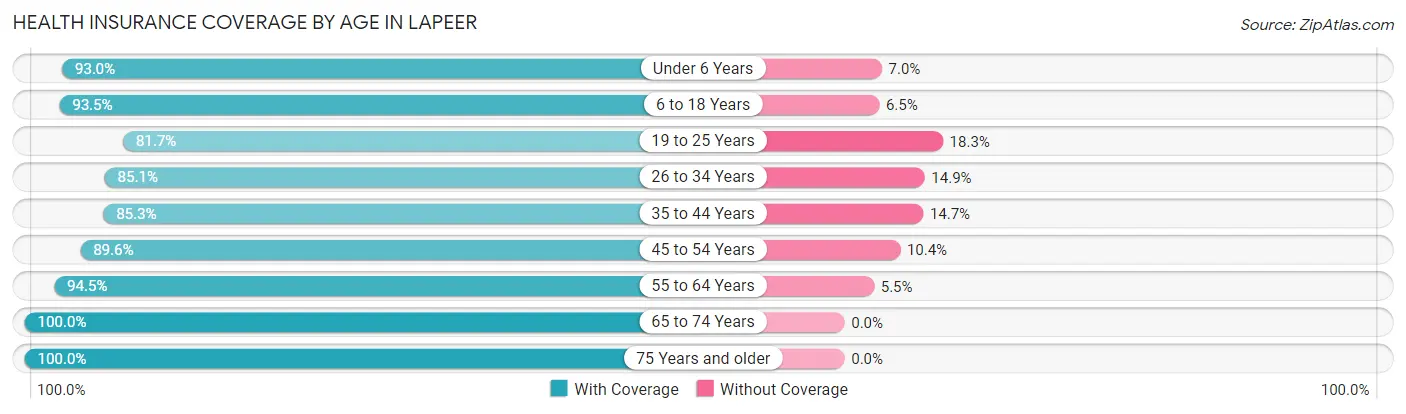
| Age Bracket | With Coverage | Without Coverage |
| Under 6 Years | 521 (93.0%) | 39 (7.0%) |
| 6 to 18 Years | 1,026 (93.5%) | 71 (6.5%) |
| 19 to 25 Years | 677 (81.7%) | 152 (18.3%) |
| 26 to 34 Years | 729 (85.1%) | 128 (14.9%) |
| 35 to 44 Years | 803 (85.3%) | 138 (14.7%) |
| 45 to 54 Years | 777 (89.6%) | 90 (10.4%) |
| 55 to 64 Years | 1,133 (94.5%) | 66 (5.5%) |
| 65 to 74 Years | 754 (100.0%) | 0 (0.0%) |
| 75 Years and older | 551 (100.0%) | 0 (0.0%) |
| Total | 6,971 (91.1%) | 684 (8.9%) |
Health Insurance Coverage by Citizenship Status in Lapeer
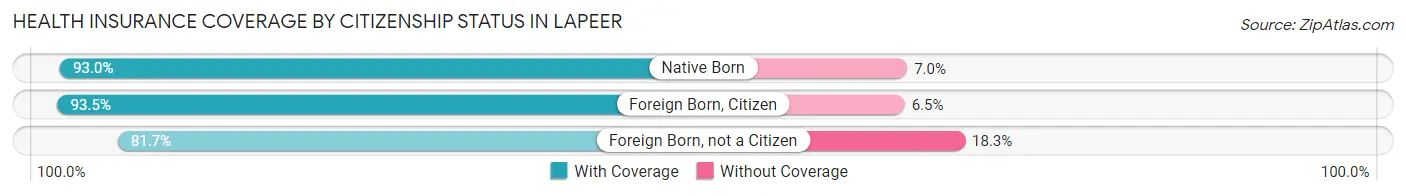
| Citizenship Status | With Coverage | Without Coverage |
| Native Born | 521 (93.0%) | 39 (7.0%) |
| Foreign Born, Citizen | 1,026 (93.5%) | 71 (6.5%) |
| Foreign Born, not a Citizen | 677 (81.7%) | 152 (18.3%) |
Health Insurance Coverage by Household Income in Lapeer
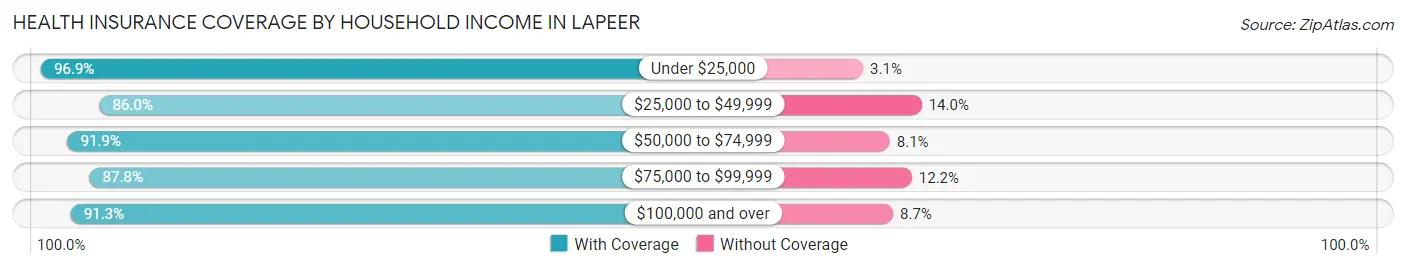
| Household Income | With Coverage | Without Coverage |
| Under $25,000 | 1,579 (96.9%) | 50 (3.1%) |
| $25,000 to $49,999 | 1,249 (86.0%) | 204 (14.0%) |
| $50,000 to $74,999 | 1,449 (91.9%) | 127 (8.1%) |
| $75,000 to $99,999 | 1,117 (87.8%) | 155 (12.2%) |
| $100,000 and over | 1,559 (91.3%) | 148 (8.7%) |
Public vs Private Health Insurance Coverage by Age in Lapeer
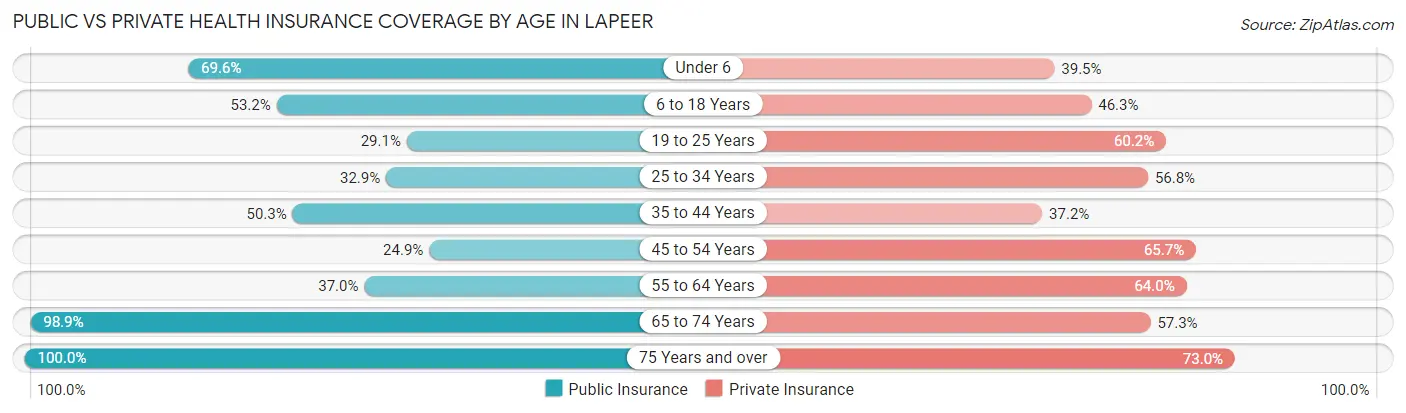
| Age Bracket | Public Insurance | Private Insurance |
| Under 6 | 390 (69.6%) | 221 (39.5%) |
| 6 to 18 Years | 584 (53.2%) | 508 (46.3%) |
| 19 to 25 Years | 241 (29.1%) | 499 (60.2%) |
| 25 to 34 Years | 282 (32.9%) | 487 (56.8%) |
| 35 to 44 Years | 473 (50.3%) | 350 (37.2%) |
| 45 to 54 Years | 216 (24.9%) | 570 (65.7%) |
| 55 to 64 Years | 443 (36.9%) | 767 (64.0%) |
| 65 to 74 Years | 746 (98.9%) | 432 (57.3%) |
| 75 Years and over | 551 (100.0%) | 402 (73.0%) |
| Total | 3,926 (51.3%) | 4,236 (55.3%) |
Disability Status by Sex by Age in Lapeer
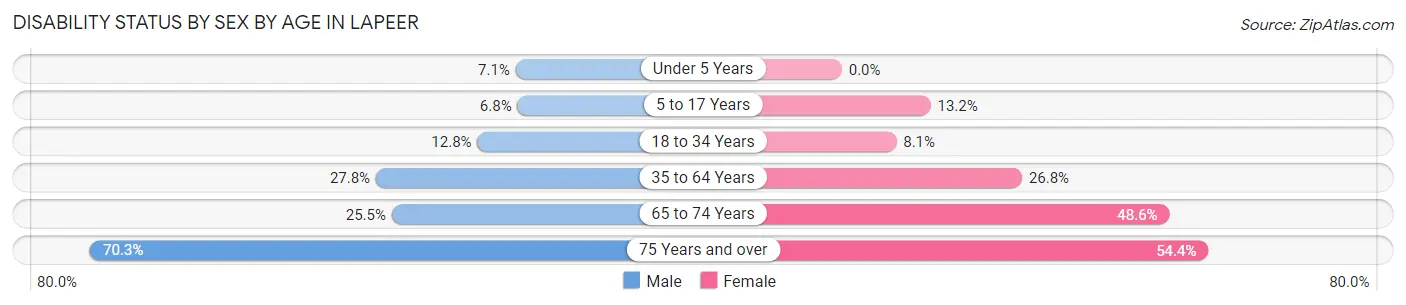
| Age Bracket | Male | Female |
| Under 5 Years | 24 (7.1%) | 0 (0.0%) |
| 5 to 17 Years | 37 (6.8%) | 77 (13.2%) |
| 18 to 34 Years | 112 (12.8%) | 72 (8.1%) |
| 35 to 64 Years | 376 (27.8%) | 443 (26.8%) |
| 65 to 74 Years | 80 (25.5%) | 214 (48.6%) |
| 75 Years and over | 156 (70.3%) | 179 (54.4%) |
Disability Class by Sex by Age in Lapeer
Disability Class: Hearing Difficulty
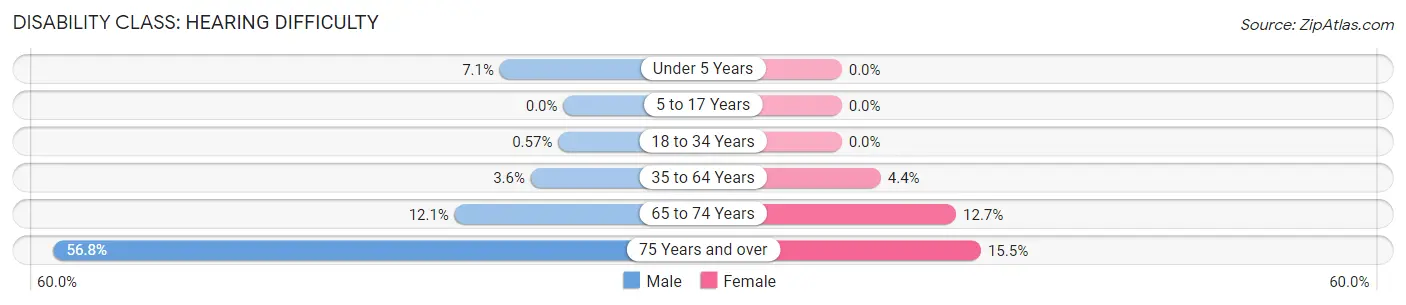
| Age Bracket | Male | Female |
| Under 5 Years | 24 (7.1%) | 0 (0.0%) |
| 5 to 17 Years | 0 (0.0%) | 0 (0.0%) |
| 18 to 34 Years | 5 (0.6%) | 0 (0.0%) |
| 35 to 64 Years | 49 (3.6%) | 72 (4.3%) |
| 65 to 74 Years | 38 (12.1%) | 56 (12.7%) |
| 75 Years and over | 126 (56.8%) | 51 (15.5%) |
Disability Class: Vision Difficulty
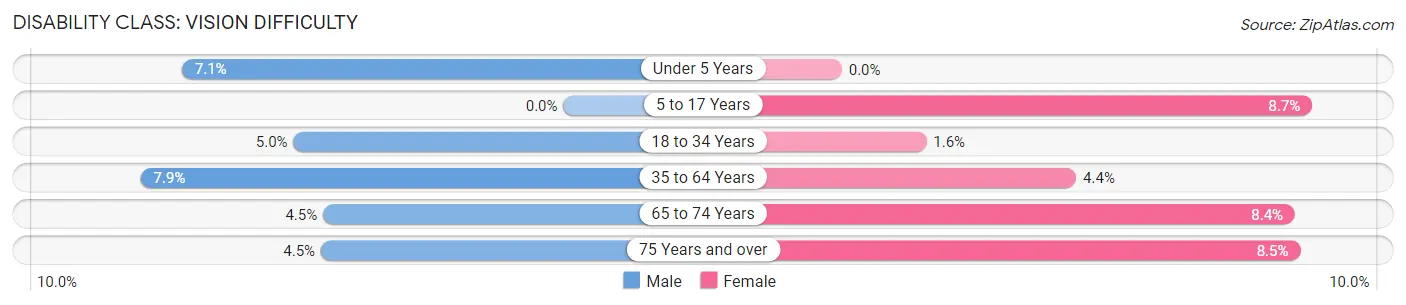
| Age Bracket | Male | Female |
| Under 5 Years | 24 (7.1%) | 0 (0.0%) |
| 5 to 17 Years | 0 (0.0%) | 51 (8.7%) |
| 18 to 34 Years | 44 (5.0%) | 14 (1.6%) |
| 35 to 64 Years | 106 (7.9%) | 72 (4.3%) |
| 65 to 74 Years | 14 (4.5%) | 37 (8.4%) |
| 75 Years and over | 10 (4.5%) | 28 (8.5%) |
Disability Class: Cognitive Difficulty
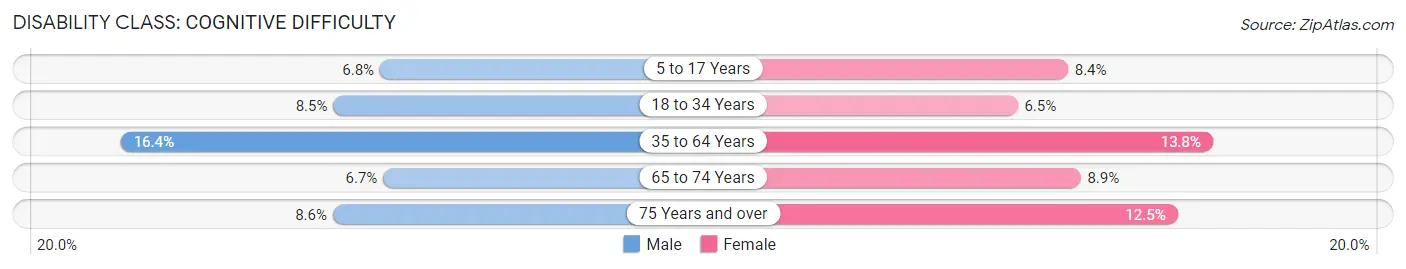
| Age Bracket | Male | Female |
| 5 to 17 Years | 37 (6.8%) | 49 (8.4%) |
| 18 to 34 Years | 75 (8.5%) | 58 (6.5%) |
| 35 to 64 Years | 222 (16.4%) | 228 (13.8%) |
| 65 to 74 Years | 21 (6.7%) | 39 (8.9%) |
| 75 Years and over | 19 (8.6%) | 41 (12.5%) |
Disability Class: Ambulatory Difficulty
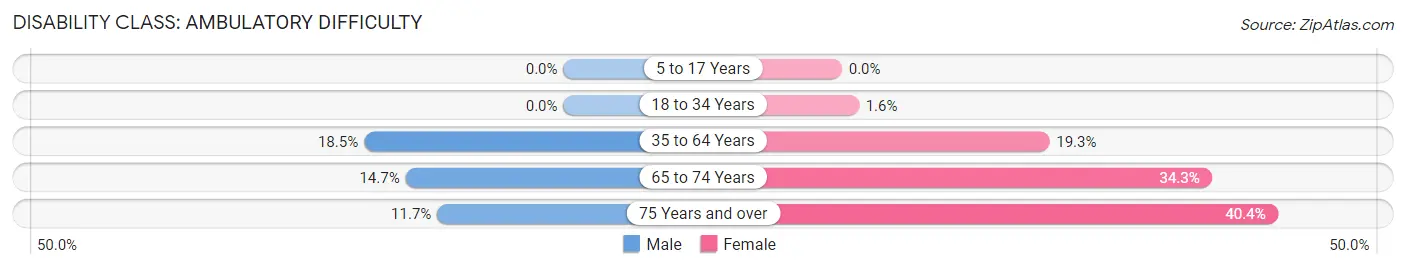
| Age Bracket | Male | Female |
| 5 to 17 Years | 0 (0.0%) | 0 (0.0%) |
| 18 to 34 Years | 0 (0.0%) | 14 (1.6%) |
| 35 to 64 Years | 250 (18.5%) | 319 (19.3%) |
| 65 to 74 Years | 46 (14.6%) | 151 (34.3%) |
| 75 Years and over | 26 (11.7%) | 133 (40.4%) |
Disability Class: Self-Care Difficulty
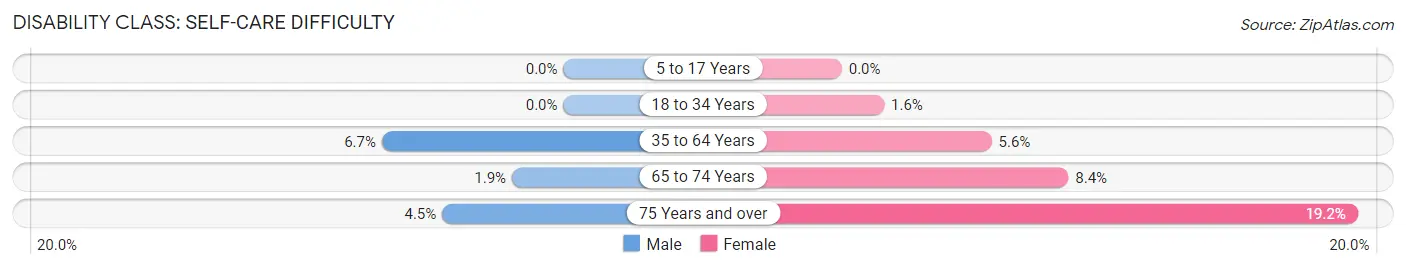
| Age Bracket | Male | Female |
| 5 to 17 Years | 0 (0.0%) | 0 (0.0%) |
| 18 to 34 Years | 0 (0.0%) | 14 (1.6%) |
| 35 to 64 Years | 91 (6.7%) | 92 (5.6%) |
| 65 to 74 Years | 6 (1.9%) | 37 (8.4%) |
| 75 Years and over | 10 (4.5%) | 63 (19.2%) |
Technology Access in Lapeer
Computing Device Access in Lapeer
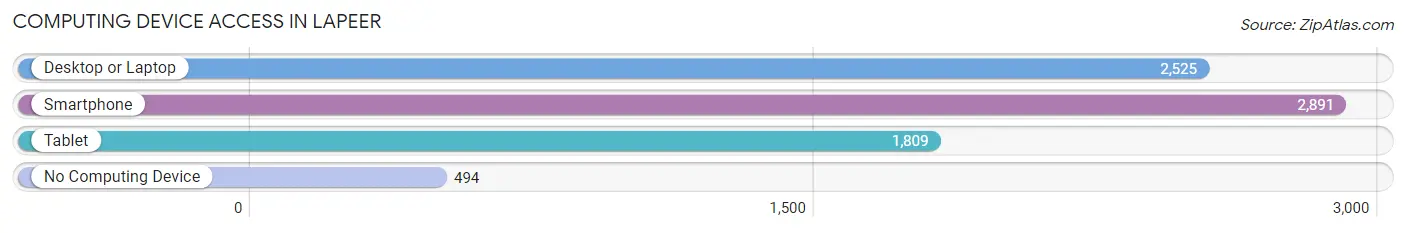
| Device Type | # Households | % Households |
| Desktop or Laptop | 2,525 | 69.1% |
| Smartphone | 2,891 | 79.2% |
| Tablet | 1,809 | 49.5% |
| No Computing Device | 494 | 13.5% |
| Total | 3,652 | 100.0% |
Internet Access in Lapeer
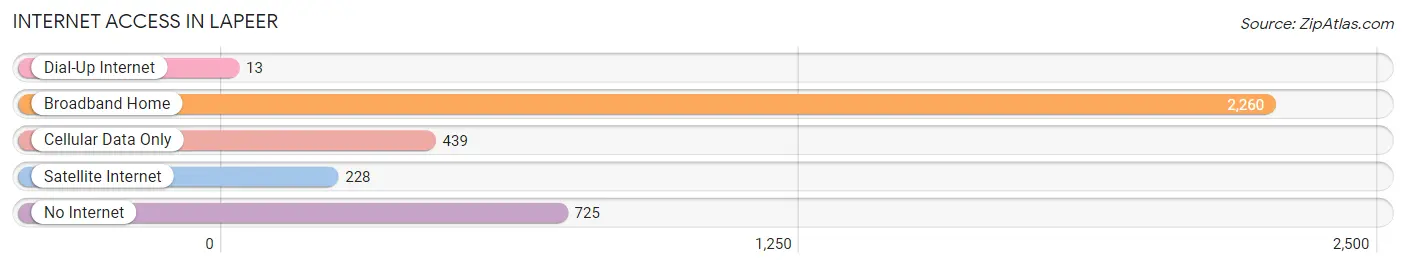
| Internet Type | # Households | % Households |
| Dial-Up Internet | 13 | 0.4% |
| Broadband Home | 2,260 | 61.9% |
| Cellular Data Only | 439 | 12.0% |
| Satellite Internet | 228 | 6.2% |
| No Internet | 725 | 19.9% |
| Total | 3,652 | 100.0% |
Lapeer Summary
Lapeer, Michigan is a city located in the eastern part of the state, in Lapeer County. It is situated on the Flint River, about 50 miles north of Detroit. The city has a population of 8,841, according to the 2010 census.
History
The area that is now Lapeer was first settled in 1831 by a group of settlers from New York. The settlement was originally called "Lapeer Center" and was located at the intersection of two Indian trails. The name was changed to Lapeer in 1833, after the county was organized.
The city was incorporated in 1855 and was the county seat of Lapeer County. The city grew rapidly in the late 19th century, with the arrival of the railroad in 1871. The city was a major center for the lumber industry, and the population grew to over 5,000 by 1900.
In the early 20th century, the city was a major center for the automotive industry, with several factories located in the city. The city also became a center for the production of agricultural equipment.
Geography
Lapeer is located in the eastern part of the state, in Lapeer County. It is situated on the Flint River, about 50 miles north of Detroit. The city has a total area of 5.2 square miles, all of which is land.
The city is located in a hilly region, with elevations ranging from 830 to 1,000 feet above sea level. The terrain is mostly flat, with some rolling hills. The climate is humid continental, with cold winters and warm summers.
Economy
The economy of Lapeer is largely based on manufacturing. The city is home to several automotive and agricultural equipment manufacturers, as well as a number of other industrial and commercial businesses.
The city is also home to several retail stores, restaurants, and other businesses. The city is served by two hospitals, as well as several schools and colleges.
Demographics
As of the 2010 census, the population of Lapeer was 8,841. The racial makeup of the city was 94.3% White, 1.3% African American, 0.4% Native American, 0.7% Asian, 0.1% Pacific Islander, 1.2% from other races, and 2.0% from two or more races. Hispanic or Latino of any race were 3.2% of the population.
The median income for a household in the city was $41,945, and the median income for a family was $50,945. The per capita income for the city was $20,945. About 11.3% of families and 14.2% of the population were below the poverty line, including 19.2% of those under age 18 and 8.2% of those age 65 or over.
Common Questions
What is Per Capita Income in Lapeer?
Per Capita income in Lapeer is $29,527.
What is the Median Family Income in Lapeer?
Median Family Income in Lapeer is $69,737.
What is the Median Household income in Lapeer?
Median Household Income in Lapeer is $50,510.
What is Income or Wage Gap in Lapeer?
Income or Wage Gap in Lapeer is 26.5%.
Women in Lapeer earn 73.5 cents for every dollar earned by a man.
What is Family Income Deficit in Lapeer?
Family Income Deficit in Lapeer is $15,639.
Families that are below poverty line in Lapeer earn $15,639 less on average than the poverty threshold level.
What is Inequality or Gini Index in Lapeer?
Inequality or Gini Index in Lapeer is 0.52.
What is the Total Population of Lapeer?
Total Population of Lapeer is 9,034.
What is the Total Male Population of Lapeer?
Total Male Population of Lapeer is 4,957.
What is the Total Female Population of Lapeer?
Total Female Population of Lapeer is 4,077.
What is the Ratio of Males per 100 Females in Lapeer?
There are 121.58 Males per 100 Females in Lapeer.
What is the Ratio of Females per 100 Males in Lapeer?
There are 82.25 Females per 100 Males in Lapeer.
What is the Median Population Age in Lapeer?
Median Population Age in Lapeer is 40.3 Years.
What is the Average Family Size in Lapeer
Average Family Size in Lapeer is 2.8 People.
What is the Average Household Size in Lapeer
Average Household Size in Lapeer is 2.1 People.
How Large is the Labor Force in Lapeer?
There are 3,594 People in the Labor Forcein in Lapeer.
What is the Percentage of People in the Labor Force in Lapeer?
47.7% of People are in the Labor Force in Lapeer.
What is the Unemployment Rate in Lapeer?
Unemployment Rate in Lapeer is 4.3%.