Manistee, MI Map & Demographics
Manistee Map
Manistee Overview
$31,632
PER CAPITA INCOME
$75,921
AVG FAMILY INCOME
$57,813
AVG HOUSEHOLD INCOME
1.6%
WAGE / INCOME GAP [ % ]
98.4¢/ $1
WAGE / INCOME GAP [ $ ]
0.41
INEQUALITY / GINI INDEX
6,248
TOTAL POPULATION
2,853
MALE POPULATION
3,395
FEMALE POPULATION
84.04
MALES / 100 FEMALES
119.00
FEMALES / 100 MALES
46.9
MEDIAN AGE
3.0
AVG FAMILY SIZE
2.3
AVG HOUSEHOLD SIZE
2,770
LABOR FORCE [ PEOPLE ]
53.6%
PERCENT IN LABOR FORCE
7.3%
UNEMPLOYMENT RATE
Manistee Zip Codes
Manistee Area Codes
Income in Manistee
Income Overview in Manistee
Per Capita Income in Manistee is $31,632, while median incomes of families and households are $75,921 and $57,813 respectively.
| Characteristic | Number | Measure |
| Per Capita Income | 6,248 | $31,632 |
| Median Family Income | 1,478 | $75,921 |
| Mean Family Income | 1,478 | $88,631 |
| Median Household Income | 2,663 | $57,813 |
| Mean Household Income | 2,663 | $72,802 |
| Income Deficit | 1,478 | $0 |
| Wage / Income Gap (%) | 6,248 | 1.58% |
| Wage / Income Gap ($) | 6,248 | 98.42¢ per $1 |
| Gini / Inequality Index | 6,248 | 0.41 |
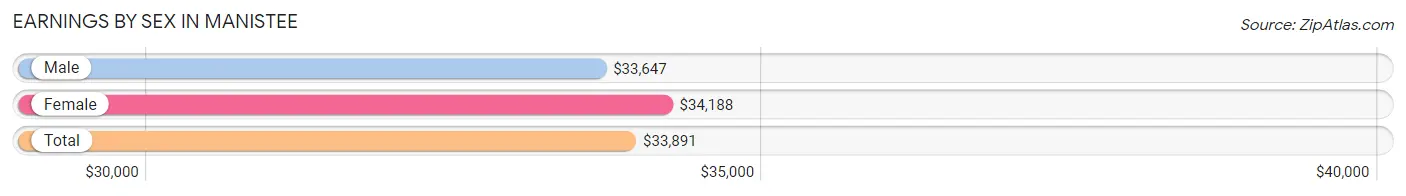
Earnings by Sex in Manistee
Average Earnings in Manistee are $33,891, $33,647 for men and $34,188 for women, a difference of 1.6%.
| Sex | Number | Average Earnings |
| Male | 1,481 (49.4%) | $33,647 |
| Female | 1,515 (50.6%) | $34,188 |
| Total | 2,996 (100.0%) | $33,891 |
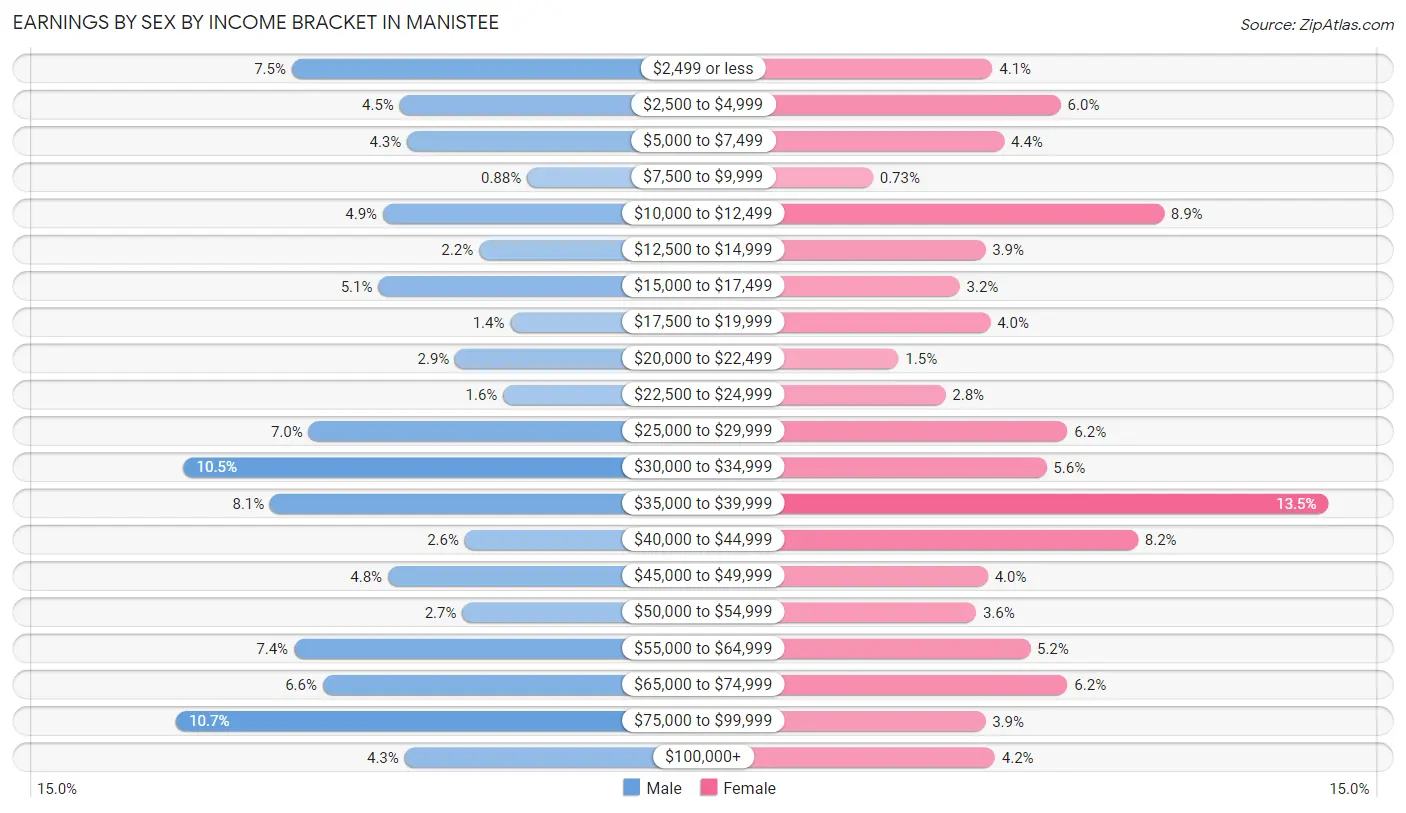
Earnings by Sex by Income Bracket in Manistee
The most common earnings brackets in Manistee are $75,000 to $99,999 for men (159 | 10.7%) and $35,000 to $39,999 for women (205 | 13.5%).
| Income | Male | Female |
| $2,499 or less | 111 (7.5%) | 62 (4.1%) |
| $2,500 to $4,999 | 66 (4.5%) | 91 (6.0%) |
| $5,000 to $7,499 | 63 (4.3%) | 67 (4.4%) |
| $7,500 to $9,999 | 13 (0.9%) | 11 (0.7%) |
| $10,000 to $12,499 | 73 (4.9%) | 135 (8.9%) |
| $12,500 to $14,999 | 33 (2.2%) | 59 (3.9%) |
| $15,000 to $17,499 | 75 (5.1%) | 48 (3.2%) |
| $17,500 to $19,999 | 20 (1.3%) | 61 (4.0%) |
| $20,000 to $22,499 | 43 (2.9%) | 22 (1.5%) |
| $22,500 to $24,999 | 23 (1.5%) | 42 (2.8%) |
| $25,000 to $29,999 | 104 (7.0%) | 94 (6.2%) |
| $30,000 to $34,999 | 156 (10.5%) | 85 (5.6%) |
| $35,000 to $39,999 | 120 (8.1%) | 205 (13.5%) |
| $40,000 to $44,999 | 39 (2.6%) | 124 (8.2%) |
| $45,000 to $49,999 | 71 (4.8%) | 60 (4.0%) |
| $50,000 to $54,999 | 40 (2.7%) | 55 (3.6%) |
| $55,000 to $64,999 | 110 (7.4%) | 78 (5.1%) |
| $65,000 to $74,999 | 98 (6.6%) | 94 (6.2%) |
| $75,000 to $99,999 | 159 (10.7%) | 59 (3.9%) |
| $100,000+ | 64 (4.3%) | 63 (4.2%) |
| Total | 1,481 (100.0%) | 1,515 (100.0%) |
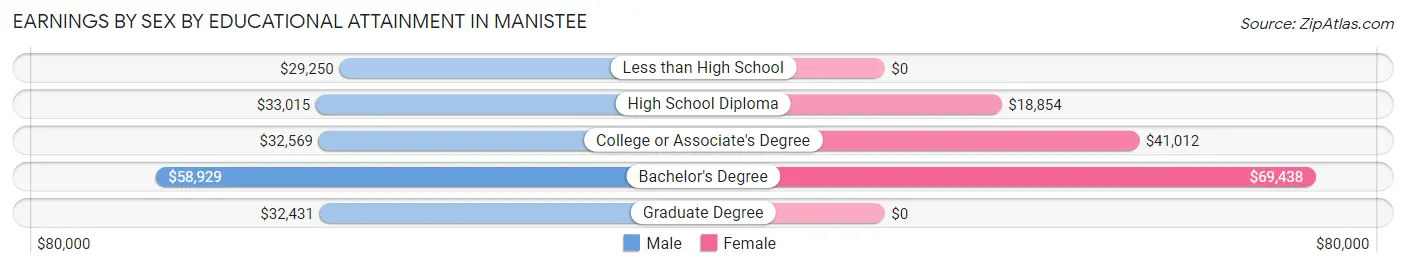
Earnings by Sex by Educational Attainment in Manistee
Average earnings in Manistee are $35,284 for men and $36,937 for women, a difference of 4.5%. Men with an educational attainment of bachelor's degree enjoy the highest average annual earnings of $58,929, while those with less than high school education earn the least with $29,250. Women with an educational attainment of bachelor's degree earn the most with the average annual earnings of $69,438, while those with high school diploma education have the smallest earnings of $18,854.
| Educational Attainment | Male Income | Female Income |
| Less than High School | $29,250 | $0 |
| High School Diploma | $33,015 | $18,854 |
| College or Associate's Degree | $32,569 | $41,012 |
| Bachelor's Degree | $58,929 | $69,438 |
| Graduate Degree | $32,431 | $0 |
| Total | $35,284 | $36,937 |
Family Income in Manistee
Family Income Brackets in Manistee
According to the Manistee family income data, there are 403 families falling into the $50,000 to $74,999 income range, which is the most common income bracket and makes up 27.3% of all families. Conversely, the less than $10,000 income bracket is the least frequent group with only 13 families (0.9%) belonging to this category.
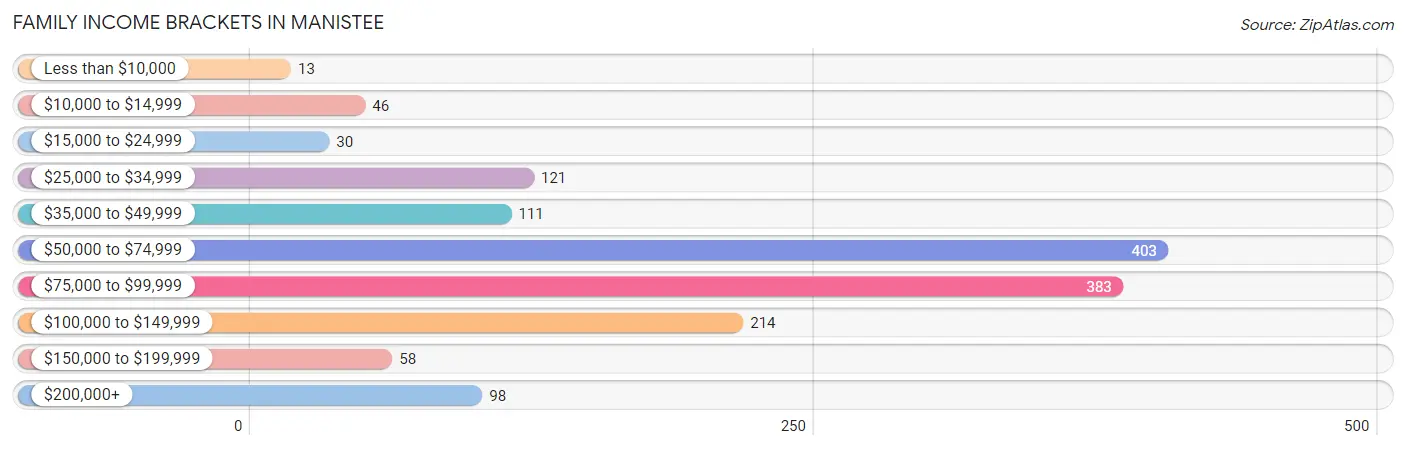
| Income Bracket | # Families | % Families |
| Less than $10,000 | 13 | 0.9% |
| $10,000 to $14,999 | 46 | 3.1% |
| $15,000 to $24,999 | 30 | 2.0% |
| $25,000 to $34,999 | 121 | 8.2% |
| $35,000 to $49,999 | 111 | 7.5% |
| $50,000 to $74,999 | 403 | 27.3% |
| $75,000 to $99,999 | 383 | 25.9% |
| $100,000 to $149,999 | 214 | 14.5% |
| $150,000 to $199,999 | 58 | 3.9% |
| $200,000+ | 98 | 6.6% |
Family Income by Famaliy Size in Manistee
4-person families (192 | 13.0%) account for the highest median family income in Manistee with $89,333 per family, while 2-person families (901 | 61.0%) have the highest median income of $35,324 per family member.
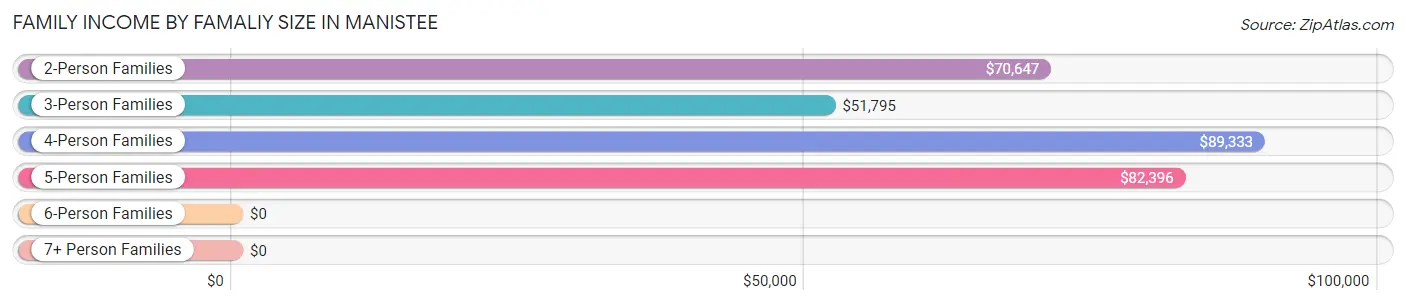
| Income Bracket | # Families | Median Income |
| 2-Person Families | 901 (61.0%) | $70,647 |
| 3-Person Families | 186 (12.6%) | $51,795 |
| 4-Person Families | 192 (13.0%) | $89,333 |
| 5-Person Families | 163 (11.0%) | $82,396 |
| 6-Person Families | 14 (0.9%) | $0 |
| 7+ Person Families | 22 (1.5%) | $0 |
| Total | 1,478 (100.0%) | $75,921 |
Family Income by Number of Earners in Manistee
The median family income in Manistee is $75,921, with families comprising 3+ earners (77) having the highest median family income of $94,904, while families with 1 earner (406) have the lowest median family income of $58,400, accounting for 5.2% and 27.5% of families, respectively.
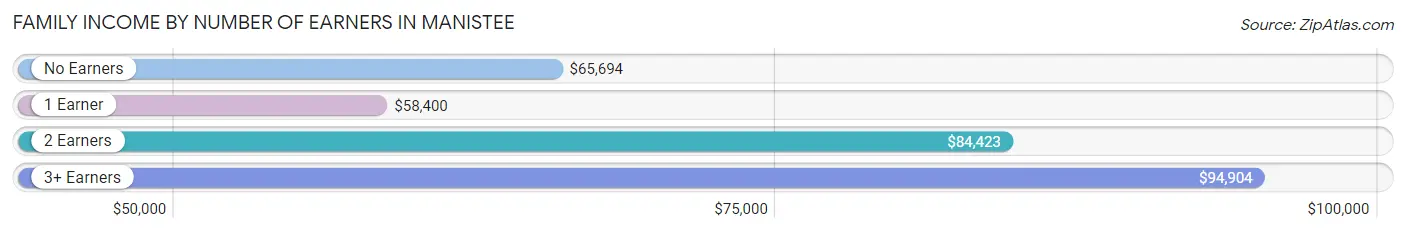
| Number of Earners | # Families | Median Income |
| No Earners | 385 (26.1%) | $65,694 |
| 1 Earner | 406 (27.5%) | $58,400 |
| 2 Earners | 610 (41.3%) | $84,423 |
| 3+ Earners | 77 (5.2%) | $94,904 |
| Total | 1,478 (100.0%) | $75,921 |
Household Income in Manistee
Household Income Brackets in Manistee
With 623 households falling in the category, the $50,000 to $74,999 income range is the most frequent in Manistee, accounting for 23.4% of all households. In contrast, only 69 households (2.6%) fall into the $150,000 to $199,999 income bracket, making it the least populous group.
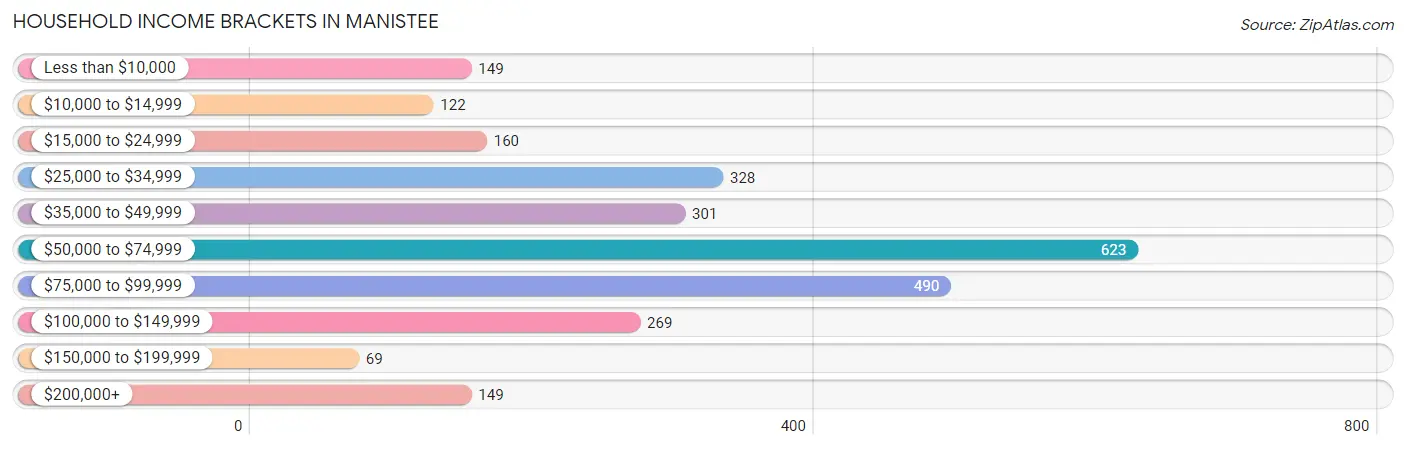
| Income Bracket | # Households | % Households |
| Less than $10,000 | 149 | 5.6% |
| $10,000 to $14,999 | 122 | 4.6% |
| $15,000 to $24,999 | 160 | 6.0% |
| $25,000 to $34,999 | 328 | 12.3% |
| $35,000 to $49,999 | 301 | 11.3% |
| $50,000 to $74,999 | 623 | 23.4% |
| $75,000 to $99,999 | 490 | 18.4% |
| $100,000 to $149,999 | 269 | 10.1% |
| $150,000 to $199,999 | 69 | 2.6% |
| $200,000+ | 149 | 5.6% |
Household Income by Householder Age in Manistee
The median household income in Manistee is $57,813, with the highest median household income of $68,663 found in the 45 to 64 years age bracket for the primary householder. A total of 1,026 households (38.5%) fall into this category. Meanwhile, the 15 to 24 years age bracket for the primary householder has the lowest median household income of $36,477, with 142 households (5.3%) in this group.
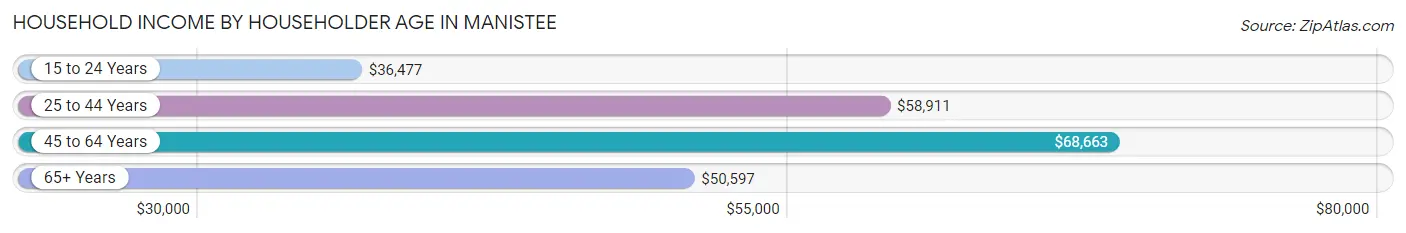
| Income Bracket | # Households | Median Income |
| 15 to 24 Years | 142 (5.3%) | $36,477 |
| 25 to 44 Years | 571 (21.4%) | $58,911 |
| 45 to 64 Years | 1,026 (38.5%) | $68,663 |
| 65+ Years | 924 (34.7%) | $50,597 |
| Total | 2,663 (100.0%) | $57,813 |
Poverty in Manistee
Income Below Poverty by Sex and Age in Manistee
With 11.2% poverty level for males and 11.2% for females among the residents of Manistee, 12 to 14 year old males and 16 and 17 year old females are the most vulnerable to poverty, with 16 males (35.6%) and 26 females (30.9%) in their respective age groups living below the poverty level.
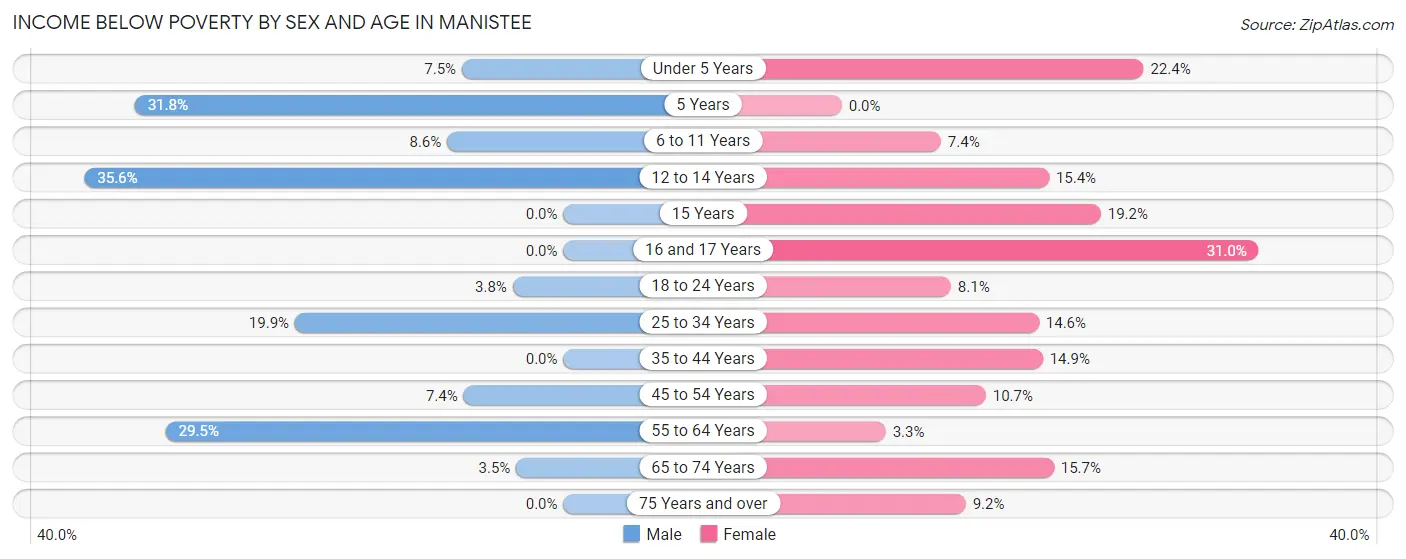
| Age Bracket | Male | Female |
| Under 5 Years | 11 (7.5%) | 28 (22.4%) |
| 5 Years | 14 (31.8%) | 0 (0.0%) |
| 6 to 11 Years | 12 (8.6%) | 17 (7.4%) |
| 12 to 14 Years | 16 (35.6%) | 22 (15.4%) |
| 15 Years | 0 (0.0%) | 15 (19.2%) |
| 16 and 17 Years | 0 (0.0%) | 26 (30.9%) |
| 18 to 24 Years | 10 (3.8%) | 23 (8.1%) |
| 25 to 34 Years | 59 (19.9%) | 36 (14.6%) |
| 35 to 44 Years | 0 (0.0%) | 47 (14.9%) |
| 45 to 54 Years | 16 (7.4%) | 37 (10.7%) |
| 55 to 64 Years | 163 (29.5%) | 21 (3.3%) |
| 65 to 74 Years | 16 (3.5%) | 74 (15.7%) |
| 75 Years and over | 0 (0.0%) | 31 (9.2%) |
| Total | 317 (11.2%) | 377 (11.2%) |
Income Above Poverty by Sex and Age in Manistee
According to the poverty statistics in Manistee, males aged 15 years and females aged 5 years are the age groups that are most secure financially, with 100.0% of males and 100.0% of females in these age groups living above the poverty line.
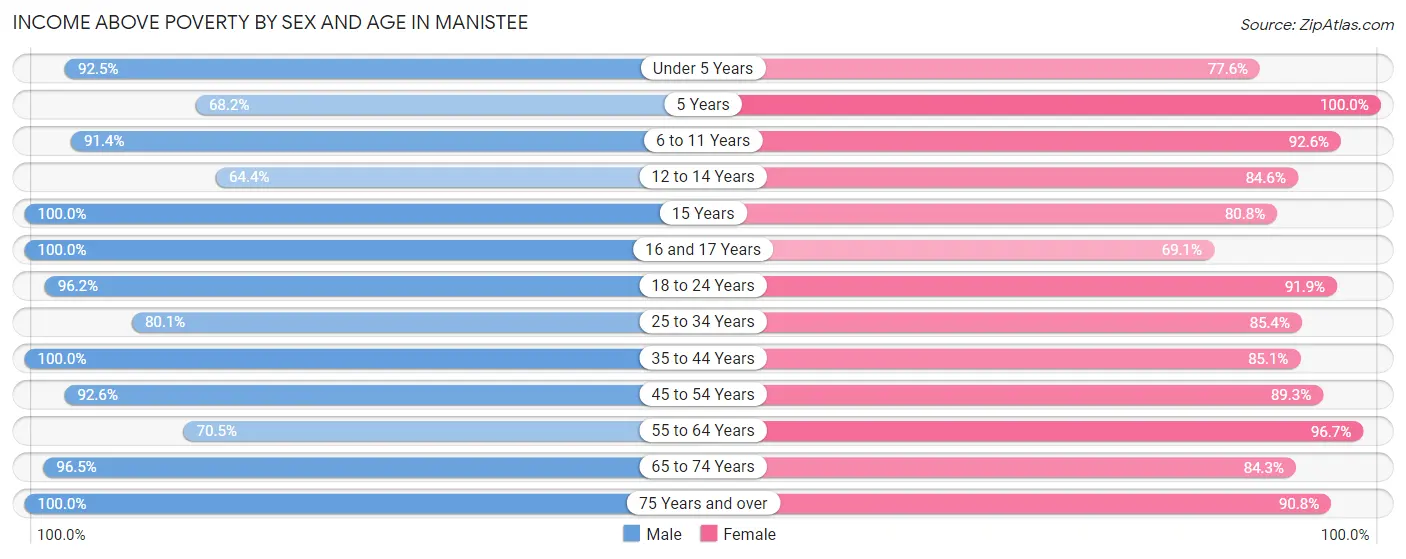
| Age Bracket | Male | Female |
| Under 5 Years | 135 (92.5%) | 97 (77.6%) |
| 5 Years | 30 (68.2%) | 72 (100.0%) |
| 6 to 11 Years | 127 (91.4%) | 214 (92.6%) |
| 12 to 14 Years | 29 (64.4%) | 121 (84.6%) |
| 15 Years | 38 (100.0%) | 63 (80.8%) |
| 16 and 17 Years | 85 (100.0%) | 58 (69.1%) |
| 18 to 24 Years | 256 (96.2%) | 261 (91.9%) |
| 25 to 34 Years | 237 (80.1%) | 210 (85.4%) |
| 35 to 44 Years | 365 (100.0%) | 268 (85.1%) |
| 45 to 54 Years | 200 (92.6%) | 309 (89.3%) |
| 55 to 64 Years | 389 (70.5%) | 623 (96.7%) |
| 65 to 74 Years | 441 (96.5%) | 396 (84.3%) |
| 75 Years and over | 180 (100.0%) | 306 (90.8%) |
| Total | 2,512 (88.8%) | 2,998 (88.8%) |
Income Below Poverty Among Married-Couple Families in Manistee
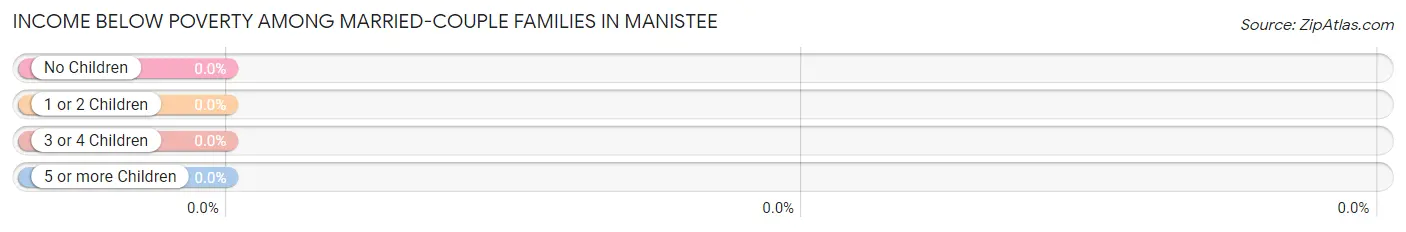
| Children | Above Poverty | Below Poverty |
| No Children | 827 (100.0%) | 0 (0.0%) |
| 1 or 2 Children | 231 (100.0%) | 0 (0.0%) |
| 3 or 4 Children | 117 (100.0%) | 0 (0.0%) |
| 5 or more Children | 0 (0.0%) | 0 (0.0%) |
| Total | 1,175 (100.0%) | 0 (0.0%) |
Income Below Poverty Among Single-Parent Households in Manistee
According to the poverty data in Manistee, 32.9% or 25 single-father households and 23.4% or 53 single-mother households are living below the poverty line. Among single-father households, those with 3 or 4 children have the highest poverty rate, with 13 households (100.0%) experiencing poverty. Likewise, among single-mother households, those with 3 or 4 children have the highest poverty rate, with 16 households (45.7%) falling below the poverty line.
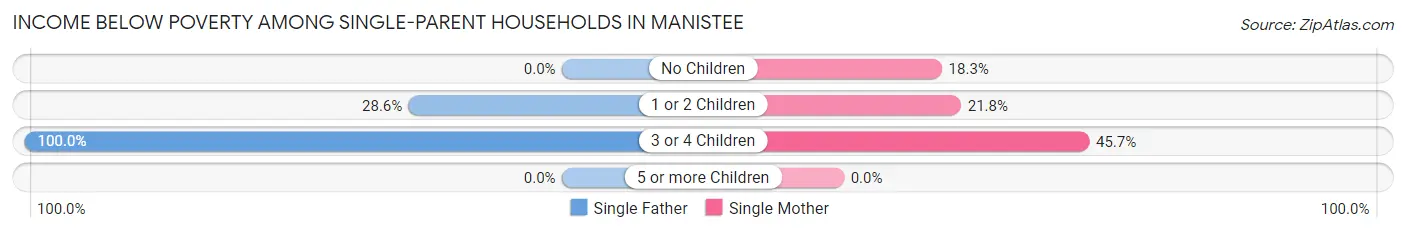
| Children | Single Father | Single Mother |
| No Children | 0 (0.0%) | 25 (18.2%) |
| 1 or 2 Children | 12 (28.6%) | 12 (21.8%) |
| 3 or 4 Children | 13 (100.0%) | 16 (45.7%) |
| 5 or more Children | 0 (0.0%) | 0 (0.0%) |
| Total | 25 (32.9%) | 53 (23.4%) |
Income Below Poverty Among Married-Couple vs Single-Parent Households in Manistee
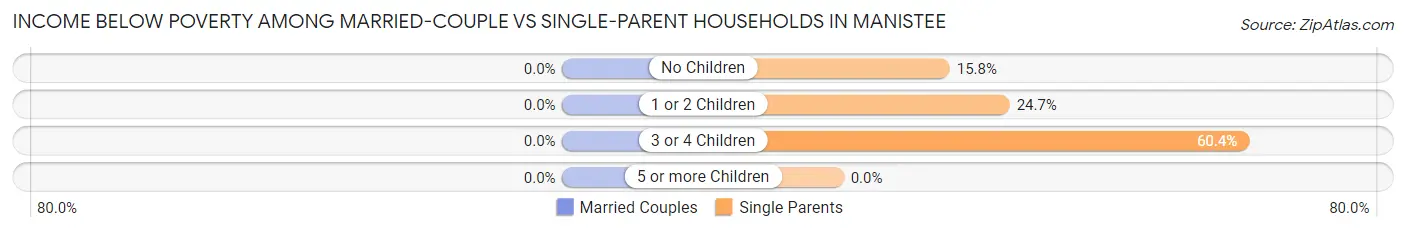
| Children | Married-Couple Families | Single-Parent Households |
| No Children | 0 (0.0%) | 25 (15.8%) |
| 1 or 2 Children | 0 (0.0%) | 24 (24.7%) |
| 3 or 4 Children | 0 (0.0%) | 29 (60.4%) |
| 5 or more Children | 0 (0.0%) | 0 (0.0%) |
| Total | 0 (0.0%) | 78 (25.7%) |
Race in Manistee
The most populous races in Manistee are White / Caucasian (5,401 | 86.4%), Two or more Races (693 | 11.1%), and Hispanic or Latino (360 | 5.8%).
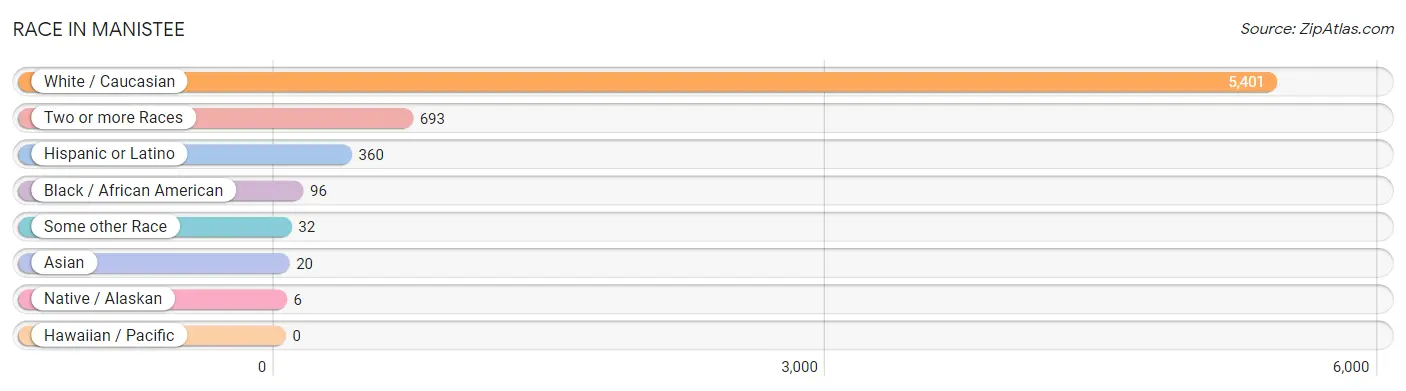
| Race | # Population | % Population |
| Asian | 20 | 0.3% |
| Black / African American | 96 | 1.5% |
| Hawaiian / Pacific | 0 | 0.0% |
| Hispanic or Latino | 360 | 5.8% |
| Native / Alaskan | 6 | 0.1% |
| White / Caucasian | 5,401 | 86.4% |
| Two or more Races | 693 | 11.1% |
| Some other Race | 32 | 0.5% |
| Total | 6,248 | 100.0% |
Ancestry in Manistee
The most populous ancestries reported in Manistee are German (1,291 | 20.7%), Polish (939 | 15.0%), Irish (653 | 10.4%), English (540 | 8.6%), and American (265 | 4.2%), together accounting for 59.0% of all Manistee residents.
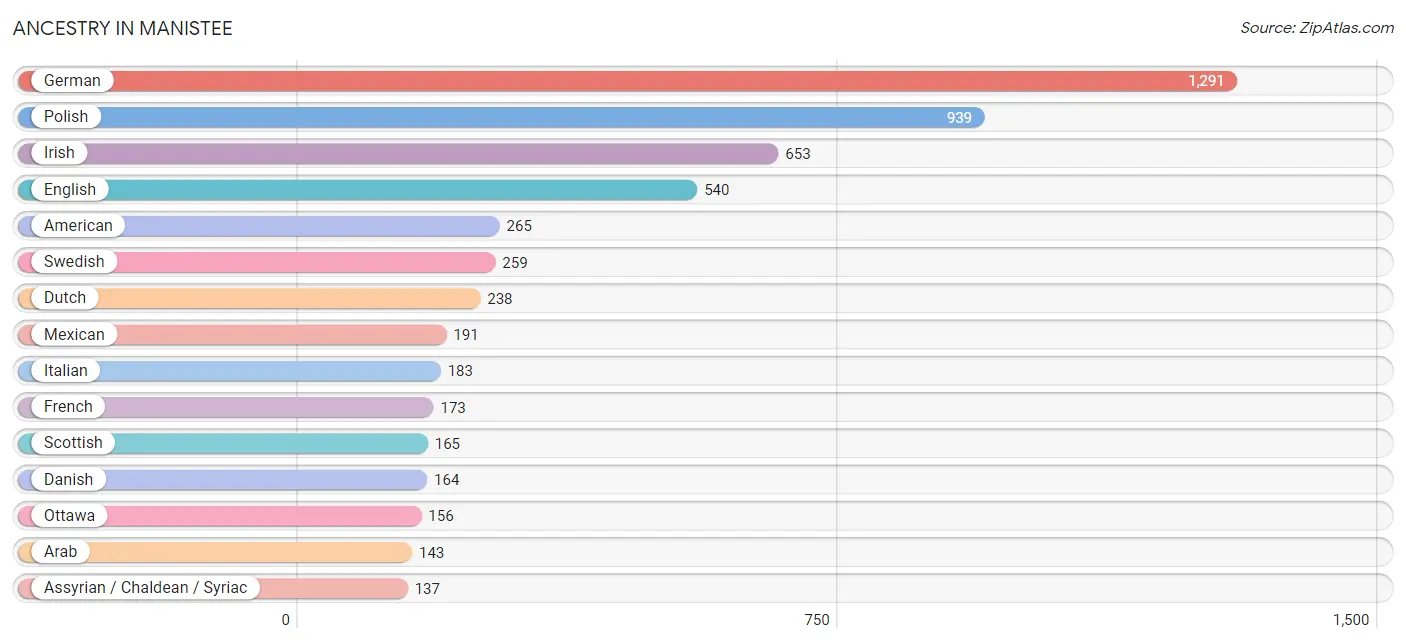
| Ancestry | # Population | % Population |
| American | 265 | 4.2% |
| Arab | 143 | 2.3% |
| Assyrian / Chaldean / Syriac | 137 | 2.2% |
| Belgian | 62 | 1.0% |
| Bhutanese | 20 | 0.3% |
| British | 25 | 0.4% |
| Burmese | 12 | 0.2% |
| Canadian | 7 | 0.1% |
| Central American | 23 | 0.4% |
| Cherokee | 30 | 0.5% |
| Chippewa | 55 | 0.9% |
| Croatian | 8 | 0.1% |
| Cuban | 40 | 0.6% |
| Czechoslovakian | 12 | 0.2% |
| Danish | 164 | 2.6% |
| Dutch | 238 | 3.8% |
| English | 540 | 8.6% |
| European | 31 | 0.5% |
| Finnish | 113 | 1.8% |
| French | 173 | 2.8% |
| French American Indian | 13 | 0.2% |
| French Canadian | 135 | 2.2% |
| German | 1,291 | 20.7% |
| Guamanian / Chamorro | 12 | 0.2% |
| Guatemalan | 23 | 0.4% |
| Hungarian | 122 | 1.9% |
| Indian (Asian) | 12 | 0.2% |
| Iraqi | 137 | 2.2% |
| Irish | 653 | 10.4% |
| Italian | 183 | 2.9% |
| Jamaican | 27 | 0.4% |
| Korean | 17 | 0.3% |
| Latvian | 9 | 0.1% |
| Lebanese | 6 | 0.1% |
| Mexican | 191 | 3.1% |
| Native Hawaiian | 12 | 0.2% |
| Norwegian | 44 | 0.7% |
| Ottawa | 156 | 2.5% |
| Polish | 939 | 15.0% |
| Potawatomi | 40 | 0.6% |
| Puerto Rican | 44 | 0.7% |
| Romanian | 9 | 0.1% |
| Russian | 37 | 0.6% |
| Samoan | 12 | 0.2% |
| Scandinavian | 35 | 0.6% |
| Scotch-Irish | 56 | 0.9% |
| Scottish | 165 | 2.6% |
| Slavic | 10 | 0.2% |
| Slovak | 15 | 0.2% |
| Sri Lankan | 12 | 0.2% |
| Swedish | 259 | 4.2% |
| Swiss | 11 | 0.2% |
| Thai | 12 | 0.2% |
| Ukrainian | 20 | 0.3% | View All 54 Rows |
Immigrants in Manistee
The most numerous immigrant groups reported in Manistee came from Latin America (109 | 1.7%), Central America (75 | 1.2%), Guatemala (70 | 1.1%), Asia (62 | 1.0%), and Iraq (57 | 0.9%), together accounting for 6.0% of all Manistee residents.
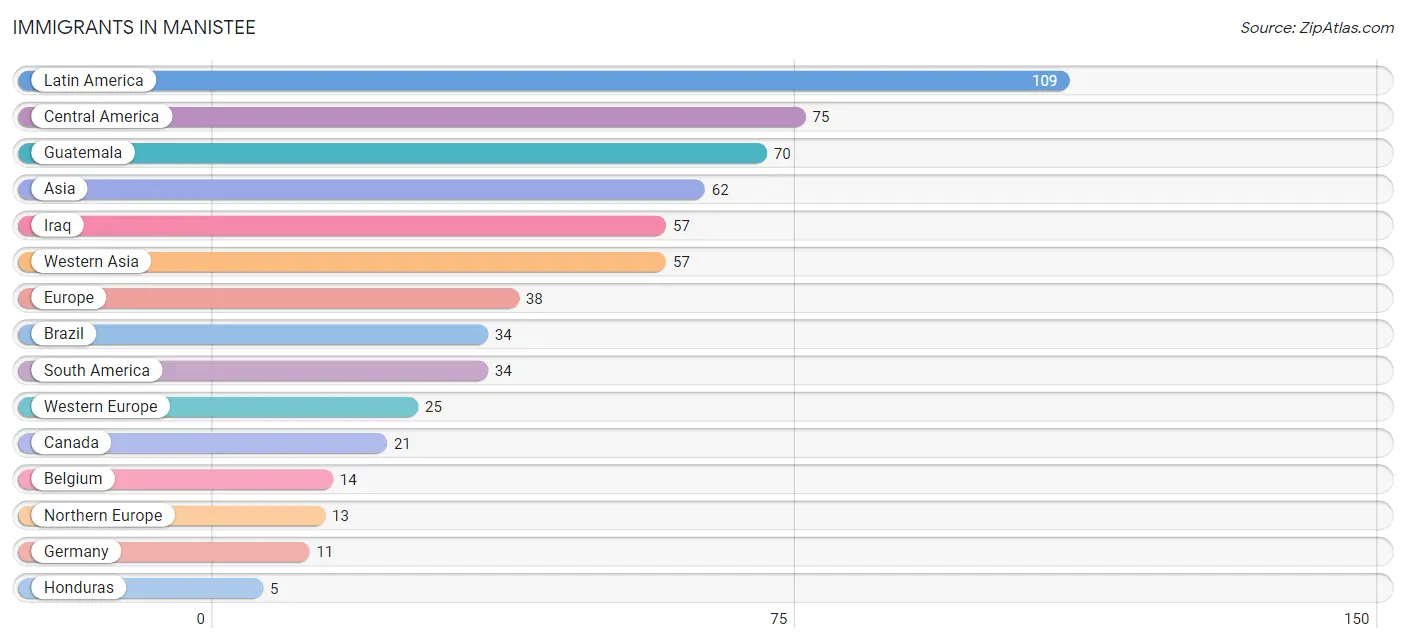
| Immigration Origin | # Population | % Population |
| Asia | 62 | 1.0% |
| Belgium | 14 | 0.2% |
| Brazil | 34 | 0.5% |
| Canada | 21 | 0.3% |
| Central America | 75 | 1.2% |
| Europe | 38 | 0.6% |
| Germany | 11 | 0.2% |
| Guatemala | 70 | 1.1% |
| Honduras | 5 | 0.1% |
| Iraq | 57 | 0.9% |
| Latin America | 109 | 1.7% |
| Northern Europe | 13 | 0.2% |
| Philippines | 5 | 0.1% |
| South America | 34 | 0.5% |
| South Eastern Asia | 5 | 0.1% |
| Western Asia | 57 | 0.9% |
| Western Europe | 25 | 0.4% | View All 17 Rows |
Sex and Age in Manistee
Sex and Age in Manistee
The most populous age groups in Manistee are 60 to 64 Years (327 | 11.5%) for men and 60 to 64 Years (343 | 10.1%) for women.
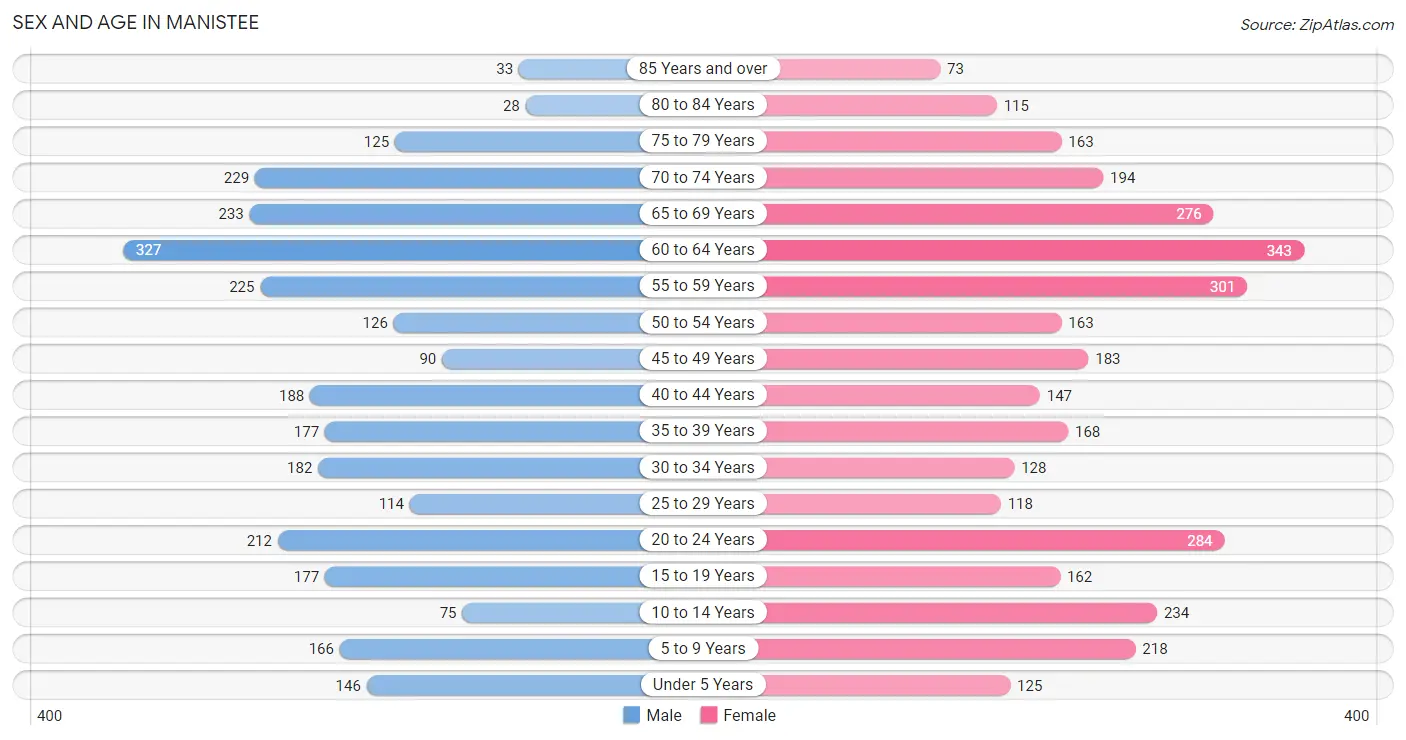
| Age Bracket | Male | Female |
| Under 5 Years | 146 (5.1%) | 125 (3.7%) |
| 5 to 9 Years | 166 (5.8%) | 218 (6.4%) |
| 10 to 14 Years | 75 (2.6%) | 234 (6.9%) |
| 15 to 19 Years | 177 (6.2%) | 162 (4.8%) |
| 20 to 24 Years | 212 (7.4%) | 284 (8.4%) |
| 25 to 29 Years | 114 (4.0%) | 118 (3.5%) |
| 30 to 34 Years | 182 (6.4%) | 128 (3.8%) |
| 35 to 39 Years | 177 (6.2%) | 168 (5.0%) |
| 40 to 44 Years | 188 (6.6%) | 147 (4.3%) |
| 45 to 49 Years | 90 (3.2%) | 183 (5.4%) |
| 50 to 54 Years | 126 (4.4%) | 163 (4.8%) |
| 55 to 59 Years | 225 (7.9%) | 301 (8.9%) |
| 60 to 64 Years | 327 (11.5%) | 343 (10.1%) |
| 65 to 69 Years | 233 (8.2%) | 276 (8.1%) |
| 70 to 74 Years | 229 (8.0%) | 194 (5.7%) |
| 75 to 79 Years | 125 (4.4%) | 163 (4.8%) |
| 80 to 84 Years | 28 (1.0%) | 115 (3.4%) |
| 85 Years and over | 33 (1.2%) | 73 (2.1%) |
| Total | 2,853 (100.0%) | 3,395 (100.0%) |
Families and Households in Manistee
Median Family Size in Manistee
The median family size in Manistee is 3.05 persons per family, with single male/father families (76 | 5.1%) accounting for the largest median family size of 3.89 persons per family. On the other hand, married-couple families (1,175 | 79.5%) represent the smallest median family size with 2.97 persons per family.
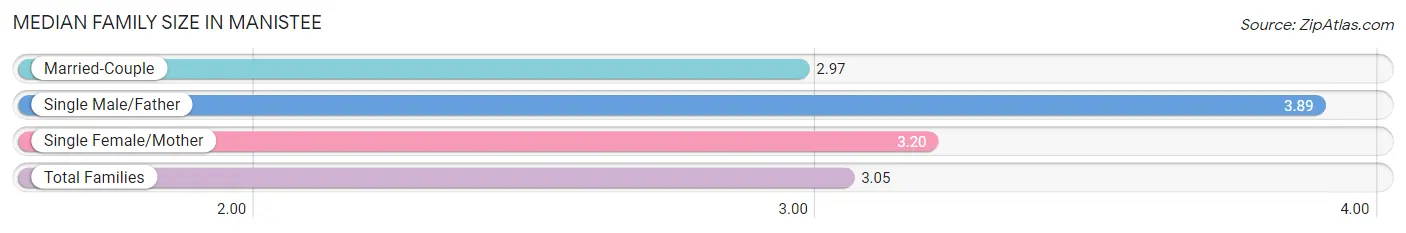
| Family Type | # Families | Family Size |
| Married-Couple | 1,175 (79.5%) | 2.97 |
| Single Male/Father | 76 (5.1%) | 3.89 |
| Single Female/Mother | 227 (15.4%) | 3.20 |
| Total Families | 1,478 (100.0%) | 3.05 |
Median Household Size in Manistee
The median household size in Manistee is 2.33 persons per household, with single male/father households (76 | 2.9%) accounting for the largest median household size of 4.64 persons per household. non-family households (1,185 | 44.5%) represent the smallest median household size with 1.26 persons per household.
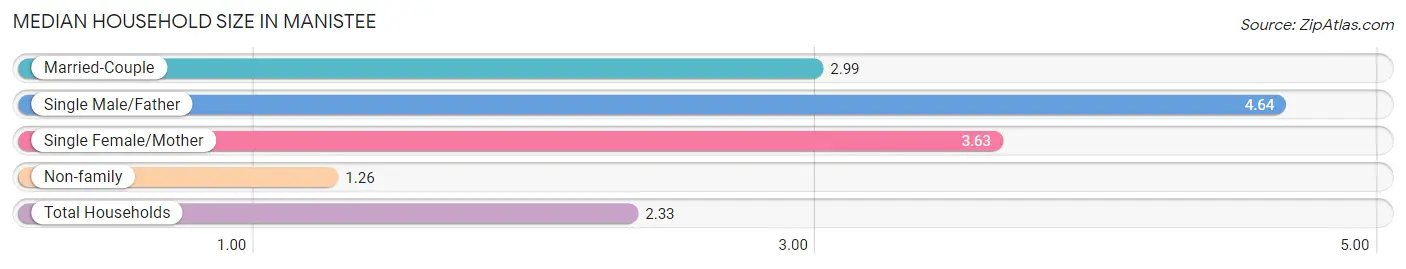
| Household Type | # Households | Household Size |
| Married-Couple | 1,175 (44.1%) | 2.99 |
| Single Male/Father | 76 (2.9%) | 4.64 |
| Single Female/Mother | 227 (8.5%) | 3.63 |
| Non-family | 1,185 (44.5%) | 1.26 |
| Total Households | 2,663 (100.0%) | 2.33 |
Household Size by Marriage Status in Manistee
Out of a total of 2,663 households in Manistee, 1,478 (55.5%) are family households, while 1,185 (44.5%) are nonfamily households. The most numerous type of family households are 2-person households, comprising 890, and the most common type of nonfamily households are 1-person households, comprising 944.
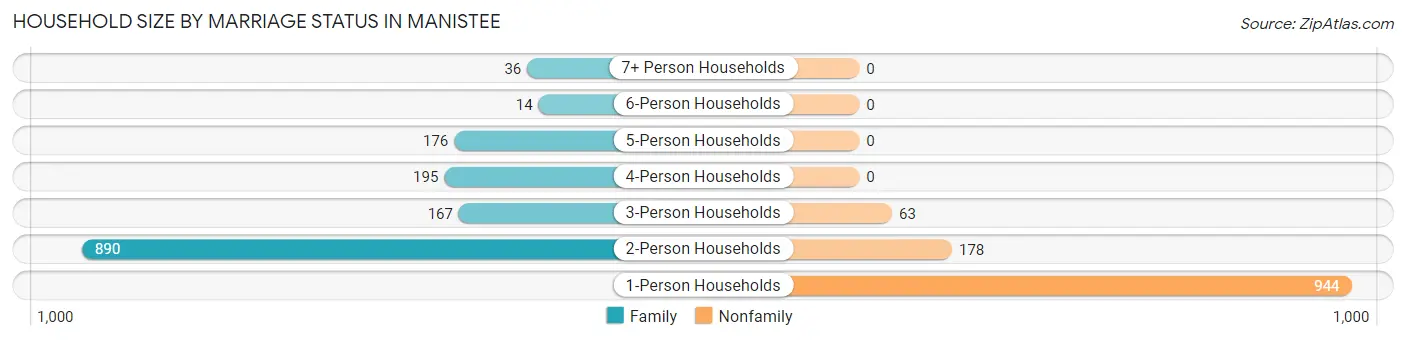
| Household Size | Family Households | Nonfamily Households |
| 1-Person Households | - | 944 (35.4%) |
| 2-Person Households | 890 (33.4%) | 178 (6.7%) |
| 3-Person Households | 167 (6.3%) | 63 (2.4%) |
| 4-Person Households | 195 (7.3%) | 0 (0.0%) |
| 5-Person Households | 176 (6.6%) | 0 (0.0%) |
| 6-Person Households | 14 (0.5%) | 0 (0.0%) |
| 7+ Person Households | 36 (1.3%) | 0 (0.0%) |
| Total | 1,478 (55.5%) | 1,185 (44.5%) |
Female Fertility in Manistee
Fertility by Age in Manistee
Average fertility rate in Manistee is 14.0 births per 1,000 women. Women in the age bracket of 35 to 50 years have the highest fertility rate with 33.0 births per 1,000 women. Women in the age bracket of 35 to 50 years acount for 100.0% of all women with births.
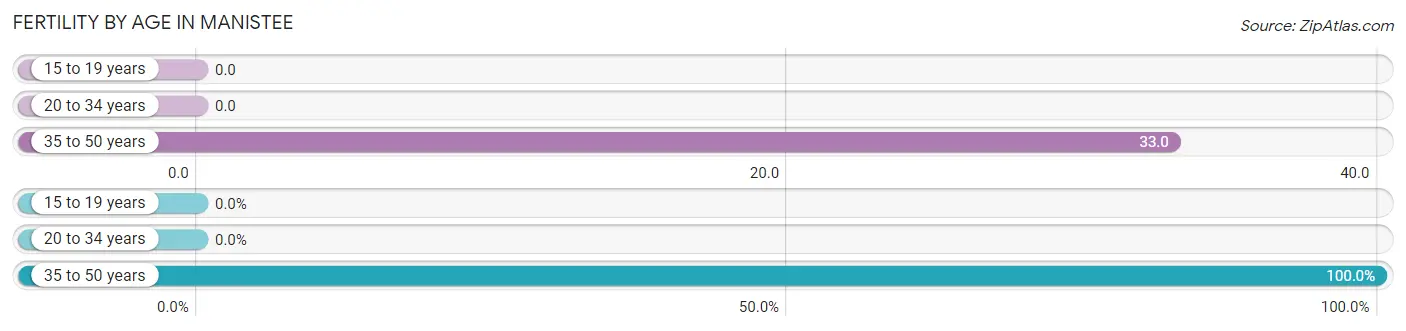
| Age Bracket | Women with Births | Births / 1,000 Women |
| 15 to 19 years | 0 (0.0%) | 0.0 |
| 20 to 34 years | 0 (0.0%) | 0.0 |
| 35 to 50 years | 17 (100.0%) | 33.0 |
| Total | 17 (100.0%) | 14.0 |
Fertility by Age by Marriage Status in Manistee
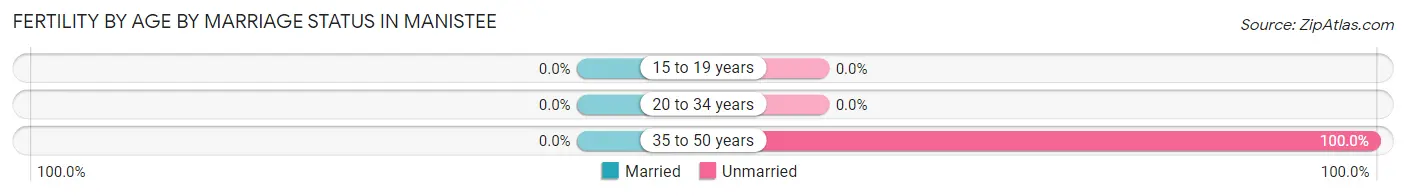
| Age Bracket | Married | Unmarried |
| 15 to 19 years | 0 (0.0%) | 0 (0.0%) |
| 20 to 34 years | 0 (0.0%) | 0 (0.0%) |
| 35 to 50 years | 0 (0.0%) | 17 (100.0%) |
| Total | 0 (0.0%) | 17 (100.0%) |
Fertility by Education in Manistee
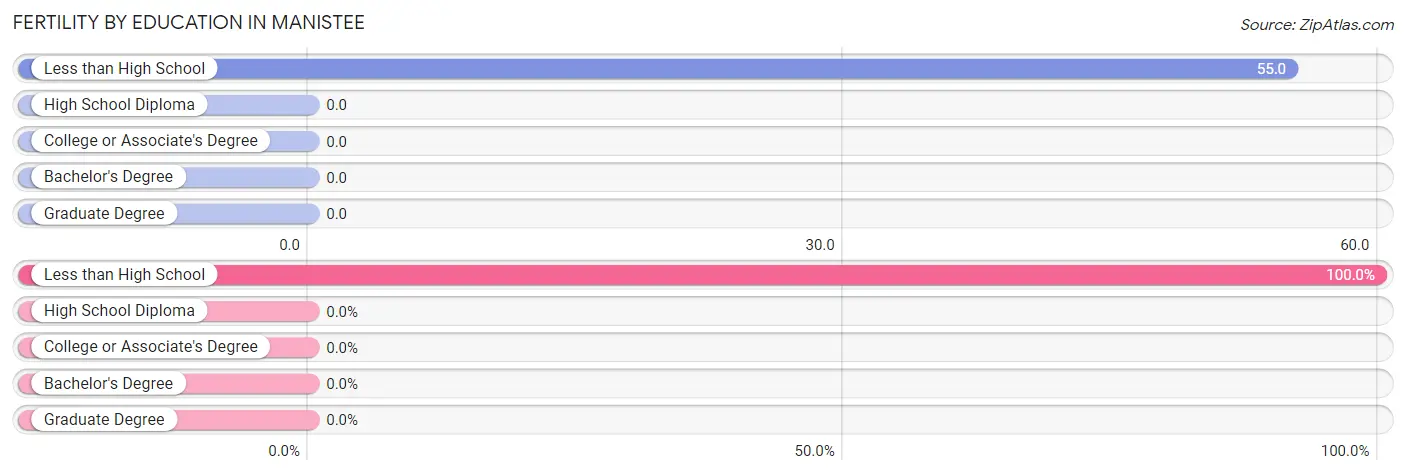
| Educational Attainment | Women with Births | Births / 1,000 Women |
| Less than High School | 17 (100.0%) | 55.0 |
| High School Diploma | 0 (0.0%) | 0.0 |
| College or Associate's Degree | 0 (0.0%) | 0.0 |
| Bachelor's Degree | 0 (0.0%) | 0.0 |
| Graduate Degree | 0 (0.0%) | 0.0 |
| Total | 17 (100.0%) | 14.0 |
Fertility by Education by Marriage Status in Manistee
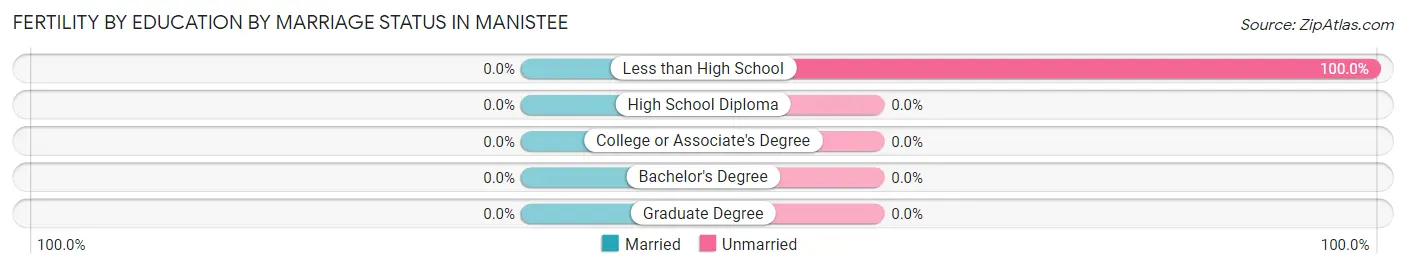
| Educational Attainment | Married | Unmarried |
| Less than High School | 0 (0.0%) | 17 (100.0%) |
| High School Diploma | 0 (0.0%) | 0 (0.0%) |
| College or Associate's Degree | 0 (0.0%) | 0 (0.0%) |
| Bachelor's Degree | 0 (0.0%) | 0 (0.0%) |
| Graduate Degree | 0 (0.0%) | 0 (0.0%) |
| Total | 0 (0.0%) | 17 (100.0%) |
Employment Characteristics in Manistee
Employment by Class of Employer in Manistee
Among the 2,522 employed individuals in Manistee, private company employees (1,652 | 65.5%), not-for-profit organizations (251 | 10.0%), and local government employees (172 | 6.8%) make up the most common classes of employment.

| Employer Class | # Employees | % Employees |
| Private Company Employees | 1,652 | 65.5% |
| Self-Employed (Incorporated) | 95 | 3.8% |
| Self-Employed (Not Incorporated) | 153 | 6.1% |
| Not-for-profit Organizations | 251 | 10.0% |
| Local Government Employees | 172 | 6.8% |
| State Government Employees | 77 | 3.0% |
| Federal Government Employees | 122 | 4.8% |
| Unpaid Family Workers | 0 | 0.0% |
| Total | 2,522 | 100.0% |
Employment Status by Age in Manistee
According to the labor force statistics for Manistee, out of the total population over 16 years of age (5,168), 53.6% or 2,770 individuals are in the labor force, with 7.3% or 202 of them unemployed. The age group with the highest labor force participation rate is 20 to 24 years, with 98.2% or 487 individuals in the labor force. Within the labor force, the 16 to 19 years age range has the highest percentage of unemployed individuals, with 58.6% or 17 of them being unemployed.
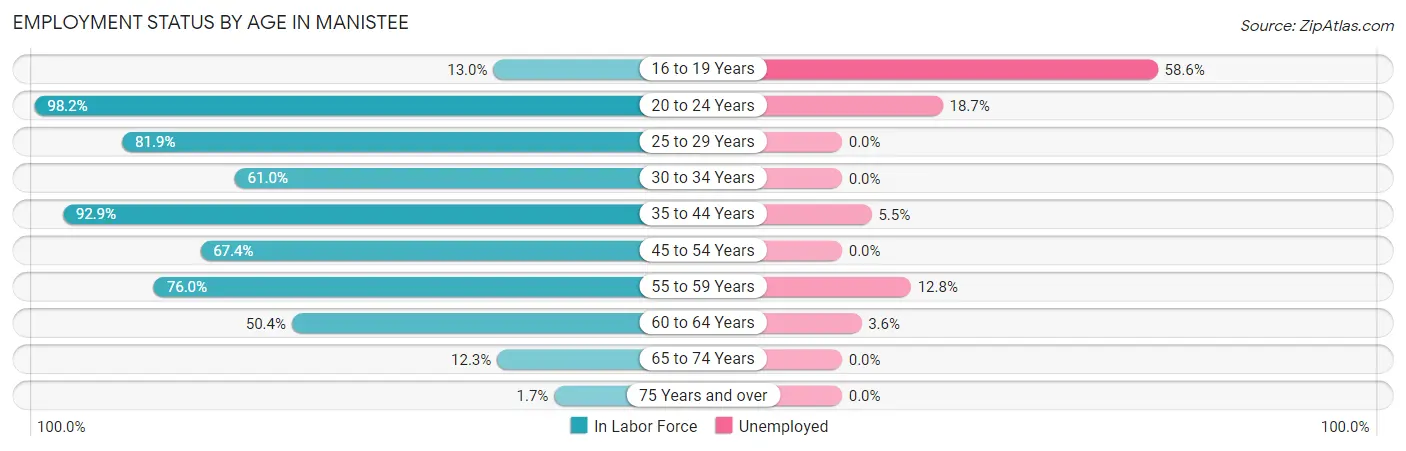
| Age Bracket | In Labor Force | Unemployed |
| 16 to 19 Years | 29 (13.0%) | 17 (58.6%) |
| 20 to 24 Years | 487 (98.2%) | 91 (18.7%) |
| 25 to 29 Years | 190 (81.9%) | 0 (0.0%) |
| 30 to 34 Years | 189 (61.0%) | 0 (0.0%) |
| 35 to 44 Years | 632 (92.9%) | 35 (5.5%) |
| 45 to 54 Years | 379 (67.4%) | 0 (0.0%) |
| 55 to 59 Years | 400 (76.0%) | 51 (12.8%) |
| 60 to 64 Years | 338 (50.4%) | 12 (3.6%) |
| 65 to 74 Years | 115 (12.3%) | 0 (0.0%) |
| 75 Years and over | 9 (1.7%) | 0 (0.0%) |
| Total | 2,770 (53.6%) | 202 (7.3%) |
Employment Status by Educational Attainment in Manistee
According to labor force statistics for Manistee, 71.4% of individuals (2,128) out of the total population between 25 and 64 years of age (2,980) are in the labor force, with 4.6% or 98 of them being unemployed. The group with the highest labor force participation rate are those with the educational attainment of bachelor's degree or higher, with 76.1% or 517 individuals in the labor force. Within the labor force, individuals with less than high school education have the highest percentage of unemployment, with 28.1% or 65 of them being unemployed.
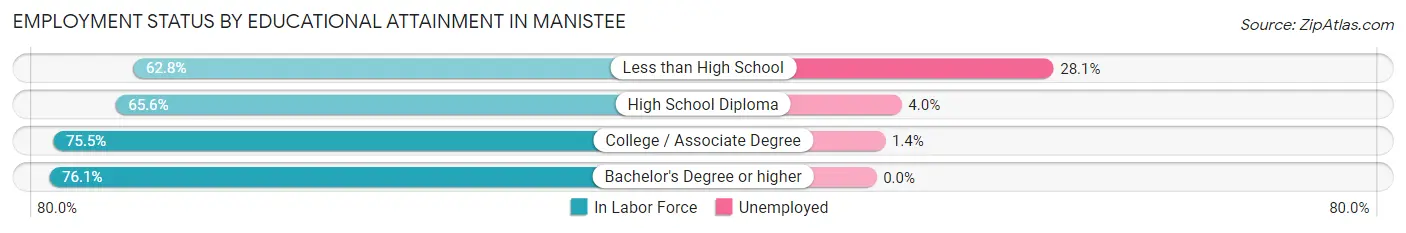
| Educational Attainment | In Labor Force | Unemployed |
| Less than High School | 231 (62.8%) | 103 (28.1%) |
| High School Diploma | 526 (65.6%) | 32 (4.0%) |
| College / Associate Degree | 854 (75.5%) | 16 (1.4%) |
| Bachelor's Degree or higher | 517 (76.1%) | 0 (0.0%) |
| Total | 2,128 (71.4%) | 137 (4.6%) |
Employment Occupations by Sex in Manistee
Management, Business, Science and Arts Occupations
The most common Management, Business, Science and Arts occupations in Manistee are Management (236 | 9.3%), Community & Social Service (179 | 7.1%), Computers, Engineering & Science (169 | 6.7%), Health Diagnosing & Treating (167 | 6.6%), and Computers & Mathematics (94 | 3.7%).
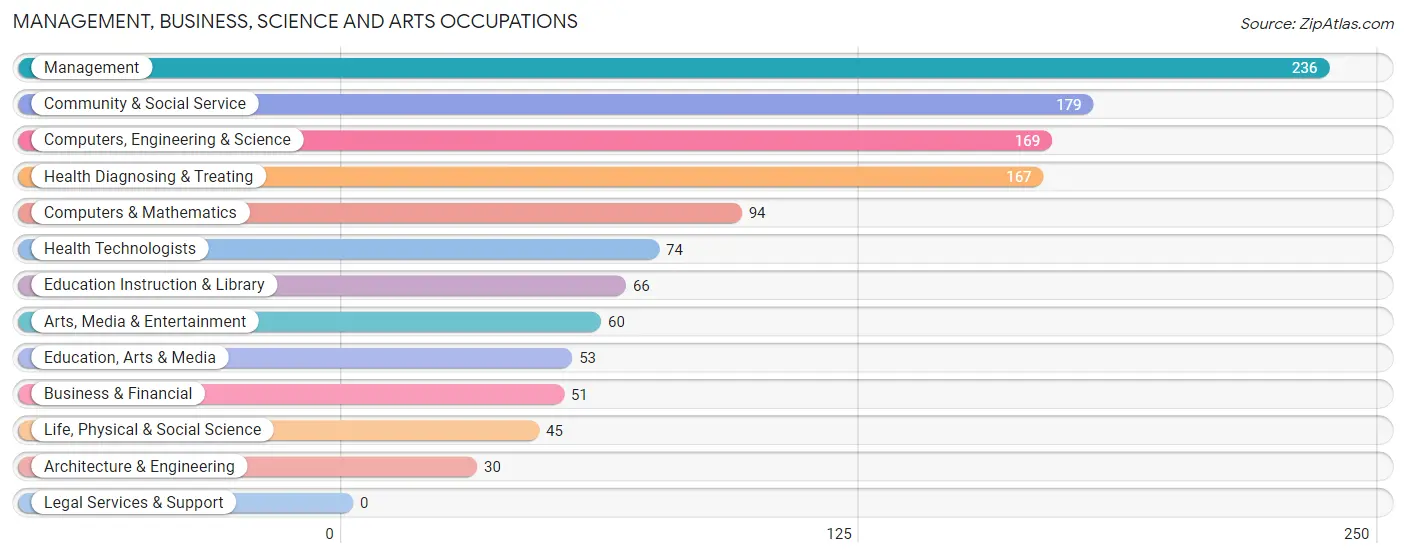
Management, Business, Science and Arts Occupations by Sex
Within the Management, Business, Science and Arts occupations in Manistee, the most male-oriented occupations are Architecture & Engineering (100.0%), Life, Physical & Social Science (100.0%), and Education, Arts & Media (100.0%), while the most female-oriented occupations are Health Diagnosing & Treating (76.0%), Health Technologists (66.2%), and Arts, Media & Entertainment (65.0%).
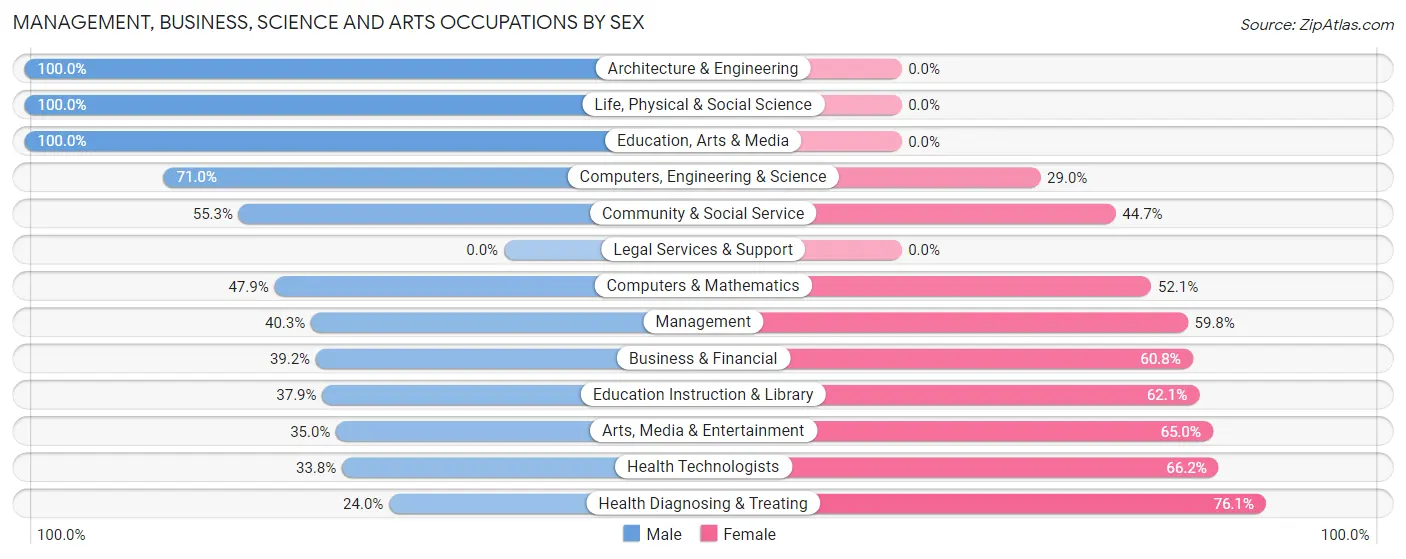
| Occupation | Male | Female |
| Management | 95 (40.3%) | 141 (59.8%) |
| Business & Financial | 20 (39.2%) | 31 (60.8%) |
| Computers, Engineering & Science | 120 (71.0%) | 49 (29.0%) |
| Computers & Mathematics | 45 (47.9%) | 49 (52.1%) |
| Architecture & Engineering | 30 (100.0%) | 0 (0.0%) |
| Life, Physical & Social Science | 45 (100.0%) | 0 (0.0%) |
| Community & Social Service | 99 (55.3%) | 80 (44.7%) |
| Education, Arts & Media | 53 (100.0%) | 0 (0.0%) |
| Legal Services & Support | 0 (0.0%) | 0 (0.0%) |
| Education Instruction & Library | 25 (37.9%) | 41 (62.1%) |
| Arts, Media & Entertainment | 21 (35.0%) | 39 (65.0%) |
| Health Diagnosing & Treating | 40 (23.9%) | 127 (76.0%) |
| Health Technologists | 25 (33.8%) | 49 (66.2%) |
| Total (Category) | 374 (46.6%) | 428 (53.4%) |
| Total (Overall) | 1,213 (48.0%) | 1,313 (52.0%) |
Services Occupations
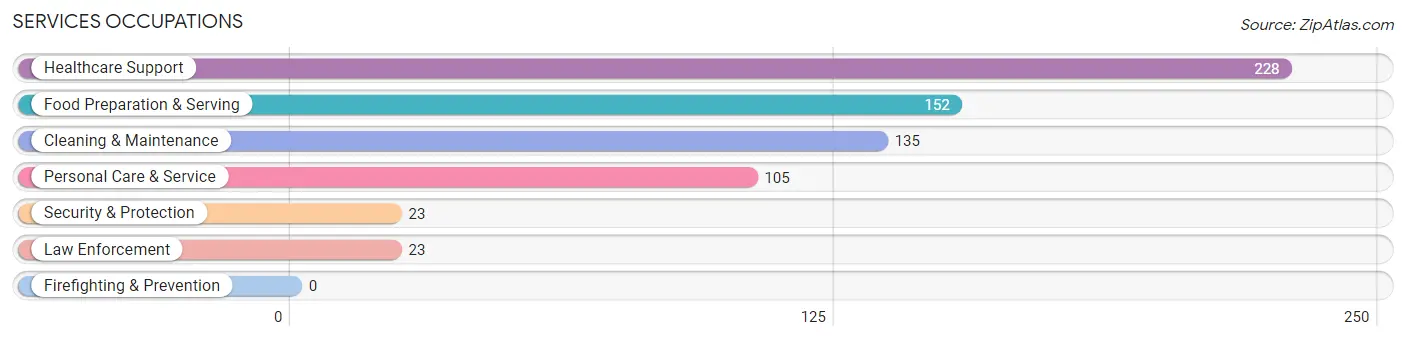
The most common Services occupations in Manistee are Healthcare Support (228 | 9.0%), Food Preparation & Serving (152 | 6.0%), Cleaning & Maintenance (135 | 5.3%), Personal Care & Service (105 | 4.2%), and Security & Protection (23 | 0.9%).
Services Occupations by Sex
Within the Services occupations in Manistee, the most male-oriented occupations are Security & Protection (100.0%), Law Enforcement (100.0%), and Cleaning & Maintenance (77.0%), while the most female-oriented occupations are Healthcare Support (90.3%), Food Preparation & Serving (73.0%), and Personal Care & Service (64.8%).
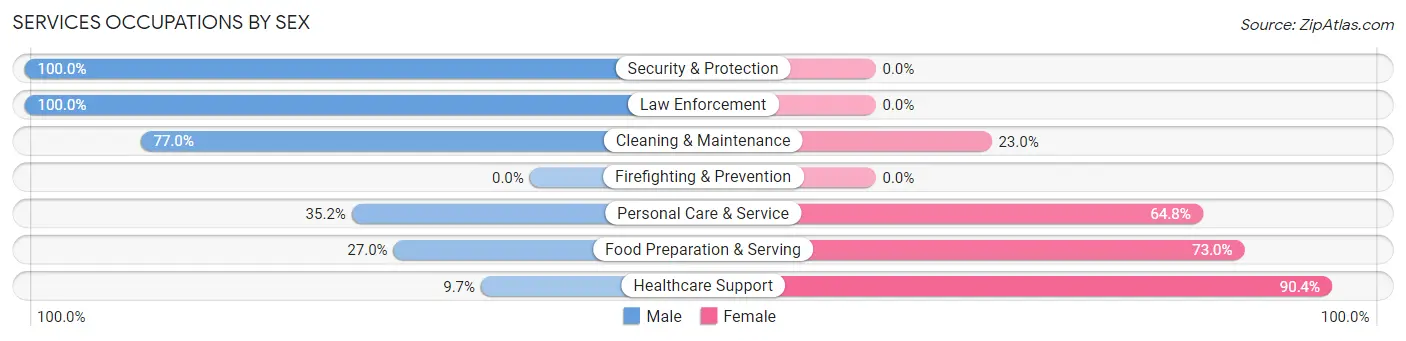
| Occupation | Male | Female |
| Healthcare Support | 22 (9.7%) | 206 (90.3%) |
| Security & Protection | 23 (100.0%) | 0 (0.0%) |
| Firefighting & Prevention | 0 (0.0%) | 0 (0.0%) |
| Law Enforcement | 23 (100.0%) | 0 (0.0%) |
| Food Preparation & Serving | 41 (27.0%) | 111 (73.0%) |
| Cleaning & Maintenance | 104 (77.0%) | 31 (23.0%) |
| Personal Care & Service | 37 (35.2%) | 68 (64.8%) |
| Total (Category) | 227 (35.3%) | 416 (64.7%) |
| Total (Overall) | 1,213 (48.0%) | 1,313 (52.0%) |
Sales and Office Occupations
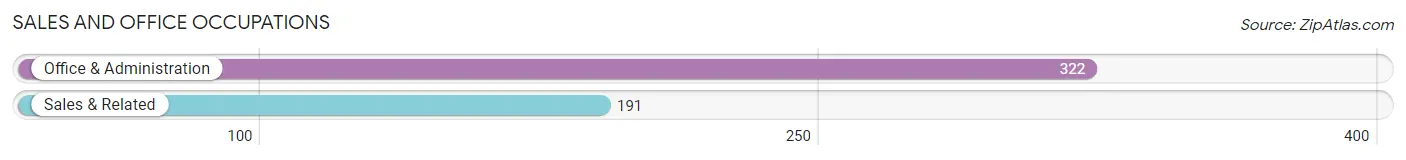
The most common Sales and Office occupations in Manistee are Office & Administration (322 | 12.8%), and Sales & Related (191 | 7.6%).
Sales and Office Occupations by Sex
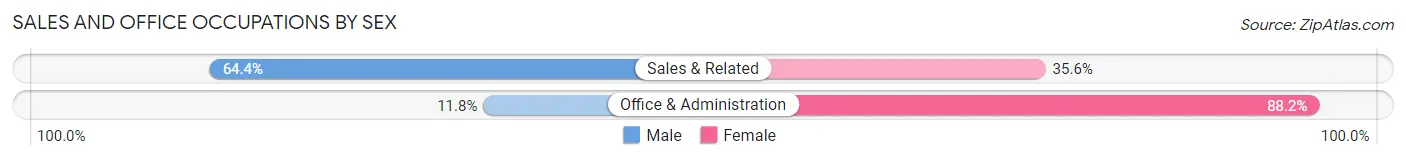
| Occupation | Male | Female |
| Sales & Related | 123 (64.4%) | 68 (35.6%) |
| Office & Administration | 38 (11.8%) | 284 (88.2%) |
| Total (Category) | 161 (31.4%) | 352 (68.6%) |
| Total (Overall) | 1,213 (48.0%) | 1,313 (52.0%) |
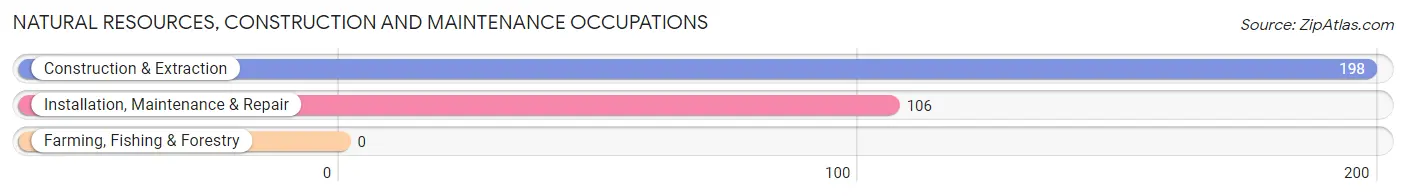
Natural Resources, Construction and Maintenance Occupations
The most common Natural Resources, Construction and Maintenance occupations in Manistee are Construction & Extraction (198 | 7.8%), and Installation, Maintenance & Repair (106 | 4.2%).
Natural Resources, Construction and Maintenance Occupations by Sex
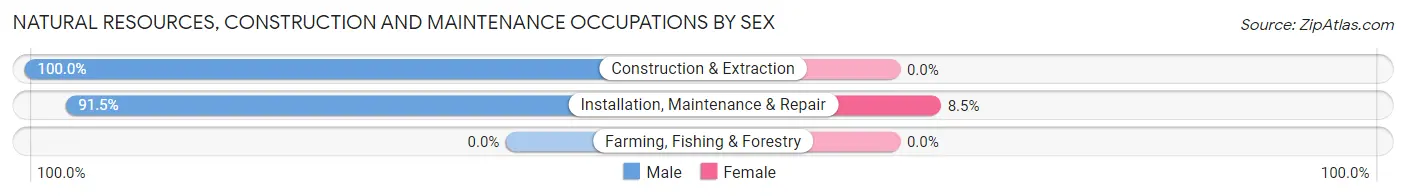
| Occupation | Male | Female |
| Farming, Fishing & Forestry | 0 (0.0%) | 0 (0.0%) |
| Construction & Extraction | 198 (100.0%) | 0 (0.0%) |
| Installation, Maintenance & Repair | 97 (91.5%) | 9 (8.5%) |
| Total (Category) | 295 (97.0%) | 9 (3.0%) |
| Total (Overall) | 1,213 (48.0%) | 1,313 (52.0%) |
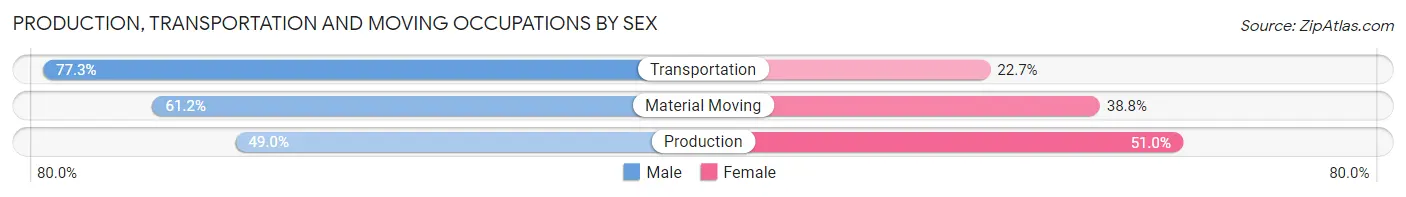
Production, Transportation and Moving Occupations
The most common Production, Transportation and Moving occupations in Manistee are Material Moving (116 | 4.6%), Production (104 | 4.1%), and Transportation (44 | 1.7%).
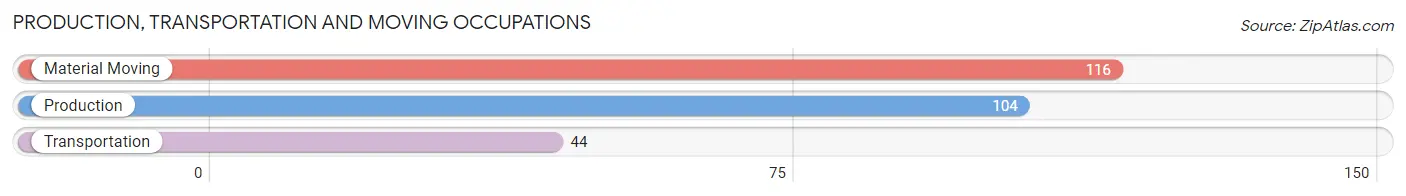
Production, Transportation and Moving Occupations by Sex
| Occupation | Male | Female |
| Production | 51 (49.0%) | 53 (51.0%) |
| Transportation | 34 (77.3%) | 10 (22.7%) |
| Material Moving | 71 (61.2%) | 45 (38.8%) |
| Total (Category) | 156 (59.1%) | 108 (40.9%) |
| Total (Overall) | 1,213 (48.0%) | 1,313 (52.0%) |
Employment Industries by Sex in Manistee
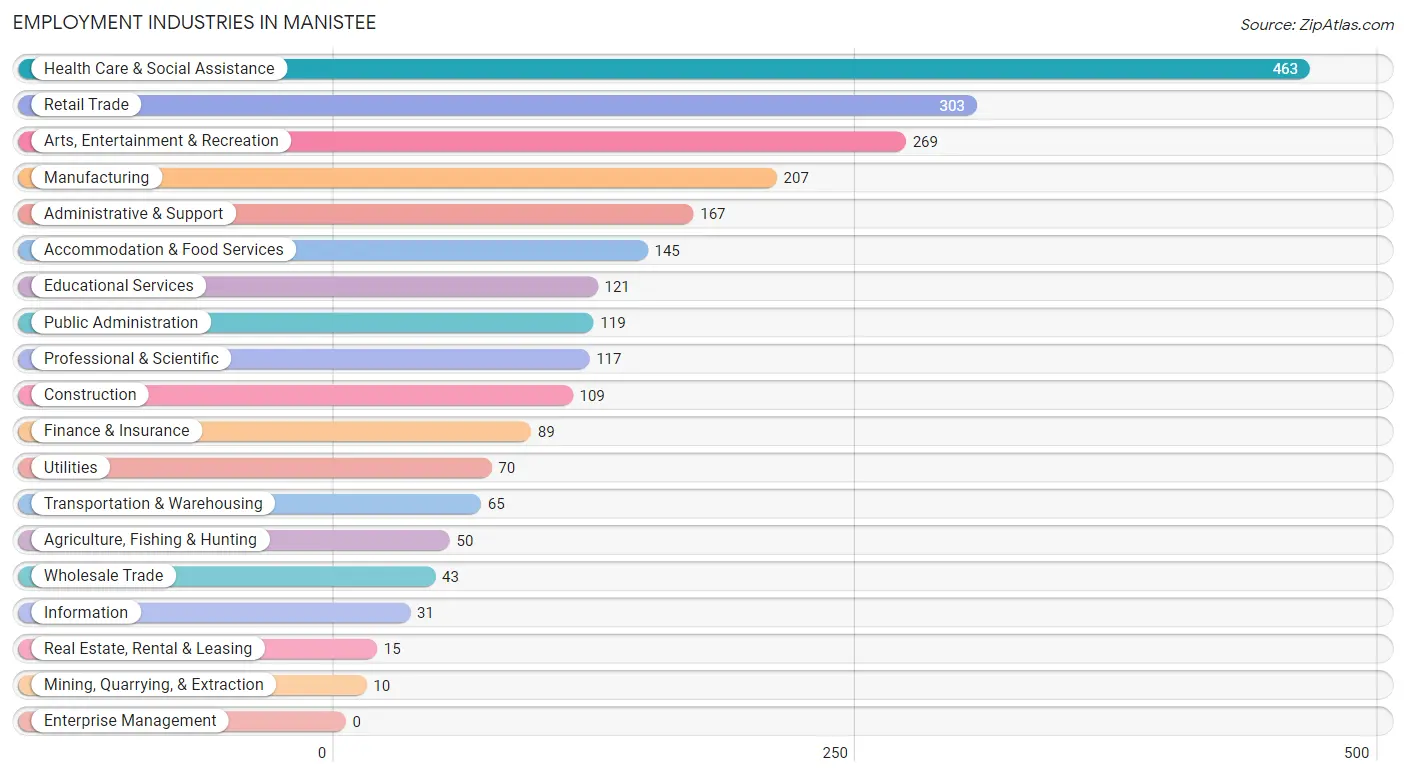
Employment Industries in Manistee
The major employment industries in Manistee include Health Care & Social Assistance (463 | 18.3%), Retail Trade (303 | 12.0%), Arts, Entertainment & Recreation (269 | 10.6%), Manufacturing (207 | 8.2%), and Administrative & Support (167 | 6.6%).
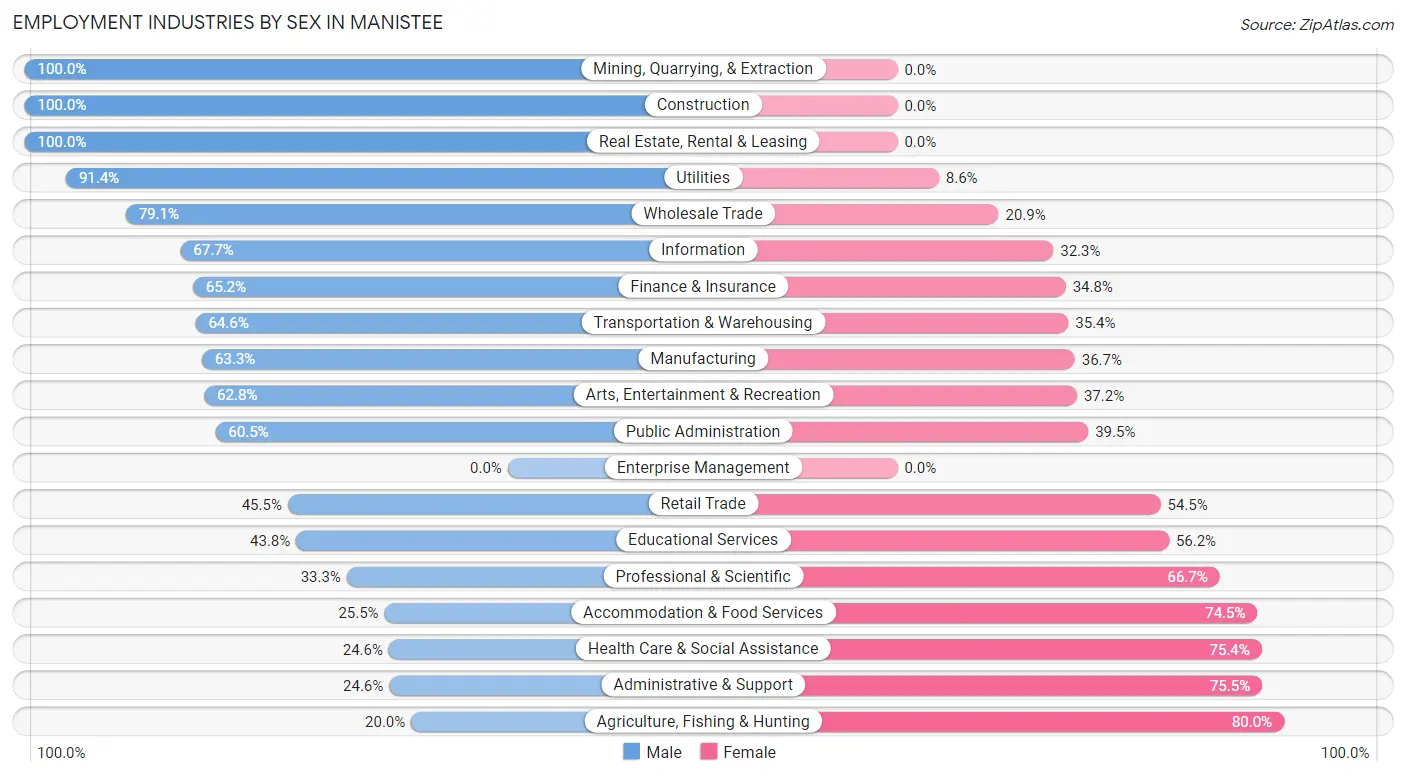
Employment Industries by Sex in Manistee
The Manistee industries that see more men than women are Mining, Quarrying, & Extraction (100.0%), Construction (100.0%), and Real Estate, Rental & Leasing (100.0%), whereas the industries that tend to have a higher number of women are Agriculture, Fishing & Hunting (80.0%), Administrative & Support (75.4%), and Health Care & Social Assistance (75.4%).
| Industry | Male | Female |
| Agriculture, Fishing & Hunting | 10 (20.0%) | 40 (80.0%) |
| Mining, Quarrying, & Extraction | 10 (100.0%) | 0 (0.0%) |
| Construction | 109 (100.0%) | 0 (0.0%) |
| Manufacturing | 131 (63.3%) | 76 (36.7%) |
| Wholesale Trade | 34 (79.1%) | 9 (20.9%) |
| Retail Trade | 138 (45.5%) | 165 (54.5%) |
| Transportation & Warehousing | 42 (64.6%) | 23 (35.4%) |
| Utilities | 64 (91.4%) | 6 (8.6%) |
| Information | 21 (67.7%) | 10 (32.3%) |
| Finance & Insurance | 58 (65.2%) | 31 (34.8%) |
| Real Estate, Rental & Leasing | 15 (100.0%) | 0 (0.0%) |
| Professional & Scientific | 39 (33.3%) | 78 (66.7%) |
| Enterprise Management | 0 (0.0%) | 0 (0.0%) |
| Administrative & Support | 41 (24.5%) | 126 (75.4%) |
| Educational Services | 53 (43.8%) | 68 (56.2%) |
| Health Care & Social Assistance | 114 (24.6%) | 349 (75.4%) |
| Arts, Entertainment & Recreation | 169 (62.8%) | 100 (37.2%) |
| Accommodation & Food Services | 37 (25.5%) | 108 (74.5%) |
| Public Administration | 72 (60.5%) | 47 (39.5%) |
| Total | 1,213 (48.0%) | 1,313 (52.0%) |
Education in Manistee
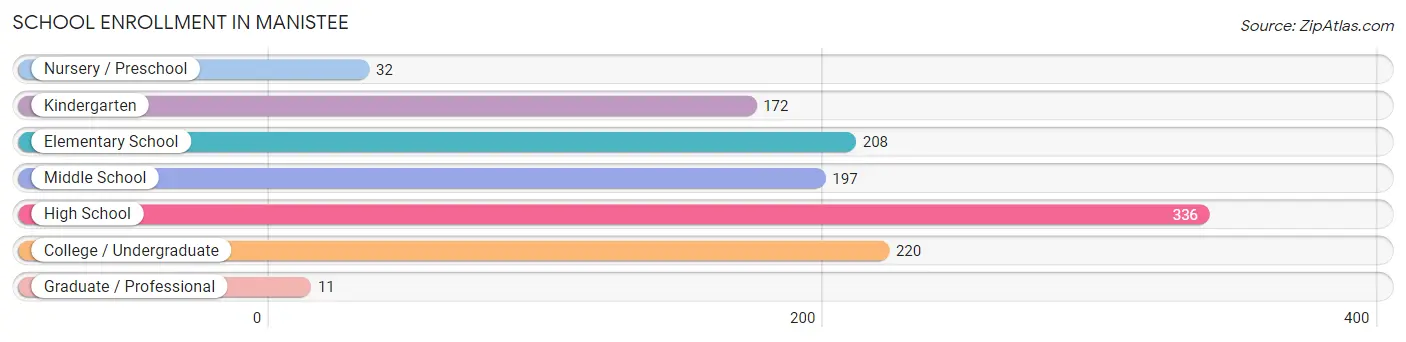
School Enrollment in Manistee
The most common levels of schooling among the 1,176 students in Manistee are high school (336 | 28.6%), college / undergraduate (220 | 18.7%), and elementary school (208 | 17.7%).
| School Level | # Students | % Students |
| Nursery / Preschool | 32 | 2.7% |
| Kindergarten | 172 | 14.6% |
| Elementary School | 208 | 17.7% |
| Middle School | 197 | 16.8% |
| High School | 336 | 28.6% |
| College / Undergraduate | 220 | 18.7% |
| Graduate / Professional | 11 | 0.9% |
| Total | 1,176 | 100.0% |
School Enrollment by Age by Funding Source in Manistee
Out of a total of 1,176 students who are enrolled in schools in Manistee, 87 (7.4%) attend a private institution, while the remaining 1,089 (92.6%) are enrolled in public schools. The age group of 20 to 24 year olds has the highest likelihood of being enrolled in private schools, with 43 (49.4% in the age bracket) enrolled. Conversely, the age group of 3 to 4 year olds has the lowest likelihood of being enrolled in a private school, with 32 (100.0% in the age bracket) attending a public institution.
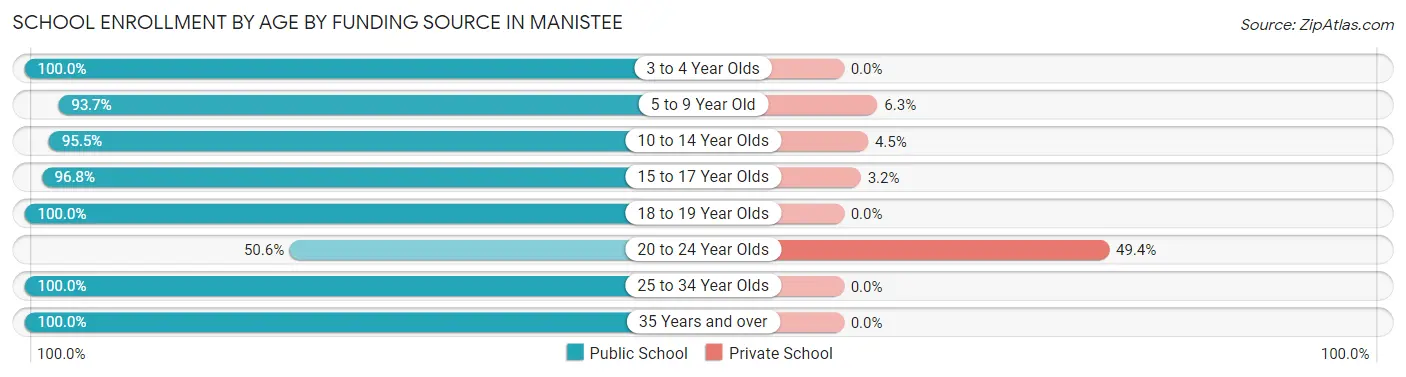
| Age Bracket | Public School | Private School |
| 3 to 4 Year Olds | 32 (100.0%) | 0 (0.0%) |
| 5 to 9 Year Old | 343 (93.7%) | 23 (6.3%) |
| 10 to 14 Year Olds | 295 (95.5%) | 14 (4.5%) |
| 15 to 17 Year Olds | 214 (96.8%) | 7 (3.2%) |
| 18 to 19 Year Olds | 43 (100.0%) | 0 (0.0%) |
| 20 to 24 Year Olds | 44 (50.6%) | 43 (49.4%) |
| 25 to 34 Year Olds | 77 (100.0%) | 0 (0.0%) |
| 35 Years and over | 41 (100.0%) | 0 (0.0%) |
| Total | 1,089 (92.6%) | 87 (7.4%) |
Educational Attainment by Field of Study in Manistee
Science & technology (142 | 13.4%), social sciences (112 | 10.6%), engineering (107 | 10.1%), arts & humanities (99 | 9.3%), and physical & health sciences (89 | 8.4%) are the most common fields of study among 1,061 individuals in Manistee who have obtained a bachelor's degree or higher.
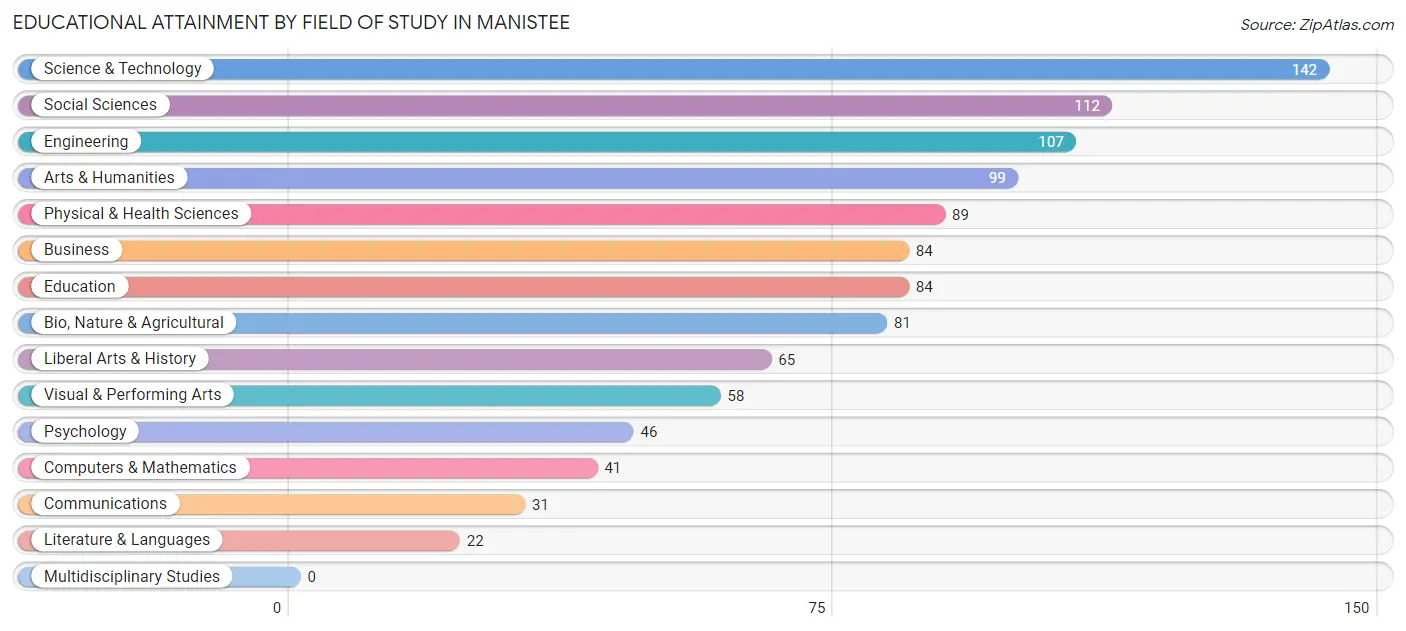
| Field of Study | # Graduates | % Graduates |
| Computers & Mathematics | 41 | 3.9% |
| Bio, Nature & Agricultural | 81 | 7.6% |
| Physical & Health Sciences | 89 | 8.4% |
| Psychology | 46 | 4.3% |
| Social Sciences | 112 | 10.6% |
| Engineering | 107 | 10.1% |
| Multidisciplinary Studies | 0 | 0.0% |
| Science & Technology | 142 | 13.4% |
| Business | 84 | 7.9% |
| Education | 84 | 7.9% |
| Literature & Languages | 22 | 2.1% |
| Liberal Arts & History | 65 | 6.1% |
| Visual & Performing Arts | 58 | 5.5% |
| Communications | 31 | 2.9% |
| Arts & Humanities | 99 | 9.3% |
| Total | 1,061 | 100.0% |
Transportation & Commute in Manistee
Vehicle Availability by Sex in Manistee
The most prevalent vehicle ownership categories in Manistee are males with 2 vehicles (434, accounting for 35.0%) and females with 2 vehicles (475, making up 33.9%).
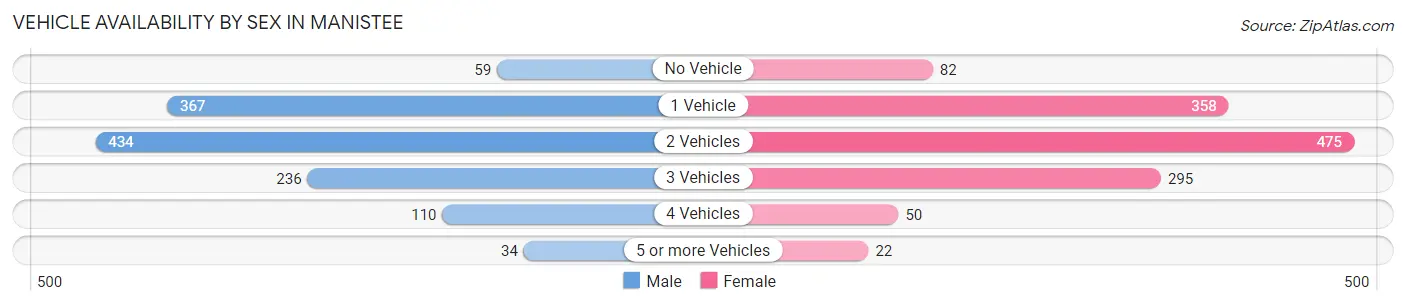
| Vehicles Available | Male | Female |
| No Vehicle | 59 (4.8%) | 82 (6.4%) |
| 1 Vehicle | 367 (29.6%) | 358 (27.9%) |
| 2 Vehicles | 434 (35.0%) | 475 (37.0%) |
| 3 Vehicles | 236 (19.0%) | 295 (23.0%) |
| 4 Vehicles | 110 (8.9%) | 50 (3.9%) |
| 5 or more Vehicles | 34 (2.7%) | 22 (1.7%) |
| Total | 1,240 (100.0%) | 1,282 (100.0%) |
Commute Time in Manistee
The most frequently occuring commute durations in Manistee are 5 to 9 minutes (710 commuters, 30.8%), 10 to 14 minutes (528 commuters, 22.9%), and 15 to 19 minutes (413 commuters, 17.9%).
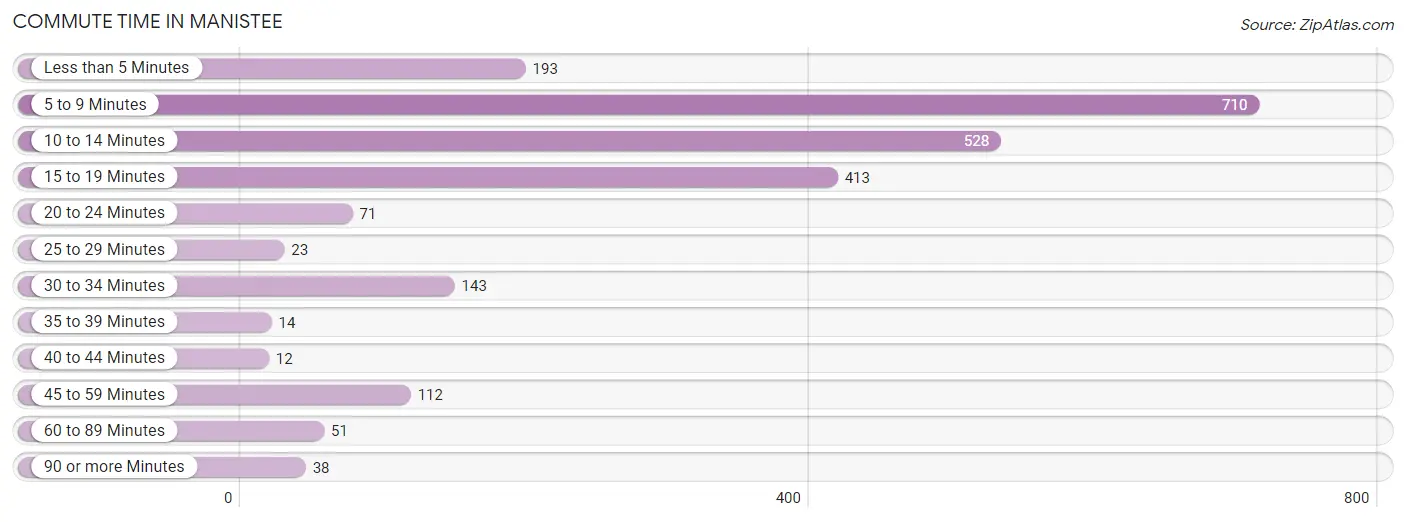
| Commute Time | # Commuters | % Commuters |
| Less than 5 Minutes | 193 | 8.4% |
| 5 to 9 Minutes | 710 | 30.8% |
| 10 to 14 Minutes | 528 | 22.9% |
| 15 to 19 Minutes | 413 | 17.9% |
| 20 to 24 Minutes | 71 | 3.1% |
| 25 to 29 Minutes | 23 | 1.0% |
| 30 to 34 Minutes | 143 | 6.2% |
| 35 to 39 Minutes | 14 | 0.6% |
| 40 to 44 Minutes | 12 | 0.5% |
| 45 to 59 Minutes | 112 | 4.9% |
| 60 to 89 Minutes | 51 | 2.2% |
| 90 or more Minutes | 38 | 1.7% |
Commute Time by Sex in Manistee
The most common commute times in Manistee are 5 to 9 minutes (326 commuters, 28.8%) for males and 5 to 9 minutes (384 commuters, 32.6%) for females.
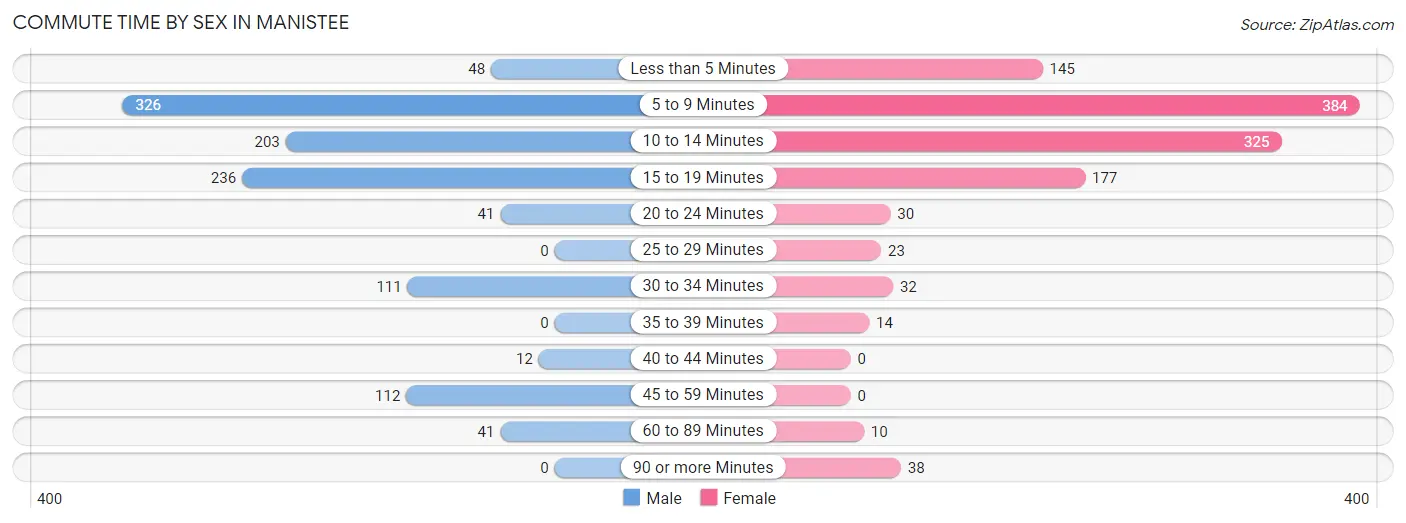
| Commute Time | Male | Female |
| Less than 5 Minutes | 48 (4.3%) | 145 (12.3%) |
| 5 to 9 Minutes | 326 (28.8%) | 384 (32.6%) |
| 10 to 14 Minutes | 203 (18.0%) | 325 (27.6%) |
| 15 to 19 Minutes | 236 (20.9%) | 177 (15.0%) |
| 20 to 24 Minutes | 41 (3.6%) | 30 (2.5%) |
| 25 to 29 Minutes | 0 (0.0%) | 23 (1.9%) |
| 30 to 34 Minutes | 111 (9.8%) | 32 (2.7%) |
| 35 to 39 Minutes | 0 (0.0%) | 14 (1.2%) |
| 40 to 44 Minutes | 12 (1.1%) | 0 (0.0%) |
| 45 to 59 Minutes | 112 (9.9%) | 0 (0.0%) |
| 60 to 89 Minutes | 41 (3.6%) | 10 (0.9%) |
| 90 or more Minutes | 0 (0.0%) | 38 (3.2%) |
Time of Departure to Work by Sex in Manistee
The most frequent times of departure to work in Manistee are 7:30 AM to 7:59 AM (246, 21.8%) for males and 7:30 AM to 7:59 AM (236, 20.0%) for females.
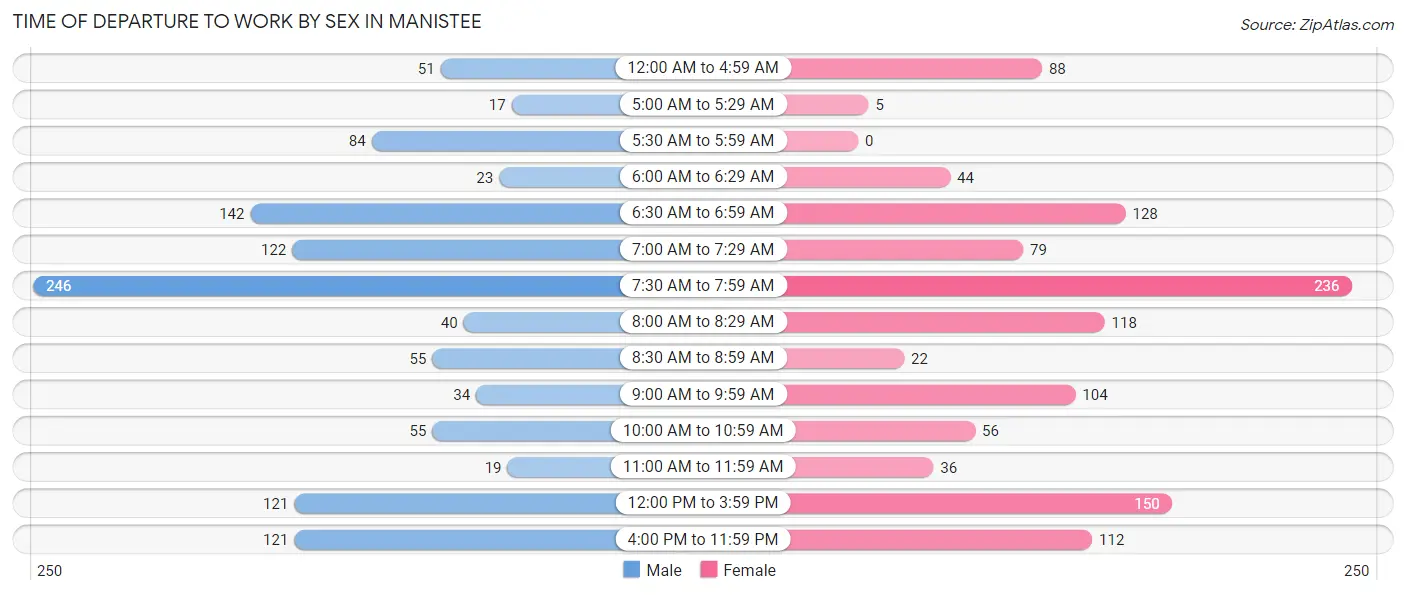
| Time of Departure | Male | Female |
| 12:00 AM to 4:59 AM | 51 (4.5%) | 88 (7.5%) |
| 5:00 AM to 5:29 AM | 17 (1.5%) | 5 (0.4%) |
| 5:30 AM to 5:59 AM | 84 (7.4%) | 0 (0.0%) |
| 6:00 AM to 6:29 AM | 23 (2.0%) | 44 (3.7%) |
| 6:30 AM to 6:59 AM | 142 (12.6%) | 128 (10.9%) |
| 7:00 AM to 7:29 AM | 122 (10.8%) | 79 (6.7%) |
| 7:30 AM to 7:59 AM | 246 (21.8%) | 236 (20.0%) |
| 8:00 AM to 8:29 AM | 40 (3.5%) | 118 (10.0%) |
| 8:30 AM to 8:59 AM | 55 (4.9%) | 22 (1.9%) |
| 9:00 AM to 9:59 AM | 34 (3.0%) | 104 (8.8%) |
| 10:00 AM to 10:59 AM | 55 (4.9%) | 56 (4.8%) |
| 11:00 AM to 11:59 AM | 19 (1.7%) | 36 (3.1%) |
| 12:00 PM to 3:59 PM | 121 (10.7%) | 150 (12.7%) |
| 4:00 PM to 11:59 PM | 121 (10.7%) | 112 (9.5%) |
| Total | 1,130 (100.0%) | 1,178 (100.0%) |
Housing Occupancy in Manistee
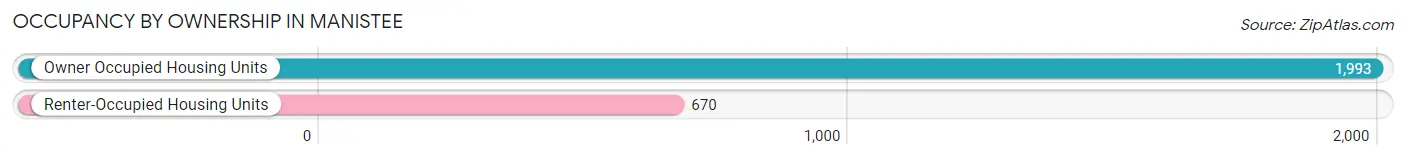
Occupancy by Ownership in Manistee
Of the total 2,663 dwellings in Manistee, owner-occupied units account for 1,993 (74.8%), while renter-occupied units make up 670 (25.2%).
| Occupancy | # Housing Units | % Housing Units |
| Owner Occupied Housing Units | 1,993 | 74.8% |
| Renter-Occupied Housing Units | 670 | 25.2% |
| Total Occupied Housing Units | 2,663 | 100.0% |
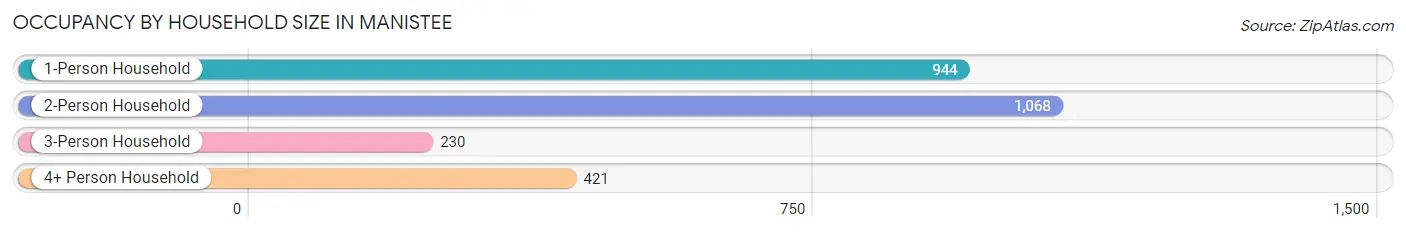
Occupancy by Household Size in Manistee
| Household Size | # Housing Units | % Housing Units |
| 1-Person Household | 944 | 35.4% |
| 2-Person Household | 1,068 | 40.1% |
| 3-Person Household | 230 | 8.6% |
| 4+ Person Household | 421 | 15.8% |
| Total Housing Units | 2,663 | 100.0% |
Occupancy by Ownership by Household Size in Manistee
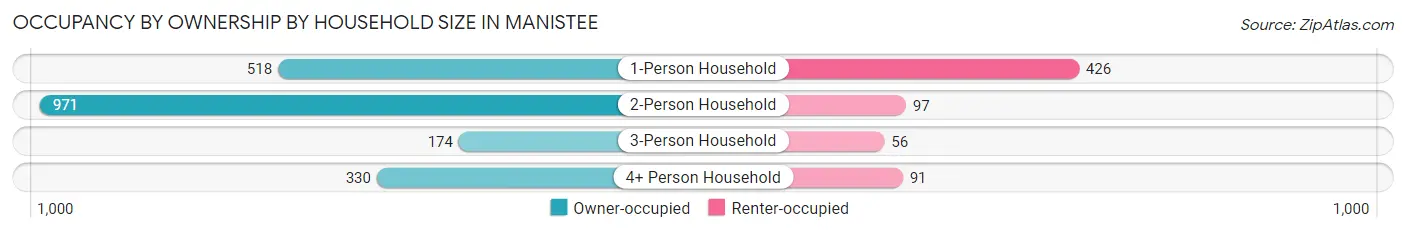
| Household Size | Owner-occupied | Renter-occupied |
| 1-Person Household | 518 (54.9%) | 426 (45.1%) |
| 2-Person Household | 971 (90.9%) | 97 (9.1%) |
| 3-Person Household | 174 (75.6%) | 56 (24.3%) |
| 4+ Person Household | 330 (78.4%) | 91 (21.6%) |
| Total Housing Units | 1,993 (74.8%) | 670 (25.2%) |
Occupancy by Educational Attainment in Manistee
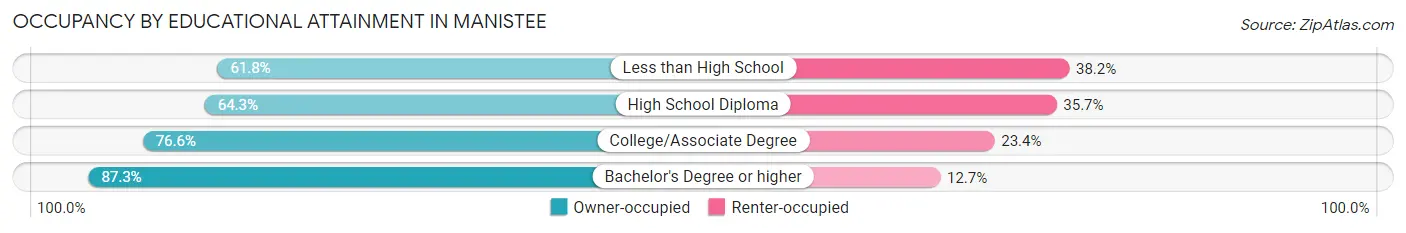
| Household Size | Owner-occupied | Renter-occupied |
| Less than High School | 105 (61.8%) | 65 (38.2%) |
| High School Diploma | 473 (64.3%) | 263 (35.7%) |
| College/Associate Degree | 850 (76.6%) | 260 (23.4%) |
| Bachelor's Degree or higher | 565 (87.3%) | 82 (12.7%) |
Occupancy by Age of Householder in Manistee
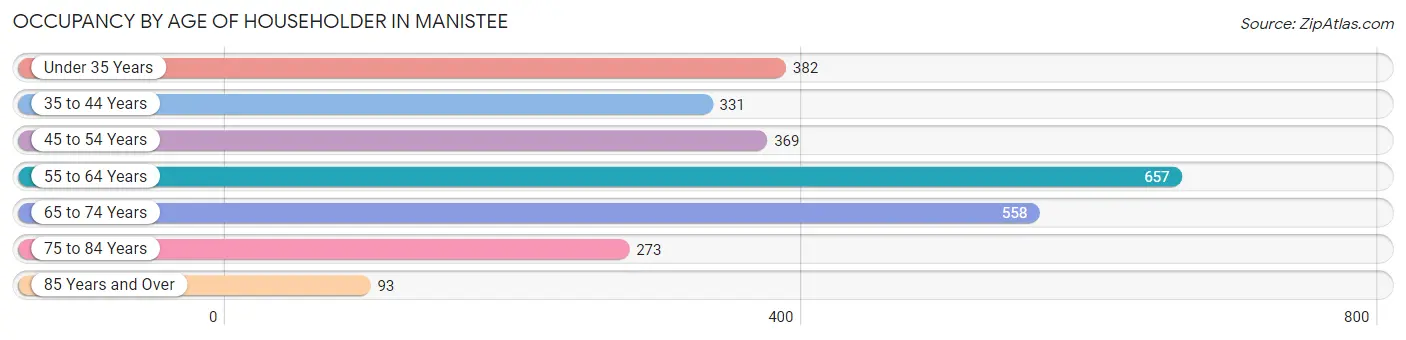
| Age Bracket | # Households | % Households |
| Under 35 Years | 382 | 14.3% |
| 35 to 44 Years | 331 | 12.4% |
| 45 to 54 Years | 369 | 13.9% |
| 55 to 64 Years | 657 | 24.7% |
| 65 to 74 Years | 558 | 20.9% |
| 75 to 84 Years | 273 | 10.2% |
| 85 Years and Over | 93 | 3.5% |
| Total | 2,663 | 100.0% |
Housing Finances in Manistee
Median Income by Occupancy in Manistee
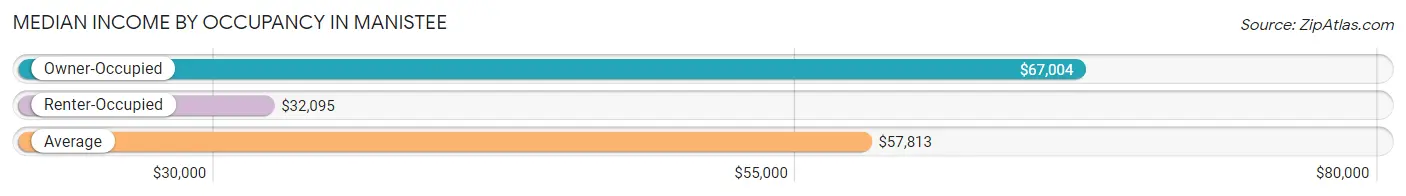
| Occupancy Type | # Households | Median Income |
| Owner-Occupied | 1,993 (74.8%) | $67,004 |
| Renter-Occupied | 670 (25.2%) | $32,095 |
| Average | 2,663 (100.0%) | $57,813 |
Occupancy by Householder Income Bracket in Manistee
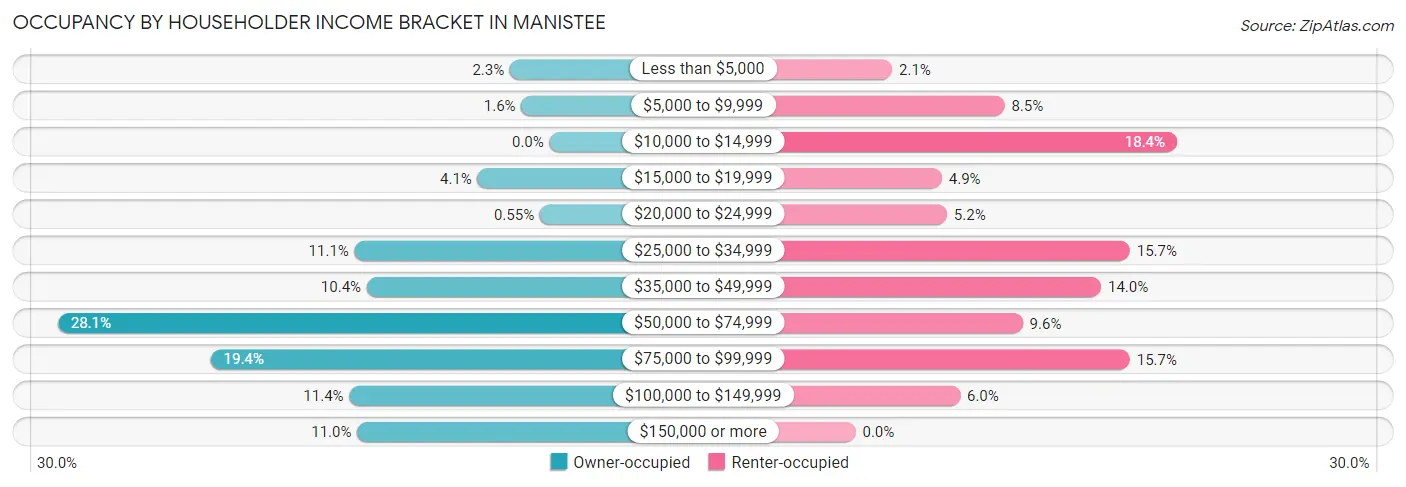
| Income Bracket | Owner-occupied | Renter-occupied |
| Less than $5,000 | 45 (2.3%) | 14 (2.1%) |
| $5,000 to $9,999 | 32 (1.6%) | 57 (8.5%) |
| $10,000 to $14,999 | 0 (0.0%) | 123 (18.4%) |
| $15,000 to $19,999 | 82 (4.1%) | 33 (4.9%) |
| $20,000 to $24,999 | 11 (0.5%) | 35 (5.2%) |
| $25,000 to $34,999 | 222 (11.1%) | 105 (15.7%) |
| $35,000 to $49,999 | 208 (10.4%) | 94 (14.0%) |
| $50,000 to $74,999 | 560 (28.1%) | 64 (9.6%) |
| $75,000 to $99,999 | 386 (19.4%) | 105 (15.7%) |
| $100,000 to $149,999 | 228 (11.4%) | 40 (6.0%) |
| $150,000 or more | 219 (11.0%) | 0 (0.0%) |
| Total | 1,993 (100.0%) | 670 (100.0%) |
Monthly Housing Cost Tiers in Manistee
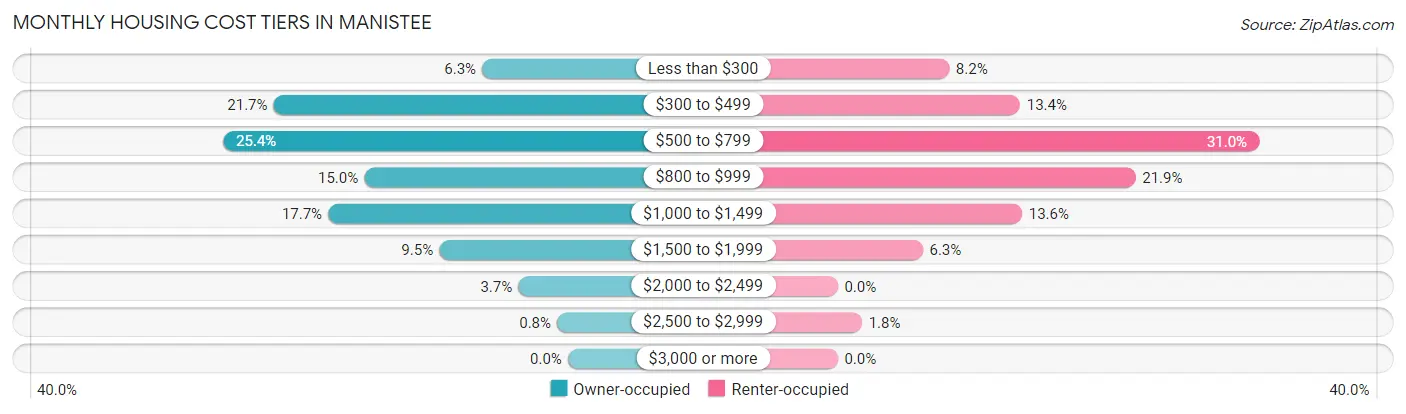
| Monthly Cost | Owner-occupied | Renter-occupied |
| Less than $300 | 126 (6.3%) | 55 (8.2%) |
| $300 to $499 | 432 (21.7%) | 90 (13.4%) |
| $500 to $799 | 506 (25.4%) | 208 (31.0%) |
| $800 to $999 | 299 (15.0%) | 147 (21.9%) |
| $1,000 to $1,499 | 352 (17.7%) | 91 (13.6%) |
| $1,500 to $1,999 | 189 (9.5%) | 42 (6.3%) |
| $2,000 to $2,499 | 73 (3.7%) | 0 (0.0%) |
| $2,500 to $2,999 | 16 (0.8%) | 12 (1.8%) |
| $3,000 or more | 0 (0.0%) | 0 (0.0%) |
| Total | 1,993 (100.0%) | 670 (100.0%) |
Physical Housing Characteristics in Manistee
Housing Structures in Manistee
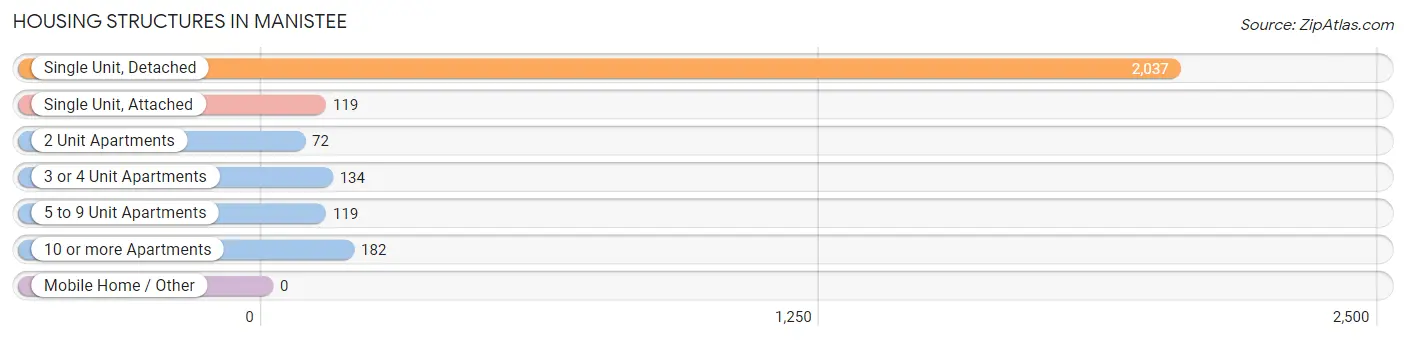
| Structure Type | # Housing Units | % Housing Units |
| Single Unit, Detached | 2,037 | 76.5% |
| Single Unit, Attached | 119 | 4.5% |
| 2 Unit Apartments | 72 | 2.7% |
| 3 or 4 Unit Apartments | 134 | 5.0% |
| 5 to 9 Unit Apartments | 119 | 4.5% |
| 10 or more Apartments | 182 | 6.8% |
| Mobile Home / Other | 0 | 0.0% |
| Total | 2,663 | 100.0% |
Housing Structures by Occupancy in Manistee
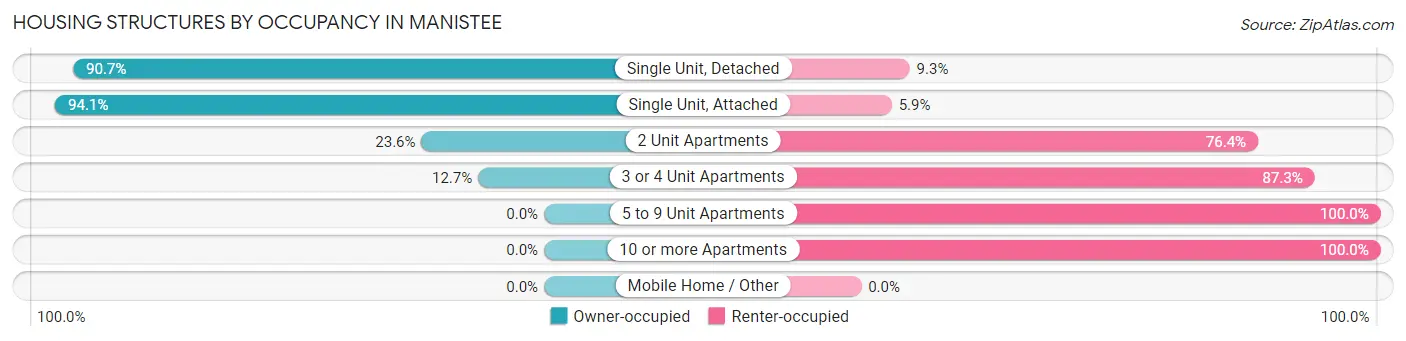
| Structure Type | Owner-occupied | Renter-occupied |
| Single Unit, Detached | 1,847 (90.7%) | 190 (9.3%) |
| Single Unit, Attached | 112 (94.1%) | 7 (5.9%) |
| 2 Unit Apartments | 17 (23.6%) | 55 (76.4%) |
| 3 or 4 Unit Apartments | 17 (12.7%) | 117 (87.3%) |
| 5 to 9 Unit Apartments | 0 (0.0%) | 119 (100.0%) |
| 10 or more Apartments | 0 (0.0%) | 182 (100.0%) |
| Mobile Home / Other | 0 (0.0%) | 0 (0.0%) |
| Total | 1,993 (74.8%) | 670 (25.2%) |
Housing Structures by Number of Rooms in Manistee
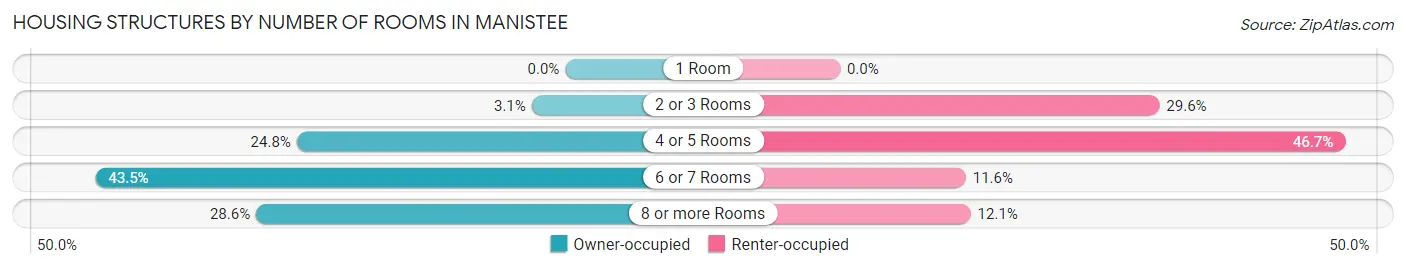
| Number of Rooms | Owner-occupied | Renter-occupied |
| 1 Room | 0 (0.0%) | 0 (0.0%) |
| 2 or 3 Rooms | 62 (3.1%) | 198 (29.5%) |
| 4 or 5 Rooms | 495 (24.8%) | 313 (46.7%) |
| 6 or 7 Rooms | 866 (43.4%) | 78 (11.6%) |
| 8 or more Rooms | 570 (28.6%) | 81 (12.1%) |
| Total | 1,993 (100.0%) | 670 (100.0%) |
Housing Structure by Heating Type in Manistee
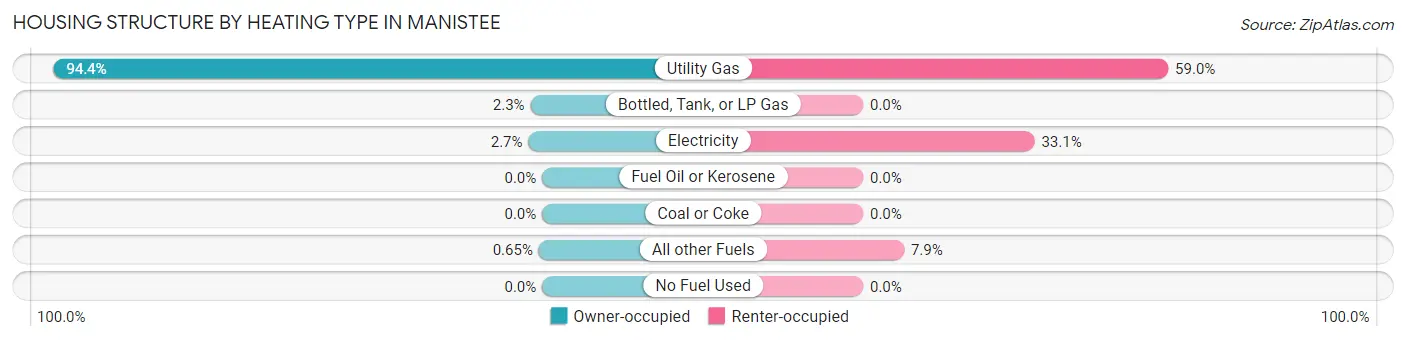
| Heating Type | Owner-occupied | Renter-occupied |
| Utility Gas | 1,882 (94.4%) | 395 (59.0%) |
| Bottled, Tank, or LP Gas | 45 (2.3%) | 0 (0.0%) |
| Electricity | 53 (2.7%) | 222 (33.1%) |
| Fuel Oil or Kerosene | 0 (0.0%) | 0 (0.0%) |
| Coal or Coke | 0 (0.0%) | 0 (0.0%) |
| All other Fuels | 13 (0.6%) | 53 (7.9%) |
| No Fuel Used | 0 (0.0%) | 0 (0.0%) |
| Total | 1,993 (100.0%) | 670 (100.0%) |
Household Vehicle Usage in Manistee
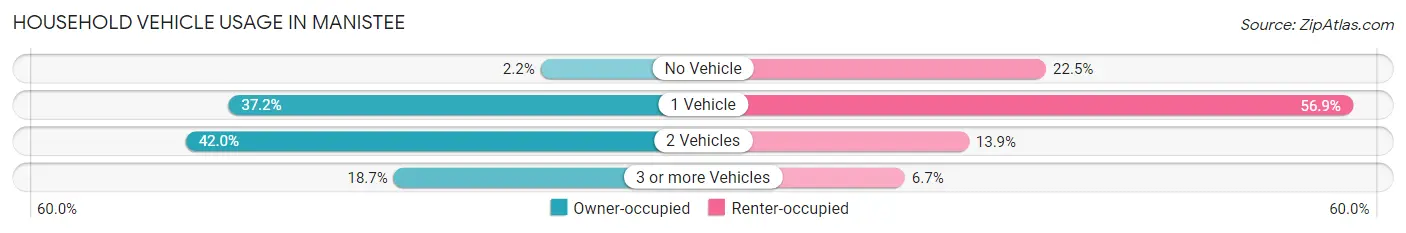
| Vehicles per Household | Owner-occupied | Renter-occupied |
| No Vehicle | 44 (2.2%) | 151 (22.5%) |
| 1 Vehicle | 741 (37.2%) | 381 (56.9%) |
| 2 Vehicles | 836 (41.9%) | 93 (13.9%) |
| 3 or more Vehicles | 372 (18.7%) | 45 (6.7%) |
| Total | 1,993 (100.0%) | 670 (100.0%) |
Real Estate & Mortgages in Manistee
Real Estate and Mortgage Overview in Manistee
| Characteristic | Without Mortgage | With Mortgage |
| Housing Units | 953 | 1,040 |
| Median Property Value | $138,700 | $146,000 |
| Median Household Income | $57,829 | $117 |
| Monthly Housing Costs | $454 | $0 |
| Real Estate Taxes | $1,872 | $60 |
Property Value by Mortgage Status in Manistee
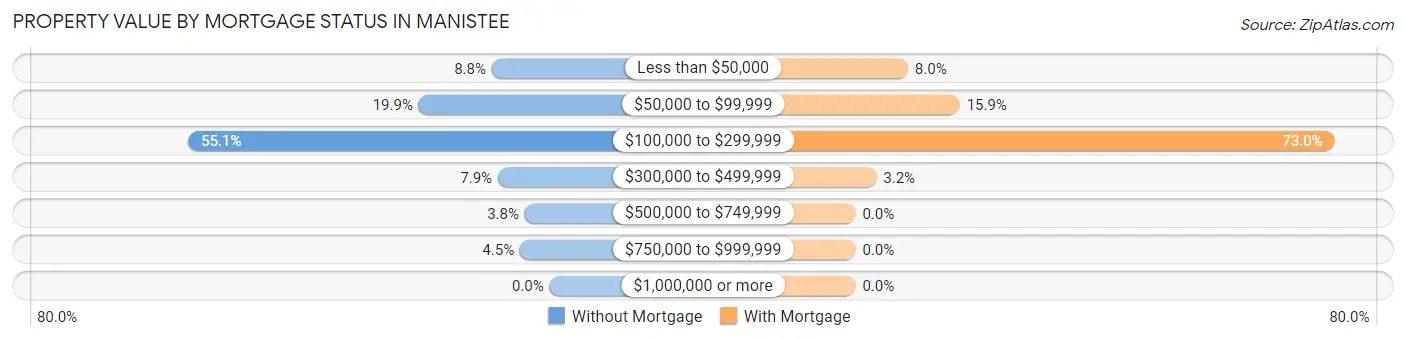
| Property Value | Without Mortgage | With Mortgage |
| Less than $50,000 | 84 (8.8%) | 83 (8.0%) |
| $50,000 to $99,999 | 190 (19.9%) | 165 (15.9%) |
| $100,000 to $299,999 | 525 (55.1%) | 759 (73.0%) |
| $300,000 to $499,999 | 75 (7.9%) | 33 (3.2%) |
| $500,000 to $749,999 | 36 (3.8%) | 0 (0.0%) |
| $750,000 to $999,999 | 43 (4.5%) | 0 (0.0%) |
| $1,000,000 or more | 0 (0.0%) | 0 (0.0%) |
| Total | 953 (100.0%) | 1,040 (100.0%) |
Household Income by Mortgage Status in Manistee
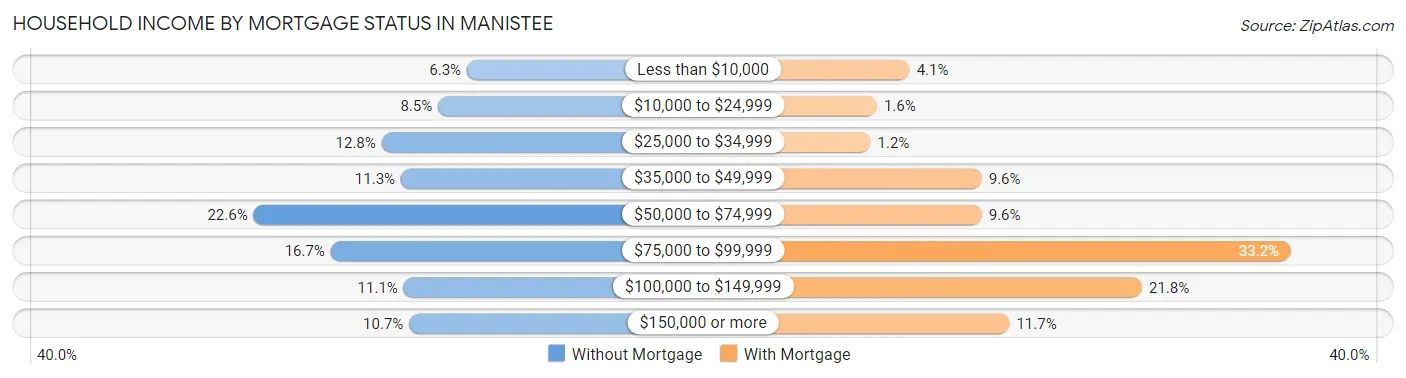
| Household Income | Without Mortgage | With Mortgage |
| Less than $10,000 | 60 (6.3%) | 43 (4.1%) |
| $10,000 to $24,999 | 81 (8.5%) | 17 (1.6%) |
| $25,000 to $34,999 | 122 (12.8%) | 12 (1.1%) |
| $35,000 to $49,999 | 108 (11.3%) | 100 (9.6%) |
| $50,000 to $74,999 | 215 (22.6%) | 100 (9.6%) |
| $75,000 to $99,999 | 159 (16.7%) | 345 (33.2%) |
| $100,000 to $149,999 | 106 (11.1%) | 227 (21.8%) |
| $150,000 or more | 102 (10.7%) | 122 (11.7%) |
| Total | 953 (100.0%) | 1,040 (100.0%) |
Property Value to Household Income Ratio in Manistee
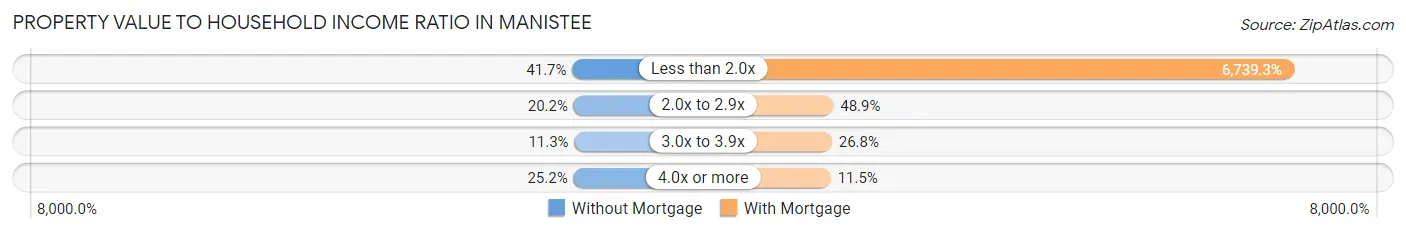
| Value-to-Income Ratio | Without Mortgage | With Mortgage |
| Less than 2.0x | 397 (41.7%) | 70,089 (6,739.3%) |
| 2.0x to 2.9x | 192 (20.2%) | 509 (48.9%) |
| 3.0x to 3.9x | 108 (11.3%) | 279 (26.8%) |
| 4.0x or more | 240 (25.2%) | 120 (11.5%) |
| Total | 953 (100.0%) | 1,040 (100.0%) |
Real Estate Taxes by Mortgage Status in Manistee
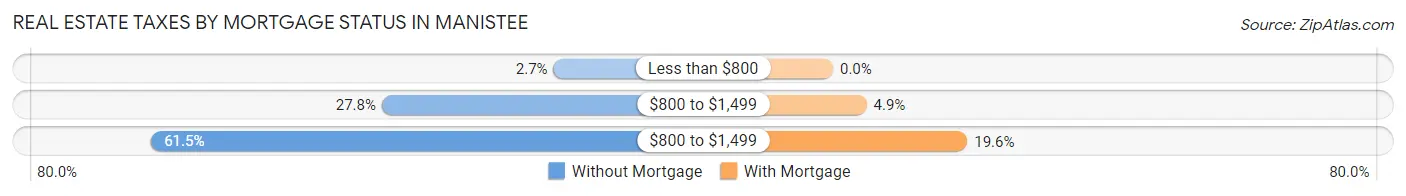
| Property Taxes | Without Mortgage | With Mortgage |
| Less than $800 | 26 (2.7%) | 0 (0.0%) |
| $800 to $1,499 | 265 (27.8%) | 51 (4.9%) |
| $800 to $1,499 | 586 (61.5%) | 204 (19.6%) |
| Total | 953 (100.0%) | 1,040 (100.0%) |
Health & Disability in Manistee
Health Insurance Coverage by Age in Manistee
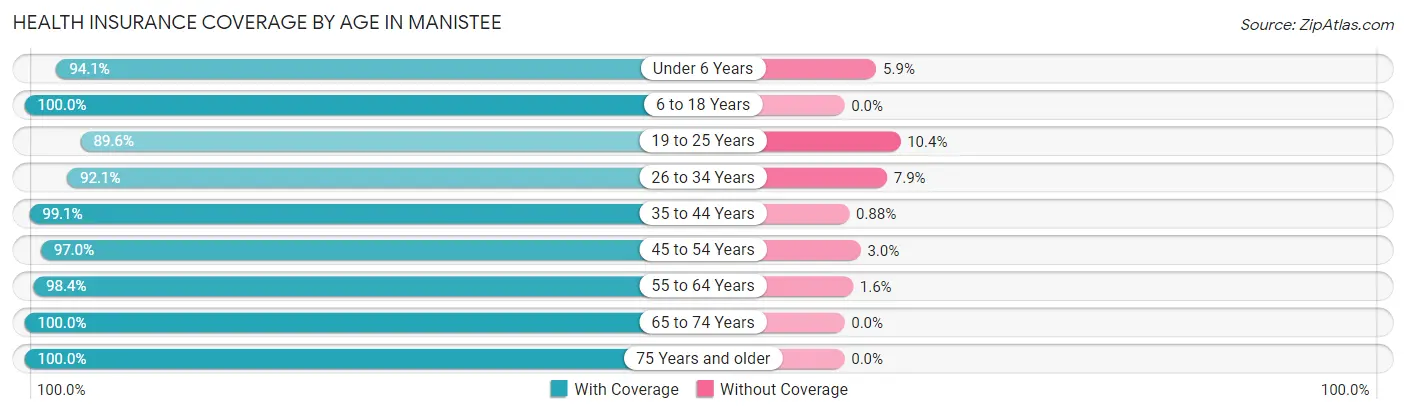
| Age Bracket | With Coverage | Without Coverage |
| Under 6 Years | 364 (94.1%) | 23 (5.9%) |
| 6 to 18 Years | 898 (100.0%) | 0 (0.0%) |
| 19 to 25 Years | 421 (89.6%) | 49 (10.4%) |
| 26 to 34 Years | 499 (92.1%) | 43 (7.9%) |
| 35 to 44 Years | 674 (99.1%) | 6 (0.9%) |
| 45 to 54 Years | 545 (97.0%) | 17 (3.0%) |
| 55 to 64 Years | 1,177 (98.4%) | 19 (1.6%) |
| 65 to 74 Years | 927 (100.0%) | 0 (0.0%) |
| 75 Years and older | 517 (100.0%) | 0 (0.0%) |
| Total | 6,022 (97.5%) | 157 (2.5%) |
Health Insurance Coverage by Citizenship Status in Manistee
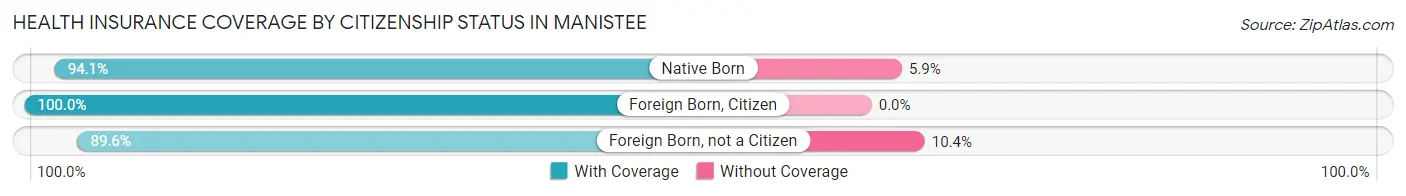
| Citizenship Status | With Coverage | Without Coverage |
| Native Born | 364 (94.1%) | 23 (5.9%) |
| Foreign Born, Citizen | 898 (100.0%) | 0 (0.0%) |
| Foreign Born, not a Citizen | 421 (89.6%) | 49 (10.4%) |
Health Insurance Coverage by Household Income in Manistee
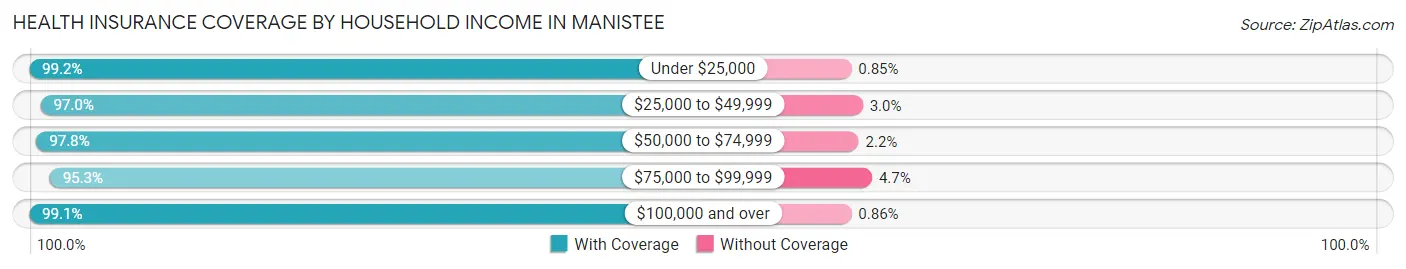
| Household Income | With Coverage | Without Coverage |
| Under $25,000 | 584 (99.2%) | 5 (0.9%) |
| $25,000 to $49,999 | 1,041 (97.0%) | 32 (3.0%) |
| $50,000 to $74,999 | 1,460 (97.8%) | 33 (2.2%) |
| $75,000 to $99,999 | 1,518 (95.3%) | 75 (4.7%) |
| $100,000 and over | 1,389 (99.1%) | 12 (0.9%) |
Public vs Private Health Insurance Coverage by Age in Manistee
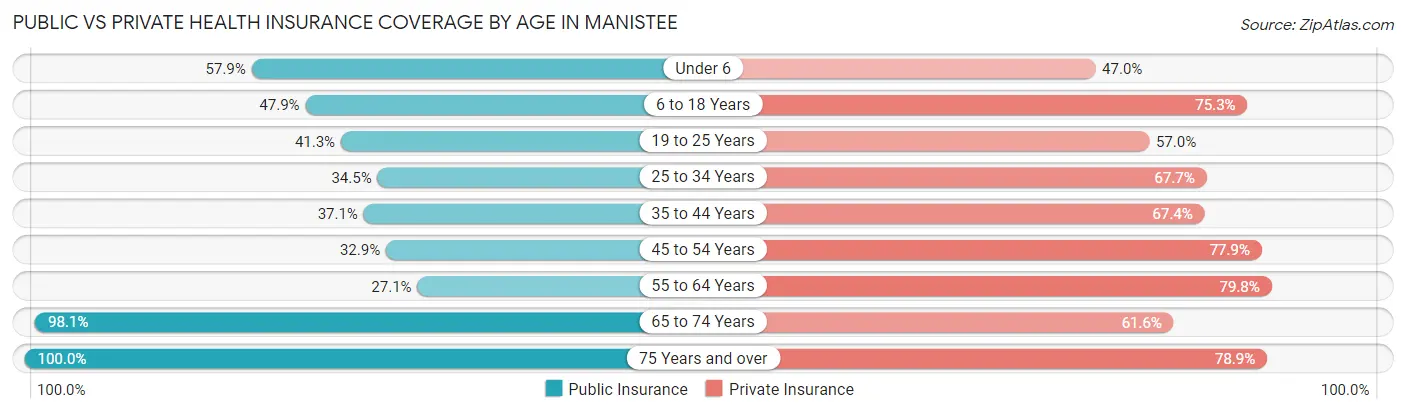
| Age Bracket | Public Insurance | Private Insurance |
| Under 6 | 224 (57.9%) | 182 (47.0%) |
| 6 to 18 Years | 430 (47.9%) | 676 (75.3%) |
| 19 to 25 Years | 194 (41.3%) | 268 (57.0%) |
| 25 to 34 Years | 187 (34.5%) | 367 (67.7%) |
| 35 to 44 Years | 252 (37.1%) | 458 (67.3%) |
| 45 to 54 Years | 185 (32.9%) | 438 (77.9%) |
| 55 to 64 Years | 324 (27.1%) | 954 (79.8%) |
| 65 to 74 Years | 909 (98.1%) | 571 (61.6%) |
| 75 Years and over | 517 (100.0%) | 408 (78.9%) |
| Total | 3,222 (52.1%) | 4,322 (70.0%) |
Disability Status by Sex by Age in Manistee
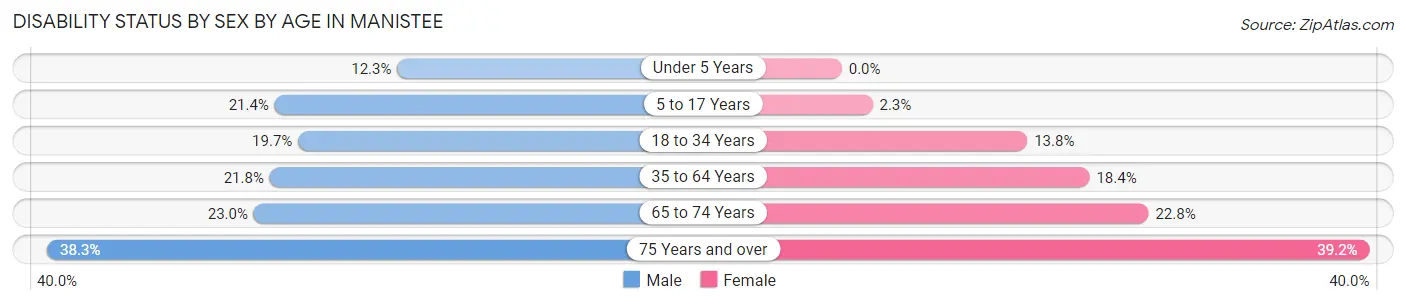
| Age Bracket | Male | Female |
| Under 5 Years | 18 (12.3%) | 0 (0.0%) |
| 5 to 17 Years | 78 (21.4%) | 14 (2.3%) |
| 18 to 34 Years | 102 (19.7%) | 73 (13.8%) |
| 35 to 64 Years | 247 (21.8%) | 240 (18.4%) |
| 65 to 74 Years | 105 (23.0%) | 107 (22.8%) |
| 75 Years and over | 69 (38.3%) | 132 (39.2%) |
Disability Class by Sex by Age in Manistee
Disability Class: Hearing Difficulty
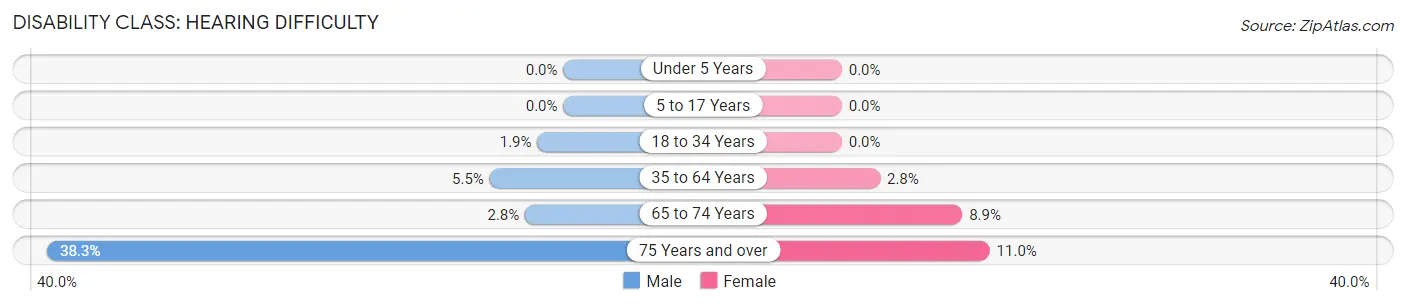
| Age Bracket | Male | Female |
| Under 5 Years | 0 (0.0%) | 0 (0.0%) |
| 5 to 17 Years | 0 (0.0%) | 0 (0.0%) |
| 18 to 34 Years | 10 (1.9%) | 0 (0.0%) |
| 35 to 64 Years | 62 (5.5%) | 37 (2.8%) |
| 65 to 74 Years | 13 (2.8%) | 42 (8.9%) |
| 75 Years and over | 69 (38.3%) | 37 (11.0%) |
Disability Class: Vision Difficulty
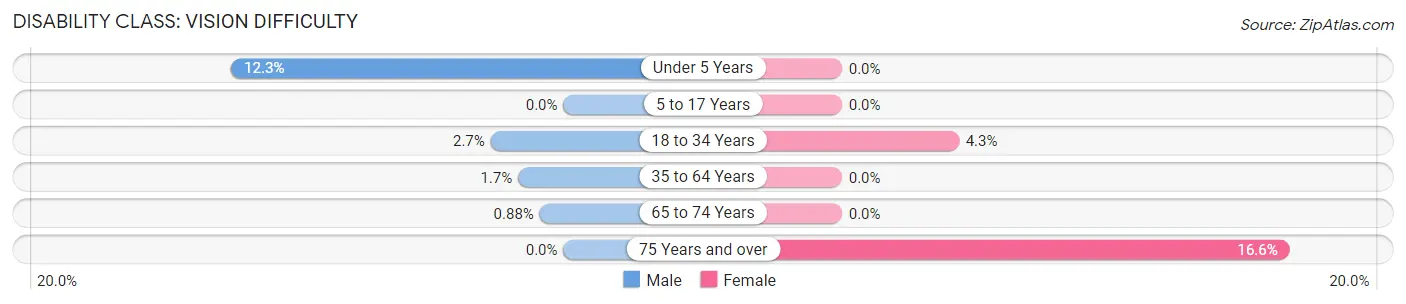
| Age Bracket | Male | Female |
| Under 5 Years | 18 (12.3%) | 0 (0.0%) |
| 5 to 17 Years | 0 (0.0%) | 0 (0.0%) |
| 18 to 34 Years | 14 (2.7%) | 23 (4.3%) |
| 35 to 64 Years | 19 (1.7%) | 0 (0.0%) |
| 65 to 74 Years | 4 (0.9%) | 0 (0.0%) |
| 75 Years and over | 0 (0.0%) | 56 (16.6%) |
Disability Class: Cognitive Difficulty
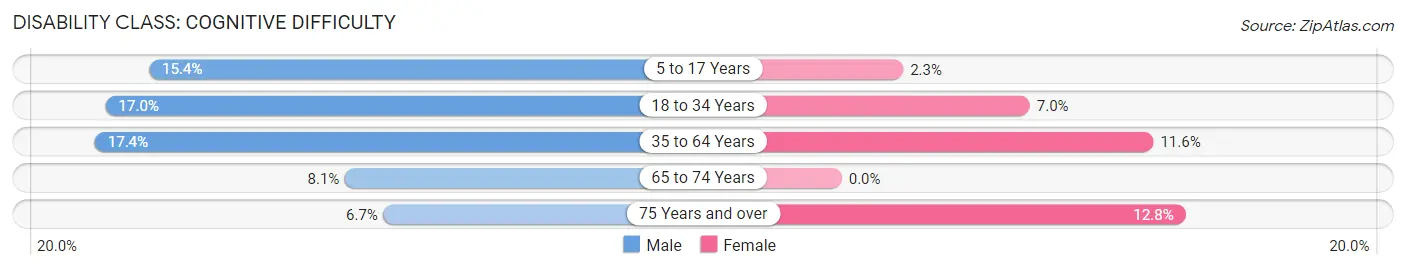
| Age Bracket | Male | Female |
| 5 to 17 Years | 56 (15.4%) | 14 (2.3%) |
| 18 to 34 Years | 88 (17.0%) | 37 (7.0%) |
| 35 to 64 Years | 197 (17.4%) | 151 (11.6%) |
| 65 to 74 Years | 37 (8.1%) | 0 (0.0%) |
| 75 Years and over | 12 (6.7%) | 43 (12.8%) |
Disability Class: Ambulatory Difficulty
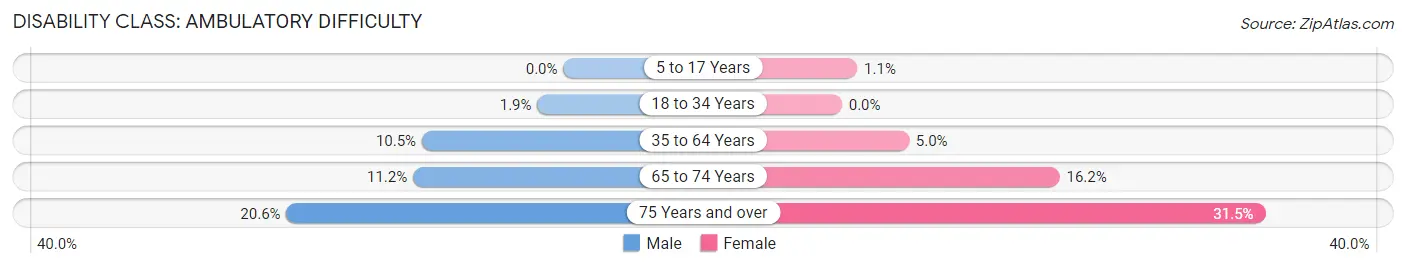
| Age Bracket | Male | Female |
| 5 to 17 Years | 0 (0.0%) | 7 (1.1%) |
| 18 to 34 Years | 10 (1.9%) | 0 (0.0%) |
| 35 to 64 Years | 119 (10.5%) | 65 (5.0%) |
| 65 to 74 Years | 51 (11.2%) | 76 (16.2%) |
| 75 Years and over | 37 (20.6%) | 106 (31.5%) |
Disability Class: Self-Care Difficulty
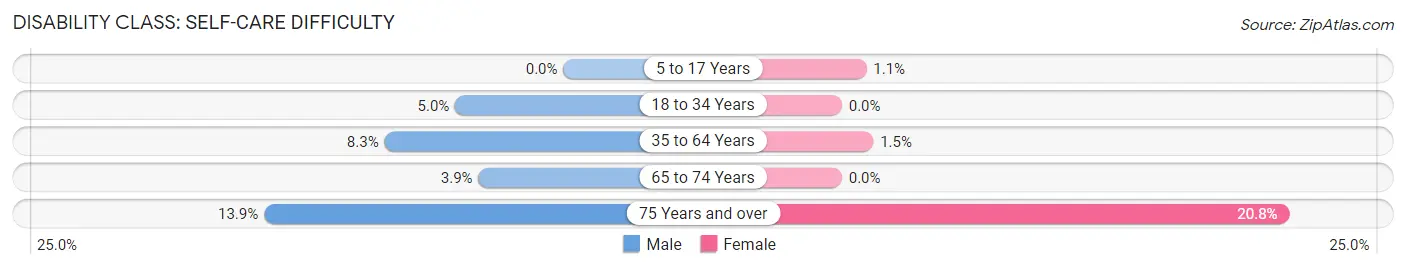
| Age Bracket | Male | Female |
| 5 to 17 Years | 0 (0.0%) | 7 (1.1%) |
| 18 to 34 Years | 26 (5.0%) | 0 (0.0%) |
| 35 to 64 Years | 94 (8.3%) | 19 (1.5%) |
| 65 to 74 Years | 18 (3.9%) | 0 (0.0%) |
| 75 Years and over | 25 (13.9%) | 70 (20.8%) |
Technology Access in Manistee
Computing Device Access in Manistee
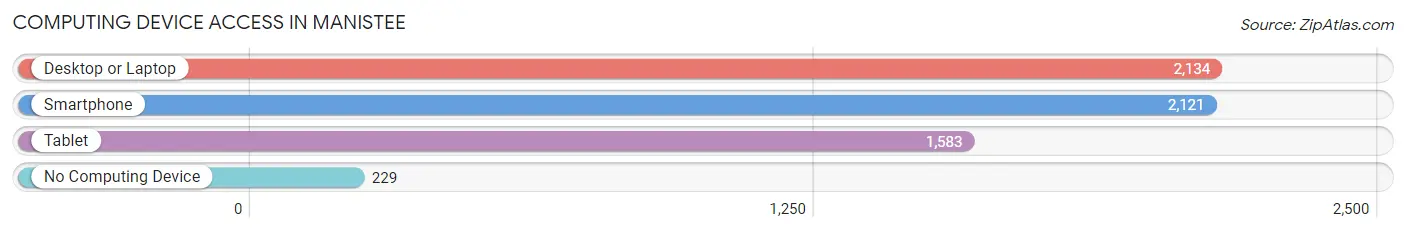
| Device Type | # Households | % Households |
| Desktop or Laptop | 2,134 | 80.1% |
| Smartphone | 2,121 | 79.6% |
| Tablet | 1,583 | 59.4% |
| No Computing Device | 229 | 8.6% |
| Total | 2,663 | 100.0% |
Internet Access in Manistee
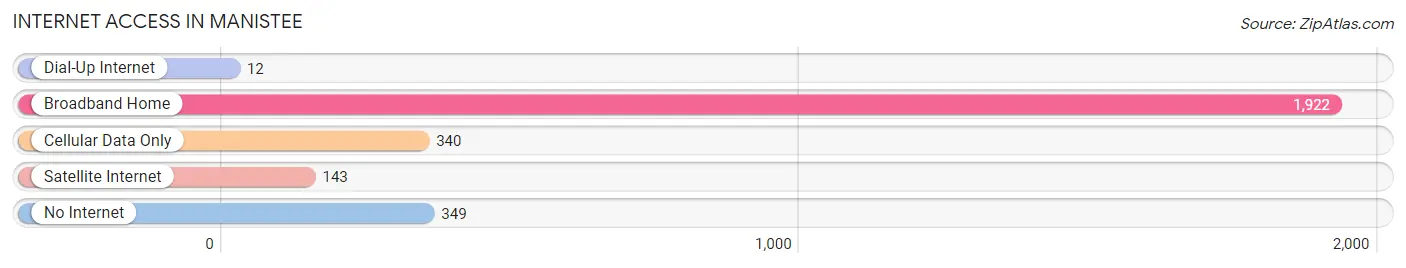
| Internet Type | # Households | % Households |
| Dial-Up Internet | 12 | 0.4% |
| Broadband Home | 1,922 | 72.2% |
| Cellular Data Only | 340 | 12.8% |
| Satellite Internet | 143 | 5.4% |
| No Internet | 349 | 13.1% |
| Total | 2,663 | 100.0% |
Manistee Summary
Manistee, Michigan is a small city located in the northwest corner of the state, on the shores of Lake Michigan. It is the county seat of Manistee County and has a population of 6,586 as of the 2010 census. The city is known for its historic downtown, its beautiful beaches, and its abundance of outdoor activities.
History
The area that is now Manistee was originally inhabited by the Anishinaabe people, who were part of the Ojibwe Nation. The first European settlers arrived in the area in the early 1800s, and the city was officially founded in 1841. The city was named after the Manistee River, which was named by the Ojibwe people for the “river of the Manitou”, or “spirit of the woods”.
The city quickly grew in the late 1800s, thanks to the lumber industry. The city was home to several sawmills and lumber companies, and the city’s population grew to over 10,000 by the early 1900s. The city was also home to several shipbuilding companies, and the city’s port was a major hub for shipping lumber and other goods.
The city’s economy shifted in the mid-1900s, as the lumber industry declined and the city’s population began to decline. The city’s economy shifted to tourism, and the city began to focus on its beautiful beaches and outdoor activities. The city also began to focus on its historic downtown, which is now home to several shops, restaurants, and other businesses.
Geography
Manistee is located in the northwest corner of Michigan, on the shores of Lake Michigan. The city is located at the mouth of the Manistee River, and is surrounded by Manistee National Forest. The city is located about 50 miles north of Grand Rapids, and about 100 miles northwest of Detroit.
The city has a total area of 4.2 square miles, of which 3.9 square miles is land and 0.3 square miles is water. The city is located at the intersection of US-31 and M-55, and is about a two-hour drive from Chicago.
Economy
The economy of Manistee is largely based on tourism and recreation. The city is home to several beaches, parks, and outdoor activities, and is a popular destination for tourists. The city is also home to several shops, restaurants, and other businesses in its historic downtown.
The city is also home to several manufacturing companies, including a paper mill and a boat manufacturing company. The city is also home to several healthcare facilities, including a hospital and several clinics.
Demographics
As of the 2010 census, the population of Manistee was 6,586. The city has a population density of 1,567 people per square mile. The median age of the city’s population is 43.7 years, and the median household income is $37,945.
The city is predominantly white, with a population that is 94.2% white, 2.2% Hispanic or Latino, 1.2% African American, and 0.9% Native American. The city is also home to a small population of Asian Americans, at 0.5%. The city’s population is also predominantly Christian, with a population that is 79.2% Christian, 16.2% non-religious, and 4.6% other religions.
Common Questions
What is Per Capita Income in Manistee?
Per Capita income in Manistee is $31,632.
What is the Median Family Income in Manistee?
Median Family Income in Manistee is $75,921.
What is the Median Household income in Manistee?
Median Household Income in Manistee is $57,813.
What is Income or Wage Gap in Manistee?
Income or Wage Gap in Manistee is 1.6%.
Women in Manistee earn 98.4 cents for every dollar earned by a man.
What is Inequality or Gini Index in Manistee?
Inequality or Gini Index in Manistee is 0.41.
What is the Total Population of Manistee?
Total Population of Manistee is 6,248.
What is the Total Male Population of Manistee?
Total Male Population of Manistee is 2,853.
What is the Total Female Population of Manistee?
Total Female Population of Manistee is 3,395.
What is the Ratio of Males per 100 Females in Manistee?
There are 84.04 Males per 100 Females in Manistee.
What is the Ratio of Females per 100 Males in Manistee?
There are 119.00 Females per 100 Males in Manistee.
What is the Median Population Age in Manistee?
Median Population Age in Manistee is 46.9 Years.
What is the Average Family Size in Manistee
Average Family Size in Manistee is 3.0 People.
What is the Average Household Size in Manistee
Average Household Size in Manistee is 2.3 People.
How Large is the Labor Force in Manistee?
There are 2,770 People in the Labor Forcein in Manistee.
What is the Percentage of People in the Labor Force in Manistee?
53.6% of People are in the Labor Force in Manistee.
What is the Unemployment Rate in Manistee?
Unemployment Rate in Manistee is 7.3%.