Benton Harbor, MI Map & Demographics
Benton Harbor Map
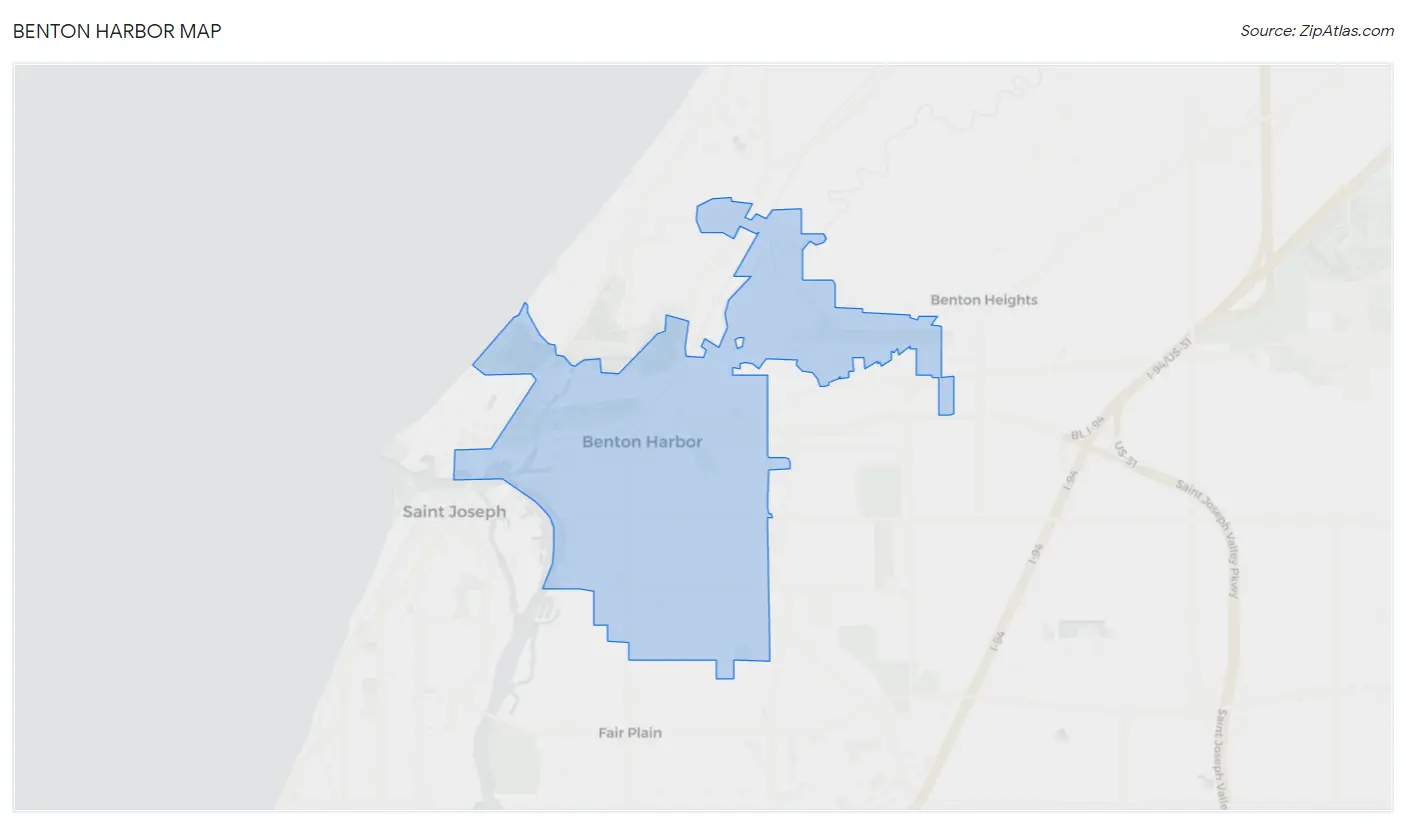
Benton Harbor Overview
$18,393
PER CAPITA INCOME
$27,000
AVG FAMILY INCOME
$26,592
AVG HOUSEHOLD INCOME
37.9%
WAGE / INCOME GAP [ % ]
62.1¢/ $1
WAGE / INCOME GAP [ $ ]
0.53
INEQUALITY / GINI INDEX
9,101
TOTAL POPULATION
4,224
MALE POPULATION
4,877
FEMALE POPULATION
86.61
MALES / 100 FEMALES
115.46
FEMALES / 100 MALES
33.6
MEDIAN AGE
2.8
AVG FAMILY SIZE
2.3
AVG HOUSEHOLD SIZE
4,345
LABOR FORCE [ PEOPLE ]
63.3%
PERCENT IN LABOR FORCE
20.2%
UNEMPLOYMENT RATE
Benton Harbor Zip Codes
Benton Harbor Area Codes
Income in Benton Harbor
Income Overview in Benton Harbor
Per Capita Income in Benton Harbor is $18,393, while median incomes of families and households are $27,000 and $26,592 respectively.
| Characteristic | Number | Measure |
| Per Capita Income | 9,101 | $18,393 |
| Median Family Income | 2,532 | $27,000 |
| Mean Family Income | 2,532 | $40,544 |
| Median Household Income | 3,867 | $26,592 |
| Mean Household Income | 3,867 | $41,132 |
| Income Deficit | 2,532 | $0 |
| Wage / Income Gap (%) | 9,101 | 37.88% |
| Wage / Income Gap ($) | 9,101 | 62.12¢ per $1 |
| Gini / Inequality Index | 9,101 | 0.53 |
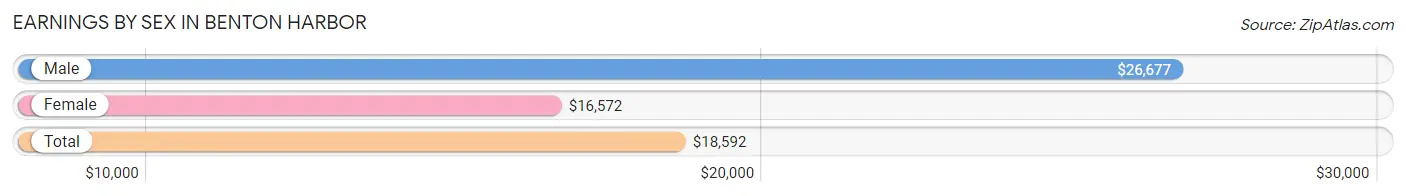
Earnings by Sex in Benton Harbor
Average Earnings in Benton Harbor are $18,592, $26,677 for men and $16,572 for women, a difference of 37.9%.
| Sex | Number | Average Earnings |
| Male | 1,878 (42.8%) | $26,677 |
| Female | 2,506 (57.2%) | $16,572 |
| Total | 4,384 (100.0%) | $18,592 |
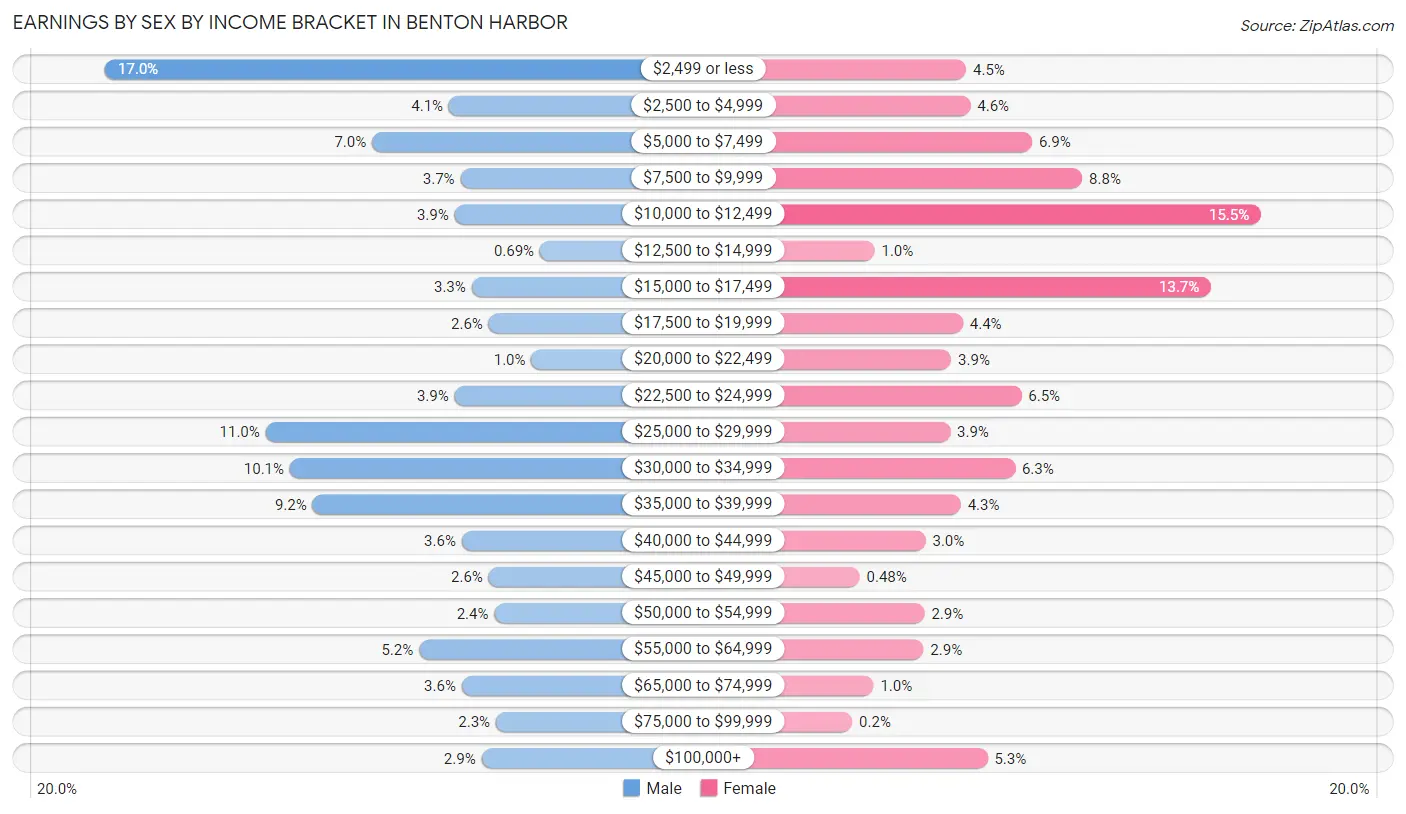
Earnings by Sex by Income Bracket in Benton Harbor
The most common earnings brackets in Benton Harbor are $2,499 or less for men (319 | 17.0%) and $10,000 to $12,499 for women (389 | 15.5%).
| Income | Male | Female |
| $2,499 or less | 319 (17.0%) | 112 (4.5%) |
| $2,500 to $4,999 | 77 (4.1%) | 116 (4.6%) |
| $5,000 to $7,499 | 131 (7.0%) | 174 (6.9%) |
| $7,500 to $9,999 | 69 (3.7%) | 221 (8.8%) |
| $10,000 to $12,499 | 73 (3.9%) | 389 (15.5%) |
| $12,500 to $14,999 | 13 (0.7%) | 26 (1.0%) |
| $15,000 to $17,499 | 61 (3.3%) | 342 (13.7%) |
| $17,500 to $19,999 | 49 (2.6%) | 109 (4.3%) |
| $20,000 to $22,499 | 19 (1.0%) | 98 (3.9%) |
| $22,500 to $24,999 | 73 (3.9%) | 164 (6.5%) |
| $25,000 to $29,999 | 206 (11.0%) | 97 (3.9%) |
| $30,000 to $34,999 | 189 (10.1%) | 158 (6.3%) |
| $35,000 to $39,999 | 173 (9.2%) | 107 (4.3%) |
| $40,000 to $44,999 | 68 (3.6%) | 74 (2.9%) |
| $45,000 to $49,999 | 49 (2.6%) | 12 (0.5%) |
| $50,000 to $54,999 | 45 (2.4%) | 73 (2.9%) |
| $55,000 to $64,999 | 98 (5.2%) | 72 (2.9%) |
| $65,000 to $74,999 | 68 (3.6%) | 25 (1.0%) |
| $75,000 to $99,999 | 44 (2.3%) | 5 (0.2%) |
| $100,000+ | 54 (2.9%) | 132 (5.3%) |
| Total | 1,878 (100.0%) | 2,506 (100.0%) |
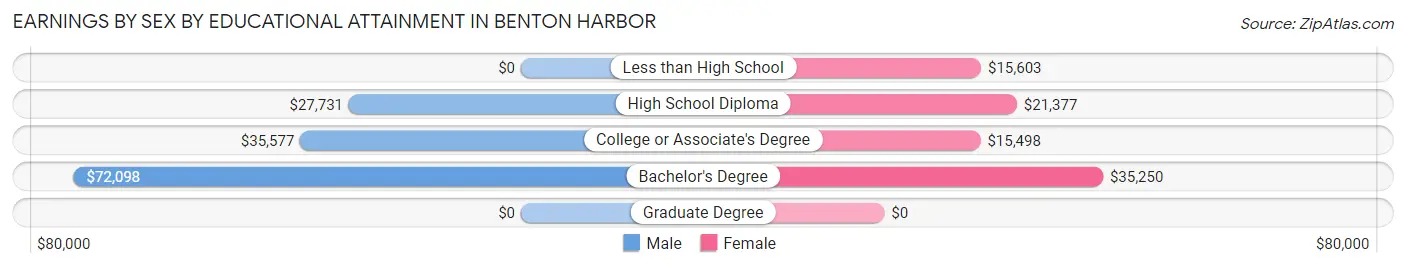
Earnings by Sex by Educational Attainment in Benton Harbor
Average earnings in Benton Harbor are $29,738 for men and $16,795 for women, a difference of 43.5%. Men with an educational attainment of bachelor's degree enjoy the highest average annual earnings of $72,098, while those with high school diploma education earn the least with $27,731. Women with an educational attainment of bachelor's degree earn the most with the average annual earnings of $35,250, while those with college or associate's degree education have the smallest earnings of $15,498.
| Educational Attainment | Male Income | Female Income |
| Less than High School | - | - |
| High School Diploma | $27,731 | $21,377 |
| College or Associate's Degree | $35,577 | $15,498 |
| Bachelor's Degree | $72,098 | $35,250 |
| Graduate Degree | - | - |
| Total | $29,738 | $16,795 |
Family Income in Benton Harbor
Family Income Brackets in Benton Harbor
According to the Benton Harbor family income data, there are 448 families falling into the $10,000 to $14,999 income range, which is the most common income bracket and makes up 17.7% of all families. Conversely, the $150,000 to $199,999 income bracket is the least frequent group with only 20 families (0.8%) belonging to this category.
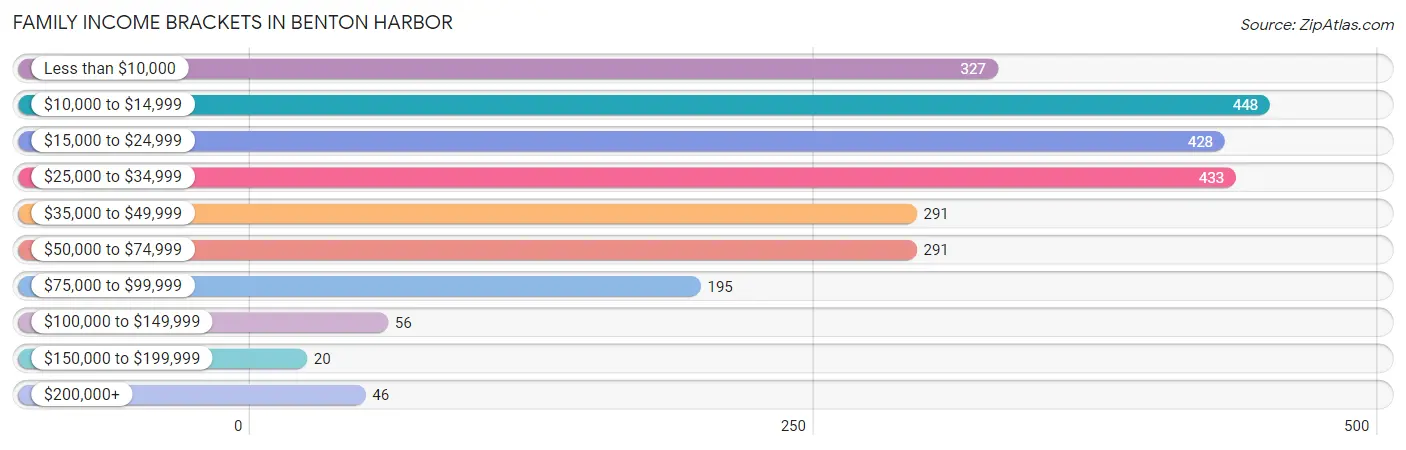
| Income Bracket | # Families | % Families |
| Less than $10,000 | 327 | 12.9% |
| $10,000 to $14,999 | 448 | 17.7% |
| $15,000 to $24,999 | 428 | 16.9% |
| $25,000 to $34,999 | 433 | 17.1% |
| $35,000 to $49,999 | 291 | 11.5% |
| $50,000 to $74,999 | 291 | 11.5% |
| $75,000 to $99,999 | 195 | 7.7% |
| $100,000 to $149,999 | 56 | 2.2% |
| $150,000 to $199,999 | 20 | 0.8% |
| $200,000+ | 46 | 1.8% |
Family Income by Famaliy Size in Benton Harbor
6-person families (35 | 1.4%) account for the highest median family income in Benton Harbor with $54,063 per family, while 2-person families (867 | 34.2%) have the highest median income of $13,464 per family member.

| Income Bracket | # Families | Median Income |
| 2-Person Families | 867 (34.2%) | $26,929 |
| 3-Person Families | 1,136 (44.9%) | $21,449 |
| 4-Person Families | 421 (16.6%) | $33,447 |
| 5-Person Families | 38 (1.5%) | $24,762 |
| 6-Person Families | 35 (1.4%) | $54,063 |
| 7+ Person Families | 35 (1.4%) | $0 |
| Total | 2,532 (100.0%) | $27,000 |
Family Income by Number of Earners in Benton Harbor
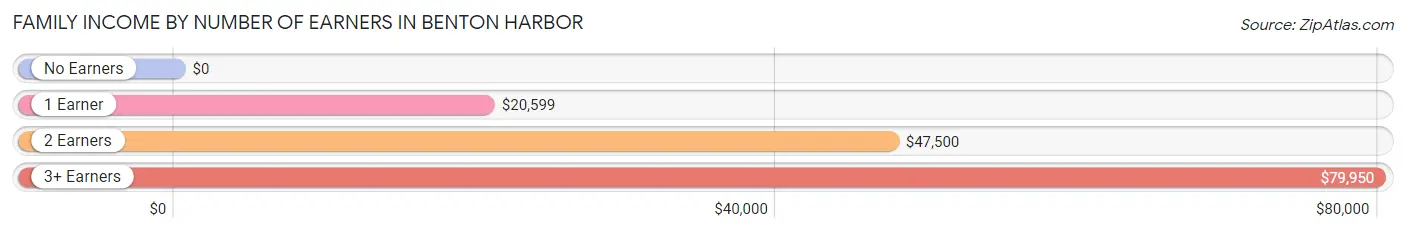
| Number of Earners | # Families | Median Income |
| No Earners | 300 (11.8%) | $0 |
| 1 Earner | 1,469 (58.0%) | $20,599 |
| 2 Earners | 676 (26.7%) | $47,500 |
| 3+ Earners | 87 (3.4%) | $79,950 |
| Total | 2,532 (100.0%) | $27,000 |
Household Income in Benton Harbor
Household Income Brackets in Benton Harbor
With 742 households falling in the category, the $10,000 to $14,999 income range is the most frequent in Benton Harbor, accounting for 19.2% of all households. In contrast, only 50 households (1.3%) fall into the $150,000 to $199,999 income bracket, making it the least populous group.
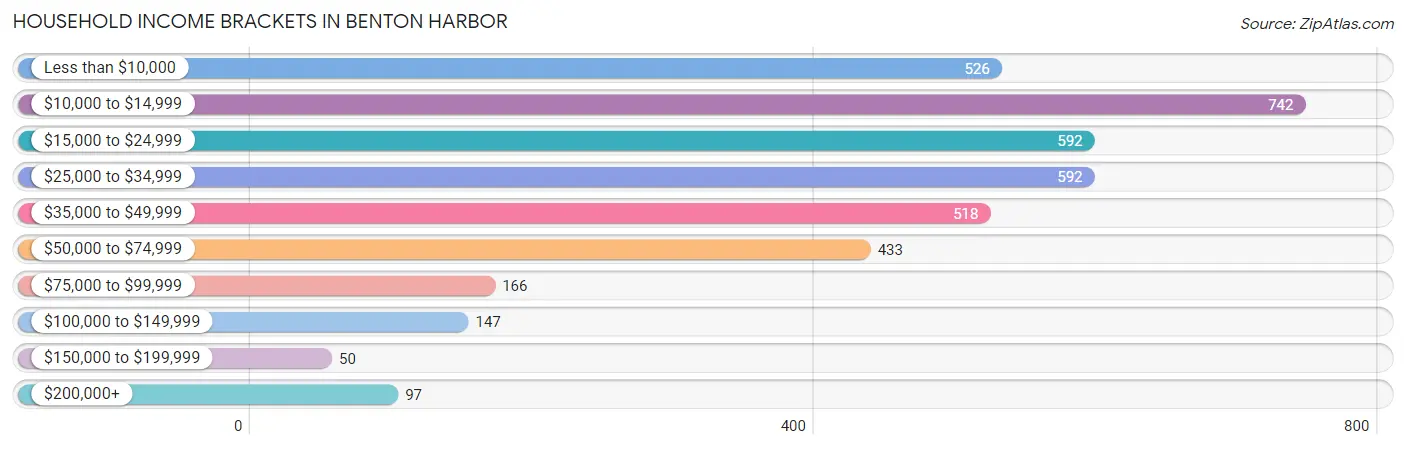
| Income Bracket | # Households | % Households |
| Less than $10,000 | 526 | 13.6% |
| $10,000 to $14,999 | 742 | 19.2% |
| $15,000 to $24,999 | 592 | 15.3% |
| $25,000 to $34,999 | 592 | 15.3% |
| $35,000 to $49,999 | 518 | 13.4% |
| $50,000 to $74,999 | 433 | 11.2% |
| $75,000 to $99,999 | 166 | 4.3% |
| $100,000 to $149,999 | 147 | 3.8% |
| $150,000 to $199,999 | 50 | 1.3% |
| $200,000+ | 97 | 2.5% |
Household Income by Householder Age in Benton Harbor
The median household income in Benton Harbor is $26,592, with the highest median household income of $33,316 found in the 45 to 64 years age bracket for the primary householder. A total of 1,514 households (39.2%) fall into this category. Meanwhile, the 15 to 24 years age bracket for the primary householder has the lowest median household income of $21,932, with 233 households (6.0%) in this group.
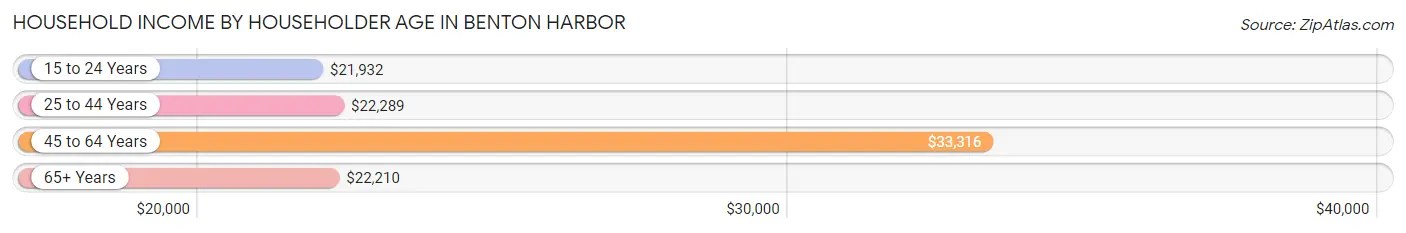
| Income Bracket | # Households | Median Income |
| 15 to 24 Years | 233 (6.0%) | $21,932 |
| 25 to 44 Years | 1,475 (38.1%) | $22,289 |
| 45 to 64 Years | 1,514 (39.2%) | $33,316 |
| 65+ Years | 645 (16.7%) | $22,210 |
| Total | 3,867 (100.0%) | $26,592 |
Poverty in Benton Harbor
Income Below Poverty by Sex and Age in Benton Harbor
With 35.8% poverty level for males and 51.3% for females among the residents of Benton Harbor, under 5 year old males and 6 to 11 year old females are the most vulnerable to poverty, with 214 males (66.0%) and 342 females (81.6%) in their respective age groups living below the poverty level.
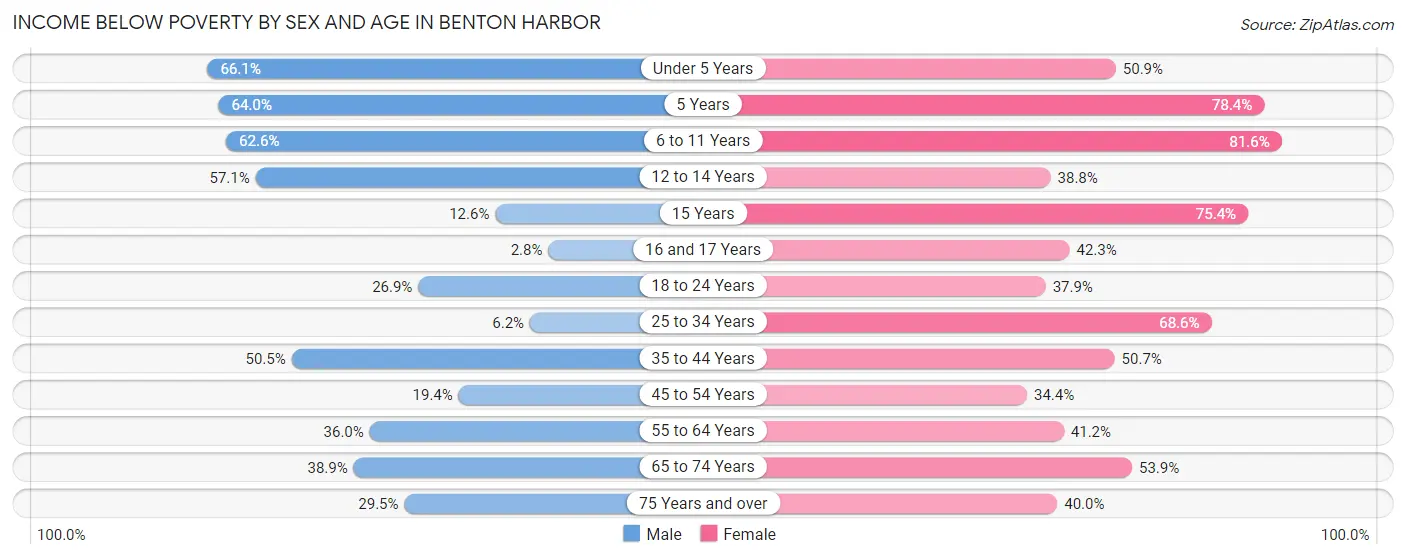
| Age Bracket | Male | Female |
| Under 5 Years | 214 (66.0%) | 146 (50.9%) |
| 5 Years | 32 (64.0%) | 29 (78.4%) |
| 6 to 11 Years | 286 (62.6%) | 342 (81.6%) |
| 12 to 14 Years | 132 (57.1%) | 69 (38.8%) |
| 15 Years | 11 (12.6%) | 101 (75.4%) |
| 16 and 17 Years | 6 (2.8%) | 52 (42.3%) |
| 18 to 24 Years | 111 (26.9%) | 176 (37.9%) |
| 25 to 34 Years | 31 (6.2%) | 476 (68.6%) |
| 35 to 44 Years | 279 (50.4%) | 387 (50.6%) |
| 45 to 54 Years | 104 (19.4%) | 242 (34.4%) |
| 55 to 64 Years | 160 (36.0%) | 230 (41.2%) |
| 65 to 74 Years | 81 (38.9%) | 174 (53.9%) |
| 75 Years and over | 36 (29.5%) | 72 (40.0%) |
| Total | 1,483 (35.8%) | 2,496 (51.3%) |
Income Above Poverty by Sex and Age in Benton Harbor
According to the poverty statistics in Benton Harbor, males aged 16 and 17 years and females aged 45 to 54 years are the age groups that are most secure financially, with 97.2% of males and 65.6% of females in these age groups living above the poverty line.
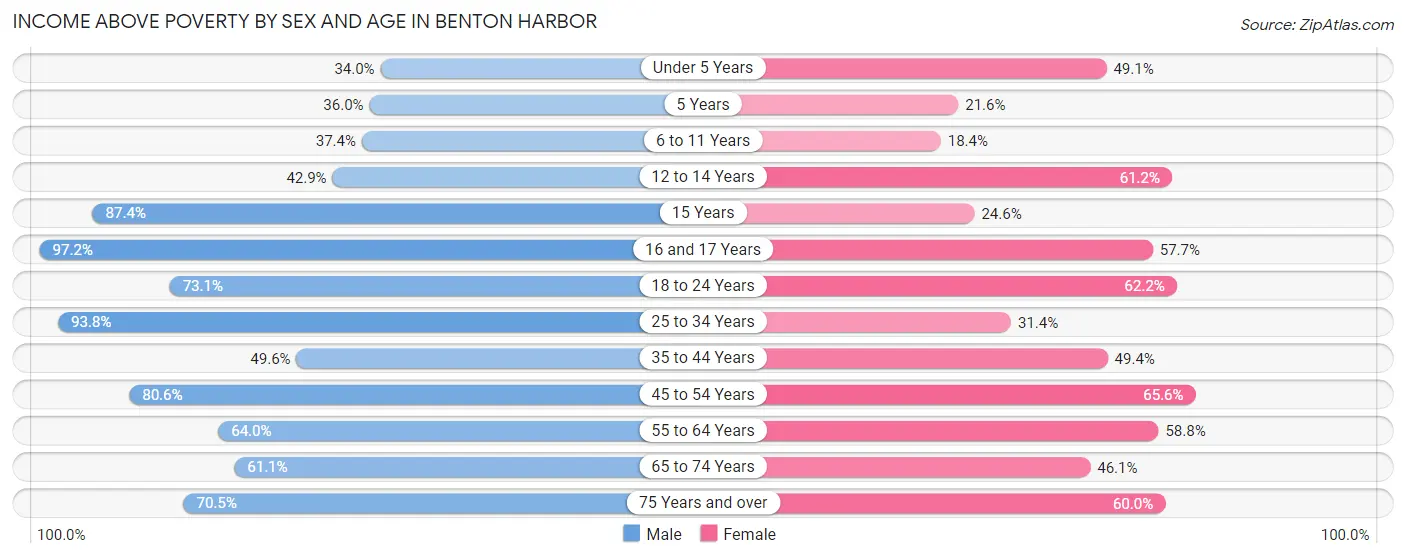
| Age Bracket | Male | Female |
| Under 5 Years | 110 (34.0%) | 141 (49.1%) |
| 5 Years | 18 (36.0%) | 8 (21.6%) |
| 6 to 11 Years | 171 (37.4%) | 77 (18.4%) |
| 12 to 14 Years | 99 (42.9%) | 109 (61.2%) |
| 15 Years | 76 (87.4%) | 33 (24.6%) |
| 16 and 17 Years | 208 (97.2%) | 71 (57.7%) |
| 18 to 24 Years | 301 (73.1%) | 289 (62.2%) |
| 25 to 34 Years | 468 (93.8%) | 218 (31.4%) |
| 35 to 44 Years | 274 (49.5%) | 377 (49.3%) |
| 45 to 54 Years | 431 (80.6%) | 462 (65.6%) |
| 55 to 64 Years | 285 (64.0%) | 328 (58.8%) |
| 65 to 74 Years | 127 (61.1%) | 149 (46.1%) |
| 75 Years and over | 86 (70.5%) | 108 (60.0%) |
| Total | 2,654 (64.1%) | 2,370 (48.7%) |
Income Below Poverty Among Married-Couple Families in Benton Harbor
The poverty statistics for married-couple families in Benton Harbor show that 12.6% or 66 of the total 526 families live below the poverty line. Families with 3 or 4 children have the highest poverty rate of 63.6%, comprising of 21 families. On the other hand, families with 1 or 2 children have the lowest poverty rate of 4.9%, which includes 6 families.
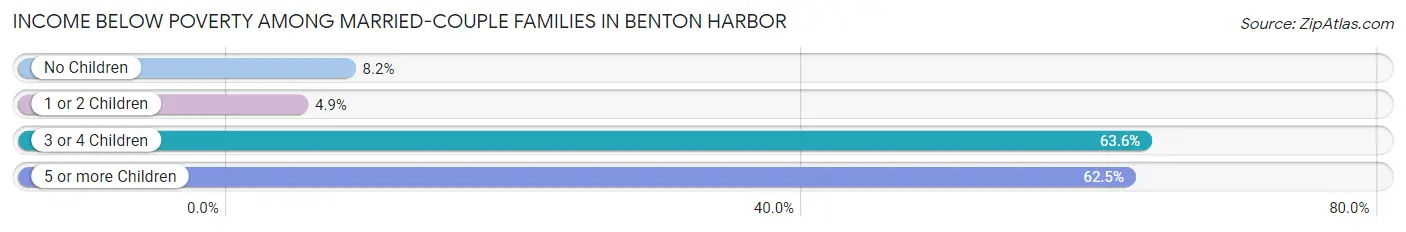
| Children | Above Poverty | Below Poverty |
| No Children | 325 (91.8%) | 29 (8.2%) |
| 1 or 2 Children | 117 (95.1%) | 6 (4.9%) |
| 3 or 4 Children | 12 (36.4%) | 21 (63.6%) |
| 5 or more Children | 6 (37.5%) | 10 (62.5%) |
| Total | 460 (87.5%) | 66 (12.6%) |
Income Below Poverty Among Single-Parent Households in Benton Harbor
According to the poverty data in Benton Harbor, 20.1% or 39 single-father households and 60.0% or 1,088 single-mother households are living below the poverty line. Among single-father households, those with 3 or 4 children have the highest poverty rate, with 30 households (100.0%) experiencing poverty. Likewise, among single-mother households, those with 1 or 2 children have the highest poverty rate, with 925 households (69.4%) falling below the poverty line.
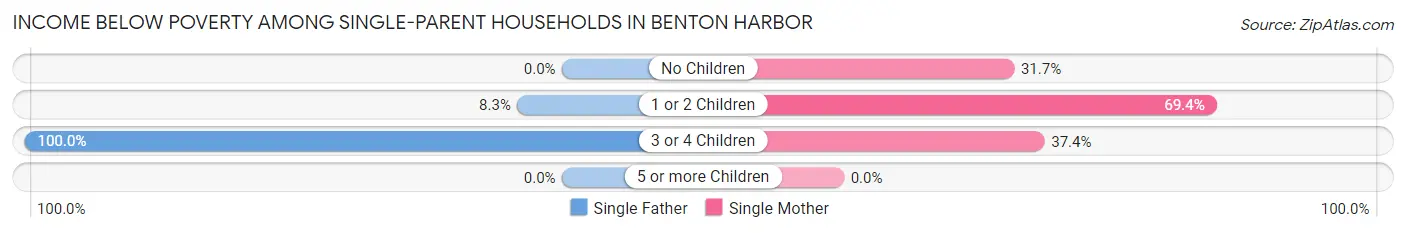
| Children | Single Father | Single Mother |
| No Children | 0 (0.0%) | 92 (31.7%) |
| 1 or 2 Children | 9 (8.3%) | 925 (69.4%) |
| 3 or 4 Children | 30 (100.0%) | 71 (37.4%) |
| 5 or more Children | 0 (0.0%) | 0 (0.0%) |
| Total | 39 (20.1%) | 1,088 (60.0%) |
Income Below Poverty Among Married-Couple vs Single-Parent Households in Benton Harbor
The poverty data for Benton Harbor shows that 66 of the married-couple family households (12.6%) and 1,127 of the single-parent households (56.2%) are living below the poverty level. Within the married-couple family households, those with 3 or 4 children have the highest poverty rate, with 21 households (63.6%) falling below the poverty line. Among the single-parent households, those with 1 or 2 children have the highest poverty rate, with 934 household (64.9%) living below poverty.
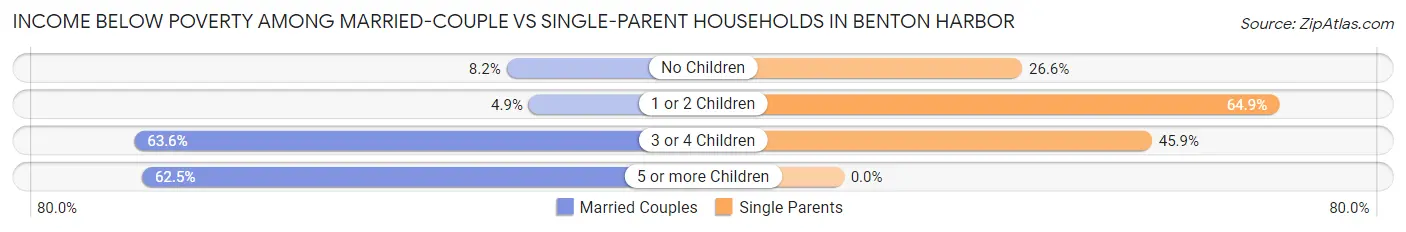
| Children | Married-Couple Families | Single-Parent Households |
| No Children | 29 (8.2%) | 92 (26.6%) |
| 1 or 2 Children | 6 (4.9%) | 934 (64.9%) |
| 3 or 4 Children | 21 (63.6%) | 101 (45.9%) |
| 5 or more Children | 10 (62.5%) | 0 (0.0%) |
| Total | 66 (12.6%) | 1,127 (56.2%) |
Race in Benton Harbor
The most populous races in Benton Harbor are Black / African American (7,953 | 87.4%), White / Caucasian (837 | 9.2%), and Hispanic or Latino (280 | 3.1%).
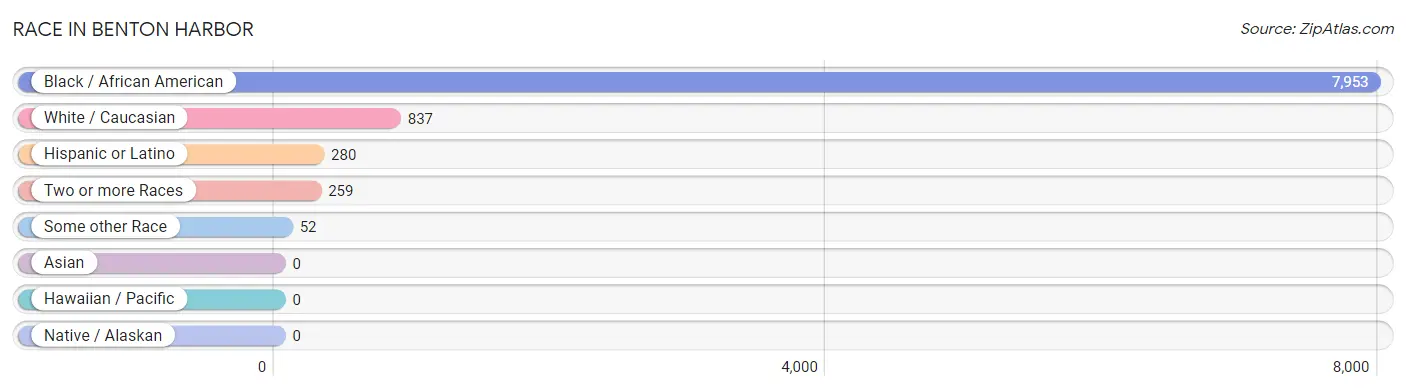
| Race | # Population | % Population |
| Asian | 0 | 0.0% |
| Black / African American | 7,953 | 87.4% |
| Hawaiian / Pacific | 0 | 0.0% |
| Hispanic or Latino | 280 | 3.1% |
| Native / Alaskan | 0 | 0.0% |
| White / Caucasian | 837 | 9.2% |
| Two or more Races | 259 | 2.9% |
| Some other Race | 52 | 0.6% |
| Total | 9,101 | 100.0% |
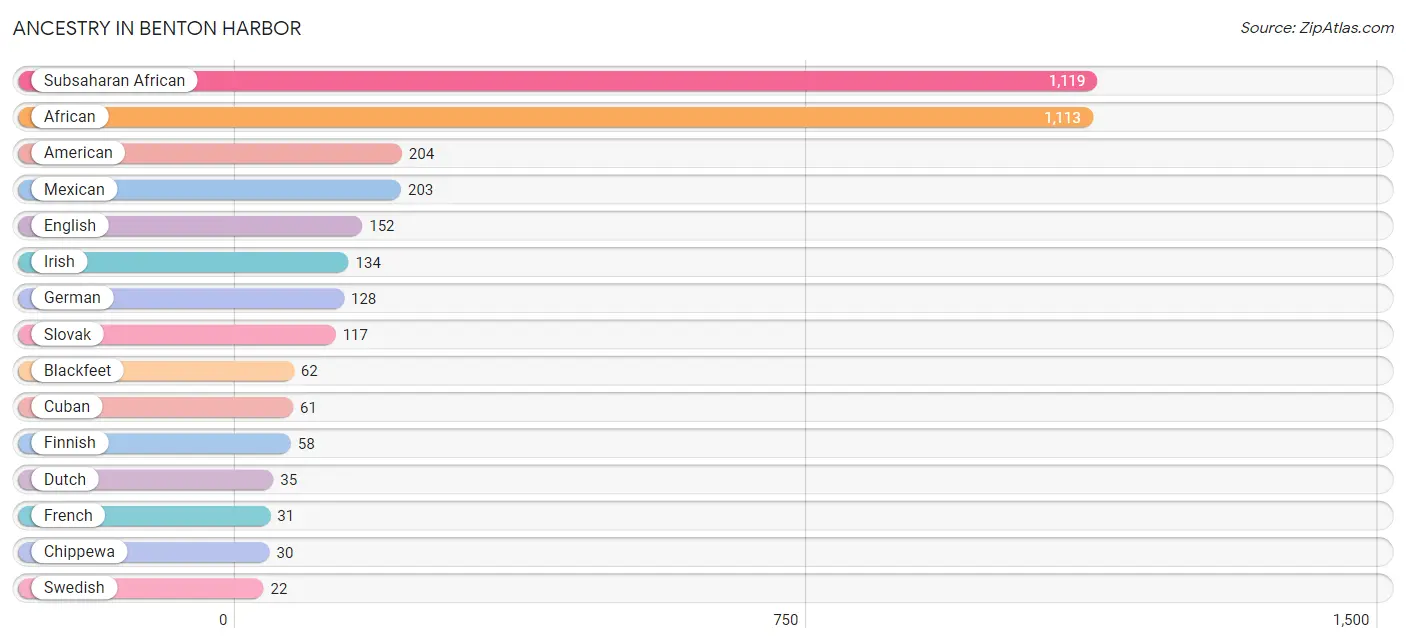
Ancestry in Benton Harbor
The most populous ancestries reported in Benton Harbor are Subsaharan African (1,119 | 12.3%), African (1,113 | 12.2%), American (204 | 2.2%), Mexican (203 | 2.2%), and English (152 | 1.7%), together accounting for 30.7% of all Benton Harbor residents.
| Ancestry | # Population | % Population |
| African | 1,113 | 12.2% |
| American | 204 | 2.2% |
| Blackfeet | 62 | 0.7% |
| Canadian | 1 | 0.0% |
| Cherokee | 5 | 0.1% |
| Chippewa | 30 | 0.3% |
| Cuban | 61 | 0.7% |
| Dutch | 35 | 0.4% |
| English | 152 | 1.7% |
| Finnish | 58 | 0.6% |
| French | 31 | 0.3% |
| French Canadian | 11 | 0.1% |
| German | 128 | 1.4% |
| Irish | 134 | 1.5% |
| Italian | 21 | 0.2% |
| Mexican | 203 | 2.2% |
| Nigerian | 6 | 0.1% |
| Polish | 2 | 0.0% |
| Puerto Rican | 2 | 0.0% |
| Russian | 6 | 0.1% |
| Scotch-Irish | 9 | 0.1% |
| Seminole | 20 | 0.2% |
| Slovak | 117 | 1.3% |
| Spanish | 14 | 0.2% |
| Subsaharan African | 1,119 | 12.3% |
| Swedish | 22 | 0.2% | View All 26 Rows |
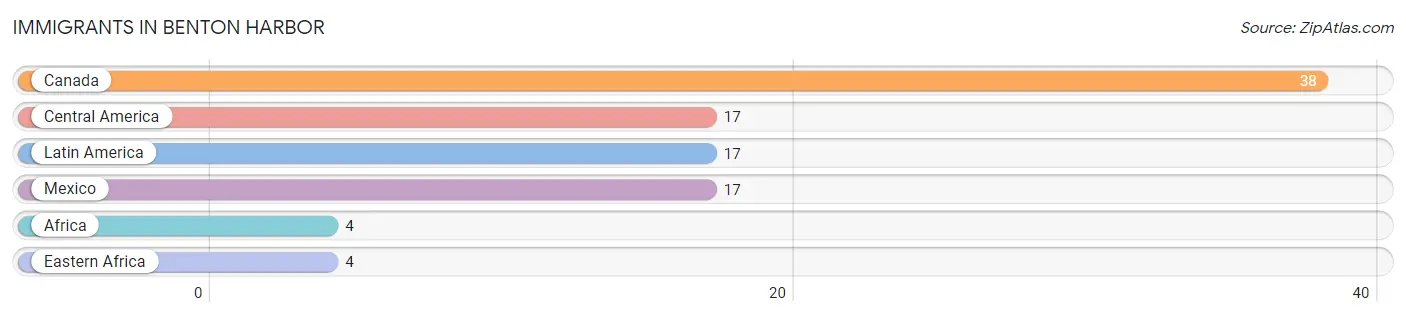
Immigrants in Benton Harbor
The most numerous immigrant groups reported in Benton Harbor came from Canada (38 | 0.4%), Central America (17 | 0.2%), Latin America (17 | 0.2%), Mexico (17 | 0.2%), and Africa (4 | 0.0%), together accounting for 1.0% of all Benton Harbor residents.
| Immigration Origin | # Population | % Population |
| Africa | 4 | 0.0% |
| Canada | 38 | 0.4% |
| Central America | 17 | 0.2% |
| Eastern Africa | 4 | 0.0% |
| Latin America | 17 | 0.2% |
| Mexico | 17 | 0.2% | View All 6 Rows |
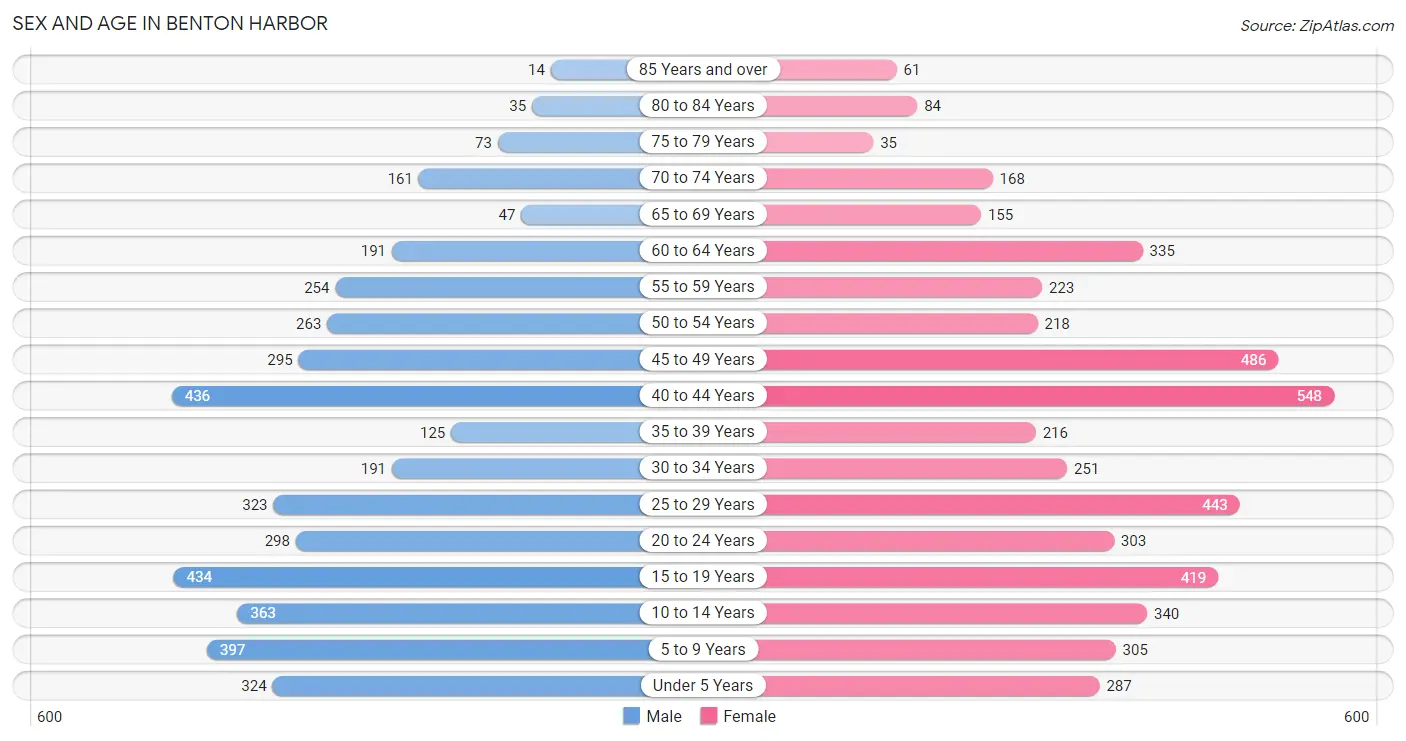
Sex and Age in Benton Harbor
Sex and Age in Benton Harbor
The most populous age groups in Benton Harbor are 40 to 44 Years (436 | 10.3%) for men and 40 to 44 Years (548 | 11.2%) for women.
| Age Bracket | Male | Female |
| Under 5 Years | 324 (7.7%) | 287 (5.9%) |
| 5 to 9 Years | 397 (9.4%) | 305 (6.2%) |
| 10 to 14 Years | 363 (8.6%) | 340 (7.0%) |
| 15 to 19 Years | 434 (10.3%) | 419 (8.6%) |
| 20 to 24 Years | 298 (7.0%) | 303 (6.2%) |
| 25 to 29 Years | 323 (7.6%) | 443 (9.1%) |
| 30 to 34 Years | 191 (4.5%) | 251 (5.1%) |
| 35 to 39 Years | 125 (3.0%) | 216 (4.4%) |
| 40 to 44 Years | 436 (10.3%) | 548 (11.2%) |
| 45 to 49 Years | 295 (7.0%) | 486 (10.0%) |
| 50 to 54 Years | 263 (6.2%) | 218 (4.5%) |
| 55 to 59 Years | 254 (6.0%) | 223 (4.6%) |
| 60 to 64 Years | 191 (4.5%) | 335 (6.9%) |
| 65 to 69 Years | 47 (1.1%) | 155 (3.2%) |
| 70 to 74 Years | 161 (3.8%) | 168 (3.4%) |
| 75 to 79 Years | 73 (1.7%) | 35 (0.7%) |
| 80 to 84 Years | 35 (0.8%) | 84 (1.7%) |
| 85 Years and over | 14 (0.3%) | 61 (1.3%) |
| Total | 4,224 (100.0%) | 4,877 (100.0%) |
Families and Households in Benton Harbor
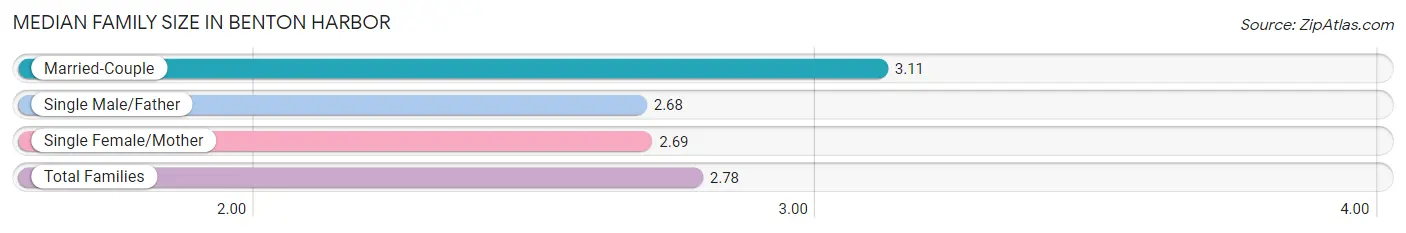
Median Family Size in Benton Harbor
The median family size in Benton Harbor is 2.78 persons per family, with married-couple families (526 | 20.8%) accounting for the largest median family size of 3.11 persons per family. On the other hand, single male/father families (194 | 7.7%) represent the smallest median family size with 2.68 persons per family.
| Family Type | # Families | Family Size |
| Married-Couple | 526 (20.8%) | 3.11 |
| Single Male/Father | 194 (7.7%) | 2.68 |
| Single Female/Mother | 1,812 (71.6%) | 2.69 |
| Total Families | 2,532 (100.0%) | 2.78 |
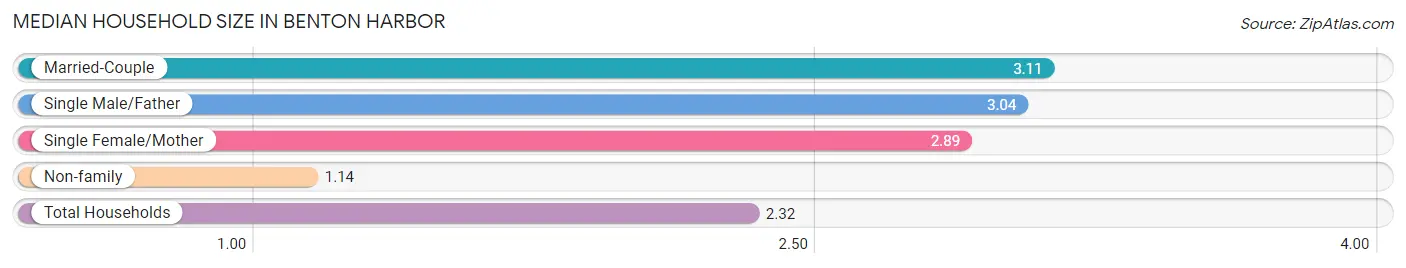
Median Household Size in Benton Harbor
The median household size in Benton Harbor is 2.32 persons per household, with married-couple households (526 | 13.6%) accounting for the largest median household size of 3.11 persons per household. non-family households (1,335 | 34.5%) represent the smallest median household size with 1.14 persons per household.
| Household Type | # Households | Household Size |
| Married-Couple | 526 (13.6%) | 3.11 |
| Single Male/Father | 194 (5.0%) | 3.04 |
| Single Female/Mother | 1,812 (46.9%) | 2.89 |
| Non-family | 1,335 (34.5%) | 1.14 |
| Total Households | 3,867 (100.0%) | 2.32 |
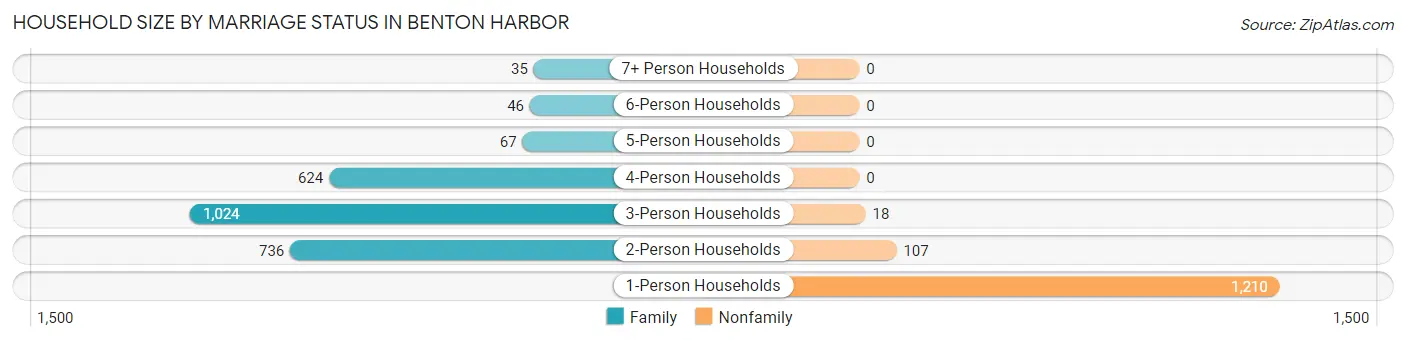
Household Size by Marriage Status in Benton Harbor
Out of a total of 3,867 households in Benton Harbor, 2,532 (65.5%) are family households, while 1,335 (34.5%) are nonfamily households. The most numerous type of family households are 3-person households, comprising 1,024, and the most common type of nonfamily households are 1-person households, comprising 1,210.
| Household Size | Family Households | Nonfamily Households |
| 1-Person Households | - | 1,210 (31.3%) |
| 2-Person Households | 736 (19.0%) | 107 (2.8%) |
| 3-Person Households | 1,024 (26.5%) | 18 (0.5%) |
| 4-Person Households | 624 (16.1%) | 0 (0.0%) |
| 5-Person Households | 67 (1.7%) | 0 (0.0%) |
| 6-Person Households | 46 (1.2%) | 0 (0.0%) |
| 7+ Person Households | 35 (0.9%) | 0 (0.0%) |
| Total | 2,532 (65.5%) | 1,335 (34.5%) |
Female Fertility in Benton Harbor
Fertility by Age in Benton Harbor
Average fertility rate in Benton Harbor is 65.0 births per 1,000 women. Women in the age bracket of 20 to 34 years have the highest fertility rate with 150.0 births per 1,000 women. Women in the age bracket of 20 to 34 years acount for 85.7% of all women with births.
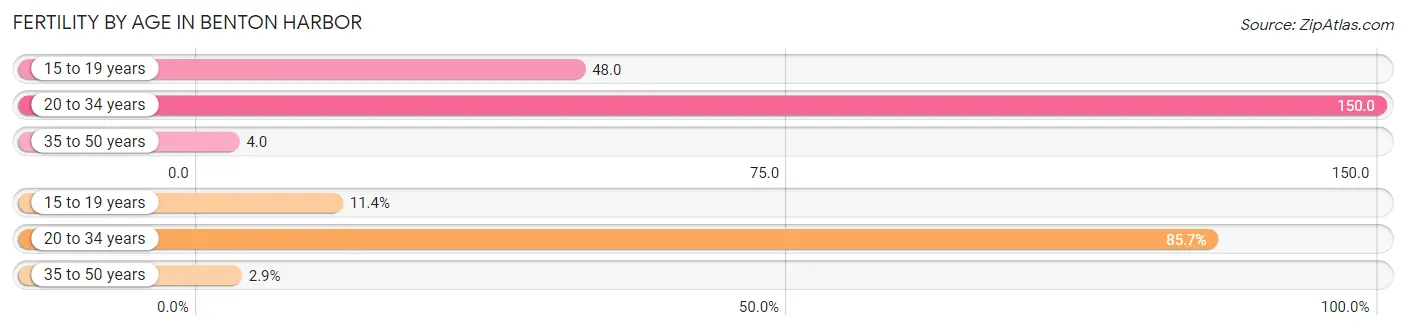
| Age Bracket | Women with Births | Births / 1,000 Women |
| 15 to 19 years | 20 (11.4%) | 48.0 |
| 20 to 34 years | 150 (85.7%) | 150.0 |
| 35 to 50 years | 5 (2.9%) | 4.0 |
| Total | 175 (100.0%) | 65.0 |
Fertility by Age by Marriage Status in Benton Harbor
10.3% of women with births (175) in Benton Harbor are married. The highest percentage of unmarried women with births falls into 15 to 19 years age bracket with 100.0% of them unmarried at the time of birth, while the lowest percentage of unmarried women with births belong to 35 to 50 years age bracket with 0.0% of them unmarried.
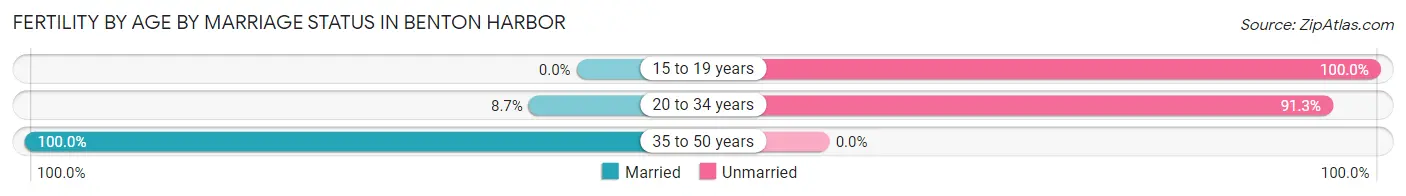
| Age Bracket | Married | Unmarried |
| 15 to 19 years | 0 (0.0%) | 20 (100.0%) |
| 20 to 34 years | 13 (8.7%) | 137 (91.3%) |
| 35 to 50 years | 5 (100.0%) | 0 (0.0%) |
| Total | 18 (10.3%) | 157 (89.7%) |
Fertility by Education in Benton Harbor
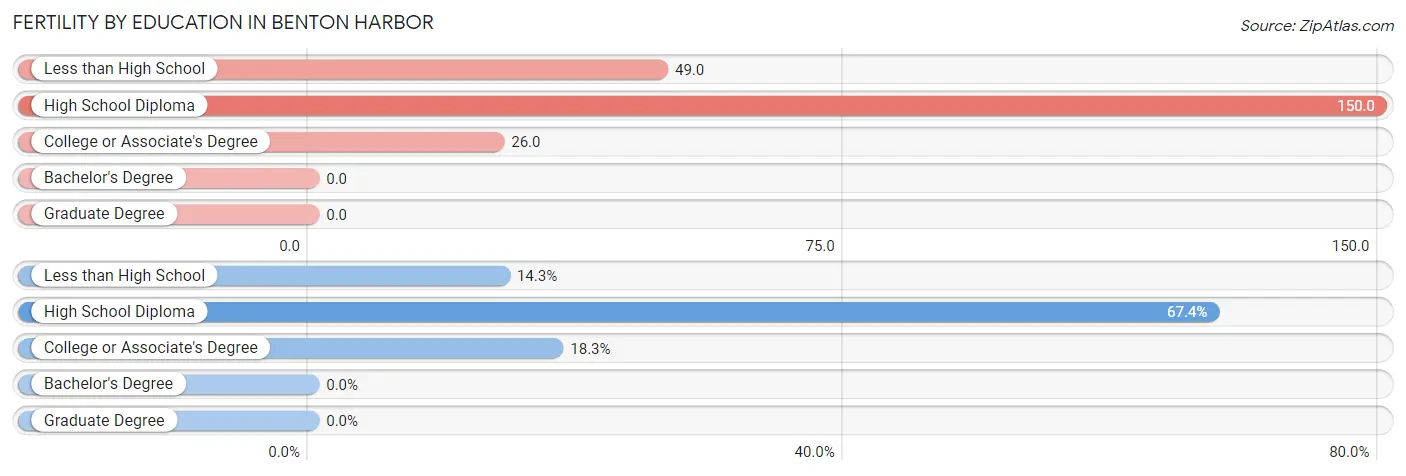
| Educational Attainment | Women with Births | Births / 1,000 Women |
| Less than High School | 25 (14.3%) | 49.0 |
| High School Diploma | 118 (67.4%) | 150.0 |
| College or Associate's Degree | 32 (18.3%) | 26.0 |
| Bachelor's Degree | 0 (0.0%) | 0.0 |
| Graduate Degree | 0 (0.0%) | 0.0 |
| Total | 175 (100.0%) | 65.0 |
Fertility by Education by Marriage Status in Benton Harbor
89.7% of women with births in Benton Harbor are unmarried. Women with the educational attainment of college or associate's degree are most likely to be married with 34.4% of them married at childbirth, while women with the educational attainment of high school diploma are least likely to be married with 100.0% of them unmarried at childbirth.
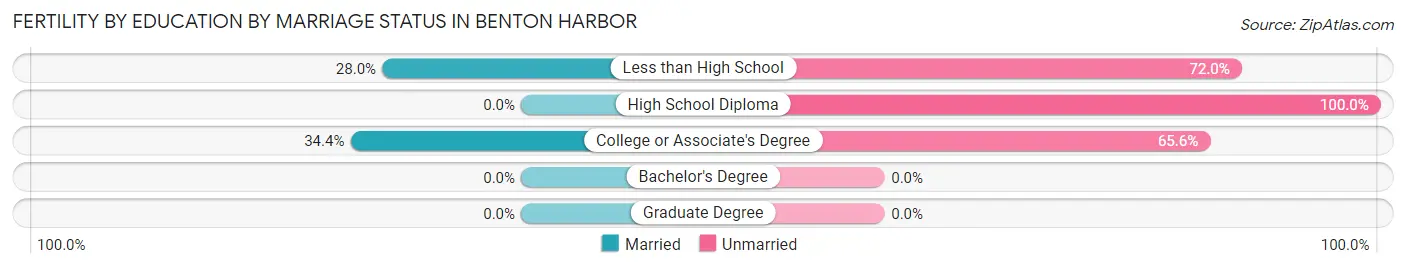
| Educational Attainment | Married | Unmarried |
| Less than High School | 7 (28.0%) | 18 (72.0%) |
| High School Diploma | 0 (0.0%) | 118 (100.0%) |
| College or Associate's Degree | 11 (34.4%) | 21 (65.6%) |
| Bachelor's Degree | 0 (0.0%) | 0 (0.0%) |
| Graduate Degree | 0 (0.0%) | 0 (0.0%) |
| Total | 18 (10.3%) | 157 (89.7%) |
Employment Characteristics in Benton Harbor
Employment by Class of Employer in Benton Harbor
Among the 3,351 employed individuals in Benton Harbor, private company employees (2,449 | 73.1%), not-for-profit organizations (287 | 8.6%), and local government employees (222 | 6.6%) make up the most common classes of employment.
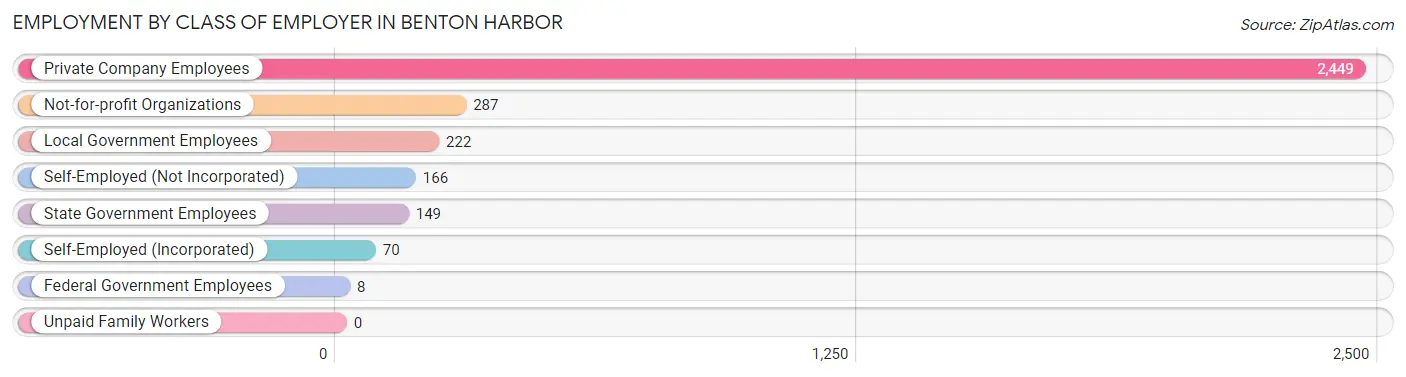
| Employer Class | # Employees | % Employees |
| Private Company Employees | 2,449 | 73.1% |
| Self-Employed (Incorporated) | 70 | 2.1% |
| Self-Employed (Not Incorporated) | 166 | 5.0% |
| Not-for-profit Organizations | 287 | 8.6% |
| Local Government Employees | 222 | 6.6% |
| State Government Employees | 149 | 4.4% |
| Federal Government Employees | 8 | 0.2% |
| Unpaid Family Workers | 0 | 0.0% |
| Total | 3,351 | 100.0% |
Employment Status by Age in Benton Harbor
According to the labor force statistics for Benton Harbor, out of the total population over 16 years of age (6,864), 63.3% or 4,345 individuals are in the labor force, with 20.2% or 878 of them unemployed. The age group with the highest labor force participation rate is 35 to 44 years, with 91.2% or 1,208 individuals in the labor force. Within the labor force, the 25 to 29 years age range has the highest percentage of unemployed individuals, with 43.9% or 239 of them being unemployed.
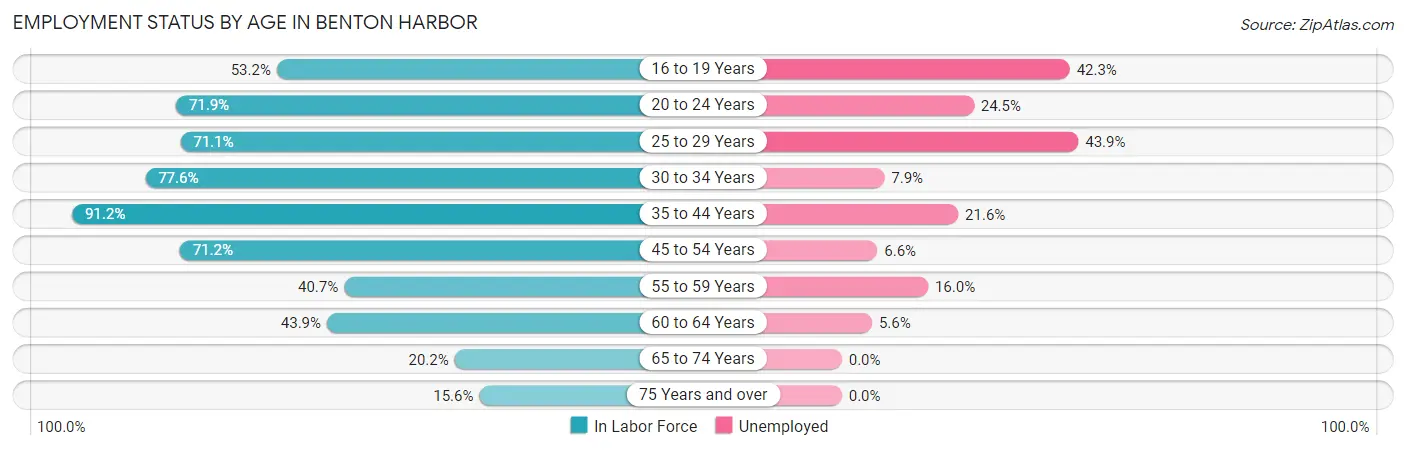
| Age Bracket | In Labor Force | Unemployed |
| 16 to 19 Years | 336 (53.2%) | 142 (42.3%) |
| 20 to 24 Years | 432 (71.9%) | 106 (24.5%) |
| 25 to 29 Years | 545 (71.1%) | 239 (43.9%) |
| 30 to 34 Years | 343 (77.6%) | 27 (7.9%) |
| 35 to 44 Years | 1,208 (91.2%) | 261 (21.6%) |
| 45 to 54 Years | 899 (71.2%) | 59 (6.6%) |
| 55 to 59 Years | 194 (40.7%) | 31 (16.0%) |
| 60 to 64 Years | 231 (43.9%) | 13 (5.6%) |
| 65 to 74 Years | 107 (20.2%) | 0 (0.0%) |
| 75 Years and over | 47 (15.6%) | 0 (0.0%) |
| Total | 4,345 (63.3%) | 878 (20.2%) |
Employment Status by Educational Attainment in Benton Harbor
According to labor force statistics for Benton Harbor, 71.3% of individuals (3,421) out of the total population between 25 and 64 years of age (4,798) are in the labor force, with 18.4% or 629 of them being unemployed. The group with the highest labor force participation rate are those with the educational attainment of bachelor's degree or higher, with 88.6% or 358 individuals in the labor force. Within the labor force, individuals with less than high school education have the highest percentage of unemployment, with 49.3% or 306 of them being unemployed.

| Educational Attainment | In Labor Force | Unemployed |
| Less than High School | 621 (62.7%) | 488 (49.3%) |
| High School Diploma | 978 (59.4%) | 133 (8.1%) |
| College / Associate Degree | 1,464 (83.3%) | 267 (15.2%) |
| Bachelor's Degree or higher | 358 (88.6%) | 25 (6.1%) |
| Total | 3,421 (71.3%) | 883 (18.4%) |
Employment Occupations by Sex in Benton Harbor
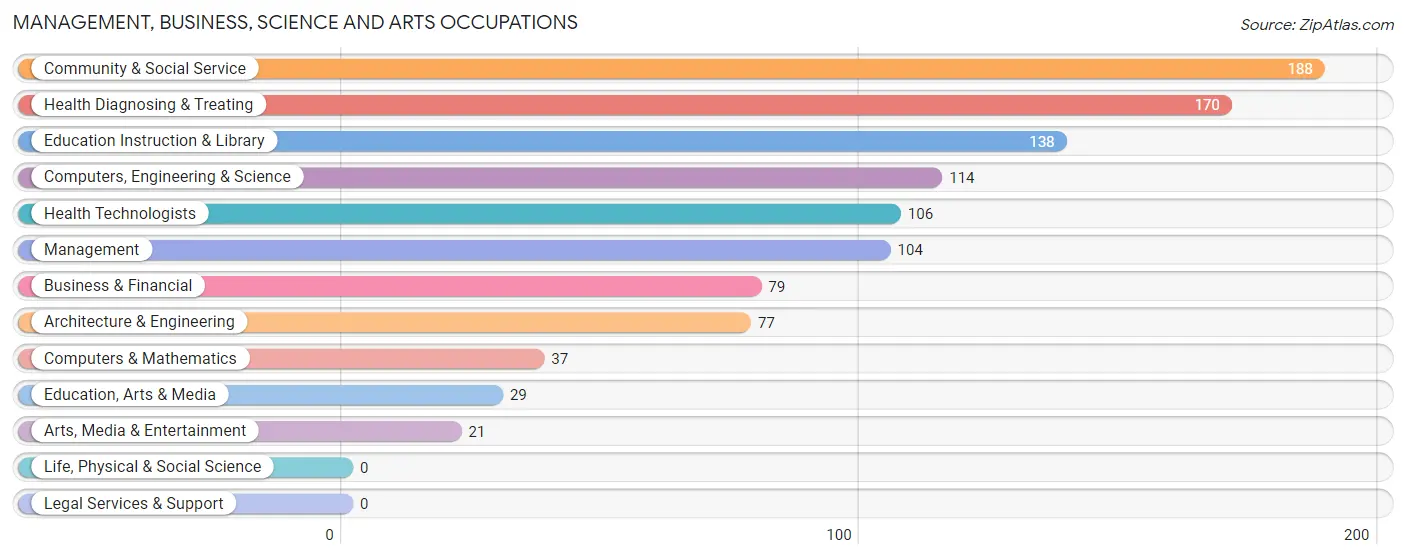
Management, Business, Science and Arts Occupations
The most common Management, Business, Science and Arts occupations in Benton Harbor are Community & Social Service (188 | 5.4%), Health Diagnosing & Treating (170 | 4.9%), Education Instruction & Library (138 | 4.0%), Computers, Engineering & Science (114 | 3.3%), and Health Technologists (106 | 3.1%).
Management, Business, Science and Arts Occupations by Sex
Within the Management, Business, Science and Arts occupations in Benton Harbor, the most male-oriented occupations are Computers & Mathematics (100.0%), Computers, Engineering & Science (72.8%), and Architecture & Engineering (59.7%), while the most female-oriented occupations are Health Technologists (86.8%), Business & Financial (81.0%), and Health Diagnosing & Treating (78.2%).
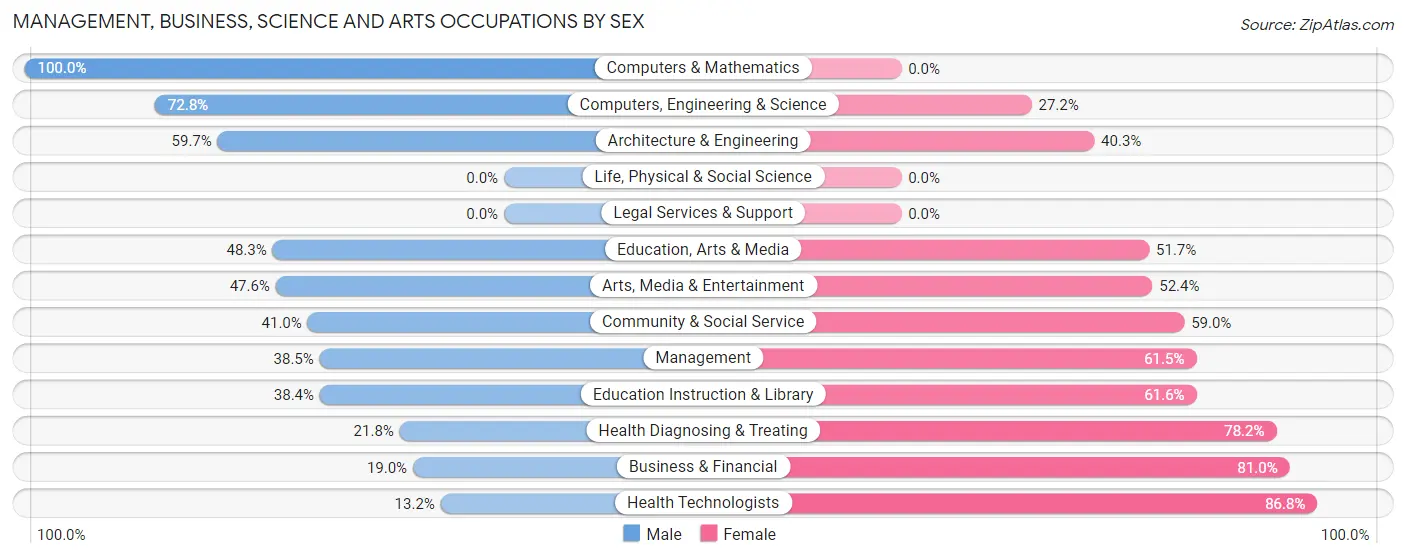
| Occupation | Male | Female |
| Management | 40 (38.5%) | 64 (61.5%) |
| Business & Financial | 15 (19.0%) | 64 (81.0%) |
| Computers, Engineering & Science | 83 (72.8%) | 31 (27.2%) |
| Computers & Mathematics | 37 (100.0%) | 0 (0.0%) |
| Architecture & Engineering | 46 (59.7%) | 31 (40.3%) |
| Life, Physical & Social Science | 0 (0.0%) | 0 (0.0%) |
| Community & Social Service | 77 (41.0%) | 111 (59.0%) |
| Education, Arts & Media | 14 (48.3%) | 15 (51.7%) |
| Legal Services & Support | 0 (0.0%) | 0 (0.0%) |
| Education Instruction & Library | 53 (38.4%) | 85 (61.6%) |
| Arts, Media & Entertainment | 10 (47.6%) | 11 (52.4%) |
| Health Diagnosing & Treating | 37 (21.8%) | 133 (78.2%) |
| Health Technologists | 14 (13.2%) | 92 (86.8%) |
| Total (Category) | 252 (38.5%) | 403 (61.5%) |
| Total (Overall) | 1,419 (41.0%) | 2,045 (59.0%) |
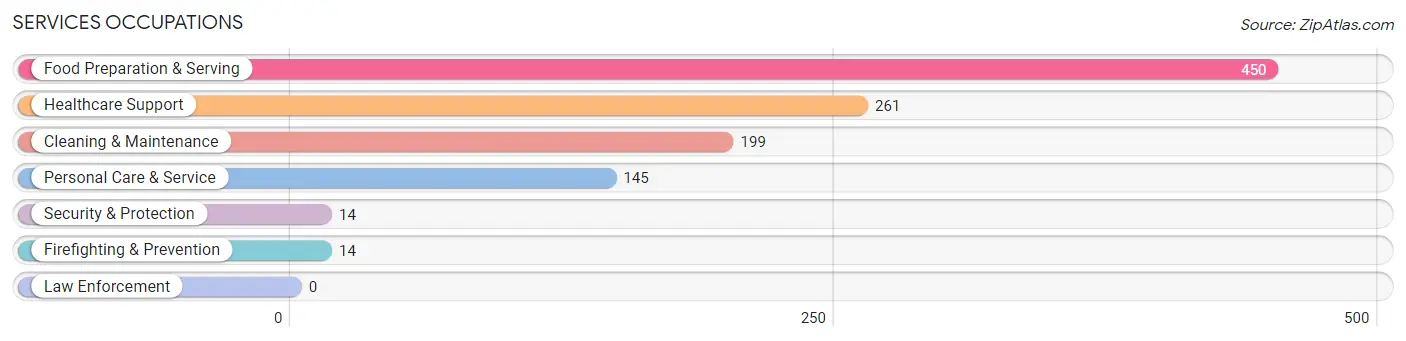
Services Occupations
The most common Services occupations in Benton Harbor are Food Preparation & Serving (450 | 13.0%), Healthcare Support (261 | 7.5%), Cleaning & Maintenance (199 | 5.7%), Personal Care & Service (145 | 4.2%), and Security & Protection (14 | 0.4%).
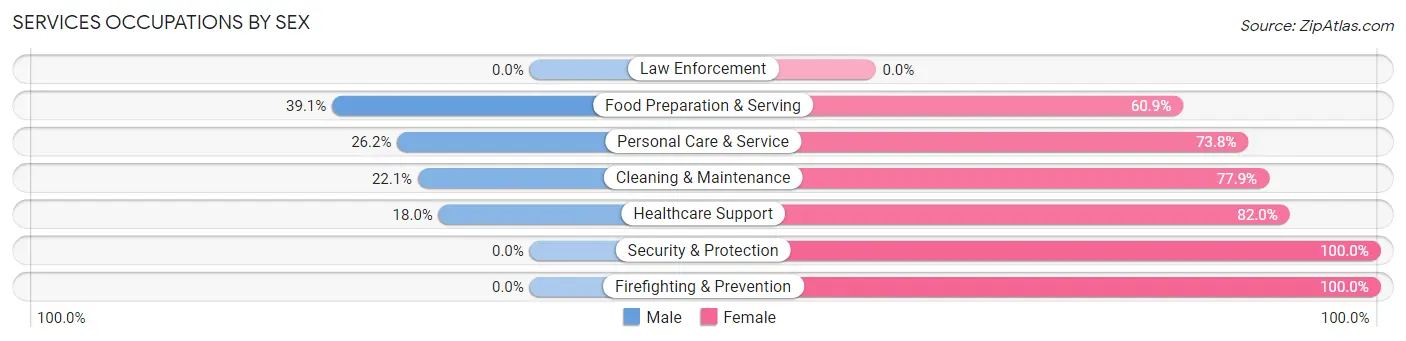
Services Occupations by Sex
Within the Services occupations in Benton Harbor, the most male-oriented occupations are Food Preparation & Serving (39.1%), Personal Care & Service (26.2%), and Cleaning & Maintenance (22.1%), while the most female-oriented occupations are Security & Protection (100.0%), Firefighting & Prevention (100.0%), and Healthcare Support (82.0%).
| Occupation | Male | Female |
| Healthcare Support | 47 (18.0%) | 214 (82.0%) |
| Security & Protection | 0 (0.0%) | 14 (100.0%) |
| Firefighting & Prevention | 0 (0.0%) | 14 (100.0%) |
| Law Enforcement | 0 (0.0%) | 0 (0.0%) |
| Food Preparation & Serving | 176 (39.1%) | 274 (60.9%) |
| Cleaning & Maintenance | 44 (22.1%) | 155 (77.9%) |
| Personal Care & Service | 38 (26.2%) | 107 (73.8%) |
| Total (Category) | 305 (28.5%) | 764 (71.5%) |
| Total (Overall) | 1,419 (41.0%) | 2,045 (59.0%) |
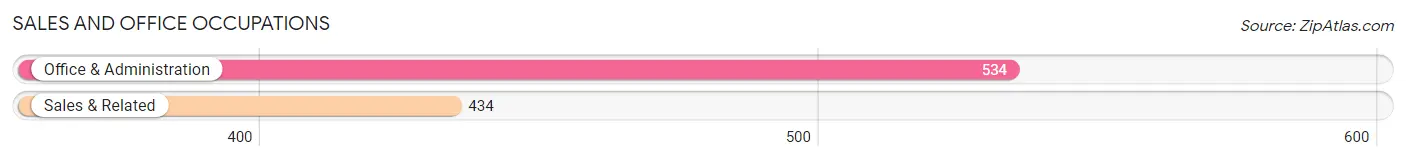
Sales and Office Occupations
The most common Sales and Office occupations in Benton Harbor are Office & Administration (534 | 15.4%), and Sales & Related (434 | 12.5%).
Sales and Office Occupations by Sex
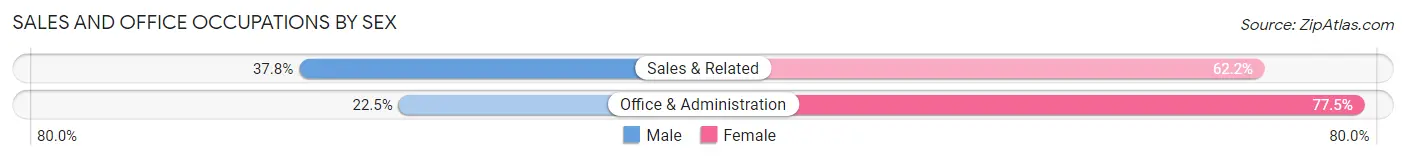
| Occupation | Male | Female |
| Sales & Related | 164 (37.8%) | 270 (62.2%) |
| Office & Administration | 120 (22.5%) | 414 (77.5%) |
| Total (Category) | 284 (29.3%) | 684 (70.7%) |
| Total (Overall) | 1,419 (41.0%) | 2,045 (59.0%) |
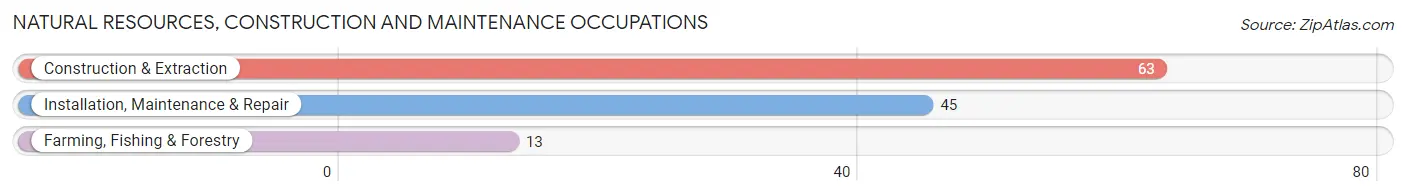
Natural Resources, Construction and Maintenance Occupations
The most common Natural Resources, Construction and Maintenance occupations in Benton Harbor are Construction & Extraction (63 | 1.8%), Installation, Maintenance & Repair (45 | 1.3%), and Farming, Fishing & Forestry (13 | 0.4%).
Natural Resources, Construction and Maintenance Occupations by Sex
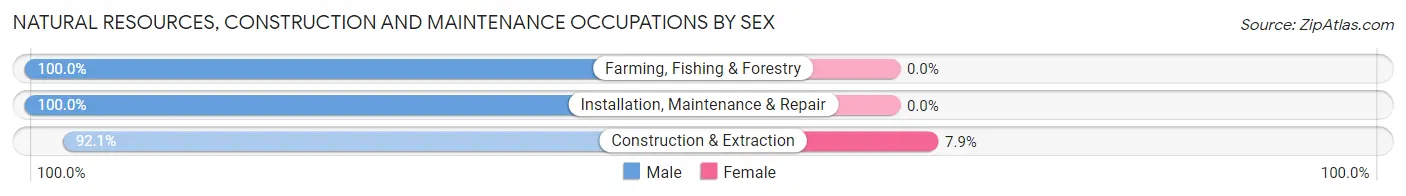
| Occupation | Male | Female |
| Farming, Fishing & Forestry | 13 (100.0%) | 0 (0.0%) |
| Construction & Extraction | 58 (92.1%) | 5 (7.9%) |
| Installation, Maintenance & Repair | 45 (100.0%) | 0 (0.0%) |
| Total (Category) | 116 (95.9%) | 5 (4.1%) |
| Total (Overall) | 1,419 (41.0%) | 2,045 (59.0%) |
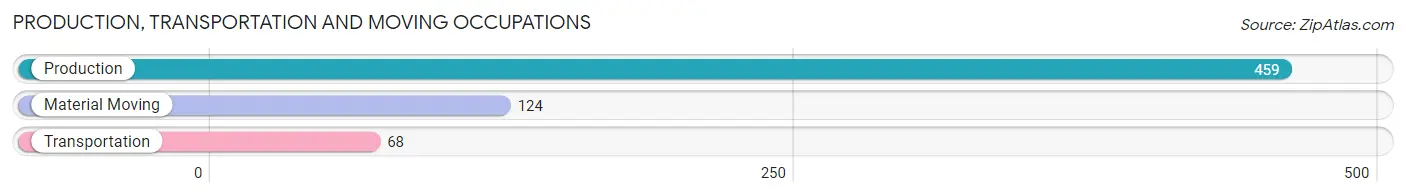
Production, Transportation and Moving Occupations
The most common Production, Transportation and Moving occupations in Benton Harbor are Production (459 | 13.3%), Material Moving (124 | 3.6%), and Transportation (68 | 2.0%).
Production, Transportation and Moving Occupations by Sex
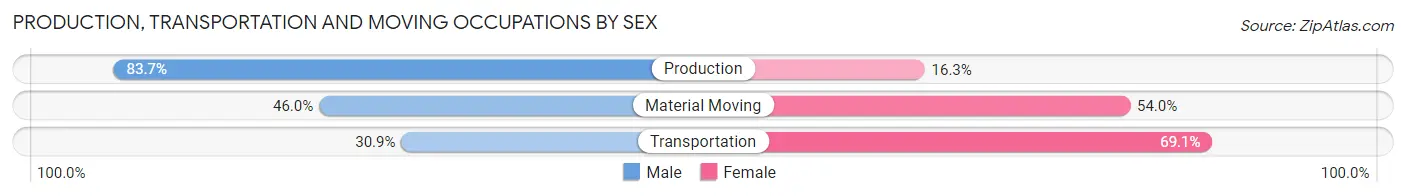
| Occupation | Male | Female |
| Production | 384 (83.7%) | 75 (16.3%) |
| Transportation | 21 (30.9%) | 47 (69.1%) |
| Material Moving | 57 (46.0%) | 67 (54.0%) |
| Total (Category) | 462 (71.0%) | 189 (29.0%) |
| Total (Overall) | 1,419 (41.0%) | 2,045 (59.0%) |
Employment Industries by Sex in Benton Harbor
Employment Industries in Benton Harbor
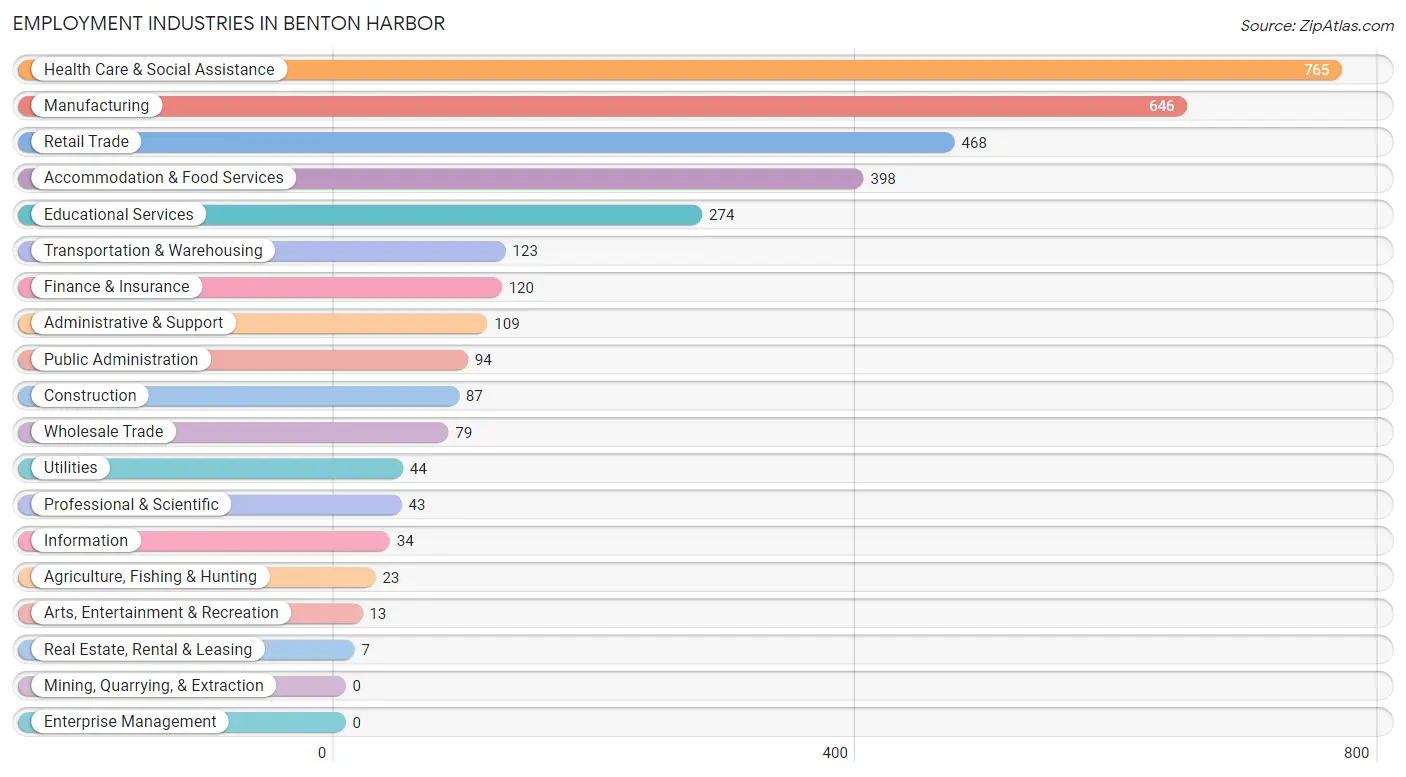
The major employment industries in Benton Harbor include Health Care & Social Assistance (765 | 22.1%), Manufacturing (646 | 18.6%), Retail Trade (468 | 13.5%), Accommodation & Food Services (398 | 11.5%), and Educational Services (274 | 7.9%).
Employment Industries by Sex in Benton Harbor
The Benton Harbor industries that see more men than women are Agriculture, Fishing & Hunting (100.0%), Real Estate, Rental & Leasing (100.0%), and Professional & Scientific (100.0%), whereas the industries that tend to have a higher number of women are Utilities (100.0%), Information (100.0%), and Finance & Insurance (100.0%).
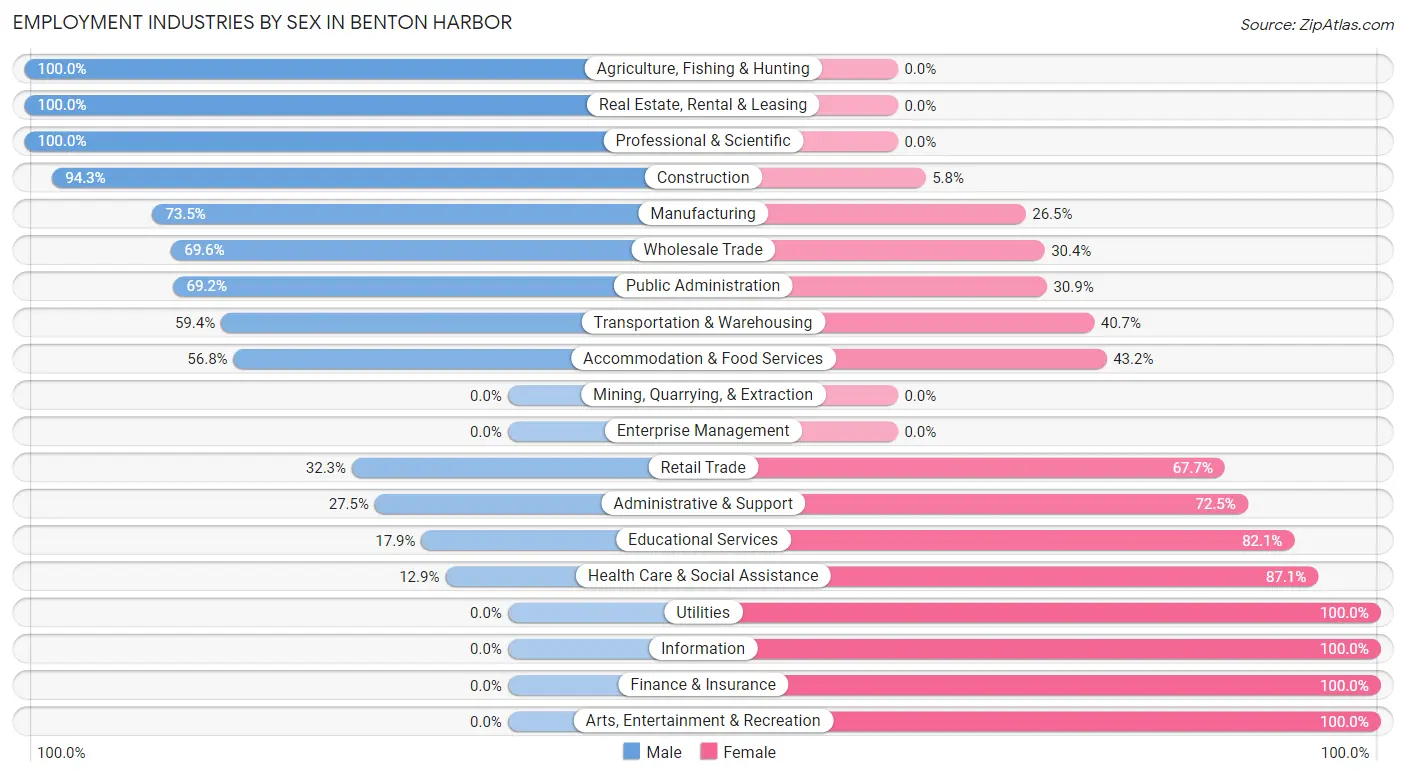
| Industry | Male | Female |
| Agriculture, Fishing & Hunting | 23 (100.0%) | 0 (0.0%) |
| Mining, Quarrying, & Extraction | 0 (0.0%) | 0 (0.0%) |
| Construction | 82 (94.3%) | 5 (5.8%) |
| Manufacturing | 475 (73.5%) | 171 (26.5%) |
| Wholesale Trade | 55 (69.6%) | 24 (30.4%) |
| Retail Trade | 151 (32.3%) | 317 (67.7%) |
| Transportation & Warehousing | 73 (59.4%) | 50 (40.6%) |
| Utilities | 0 (0.0%) | 44 (100.0%) |
| Information | 0 (0.0%) | 34 (100.0%) |
| Finance & Insurance | 0 (0.0%) | 120 (100.0%) |
| Real Estate, Rental & Leasing | 7 (100.0%) | 0 (0.0%) |
| Professional & Scientific | 43 (100.0%) | 0 (0.0%) |
| Enterprise Management | 0 (0.0%) | 0 (0.0%) |
| Administrative & Support | 30 (27.5%) | 79 (72.5%) |
| Educational Services | 49 (17.9%) | 225 (82.1%) |
| Health Care & Social Assistance | 99 (12.9%) | 666 (87.1%) |
| Arts, Entertainment & Recreation | 0 (0.0%) | 13 (100.0%) |
| Accommodation & Food Services | 226 (56.8%) | 172 (43.2%) |
| Public Administration | 65 (69.2%) | 29 (30.8%) |
| Total | 1,419 (41.0%) | 2,045 (59.0%) |
Education in Benton Harbor
School Enrollment in Benton Harbor
The most common levels of schooling among the 2,244 students in Benton Harbor are high school (772 | 34.4%), elementary school (486 | 21.7%), and middle school (403 | 18.0%).
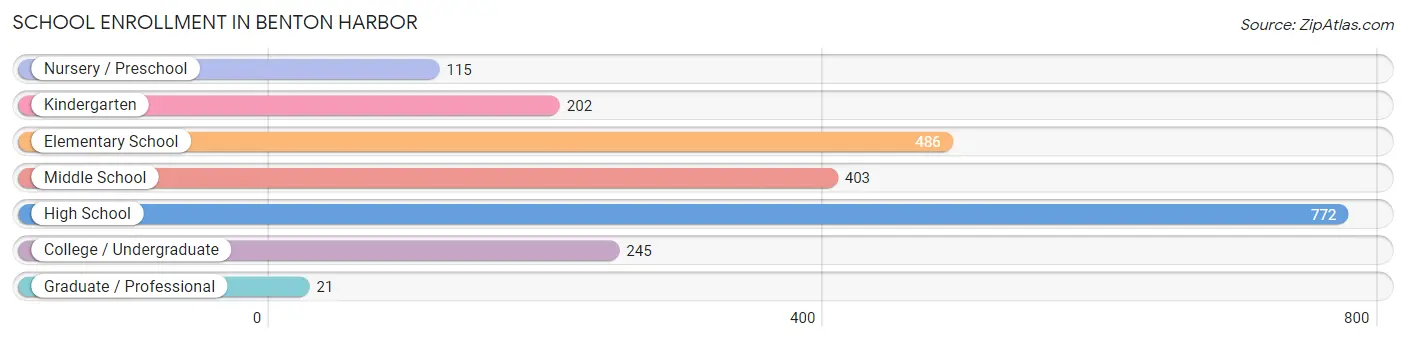
| School Level | # Students | % Students |
| Nursery / Preschool | 115 | 5.1% |
| Kindergarten | 202 | 9.0% |
| Elementary School | 486 | 21.7% |
| Middle School | 403 | 18.0% |
| High School | 772 | 34.4% |
| College / Undergraduate | 245 | 10.9% |
| Graduate / Professional | 21 | 0.9% |
| Total | 2,244 | 100.0% |
School Enrollment by Age by Funding Source in Benton Harbor
Out of a total of 2,244 students who are enrolled in schools in Benton Harbor, 148 (6.6%) attend a private institution, while the remaining 2,096 (93.4%) are enrolled in public schools. The age group of 35 years and over has the highest likelihood of being enrolled in private schools, with 7 (24.1% in the age bracket) enrolled. Conversely, the age group of 18 to 19 year olds has the lowest likelihood of being enrolled in a private school, with 202 (100.0% in the age bracket) attending a public institution.
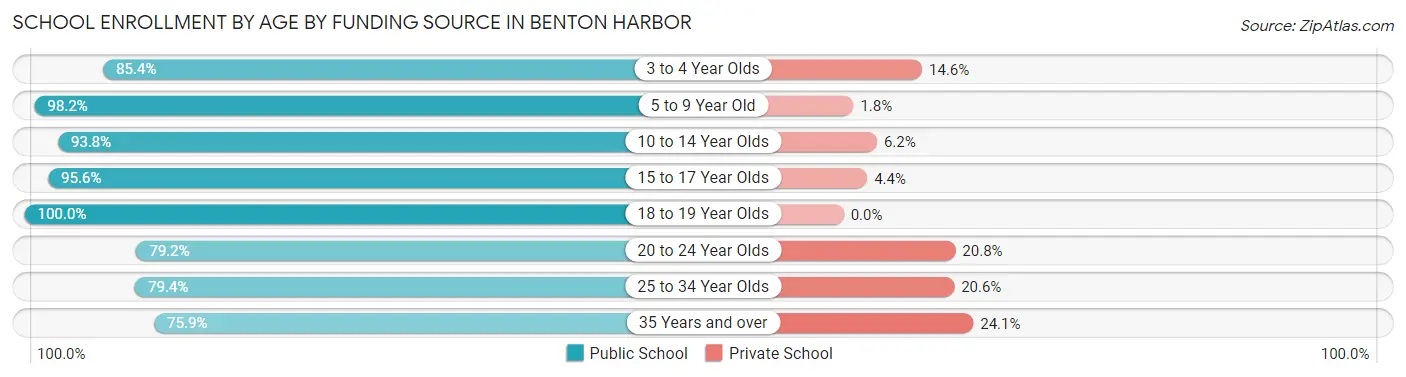
| Age Bracket | Public School | Private School |
| 3 to 4 Year Olds | 76 (85.4%) | 13 (14.6%) |
| 5 to 9 Year Old | 536 (98.2%) | 10 (1.8%) |
| 10 to 14 Year Olds | 650 (93.8%) | 43 (6.2%) |
| 15 to 17 Year Olds | 392 (95.6%) | 18 (4.4%) |
| 18 to 19 Year Olds | 202 (100.0%) | 0 (0.0%) |
| 20 to 24 Year Olds | 137 (79.2%) | 36 (20.8%) |
| 25 to 34 Year Olds | 81 (79.4%) | 21 (20.6%) |
| 35 Years and over | 22 (75.9%) | 7 (24.1%) |
| Total | 2,096 (93.4%) | 148 (6.6%) |
Educational Attainment by Field of Study in Benton Harbor
Business (143 | 28.2%), education (120 | 23.7%), social sciences (48 | 9.5%), arts & humanities (48 | 9.5%), and science & technology (38 | 7.5%) are the most common fields of study among 507 individuals in Benton Harbor who have obtained a bachelor's degree or higher.
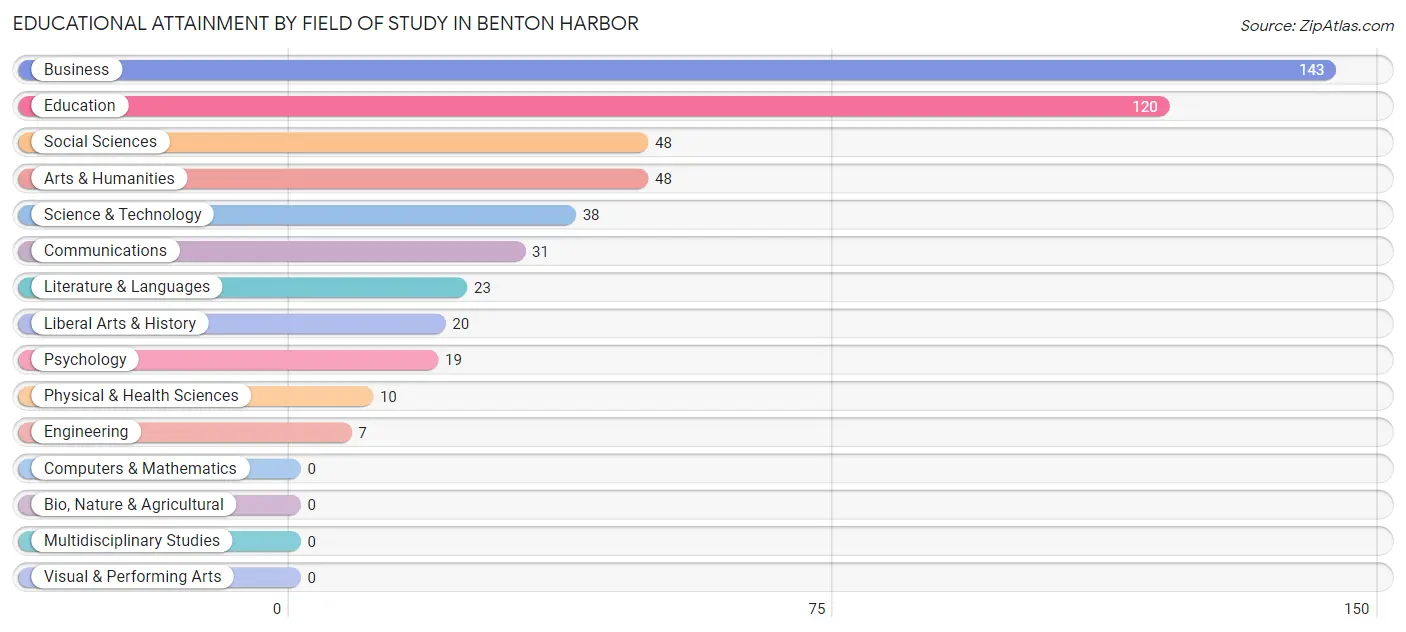
| Field of Study | # Graduates | % Graduates |
| Computers & Mathematics | 0 | 0.0% |
| Bio, Nature & Agricultural | 0 | 0.0% |
| Physical & Health Sciences | 10 | 2.0% |
| Psychology | 19 | 3.7% |
| Social Sciences | 48 | 9.5% |
| Engineering | 7 | 1.4% |
| Multidisciplinary Studies | 0 | 0.0% |
| Science & Technology | 38 | 7.5% |
| Business | 143 | 28.2% |
| Education | 120 | 23.7% |
| Literature & Languages | 23 | 4.5% |
| Liberal Arts & History | 20 | 3.9% |
| Visual & Performing Arts | 0 | 0.0% |
| Communications | 31 | 6.1% |
| Arts & Humanities | 48 | 9.5% |
| Total | 507 | 100.0% |
Transportation & Commute in Benton Harbor
Vehicle Availability by Sex in Benton Harbor
The most prevalent vehicle ownership categories in Benton Harbor are males with 1 vehicle (632, accounting for 45.6%) and females with 1 vehicle (1,079, making up 32.4%).
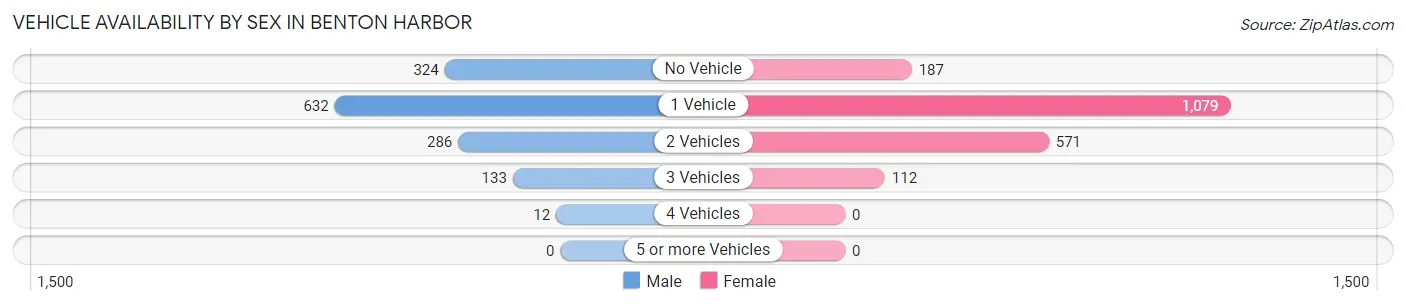
| Vehicles Available | Male | Female |
| No Vehicle | 324 (23.4%) | 187 (9.6%) |
| 1 Vehicle | 632 (45.6%) | 1,079 (55.4%) |
| 2 Vehicles | 286 (20.6%) | 571 (29.3%) |
| 3 Vehicles | 133 (9.6%) | 112 (5.8%) |
| 4 Vehicles | 12 (0.9%) | 0 (0.0%) |
| 5 or more Vehicles | 0 (0.0%) | 0 (0.0%) |
| Total | 1,387 (100.0%) | 1,949 (100.0%) |
Commute Time in Benton Harbor
The most frequently occuring commute durations in Benton Harbor are 10 to 14 minutes (956 commuters, 30.5%), 15 to 19 minutes (714 commuters, 22.8%), and 5 to 9 minutes (444 commuters, 14.1%).
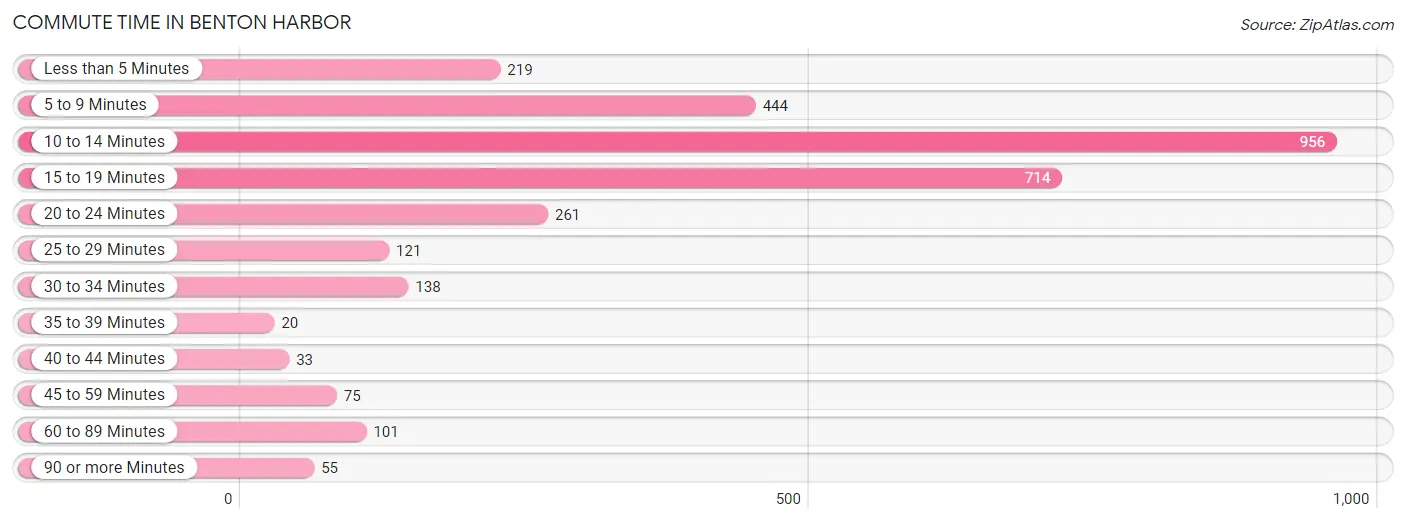
| Commute Time | # Commuters | % Commuters |
| Less than 5 Minutes | 219 | 7.0% |
| 5 to 9 Minutes | 444 | 14.1% |
| 10 to 14 Minutes | 956 | 30.5% |
| 15 to 19 Minutes | 714 | 22.8% |
| 20 to 24 Minutes | 261 | 8.3% |
| 25 to 29 Minutes | 121 | 3.9% |
| 30 to 34 Minutes | 138 | 4.4% |
| 35 to 39 Minutes | 20 | 0.6% |
| 40 to 44 Minutes | 33 | 1.1% |
| 45 to 59 Minutes | 75 | 2.4% |
| 60 to 89 Minutes | 101 | 3.2% |
| 90 or more Minutes | 55 | 1.8% |
Commute Time by Sex in Benton Harbor
The most common commute times in Benton Harbor are 10 to 14 minutes (339 commuters, 27.3%) for males and 10 to 14 minutes (617 commuters, 32.5%) for females.
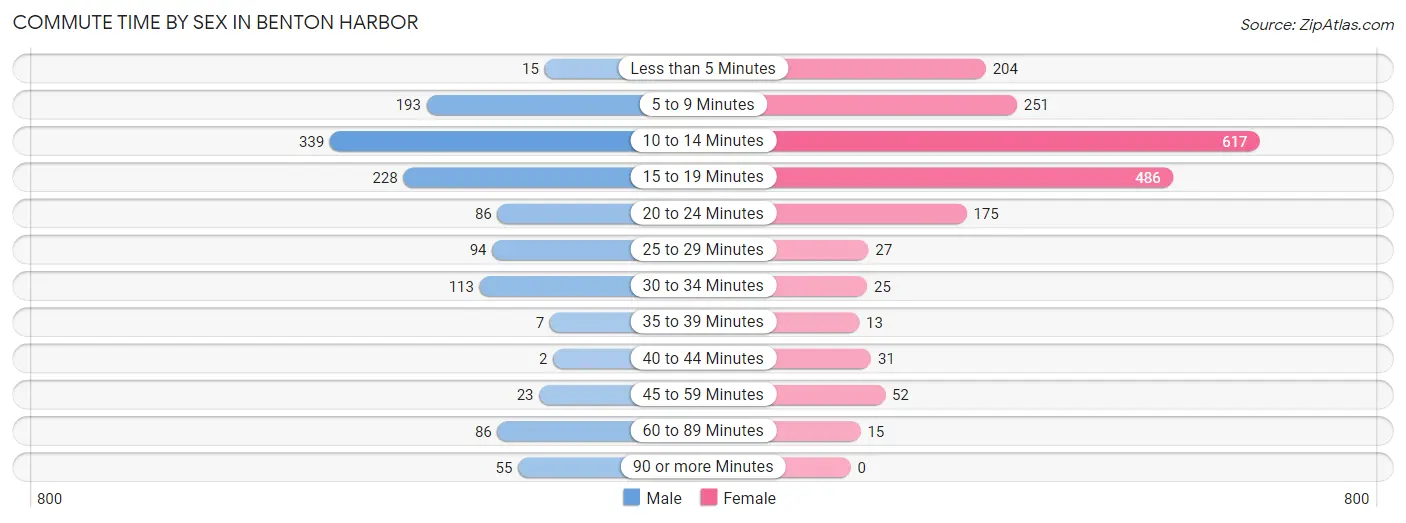
| Commute Time | Male | Female |
| Less than 5 Minutes | 15 (1.2%) | 204 (10.8%) |
| 5 to 9 Minutes | 193 (15.5%) | 251 (13.2%) |
| 10 to 14 Minutes | 339 (27.3%) | 617 (32.5%) |
| 15 to 19 Minutes | 228 (18.4%) | 486 (25.6%) |
| 20 to 24 Minutes | 86 (6.9%) | 175 (9.2%) |
| 25 to 29 Minutes | 94 (7.6%) | 27 (1.4%) |
| 30 to 34 Minutes | 113 (9.1%) | 25 (1.3%) |
| 35 to 39 Minutes | 7 (0.6%) | 13 (0.7%) |
| 40 to 44 Minutes | 2 (0.2%) | 31 (1.6%) |
| 45 to 59 Minutes | 23 (1.8%) | 52 (2.7%) |
| 60 to 89 Minutes | 86 (6.9%) | 15 (0.8%) |
| 90 or more Minutes | 55 (4.4%) | 0 (0.0%) |
Time of Departure to Work by Sex in Benton Harbor
The most frequent times of departure to work in Benton Harbor are 6:30 AM to 6:59 AM (228, 18.4%) for males and 8:00 AM to 8:29 AM (482, 25.4%) for females.
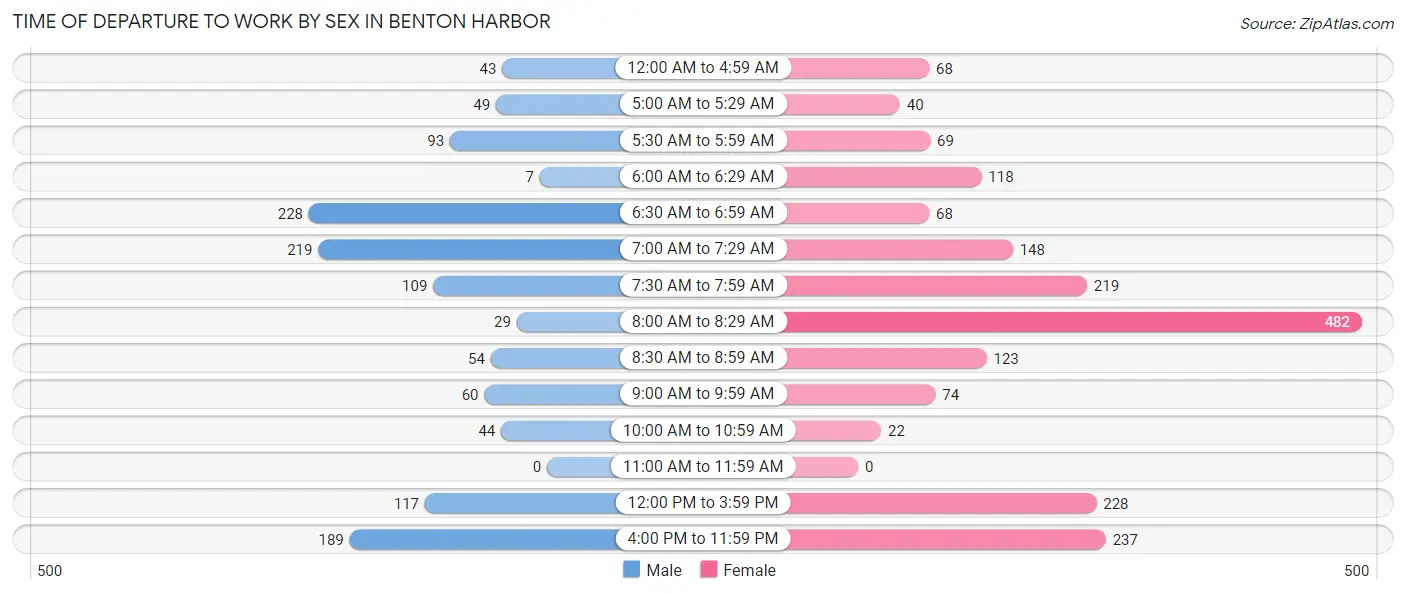
| Time of Departure | Male | Female |
| 12:00 AM to 4:59 AM | 43 (3.5%) | 68 (3.6%) |
| 5:00 AM to 5:29 AM | 49 (4.0%) | 40 (2.1%) |
| 5:30 AM to 5:59 AM | 93 (7.5%) | 69 (3.6%) |
| 6:00 AM to 6:29 AM | 7 (0.6%) | 118 (6.2%) |
| 6:30 AM to 6:59 AM | 228 (18.4%) | 68 (3.6%) |
| 7:00 AM to 7:29 AM | 219 (17.6%) | 148 (7.8%) |
| 7:30 AM to 7:59 AM | 109 (8.8%) | 219 (11.6%) |
| 8:00 AM to 8:29 AM | 29 (2.3%) | 482 (25.4%) |
| 8:30 AM to 8:59 AM | 54 (4.3%) | 123 (6.5%) |
| 9:00 AM to 9:59 AM | 60 (4.8%) | 74 (3.9%) |
| 10:00 AM to 10:59 AM | 44 (3.5%) | 22 (1.2%) |
| 11:00 AM to 11:59 AM | 0 (0.0%) | 0 (0.0%) |
| 12:00 PM to 3:59 PM | 117 (9.4%) | 228 (12.0%) |
| 4:00 PM to 11:59 PM | 189 (15.2%) | 237 (12.5%) |
| Total | 1,241 (100.0%) | 1,896 (100.0%) |
Housing Occupancy in Benton Harbor
Occupancy by Ownership in Benton Harbor
Of the total 3,867 dwellings in Benton Harbor, owner-occupied units account for 1,425 (36.8%), while renter-occupied units make up 2,442 (63.1%).
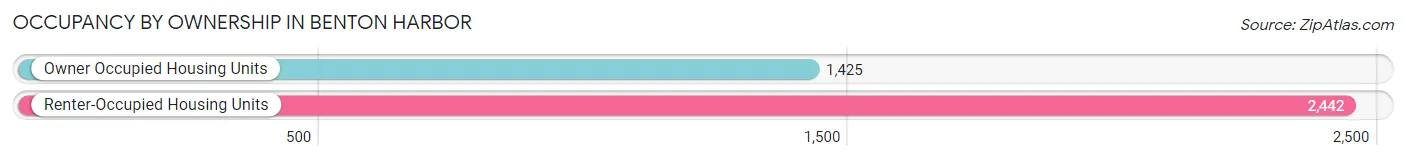
| Occupancy | # Housing Units | % Housing Units |
| Owner Occupied Housing Units | 1,425 | 36.8% |
| Renter-Occupied Housing Units | 2,442 | 63.1% |
| Total Occupied Housing Units | 3,867 | 100.0% |
Occupancy by Household Size in Benton Harbor
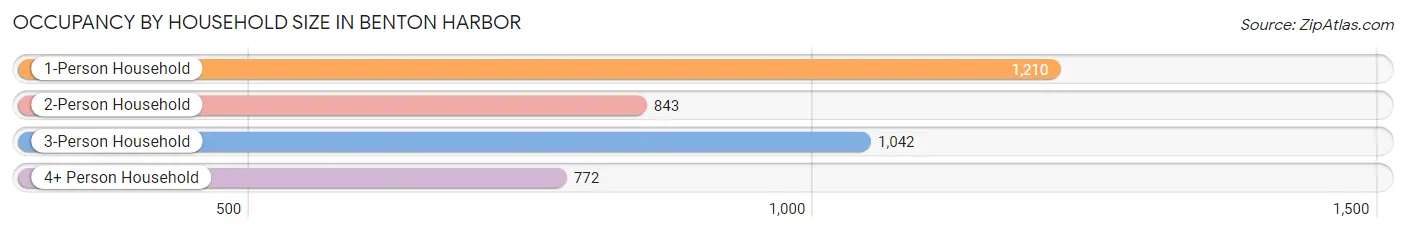
| Household Size | # Housing Units | % Housing Units |
| 1-Person Household | 1,210 | 31.3% |
| 2-Person Household | 843 | 21.8% |
| 3-Person Household | 1,042 | 27.0% |
| 4+ Person Household | 772 | 20.0% |
| Total Housing Units | 3,867 | 100.0% |
Occupancy by Ownership by Household Size in Benton Harbor
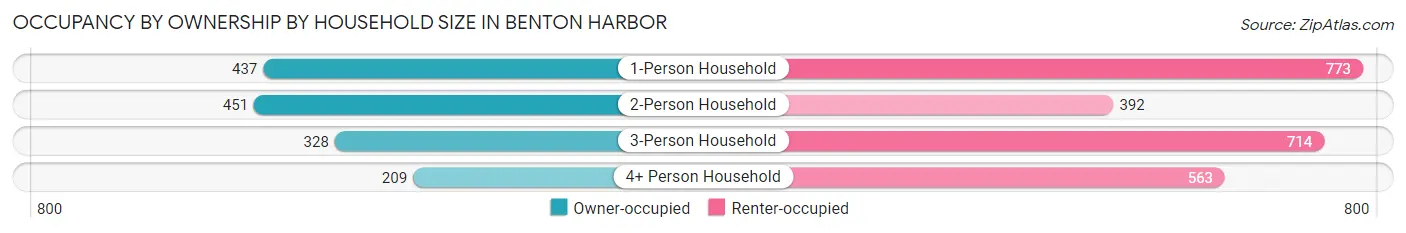
| Household Size | Owner-occupied | Renter-occupied |
| 1-Person Household | 437 (36.1%) | 773 (63.9%) |
| 2-Person Household | 451 (53.5%) | 392 (46.5%) |
| 3-Person Household | 328 (31.5%) | 714 (68.5%) |
| 4+ Person Household | 209 (27.1%) | 563 (72.9%) |
| Total Housing Units | 1,425 (36.8%) | 2,442 (63.1%) |
Occupancy by Educational Attainment in Benton Harbor
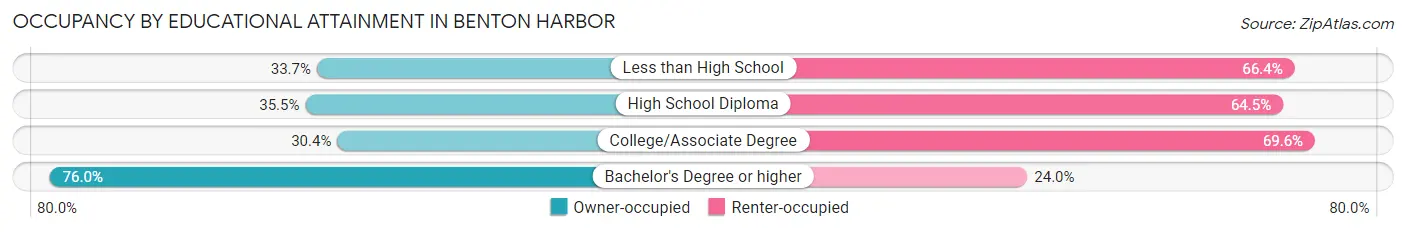
| Household Size | Owner-occupied | Renter-occupied |
| Less than High School | 210 (33.7%) | 414 (66.3%) |
| High School Diploma | 430 (35.5%) | 782 (64.5%) |
| College/Associate Degree | 506 (30.4%) | 1,158 (69.6%) |
| Bachelor's Degree or higher | 279 (76.0%) | 88 (24.0%) |
Occupancy by Age of Householder in Benton Harbor
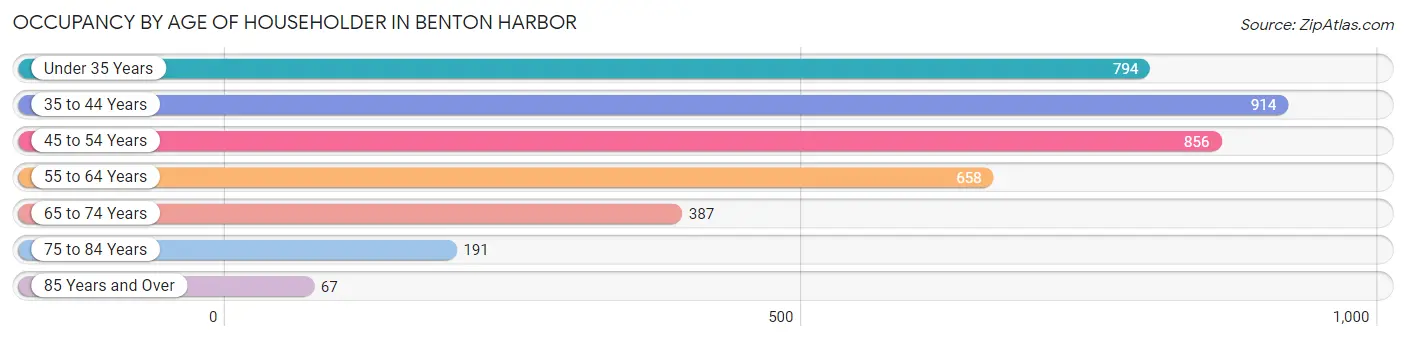
| Age Bracket | # Households | % Households |
| Under 35 Years | 794 | 20.5% |
| 35 to 44 Years | 914 | 23.6% |
| 45 to 54 Years | 856 | 22.1% |
| 55 to 64 Years | 658 | 17.0% |
| 65 to 74 Years | 387 | 10.0% |
| 75 to 84 Years | 191 | 4.9% |
| 85 Years and Over | 67 | 1.7% |
| Total | 3,867 | 100.0% |
Housing Finances in Benton Harbor
Median Income by Occupancy in Benton Harbor
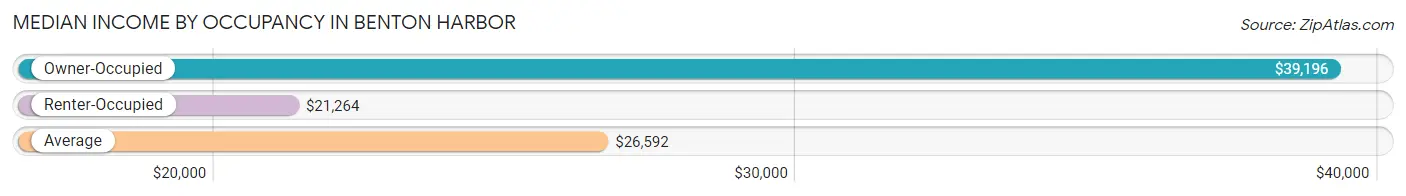
| Occupancy Type | # Households | Median Income |
| Owner-Occupied | 1,425 (36.8%) | $39,196 |
| Renter-Occupied | 2,442 (63.1%) | $21,264 |
| Average | 3,867 (100.0%) | $26,592 |
Occupancy by Householder Income Bracket in Benton Harbor
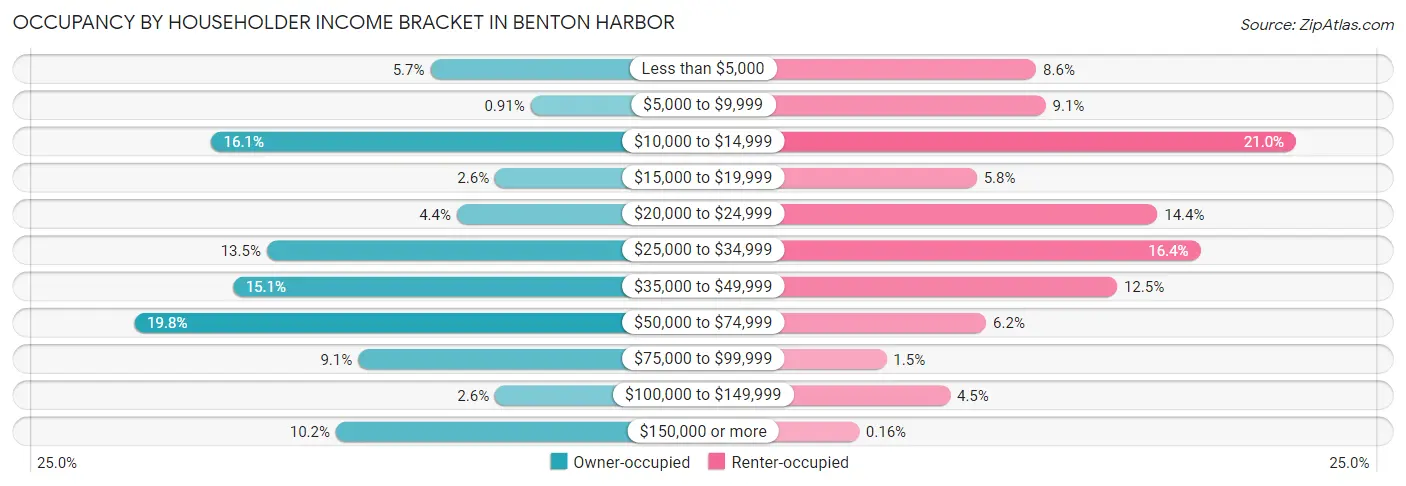
| Income Bracket | Owner-occupied | Renter-occupied |
| Less than $5,000 | 81 (5.7%) | 210 (8.6%) |
| $5,000 to $9,999 | 13 (0.9%) | 221 (9.0%) |
| $10,000 to $14,999 | 230 (16.1%) | 512 (21.0%) |
| $15,000 to $19,999 | 37 (2.6%) | 141 (5.8%) |
| $20,000 to $24,999 | 63 (4.4%) | 351 (14.4%) |
| $25,000 to $34,999 | 192 (13.5%) | 401 (16.4%) |
| $35,000 to $49,999 | 215 (15.1%) | 304 (12.4%) |
| $50,000 to $74,999 | 282 (19.8%) | 152 (6.2%) |
| $75,000 to $99,999 | 130 (9.1%) | 36 (1.5%) |
| $100,000 to $149,999 | 37 (2.6%) | 110 (4.5%) |
| $150,000 or more | 145 (10.2%) | 4 (0.2%) |
| Total | 1,425 (100.0%) | 2,442 (100.0%) |
Monthly Housing Cost Tiers in Benton Harbor
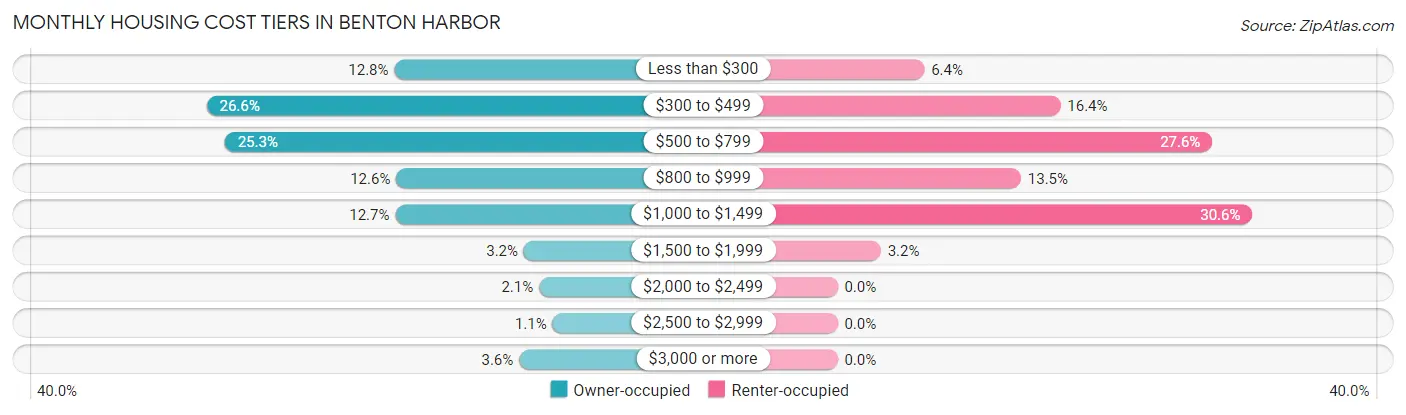
| Monthly Cost | Owner-occupied | Renter-occupied |
| Less than $300 | 182 (12.8%) | 156 (6.4%) |
| $300 to $499 | 379 (26.6%) | 401 (16.4%) |
| $500 to $799 | 360 (25.3%) | 674 (27.6%) |
| $800 to $999 | 180 (12.6%) | 330 (13.5%) |
| $1,000 to $1,499 | 181 (12.7%) | 746 (30.5%) |
| $1,500 to $1,999 | 46 (3.2%) | 78 (3.2%) |
| $2,000 to $2,499 | 30 (2.1%) | 0 (0.0%) |
| $2,500 to $2,999 | 16 (1.1%) | 0 (0.0%) |
| $3,000 or more | 51 (3.6%) | 0 (0.0%) |
| Total | 1,425 (100.0%) | 2,442 (100.0%) |
Physical Housing Characteristics in Benton Harbor
Housing Structures in Benton Harbor
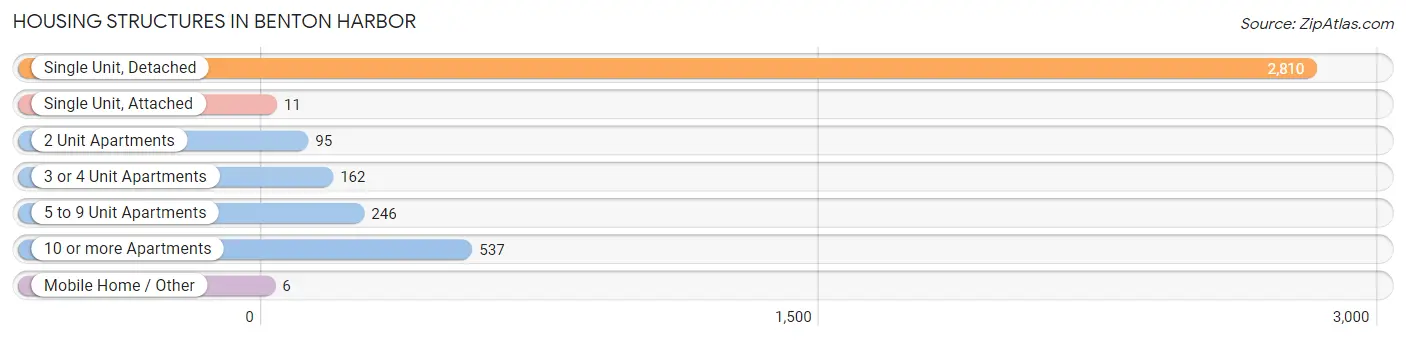
| Structure Type | # Housing Units | % Housing Units |
| Single Unit, Detached | 2,810 | 72.7% |
| Single Unit, Attached | 11 | 0.3% |
| 2 Unit Apartments | 95 | 2.5% |
| 3 or 4 Unit Apartments | 162 | 4.2% |
| 5 to 9 Unit Apartments | 246 | 6.4% |
| 10 or more Apartments | 537 | 13.9% |
| Mobile Home / Other | 6 | 0.2% |
| Total | 3,867 | 100.0% |
Housing Structures by Occupancy in Benton Harbor
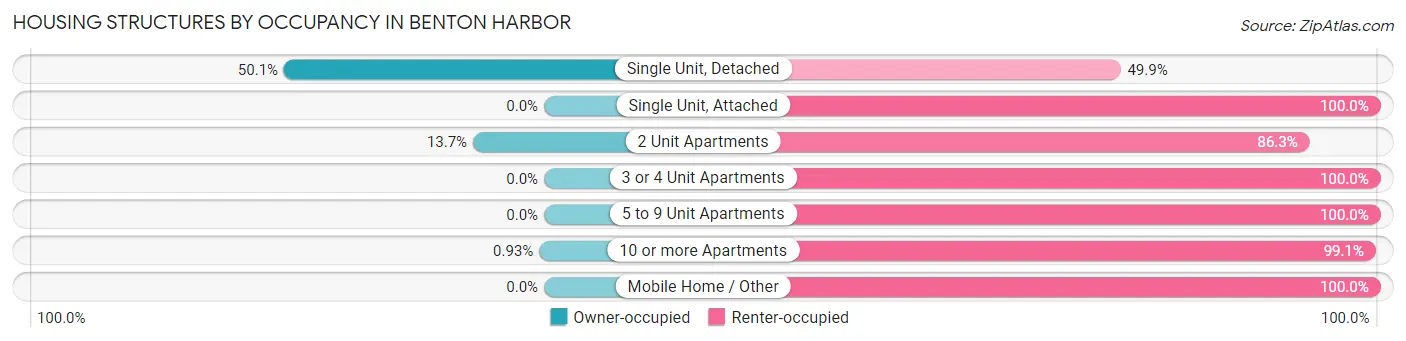
| Structure Type | Owner-occupied | Renter-occupied |
| Single Unit, Detached | 1,407 (50.1%) | 1,403 (49.9%) |
| Single Unit, Attached | 0 (0.0%) | 11 (100.0%) |
| 2 Unit Apartments | 13 (13.7%) | 82 (86.3%) |
| 3 or 4 Unit Apartments | 0 (0.0%) | 162 (100.0%) |
| 5 to 9 Unit Apartments | 0 (0.0%) | 246 (100.0%) |
| 10 or more Apartments | 5 (0.9%) | 532 (99.1%) |
| Mobile Home / Other | 0 (0.0%) | 6 (100.0%) |
| Total | 1,425 (36.8%) | 2,442 (63.1%) |
Housing Structures by Number of Rooms in Benton Harbor
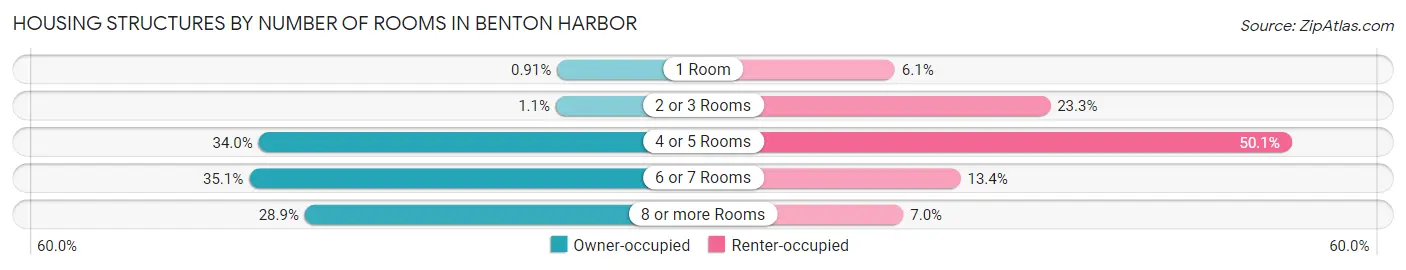
| Number of Rooms | Owner-occupied | Renter-occupied |
| 1 Room | 13 (0.9%) | 149 (6.1%) |
| 2 or 3 Rooms | 15 (1.1%) | 570 (23.3%) |
| 4 or 5 Rooms | 485 (34.0%) | 1,224 (50.1%) |
| 6 or 7 Rooms | 500 (35.1%) | 327 (13.4%) |
| 8 or more Rooms | 412 (28.9%) | 172 (7.0%) |
| Total | 1,425 (100.0%) | 2,442 (100.0%) |
Housing Structure by Heating Type in Benton Harbor
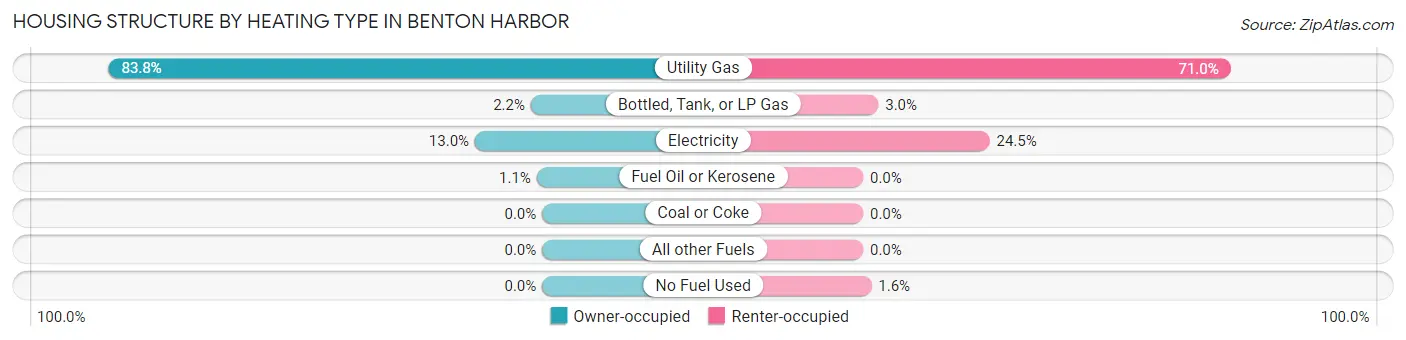
| Heating Type | Owner-occupied | Renter-occupied |
| Utility Gas | 1,194 (83.8%) | 1,734 (71.0%) |
| Bottled, Tank, or LP Gas | 31 (2.2%) | 72 (2.9%) |
| Electricity | 185 (13.0%) | 597 (24.4%) |
| Fuel Oil or Kerosene | 15 (1.1%) | 0 (0.0%) |
| Coal or Coke | 0 (0.0%) | 0 (0.0%) |
| All other Fuels | 0 (0.0%) | 0 (0.0%) |
| No Fuel Used | 0 (0.0%) | 39 (1.6%) |
| Total | 1,425 (100.0%) | 2,442 (100.0%) |
Household Vehicle Usage in Benton Harbor
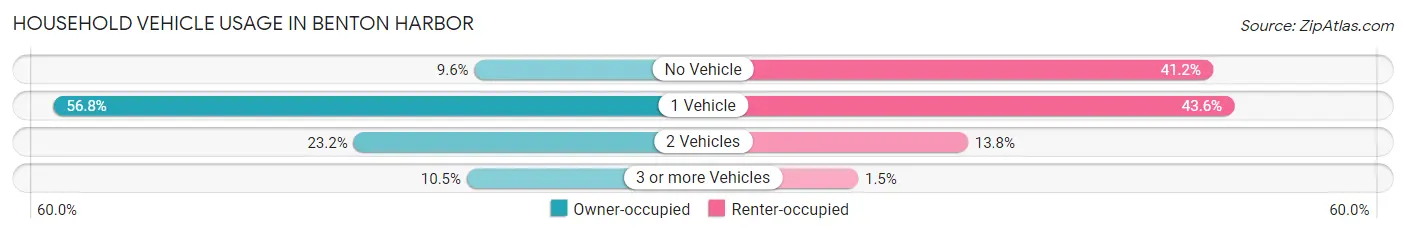
| Vehicles per Household | Owner-occupied | Renter-occupied |
| No Vehicle | 137 (9.6%) | 1,006 (41.2%) |
| 1 Vehicle | 809 (56.8%) | 1,064 (43.6%) |
| 2 Vehicles | 330 (23.2%) | 336 (13.8%) |
| 3 or more Vehicles | 149 (10.5%) | 36 (1.5%) |
| Total | 1,425 (100.0%) | 2,442 (100.0%) |
Real Estate & Mortgages in Benton Harbor
Real Estate and Mortgage Overview in Benton Harbor
| Characteristic | Without Mortgage | With Mortgage |
| Housing Units | 595 | 830 |
| Median Property Value | $51,000 | $70,500 |
| Median Household Income | $38,542 | $137 |
| Monthly Housing Costs | $364 | $51 |
| Real Estate Taxes | $770 | $8 |
Property Value by Mortgage Status in Benton Harbor
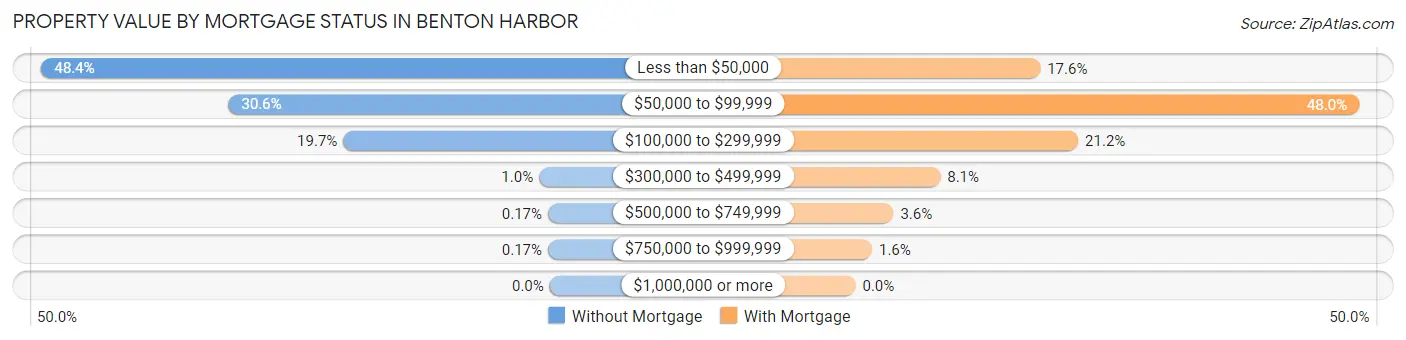
| Property Value | Without Mortgage | With Mortgage |
| Less than $50,000 | 288 (48.4%) | 146 (17.6%) |
| $50,000 to $99,999 | 182 (30.6%) | 398 (47.9%) |
| $100,000 to $299,999 | 117 (19.7%) | 176 (21.2%) |
| $300,000 to $499,999 | 6 (1.0%) | 67 (8.1%) |
| $500,000 to $749,999 | 1 (0.2%) | 30 (3.6%) |
| $750,000 to $999,999 | 1 (0.2%) | 13 (1.6%) |
| $1,000,000 or more | 0 (0.0%) | 0 (0.0%) |
| Total | 595 (100.0%) | 830 (100.0%) |
Household Income by Mortgage Status in Benton Harbor
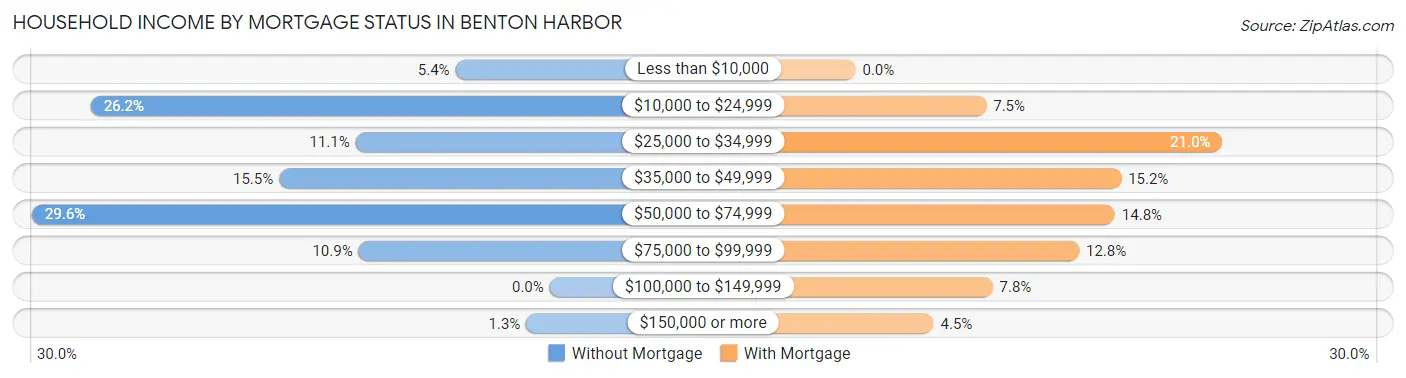
| Household Income | Without Mortgage | With Mortgage |
| Less than $10,000 | 32 (5.4%) | 0 (0.0%) |
| $10,000 to $24,999 | 156 (26.2%) | 62 (7.5%) |
| $25,000 to $34,999 | 66 (11.1%) | 174 (21.0%) |
| $35,000 to $49,999 | 92 (15.5%) | 126 (15.2%) |
| $50,000 to $74,999 | 176 (29.6%) | 123 (14.8%) |
| $75,000 to $99,999 | 65 (10.9%) | 106 (12.8%) |
| $100,000 to $149,999 | 0 (0.0%) | 65 (7.8%) |
| $150,000 or more | 8 (1.3%) | 37 (4.5%) |
| Total | 595 (100.0%) | 830 (100.0%) |
Property Value to Household Income Ratio in Benton Harbor
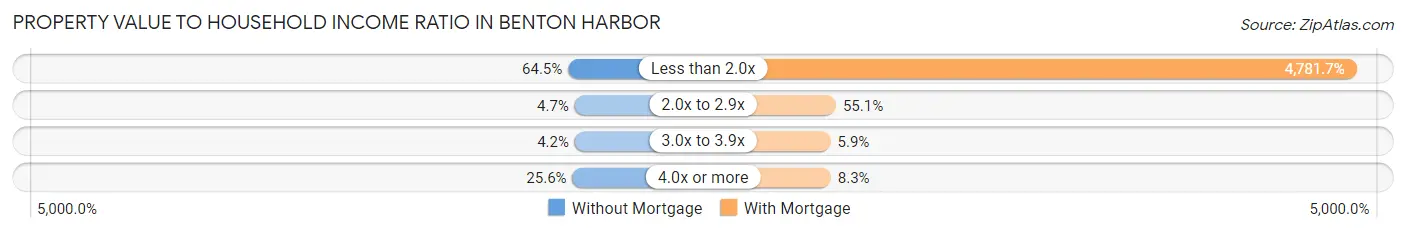
| Value-to-Income Ratio | Without Mortgage | With Mortgage |
| Less than 2.0x | 384 (64.5%) | 39,688 (4,781.7%) |
| 2.0x to 2.9x | 28 (4.7%) | 457 (55.1%) |
| 3.0x to 3.9x | 25 (4.2%) | 49 (5.9%) |
| 4.0x or more | 152 (25.6%) | 69 (8.3%) |
| Total | 595 (100.0%) | 830 (100.0%) |
Real Estate Taxes by Mortgage Status in Benton Harbor
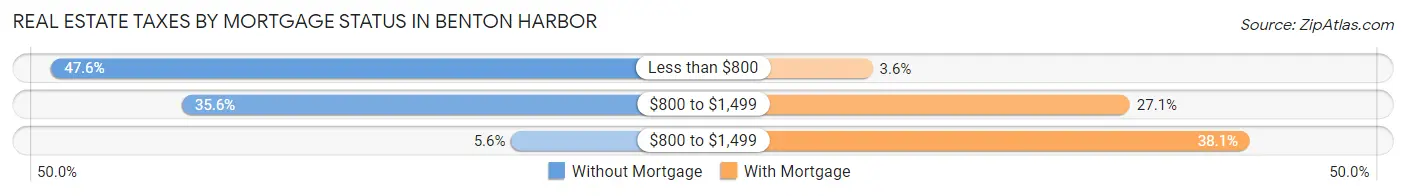
| Property Taxes | Without Mortgage | With Mortgage |
| Less than $800 | 283 (47.6%) | 30 (3.6%) |
| $800 to $1,499 | 212 (35.6%) | 225 (27.1%) |
| $800 to $1,499 | 33 (5.6%) | 316 (38.1%) |
| Total | 595 (100.0%) | 830 (100.0%) |
Health & Disability in Benton Harbor
Health Insurance Coverage by Age in Benton Harbor
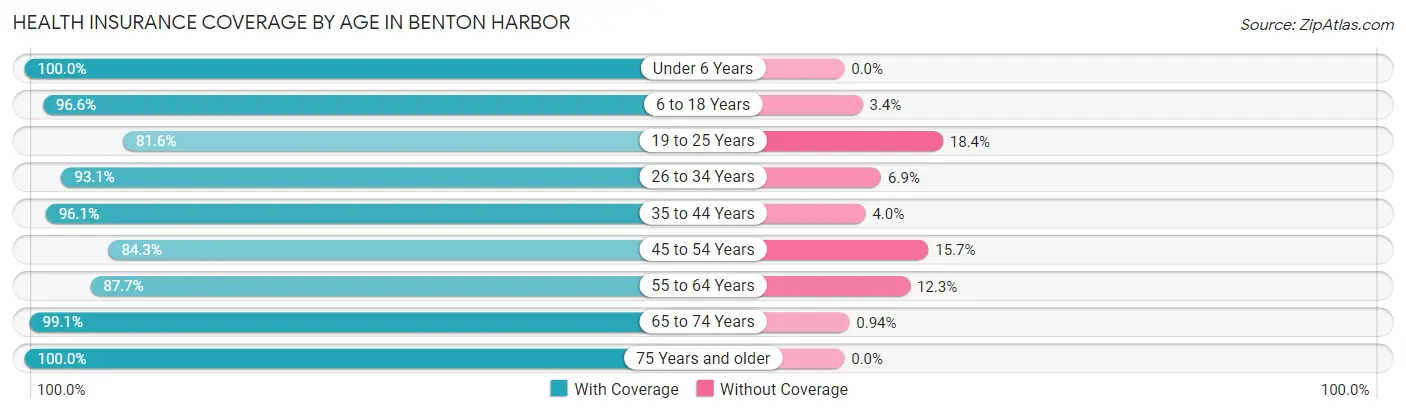
| Age Bracket | With Coverage | Without Coverage |
| Under 6 Years | 715 (100.0%) | 0 (0.0%) |
| 6 to 18 Years | 1,961 (96.6%) | 69 (3.4%) |
| 19 to 25 Years | 706 (81.6%) | 159 (18.4%) |
| 26 to 34 Years | 963 (93.1%) | 71 (6.9%) |
| 35 to 44 Years | 1,265 (96.1%) | 52 (4.0%) |
| 45 to 54 Years | 1,045 (84.3%) | 194 (15.7%) |
| 55 to 64 Years | 880 (87.7%) | 123 (12.3%) |
| 65 to 74 Years | 526 (99.1%) | 5 (0.9%) |
| 75 Years and older | 302 (100.0%) | 0 (0.0%) |
| Total | 8,363 (92.5%) | 673 (7.4%) |
Health Insurance Coverage by Citizenship Status in Benton Harbor
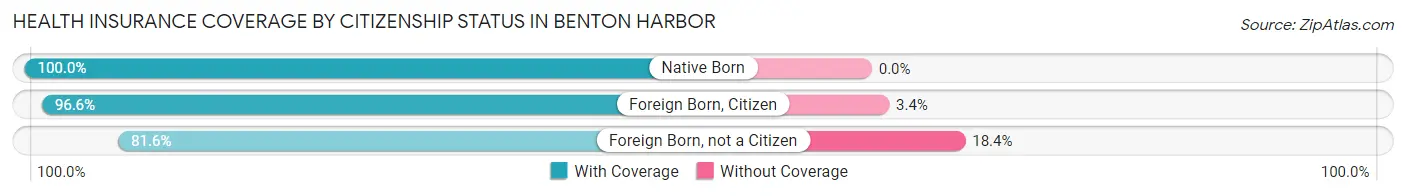
| Citizenship Status | With Coverage | Without Coverage |
| Native Born | 715 (100.0%) | 0 (0.0%) |
| Foreign Born, Citizen | 1,961 (96.6%) | 69 (3.4%) |
| Foreign Born, not a Citizen | 706 (81.6%) | 159 (18.4%) |
Health Insurance Coverage by Household Income in Benton Harbor
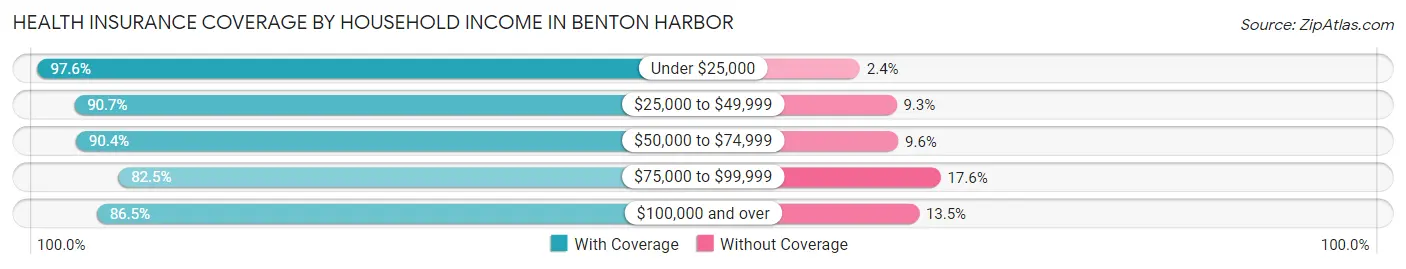
| Household Income | With Coverage | Without Coverage |
| Under $25,000 | 3,641 (97.6%) | 91 (2.4%) |
| $25,000 to $49,999 | 2,311 (90.7%) | 237 (9.3%) |
| $50,000 to $74,999 | 986 (90.4%) | 105 (9.6%) |
| $75,000 to $99,999 | 484 (82.5%) | 103 (17.5%) |
| $100,000 and over | 876 (86.5%) | 137 (13.5%) |
Public vs Private Health Insurance Coverage by Age in Benton Harbor
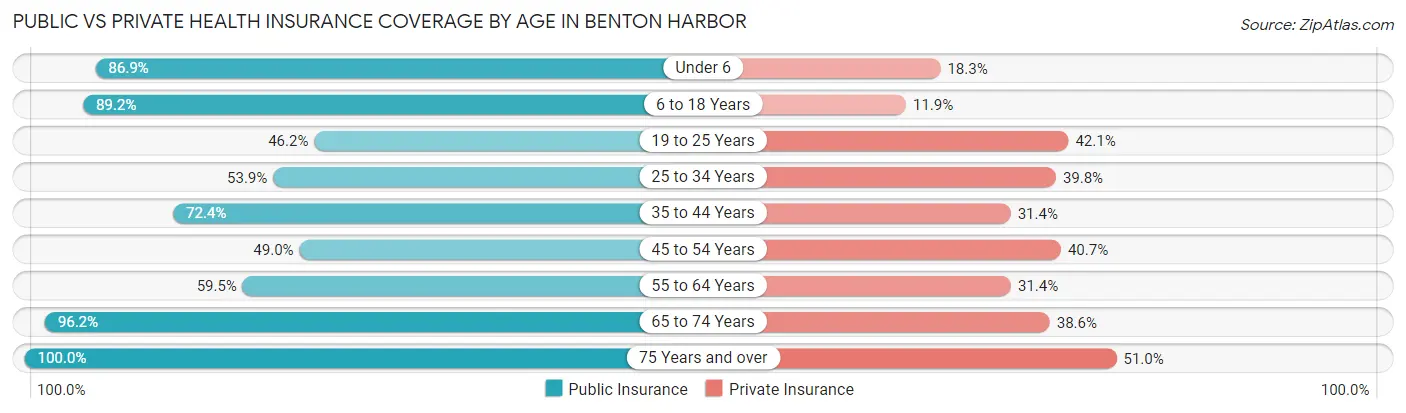
| Age Bracket | Public Insurance | Private Insurance |
| Under 6 | 621 (86.9%) | 131 (18.3%) |
| 6 to 18 Years | 1,810 (89.2%) | 242 (11.9%) |
| 19 to 25 Years | 400 (46.2%) | 364 (42.1%) |
| 25 to 34 Years | 557 (53.9%) | 411 (39.8%) |
| 35 to 44 Years | 954 (72.4%) | 413 (31.4%) |
| 45 to 54 Years | 607 (49.0%) | 504 (40.7%) |
| 55 to 64 Years | 597 (59.5%) | 315 (31.4%) |
| 65 to 74 Years | 511 (96.2%) | 205 (38.6%) |
| 75 Years and over | 302 (100.0%) | 154 (51.0%) |
| Total | 6,359 (70.4%) | 2,739 (30.3%) |
Disability Status by Sex by Age in Benton Harbor
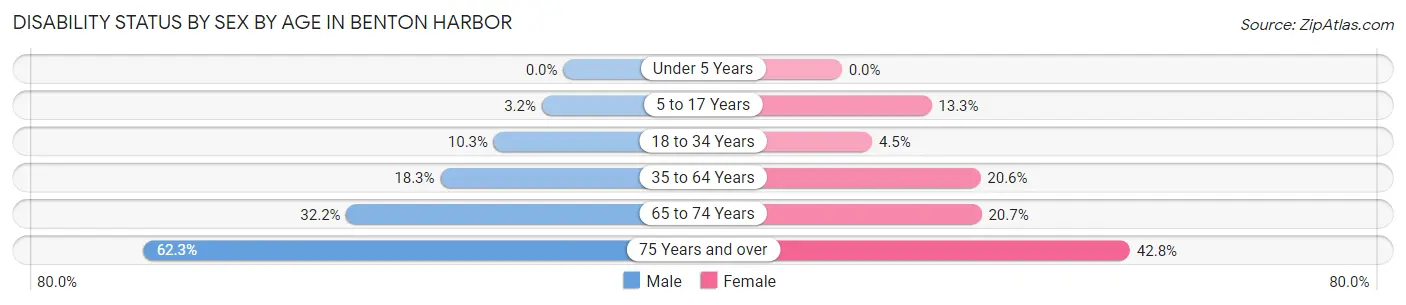
| Age Bracket | Male | Female |
| Under 5 Years | 0 (0.0%) | 0 (0.0%) |
| 5 to 17 Years | 34 (3.2%) | 120 (13.3%) |
| 18 to 34 Years | 94 (10.3%) | 52 (4.5%) |
| 35 to 64 Years | 280 (18.3%) | 417 (20.6%) |
| 65 to 74 Years | 67 (32.2%) | 67 (20.7%) |
| 75 Years and over | 76 (62.3%) | 77 (42.8%) |
Disability Class by Sex by Age in Benton Harbor
Disability Class: Hearing Difficulty
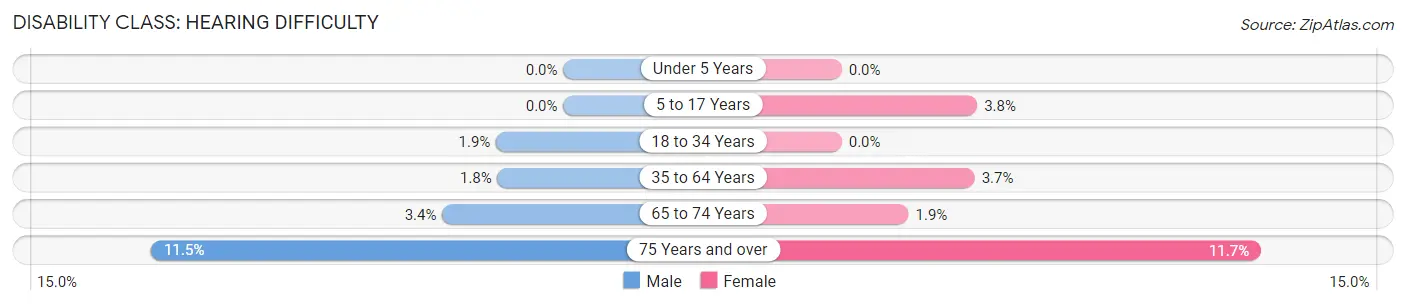
| Age Bracket | Male | Female |
| Under 5 Years | 0 (0.0%) | 0 (0.0%) |
| 5 to 17 Years | 0 (0.0%) | 34 (3.8%) |
| 18 to 34 Years | 17 (1.9%) | 0 (0.0%) |
| 35 to 64 Years | 28 (1.8%) | 75 (3.7%) |
| 65 to 74 Years | 7 (3.4%) | 6 (1.9%) |
| 75 Years and over | 14 (11.5%) | 21 (11.7%) |
Disability Class: Vision Difficulty
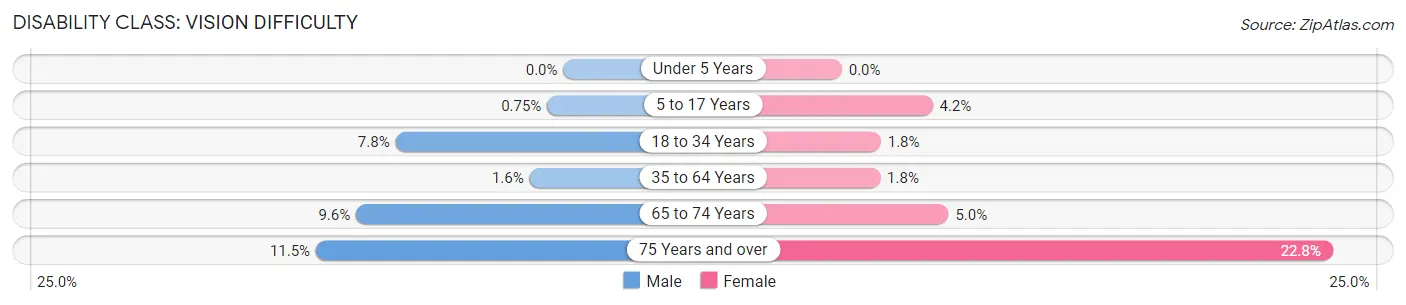
| Age Bracket | Male | Female |
| Under 5 Years | 0 (0.0%) | 0 (0.0%) |
| 5 to 17 Years | 8 (0.7%) | 38 (4.2%) |
| 18 to 34 Years | 71 (7.8%) | 21 (1.8%) |
| 35 to 64 Years | 24 (1.6%) | 36 (1.8%) |
| 65 to 74 Years | 20 (9.6%) | 16 (5.0%) |
| 75 Years and over | 14 (11.5%) | 41 (22.8%) |
Disability Class: Cognitive Difficulty
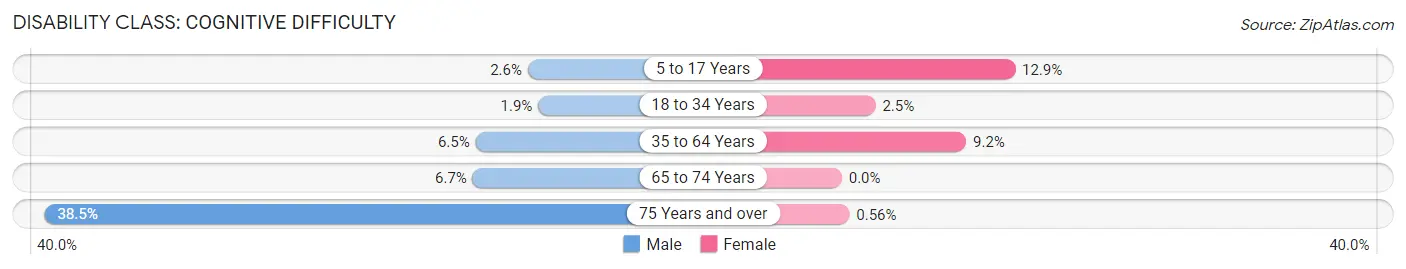
| Age Bracket | Male | Female |
| 5 to 17 Years | 28 (2.6%) | 116 (12.9%) |
| 18 to 34 Years | 17 (1.9%) | 29 (2.5%) |
| 35 to 64 Years | 100 (6.5%) | 187 (9.2%) |
| 65 to 74 Years | 14 (6.7%) | 0 (0.0%) |
| 75 Years and over | 47 (38.5%) | 1 (0.6%) |
Disability Class: Ambulatory Difficulty
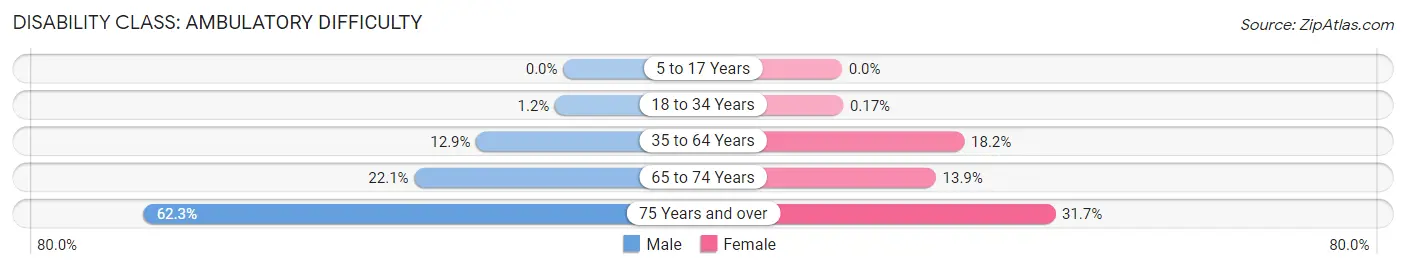
| Age Bracket | Male | Female |
| 5 to 17 Years | 0 (0.0%) | 0 (0.0%) |
| 18 to 34 Years | 11 (1.2%) | 2 (0.2%) |
| 35 to 64 Years | 198 (12.9%) | 368 (18.2%) |
| 65 to 74 Years | 46 (22.1%) | 45 (13.9%) |
| 75 Years and over | 76 (62.3%) | 57 (31.7%) |
Disability Class: Self-Care Difficulty
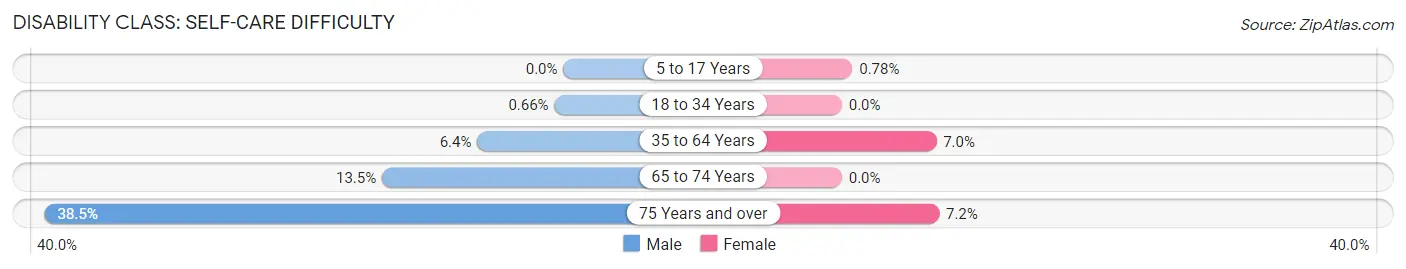
| Age Bracket | Male | Female |
| 5 to 17 Years | 0 (0.0%) | 7 (0.8%) |
| 18 to 34 Years | 6 (0.7%) | 0 (0.0%) |
| 35 to 64 Years | 98 (6.4%) | 142 (7.0%) |
| 65 to 74 Years | 28 (13.5%) | 0 (0.0%) |
| 75 Years and over | 47 (38.5%) | 13 (7.2%) |
Technology Access in Benton Harbor
Computing Device Access in Benton Harbor
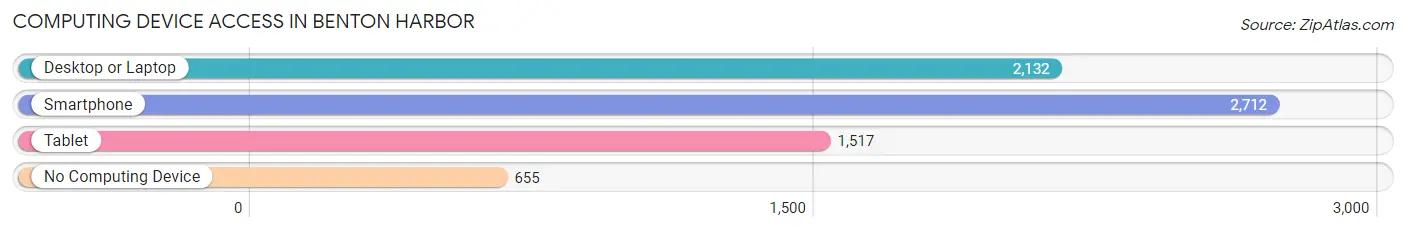
| Device Type | # Households | % Households |
| Desktop or Laptop | 2,132 | 55.1% |
| Smartphone | 2,712 | 70.1% |
| Tablet | 1,517 | 39.2% |
| No Computing Device | 655 | 16.9% |
| Total | 3,867 | 100.0% |
Internet Access in Benton Harbor
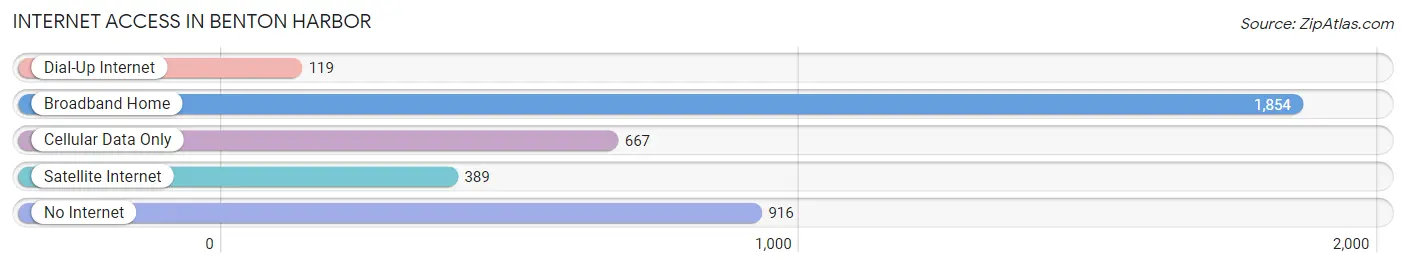
| Internet Type | # Households | % Households |
| Dial-Up Internet | 119 | 3.1% |
| Broadband Home | 1,854 | 47.9% |
| Cellular Data Only | 667 | 17.2% |
| Satellite Internet | 389 | 10.1% |
| No Internet | 916 | 23.7% |
| Total | 3,867 | 100.0% |
Benton Harbor Summary
Benton Harbor is a city located in Berrien County, Michigan, United States. It is situated on the eastern shore of Lake Michigan, at the mouth of the St. Joseph River. The city is located about 10 miles east of St. Joseph, Michigan, and about 25 miles north of South Bend, Indiana. As of the 2010 census, the city had a population of 10,038.
History
The area that is now Benton Harbor was originally inhabited by the Potawatomi Native Americans. The first permanent settlement in the area was established in 1829 by Henry C. Morton, who built a log cabin near the mouth of the St. Joseph River. The settlement was named after Morton's friend, Thomas Hart Benton, a United States Senator from Missouri.
In 1831, the settlement was platted and incorporated as the village of Benton Harbor. The village grew slowly, and by the mid-19th century, it had become a popular summer resort for wealthy Chicagoans. In 1891, the village was incorporated as a city.
In the early 20th century, Benton Harbor became a major industrial center, with several factories producing a variety of products, including automobiles, furniture, and appliances. The city's economy was further bolstered by the opening of the Benton Harbor-St. Joseph Bridge in 1921, which connected the city to St. Joseph, Michigan.
Geography
Benton Harbor is located at 42°07'N 86°25'W (42.1167, -86.4167). According to the United States Census Bureau, the city has a total area of 5.2 square miles (13.4 km2), of which 4.9 square miles (12.7 km2) is land and 0.3 square miles (0.7 km2) is water.
The city is situated on the eastern shore of Lake Michigan, at the mouth of the St. Joseph River. The city is located about 10 miles east of St. Joseph, Michigan, and about 25 miles north of South Bend, Indiana.
Economy
Benton Harbor's economy is largely based on manufacturing and tourism. The city is home to several factories, including Whirlpool Corporation, which produces a variety of appliances, and Benton Harbor Foundry, which produces castings for the automotive industry. The city is also home to several tourist attractions, including the Jean Klock Park, which features a beach and a lighthouse, and the nearby Silver Beach Amusement Park.
Demographics
As of the 2010 census, there were 10,038 people, 3,945 households, and 2,541 families residing in the city. The population density was 2,053.2 people per square mile (793.2/km2). There were 4,521 housing units at an average density of 919.2 per square mile (354.3/km2). The racial makeup of the city was 57.2% African American, 37.2% White, 0.4% Native American, 0.7% Asian, 0.1% Pacific Islander, 1.7% from other races, and 2.7% from two or more races. Hispanic or Latino of any race were 4.2% of the population.
There were 3,945 households, out of which 33.2% had children under the age of 18 living with them, 28.2% were married couples living together, 30.2% had a female householder with no husband present, and 33.7% were non-families. 28.2% of all households were made up of individuals, and 10.2% had someone living alone who was 65 years of age or older. The average household size was 2.53 and the average family size was 3.09.
In the city, the population was spread out, with 28.7% under the age of 18, 10.2% from 18 to 24, 27.2% from 25 to 44, 22.2% from 45 to 64, and 11.7% who were 65 years of age or older. The median age was 33 years. For every 100 females, there were 87.2 males. For every 100 females age 18 and over, there were 81.3 males.
The median income for a household in the city was $25,917, and the median income for a family was $30,917. Males had a median income of $30,917 versus $21,917 for females. The per capita income for the city was $13,917. About 24.2% of families and 28.7% of the population were below the poverty line, including 40.7% of those under age 18 and 16.7% of those age 65 or over.
Common Questions
What is Per Capita Income in Benton Harbor?
Per Capita income in Benton Harbor is $18,393.
What is the Median Family Income in Benton Harbor?
Median Family Income in Benton Harbor is $27,000.
What is the Median Household income in Benton Harbor?
Median Household Income in Benton Harbor is $26,592.
What is Income or Wage Gap in Benton Harbor?
Income or Wage Gap in Benton Harbor is 37.9%.
Women in Benton Harbor earn 62.1 cents for every dollar earned by a man.
What is Inequality or Gini Index in Benton Harbor?
Inequality or Gini Index in Benton Harbor is 0.53.
What is the Total Population of Benton Harbor?
Total Population of Benton Harbor is 9,101.
What is the Total Male Population of Benton Harbor?
Total Male Population of Benton Harbor is 4,224.
What is the Total Female Population of Benton Harbor?
Total Female Population of Benton Harbor is 4,877.
What is the Ratio of Males per 100 Females in Benton Harbor?
There are 86.61 Males per 100 Females in Benton Harbor.
What is the Ratio of Females per 100 Males in Benton Harbor?
There are 115.46 Females per 100 Males in Benton Harbor.
What is the Median Population Age in Benton Harbor?
Median Population Age in Benton Harbor is 33.6 Years.
What is the Average Family Size in Benton Harbor
Average Family Size in Benton Harbor is 2.8 People.
What is the Average Household Size in Benton Harbor
Average Household Size in Benton Harbor is 2.3 People.
How Large is the Labor Force in Benton Harbor?
There are 4,345 People in the Labor Forcein in Benton Harbor.
What is the Percentage of People in the Labor Force in Benton Harbor?
63.3% of People are in the Labor Force in Benton Harbor.
What is the Unemployment Rate in Benton Harbor?
Unemployment Rate in Benton Harbor is 20.2%.