Parchment, MI Map & Demographics
Parchment Map
Parchment Overview
$32,991
PER CAPITA INCOME
$60,938
AVG FAMILY INCOME
$60,223
AVG HOUSEHOLD INCOME
28.4%
WAGE / INCOME GAP [ % ]
71.6¢/ $1
WAGE / INCOME GAP [ $ ]
0.39
INEQUALITY / GINI INDEX
2,041
TOTAL POPULATION
955
MALE POPULATION
1,086
FEMALE POPULATION
87.94
MALES / 100 FEMALES
113.72
FEMALES / 100 MALES
31.0
MEDIAN AGE
2.7
AVG FAMILY SIZE
2.3
AVG HOUSEHOLD SIZE
1,194
LABOR FORCE [ PEOPLE ]
71.0%
PERCENT IN LABOR FORCE
8.4%
UNEMPLOYMENT RATE
Parchment Area Codes
Income in Parchment
Income Overview in Parchment
Per Capita Income in Parchment is $32,991, while median incomes of families and households are $60,938 and $60,223 respectively.
| Characteristic | Number | Measure |
| Per Capita Income | 2,041 | $32,991 |
| Median Family Income | 517 | $60,938 |
| Mean Family Income | 517 | $83,320 |
| Median Household Income | 879 | $60,223 |
| Mean Household Income | 879 | $75,766 |
| Income Deficit | 517 | $0 |
| Wage / Income Gap (%) | 2,041 | 28.44% |
| Wage / Income Gap ($) | 2,041 | 71.56¢ per $1 |
| Gini / Inequality Index | 2,041 | 0.39 |
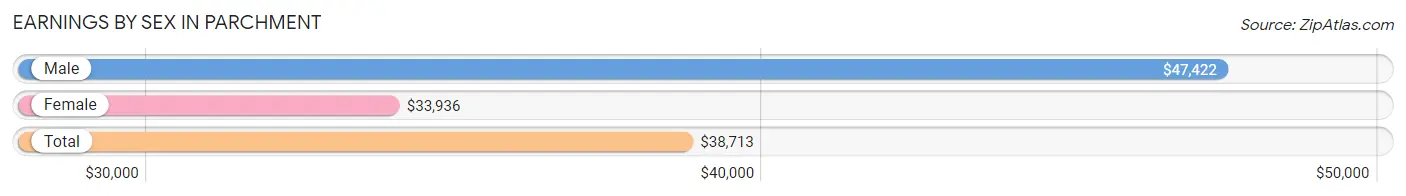
Earnings by Sex in Parchment
Average Earnings in Parchment are $38,713, $47,422 for men and $33,936 for women, a difference of 28.4%.
| Sex | Number | Average Earnings |
| Male | 577 (47.4%) | $47,422 |
| Female | 640 (52.6%) | $33,936 |
| Total | 1,217 (100.0%) | $38,713 |
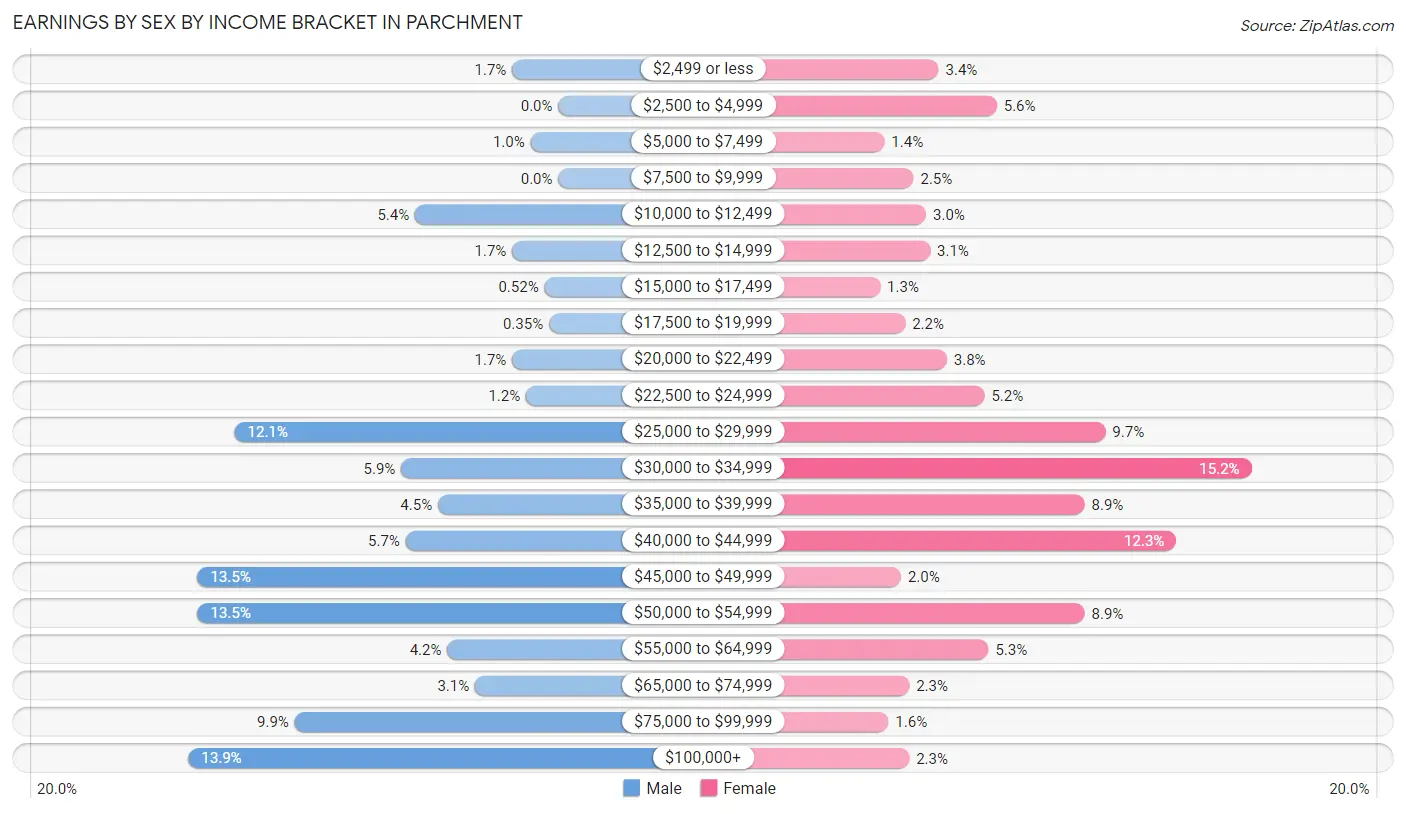
Earnings by Sex by Income Bracket in Parchment
The most common earnings brackets in Parchment are $100,000+ for men (80 | 13.9%) and $30,000 to $34,999 for women (97 | 15.2%).
| Income | Male | Female |
| $2,499 or less | 10 (1.7%) | 22 (3.4%) |
| $2,500 to $4,999 | 0 (0.0%) | 36 (5.6%) |
| $5,000 to $7,499 | 6 (1.0%) | 9 (1.4%) |
| $7,500 to $9,999 | 0 (0.0%) | 16 (2.5%) |
| $10,000 to $12,499 | 31 (5.4%) | 19 (3.0%) |
| $12,500 to $14,999 | 10 (1.7%) | 20 (3.1%) |
| $15,000 to $17,499 | 3 (0.5%) | 8 (1.3%) |
| $17,500 to $19,999 | 2 (0.4%) | 14 (2.2%) |
| $20,000 to $22,499 | 10 (1.7%) | 24 (3.7%) |
| $22,500 to $24,999 | 7 (1.2%) | 33 (5.2%) |
| $25,000 to $29,999 | 70 (12.1%) | 62 (9.7%) |
| $30,000 to $34,999 | 34 (5.9%) | 97 (15.2%) |
| $35,000 to $39,999 | 26 (4.5%) | 57 (8.9%) |
| $40,000 to $44,999 | 33 (5.7%) | 79 (12.3%) |
| $45,000 to $49,999 | 78 (13.5%) | 13 (2.0%) |
| $50,000 to $54,999 | 78 (13.5%) | 57 (8.9%) |
| $55,000 to $64,999 | 24 (4.2%) | 34 (5.3%) |
| $65,000 to $74,999 | 18 (3.1%) | 15 (2.3%) |
| $75,000 to $99,999 | 57 (9.9%) | 10 (1.6%) |
| $100,000+ | 80 (13.9%) | 15 (2.3%) |
| Total | 577 (100.0%) | 640 (100.0%) |
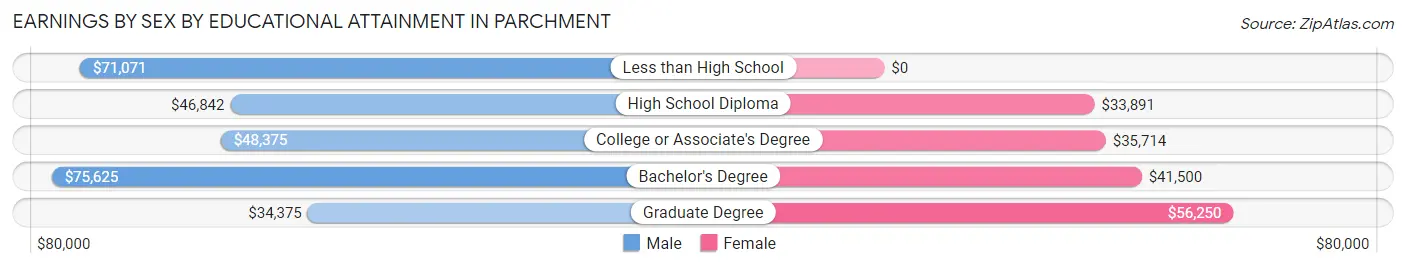
Earnings by Sex by Educational Attainment in Parchment
Average earnings in Parchment are $49,833 for men and $35,069 for women, a difference of 29.6%. Men with an educational attainment of bachelor's degree enjoy the highest average annual earnings of $75,625, while those with graduate degree education earn the least with $34,375. Women with an educational attainment of graduate degree earn the most with the average annual earnings of $56,250, while those with high school diploma education have the smallest earnings of $33,891.
| Educational Attainment | Male Income | Female Income |
| Less than High School | $71,071 | $0 |
| High School Diploma | $46,842 | $33,891 |
| College or Associate's Degree | $48,375 | $35,714 |
| Bachelor's Degree | $75,625 | $41,500 |
| Graduate Degree | $34,375 | $56,250 |
| Total | $49,833 | $35,069 |
Family Income in Parchment
Family Income Brackets in Parchment
According to the Parchment family income data, there are 109 families falling into the $35,000 to $49,999 income range, which is the most common income bracket and makes up 21.1% of all families. Conversely, the $10,000 to $14,999 income bracket is the least frequent group with only 4 families (0.8%) belonging to this category.
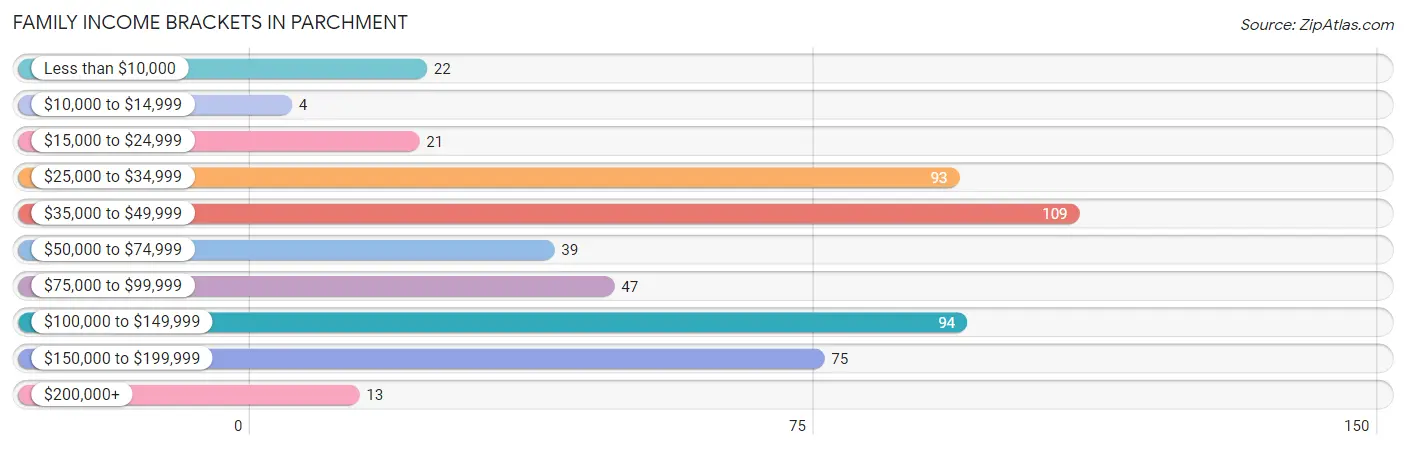
| Income Bracket | # Families | % Families |
| Less than $10,000 | 22 | 4.3% |
| $10,000 to $14,999 | 4 | 0.8% |
| $15,000 to $24,999 | 21 | 4.1% |
| $25,000 to $34,999 | 93 | 18.0% |
| $35,000 to $49,999 | 109 | 21.1% |
| $50,000 to $74,999 | 39 | 7.5% |
| $75,000 to $99,999 | 47 | 9.1% |
| $100,000 to $149,999 | 94 | 18.2% |
| $150,000 to $199,999 | 75 | 14.5% |
| $200,000+ | 13 | 2.5% |
Family Income by Famaliy Size in Parchment
3-person families (131 | 25.3%) account for the highest median family income in Parchment with $111,008 per family, while 3-person families (131 | 25.3%) have the highest median income of $37,003 per family member.
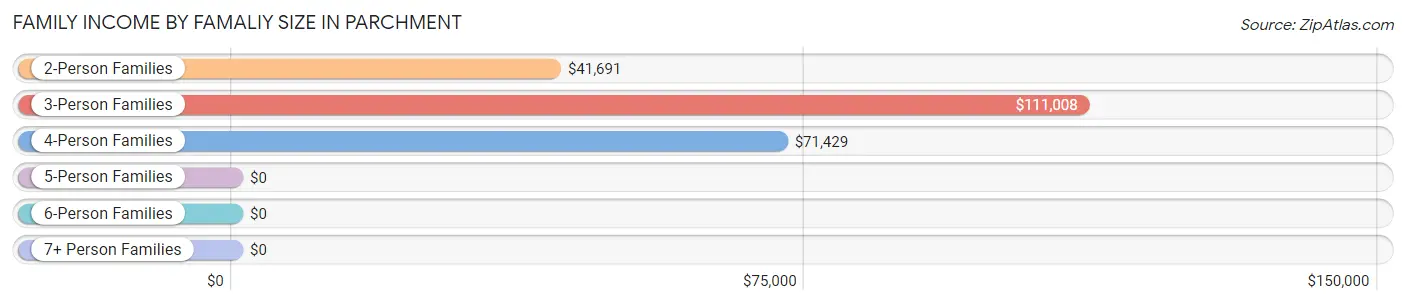
| Income Bracket | # Families | Median Income |
| 2-Person Families | 277 (53.6%) | $41,691 |
| 3-Person Families | 131 (25.3%) | $111,008 |
| 4-Person Families | 66 (12.8%) | $71,429 |
| 5-Person Families | 42 (8.1%) | $0 |
| 6-Person Families | 1 (0.2%) | $0 |
| 7+ Person Families | 0 (0.0%) | $0 |
| Total | 517 (100.0%) | $60,938 |
Family Income by Number of Earners in Parchment
The median family income in Parchment is $60,938, with families comprising 3+ earners (13) having the highest median family income of $154,250, while families with no earners (84) have the lowest median family income of $34,375, accounting for 2.5% and 16.3% of families, respectively.
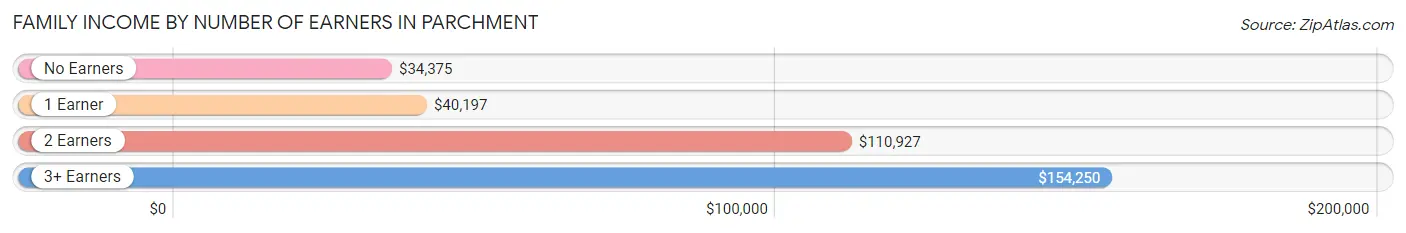
| Number of Earners | # Families | Median Income |
| No Earners | 84 (16.3%) | $34,375 |
| 1 Earner | 205 (39.7%) | $40,197 |
| 2 Earners | 215 (41.6%) | $110,927 |
| 3+ Earners | 13 (2.5%) | $154,250 |
| Total | 517 (100.0%) | $60,938 |
Household Income in Parchment
Household Income Brackets in Parchment
With 171 households falling in the category, the $50,000 to $74,999 income range is the most frequent in Parchment, accounting for 19.5% of all households. In contrast, only 17 households (1.9%) fall into the $10,000 to $14,999 income bracket, making it the least populous group.
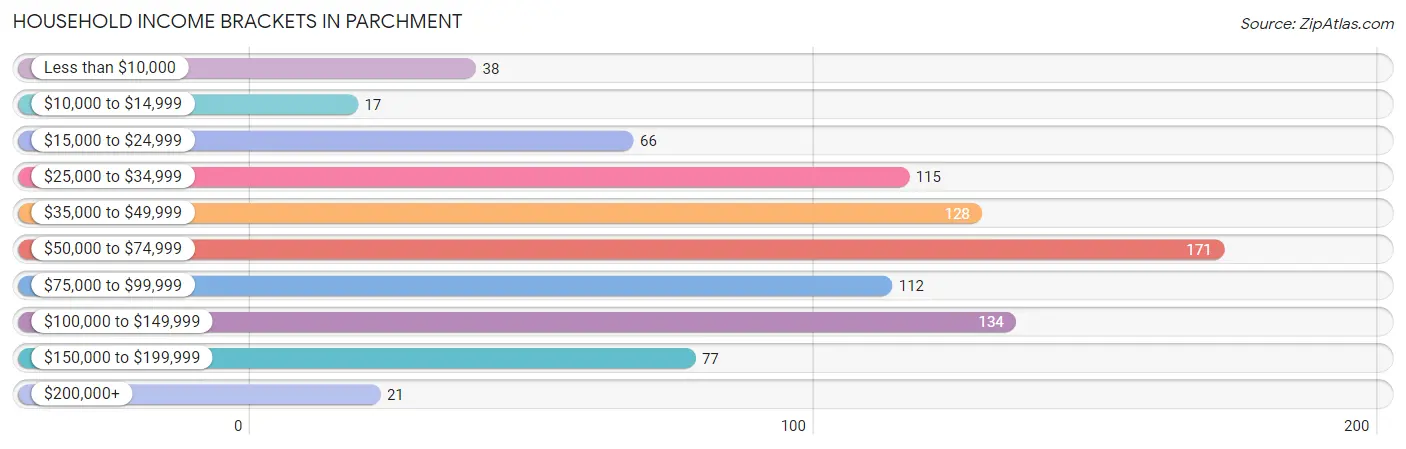
| Income Bracket | # Households | % Households |
| Less than $10,000 | 38 | 4.3% |
| $10,000 to $14,999 | 17 | 1.9% |
| $15,000 to $24,999 | 66 | 7.5% |
| $25,000 to $34,999 | 115 | 13.1% |
| $35,000 to $49,999 | 128 | 14.6% |
| $50,000 to $74,999 | 171 | 19.5% |
| $75,000 to $99,999 | 112 | 12.7% |
| $100,000 to $149,999 | 134 | 15.2% |
| $150,000 to $199,999 | 77 | 8.8% |
| $200,000+ | 21 | 2.4% |
Household Income by Householder Age in Parchment
The median household income in Parchment is $60,223, with the highest median household income of $71,136 found in the 25 to 44 years age bracket for the primary householder. A total of 458 households (52.1%) fall into this category. Meanwhile, the 45 to 64 years age bracket for the primary householder has the lowest median household income of $51,250, with 234 households (26.6%) in this group.
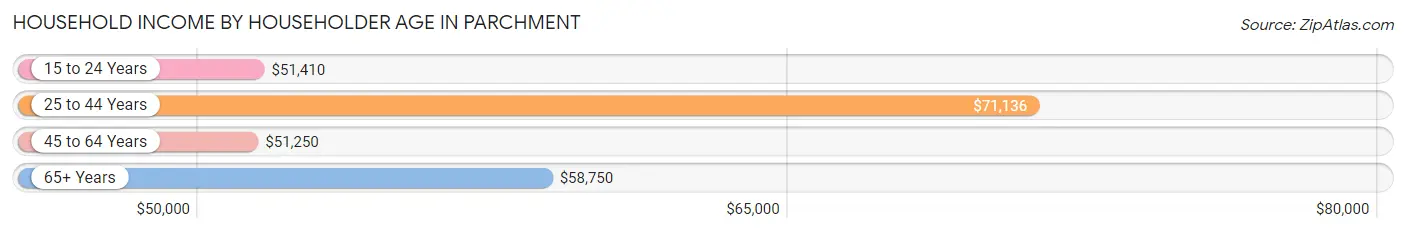
| Income Bracket | # Households | Median Income |
| 15 to 24 Years | 59 (6.7%) | $51,410 |
| 25 to 44 Years | 458 (52.1%) | $71,136 |
| 45 to 64 Years | 234 (26.6%) | $51,250 |
| 65+ Years | 128 (14.6%) | $58,750 |
| Total | 879 (100.0%) | $60,223 |
Poverty in Parchment
Income Below Poverty by Sex and Age in Parchment
With 9.4% poverty level for males and 12.4% for females among the residents of Parchment, 6 to 11 year old males and 5 year old females are the most vulnerable to poverty, with 10 males (47.6%) and 15 females (71.4%) in their respective age groups living below the poverty level.
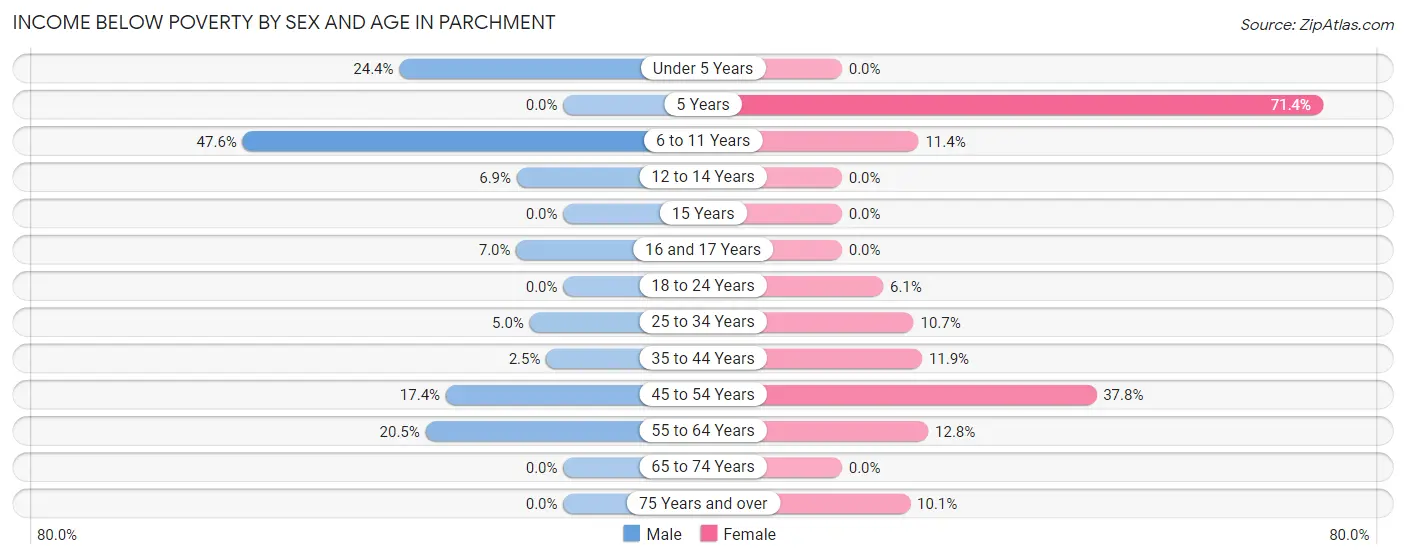
| Age Bracket | Male | Female |
| Under 5 Years | 28 (24.3%) | 0 (0.0%) |
| 5 Years | 0 (0.0%) | 15 (71.4%) |
| 6 to 11 Years | 10 (47.6%) | 9 (11.4%) |
| 12 to 14 Years | 2 (6.9%) | 0 (0.0%) |
| 15 Years | 0 (0.0%) | 0 (0.0%) |
| 16 and 17 Years | 3 (7.0%) | 0 (0.0%) |
| 18 to 24 Years | 0 (0.0%) | 9 (6.1%) |
| 25 to 34 Years | 10 (5.0%) | 31 (10.6%) |
| 35 to 44 Years | 4 (2.5%) | 15 (11.9%) |
| 45 to 54 Years | 15 (17.4%) | 34 (37.8%) |
| 55 to 64 Years | 18 (20.4%) | 15 (12.8%) |
| 65 to 74 Years | 0 (0.0%) | 0 (0.0%) |
| 75 Years and over | 0 (0.0%) | 7 (10.1%) |
| Total | 90 (9.4%) | 135 (12.4%) |
Income Above Poverty by Sex and Age in Parchment
According to the poverty statistics in Parchment, males aged 5 years and females aged under 5 years are the age groups that are most secure financially, with 100.0% of males and 100.0% of females in these age groups living above the poverty line.
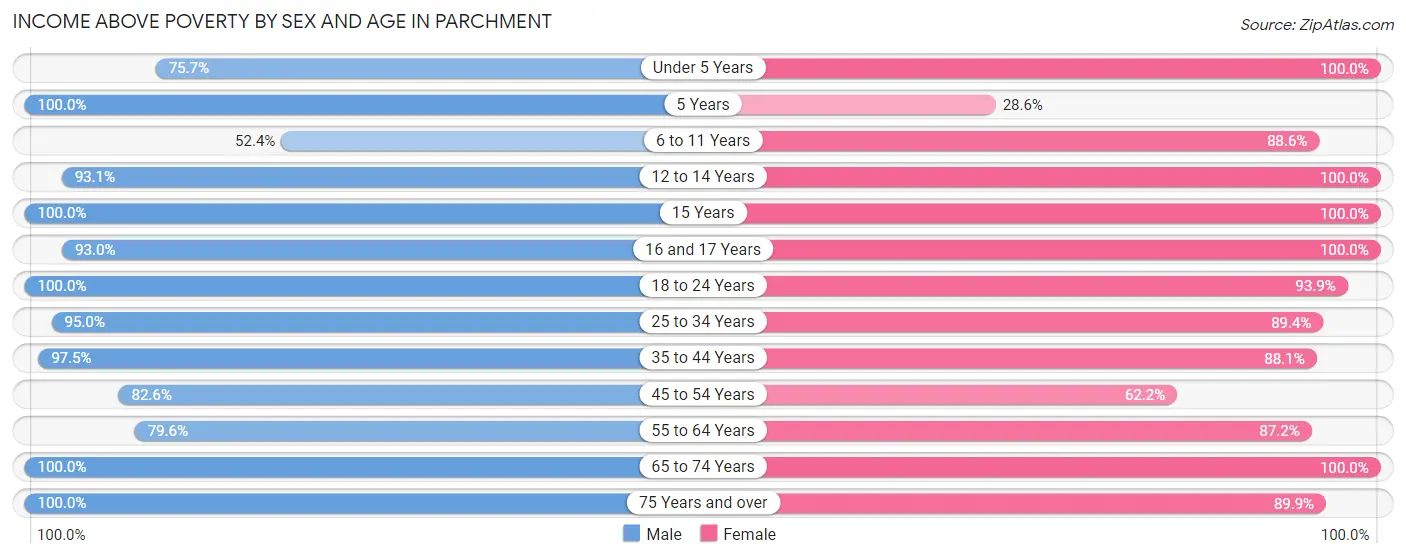
| Age Bracket | Male | Female |
| Under 5 Years | 87 (75.6%) | 13 (100.0%) |
| 5 Years | 14 (100.0%) | 6 (28.6%) |
| 6 to 11 Years | 11 (52.4%) | 70 (88.6%) |
| 12 to 14 Years | 27 (93.1%) | 45 (100.0%) |
| 15 Years | 2 (100.0%) | 20 (100.0%) |
| 16 and 17 Years | 40 (93.0%) | 8 (100.0%) |
| 18 to 24 Years | 109 (100.0%) | 138 (93.9%) |
| 25 to 34 Years | 190 (95.0%) | 260 (89.3%) |
| 35 to 44 Years | 154 (97.5%) | 111 (88.1%) |
| 45 to 54 Years | 71 (82.6%) | 56 (62.2%) |
| 55 to 64 Years | 70 (79.5%) | 102 (87.2%) |
| 65 to 74 Years | 49 (100.0%) | 60 (100.0%) |
| 75 Years and over | 41 (100.0%) | 62 (89.9%) |
| Total | 865 (90.6%) | 951 (87.6%) |
Income Below Poverty Among Married-Couple Families in Parchment
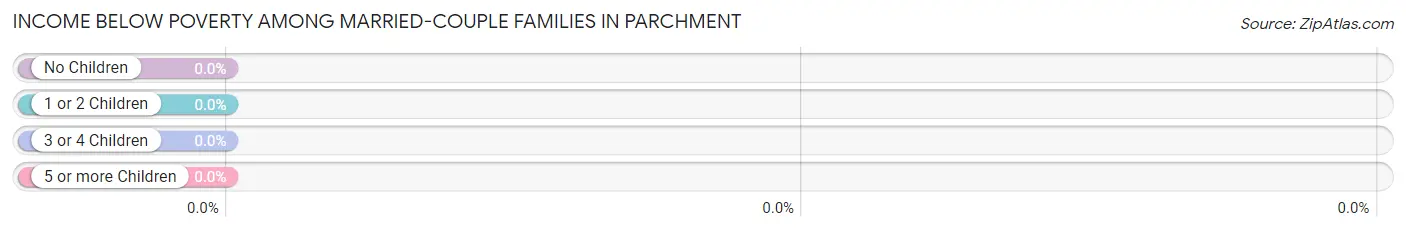
| Children | Above Poverty | Below Poverty |
| No Children | 156 (100.0%) | 0 (0.0%) |
| 1 or 2 Children | 138 (100.0%) | 0 (0.0%) |
| 3 or 4 Children | 8 (100.0%) | 0 (0.0%) |
| 5 or more Children | 0 (0.0%) | 0 (0.0%) |
| Total | 302 (100.0%) | 0 (0.0%) |
Income Below Poverty Among Single-Parent Households in Parchment
According to the poverty data in Parchment, 9.3% or 4 single-father households and 16.3% or 28 single-mother households are living below the poverty line. Among single-father households, those with 1 or 2 children have the highest poverty rate, with 4 households (100.0%) experiencing poverty. Likewise, among single-mother households, those with 3 or 4 children have the highest poverty rate, with 2 households (100.0%) falling below the poverty line.
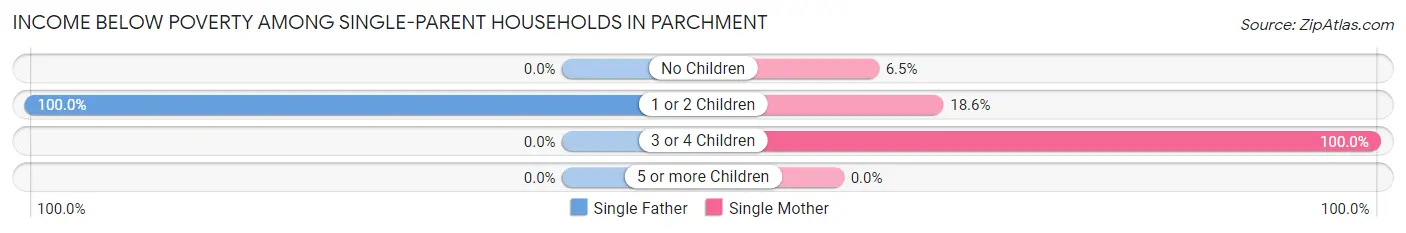
| Children | Single Father | Single Mother |
| No Children | 0 (0.0%) | 3 (6.5%) |
| 1 or 2 Children | 4 (100.0%) | 23 (18.5%) |
| 3 or 4 Children | 0 (0.0%) | 2 (100.0%) |
| 5 or more Children | 0 (0.0%) | 0 (0.0%) |
| Total | 4 (9.3%) | 28 (16.3%) |
Income Below Poverty Among Married-Couple vs Single-Parent Households in Parchment
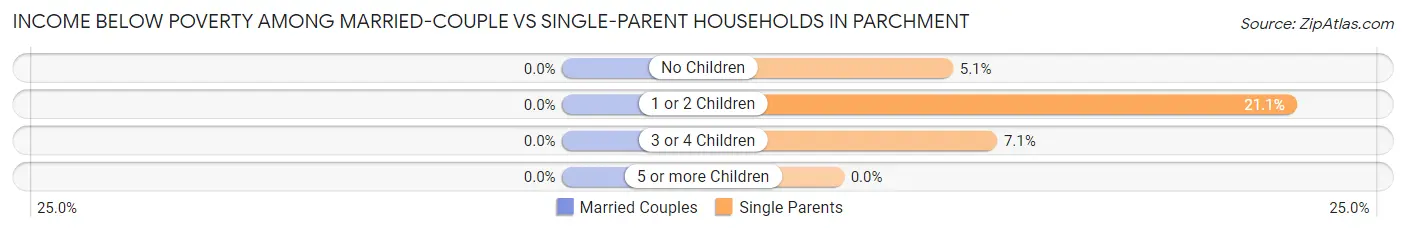
| Children | Married-Couple Families | Single-Parent Households |
| No Children | 0 (0.0%) | 3 (5.1%) |
| 1 or 2 Children | 0 (0.0%) | 27 (21.1%) |
| 3 or 4 Children | 0 (0.0%) | 2 (7.1%) |
| 5 or more Children | 0 (0.0%) | 0 (0.0%) |
| Total | 0 (0.0%) | 32 (14.9%) |
Race in Parchment
The most populous races in Parchment are White / Caucasian (1,491 | 73.1%), Black / African American (227 | 11.1%), and Two or more Races (219 | 10.7%).
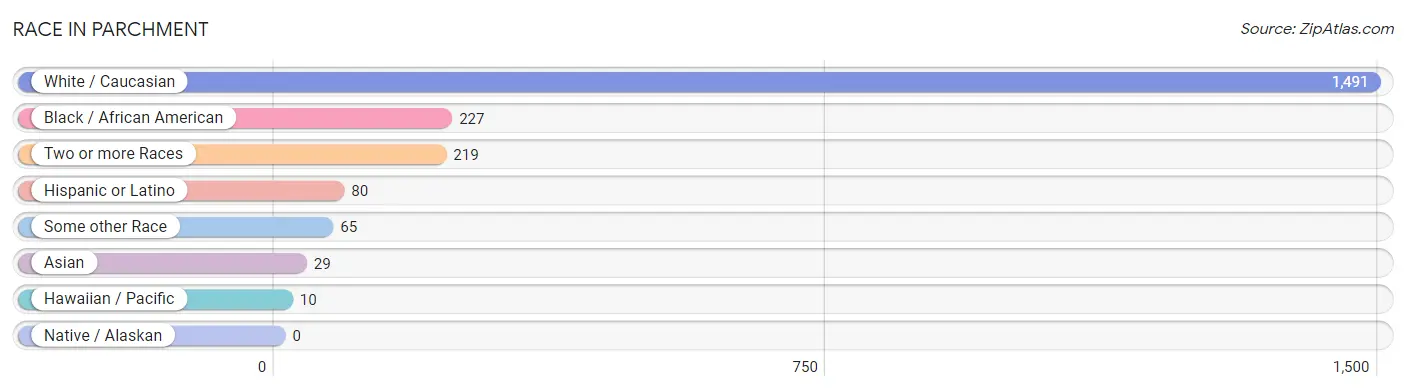
| Race | # Population | % Population |
| Asian | 29 | 1.4% |
| Black / African American | 227 | 11.1% |
| Hawaiian / Pacific | 10 | 0.5% |
| Hispanic or Latino | 80 | 3.9% |
| Native / Alaskan | 0 | 0.0% |
| White / Caucasian | 1,491 | 73.1% |
| Two or more Races | 219 | 10.7% |
| Some other Race | 65 | 3.2% |
| Total | 2,041 | 100.0% |
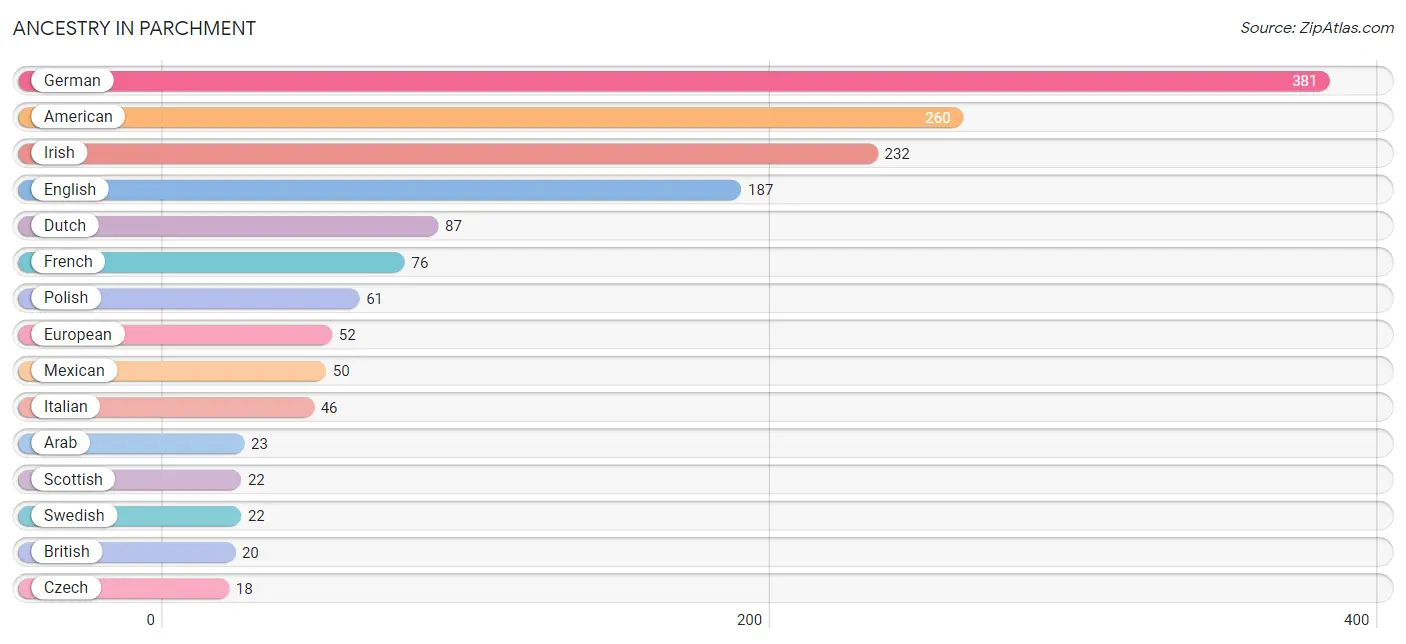
Ancestry in Parchment
The most populous ancestries reported in Parchment are German (381 | 18.7%), American (260 | 12.7%), Irish (232 | 11.4%), English (187 | 9.2%), and Dutch (87 | 4.3%), together accounting for 56.2% of all Parchment residents.
| Ancestry | # Population | % Population |
| American | 260 | 12.7% |
| Arab | 23 | 1.1% |
| Austrian | 7 | 0.3% |
| Blackfeet | 11 | 0.5% |
| British | 20 | 1.0% |
| British West Indian | 11 | 0.5% |
| Burmese | 10 | 0.5% |
| Cherokee | 8 | 0.4% |
| Chippewa | 1 | 0.1% |
| Croatian | 1 | 0.1% |
| Czech | 18 | 0.9% |
| Czechoslovakian | 4 | 0.2% |
| Danish | 6 | 0.3% |
| Dutch | 87 | 4.3% |
| Eastern European | 8 | 0.4% |
| Egyptian | 5 | 0.2% |
| English | 187 | 9.2% |
| European | 52 | 2.5% |
| Finnish | 8 | 0.4% |
| French | 76 | 3.7% |
| French Canadian | 3 | 0.2% |
| German | 381 | 18.7% |
| Greek | 3 | 0.2% |
| Hungarian | 2 | 0.1% |
| Indian (Asian) | 6 | 0.3% |
| Irish | 232 | 11.4% |
| Italian | 46 | 2.2% |
| Lithuanian | 12 | 0.6% |
| Mexican | 50 | 2.5% |
| Moroccan | 18 | 0.9% |
| Norwegian | 17 | 0.8% |
| Pennsylvania German | 3 | 0.2% |
| Polish | 61 | 3.0% |
| Portuguese | 2 | 0.1% |
| Puerto Rican | 6 | 0.3% |
| Samoan | 10 | 0.5% |
| Scottish | 22 | 1.1% |
| Spaniard | 4 | 0.2% |
| Sri Lankan | 13 | 0.6% |
| Swedish | 22 | 1.1% |
| Swiss | 11 | 0.5% |
| Ukrainian | 3 | 0.2% |
| Welsh | 17 | 0.8% | View All 43 Rows |
Immigrants in Parchment
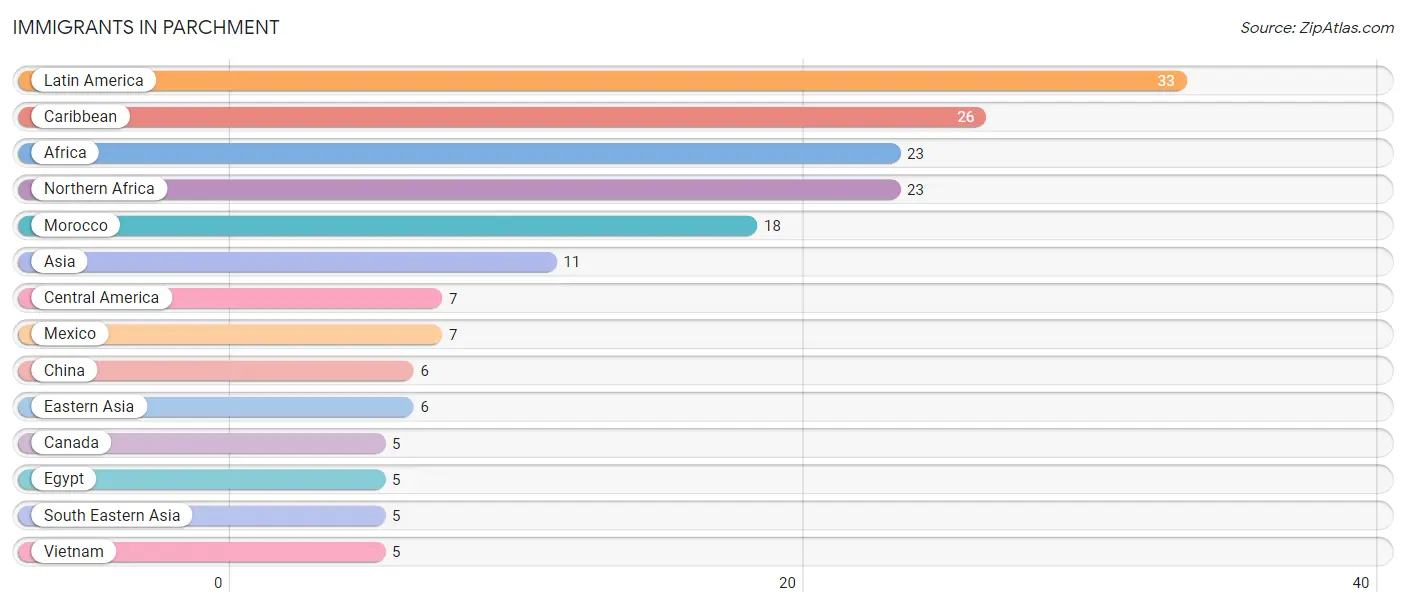
The most numerous immigrant groups reported in Parchment came from Latin America (33 | 1.6%), Caribbean (26 | 1.3%), Africa (23 | 1.1%), Northern Africa (23 | 1.1%), and Morocco (18 | 0.9%), together accounting for 6.0% of all Parchment residents.
| Immigration Origin | # Population | % Population |
| Africa | 23 | 1.1% |
| Asia | 11 | 0.5% |
| Canada | 5 | 0.2% |
| Caribbean | 26 | 1.3% |
| Central America | 7 | 0.3% |
| China | 6 | 0.3% |
| Eastern Asia | 6 | 0.3% |
| Egypt | 5 | 0.2% |
| Latin America | 33 | 1.6% |
| Mexico | 7 | 0.3% |
| Morocco | 18 | 0.9% |
| Northern Africa | 23 | 1.1% |
| South Eastern Asia | 5 | 0.2% |
| Vietnam | 5 | 0.2% | View All 14 Rows |
Sex and Age in Parchment
Sex and Age in Parchment
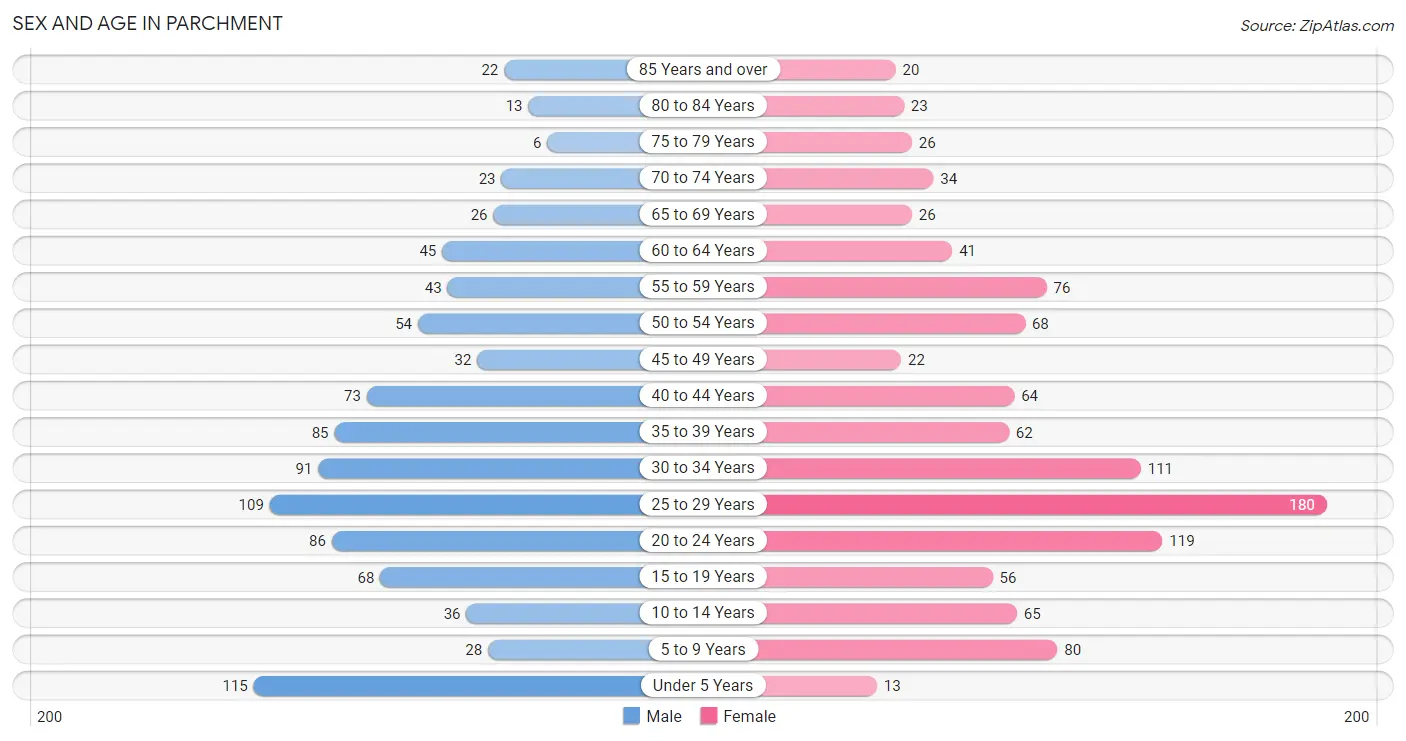
The most populous age groups in Parchment are Under 5 Years (115 | 12.0%) for men and 25 to 29 Years (180 | 16.6%) for women.
| Age Bracket | Male | Female |
| Under 5 Years | 115 (12.0%) | 13 (1.2%) |
| 5 to 9 Years | 28 (2.9%) | 80 (7.4%) |
| 10 to 14 Years | 36 (3.8%) | 65 (6.0%) |
| 15 to 19 Years | 68 (7.1%) | 56 (5.2%) |
| 20 to 24 Years | 86 (9.0%) | 119 (11.0%) |
| 25 to 29 Years | 109 (11.4%) | 180 (16.6%) |
| 30 to 34 Years | 91 (9.5%) | 111 (10.2%) |
| 35 to 39 Years | 85 (8.9%) | 62 (5.7%) |
| 40 to 44 Years | 73 (7.6%) | 64 (5.9%) |
| 45 to 49 Years | 32 (3.4%) | 22 (2.0%) |
| 50 to 54 Years | 54 (5.7%) | 68 (6.3%) |
| 55 to 59 Years | 43 (4.5%) | 76 (7.0%) |
| 60 to 64 Years | 45 (4.7%) | 41 (3.8%) |
| 65 to 69 Years | 26 (2.7%) | 26 (2.4%) |
| 70 to 74 Years | 23 (2.4%) | 34 (3.1%) |
| 75 to 79 Years | 6 (0.6%) | 26 (2.4%) |
| 80 to 84 Years | 13 (1.4%) | 23 (2.1%) |
| 85 Years and over | 22 (2.3%) | 20 (1.8%) |
| Total | 955 (100.0%) | 1,086 (100.0%) |
Families and Households in Parchment
Median Family Size in Parchment
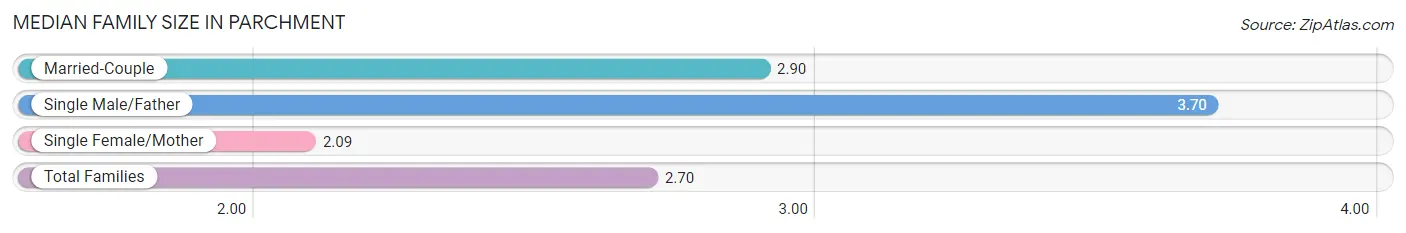
The median family size in Parchment is 2.70 persons per family, with single male/father families (43 | 8.3%) accounting for the largest median family size of 3.7 persons per family. On the other hand, single female/mother families (172 | 33.3%) represent the smallest median family size with 2.09 persons per family.
| Family Type | # Families | Family Size |
| Married-Couple | 302 (58.4%) | 2.90 |
| Single Male/Father | 43 (8.3%) | 3.70 |
| Single Female/Mother | 172 (33.3%) | 2.09 |
| Total Families | 517 (100.0%) | 2.70 |
Median Household Size in Parchment
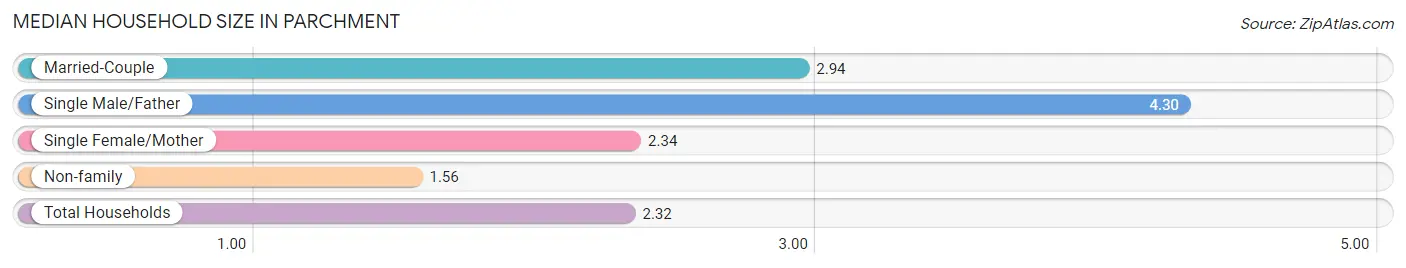
The median household size in Parchment is 2.32 persons per household, with single male/father households (43 | 4.9%) accounting for the largest median household size of 4.3 persons per household. non-family households (362 | 41.2%) represent the smallest median household size with 1.56 persons per household.
| Household Type | # Households | Household Size |
| Married-Couple | 302 (34.4%) | 2.94 |
| Single Male/Father | 43 (4.9%) | 4.30 |
| Single Female/Mother | 172 (19.6%) | 2.34 |
| Non-family | 362 (41.2%) | 1.56 |
| Total Households | 879 (100.0%) | 2.32 |
Household Size by Marriage Status in Parchment
Out of a total of 879 households in Parchment, 517 (58.8%) are family households, while 362 (41.2%) are nonfamily households. The most numerous type of family households are 2-person households, comprising 253, and the most common type of nonfamily households are 1-person households, comprising 183.
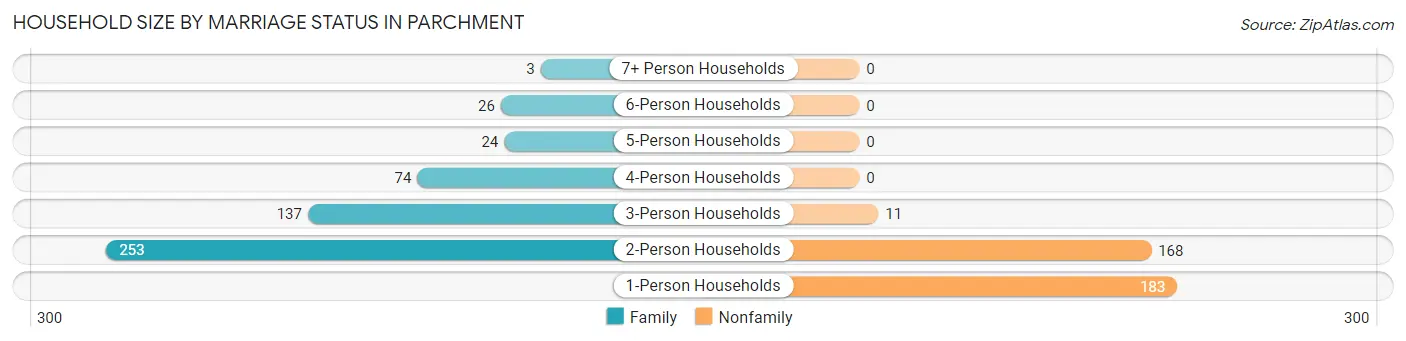
| Household Size | Family Households | Nonfamily Households |
| 1-Person Households | - | 183 (20.8%) |
| 2-Person Households | 253 (28.8%) | 168 (19.1%) |
| 3-Person Households | 137 (15.6%) | 11 (1.3%) |
| 4-Person Households | 74 (8.4%) | 0 (0.0%) |
| 5-Person Households | 24 (2.7%) | 0 (0.0%) |
| 6-Person Households | 26 (3.0%) | 0 (0.0%) |
| 7+ Person Households | 3 (0.3%) | 0 (0.0%) |
| Total | 517 (58.8%) | 362 (41.2%) |
Female Fertility in Parchment
Fertility by Age in Parchment
Average fertility rate in Parchment is 14.0 births per 1,000 women. Women in the age bracket of 35 to 50 years have the highest fertility rate with 34.0 births per 1,000 women. Women in the age bracket of 35 to 50 years acount for 66.7% of all women with births.
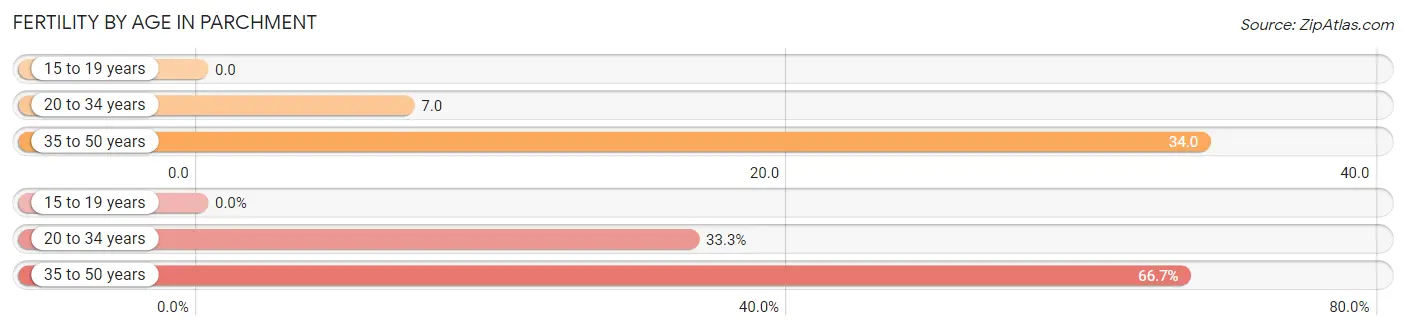
| Age Bracket | Women with Births | Births / 1,000 Women |
| 15 to 19 years | 0 (0.0%) | 0.0 |
| 20 to 34 years | 3 (33.3%) | 7.0 |
| 35 to 50 years | 6 (66.7%) | 34.0 |
| Total | 9 (100.0%) | 14.0 |
Fertility by Age by Marriage Status in Parchment
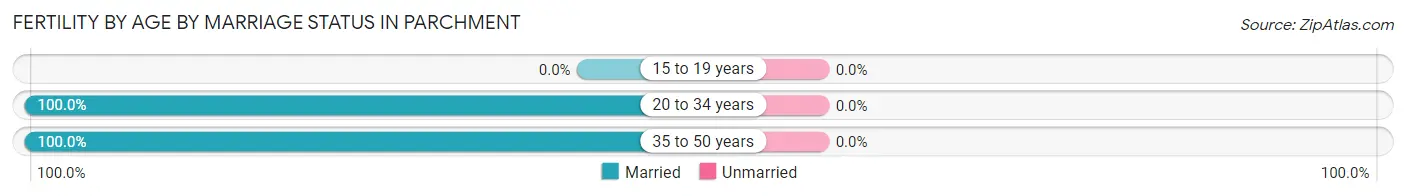
| Age Bracket | Married | Unmarried |
| 15 to 19 years | 0 (0.0%) | 0 (0.0%) |
| 20 to 34 years | 3 (100.0%) | 0 (0.0%) |
| 35 to 50 years | 6 (100.0%) | 0 (0.0%) |
| Total | 9 (100.0%) | 0 (0.0%) |
Fertility by Education in Parchment
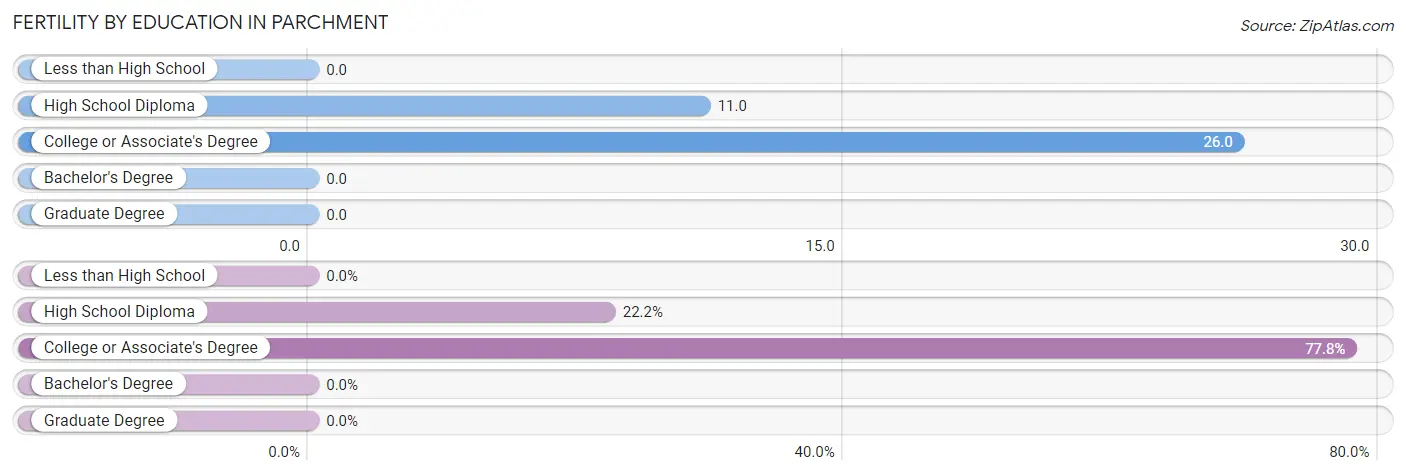
| Educational Attainment | Women with Births | Births / 1,000 Women |
| Less than High School | 0 (0.0%) | 0.0 |
| High School Diploma | 2 (22.2%) | 11.0 |
| College or Associate's Degree | 7 (77.8%) | 26.0 |
| Bachelor's Degree | 0 (0.0%) | 0.0 |
| Graduate Degree | 0 (0.0%) | 0.0 |
| Total | 9 (100.0%) | 14.0 |
Fertility by Education by Marriage Status in Parchment
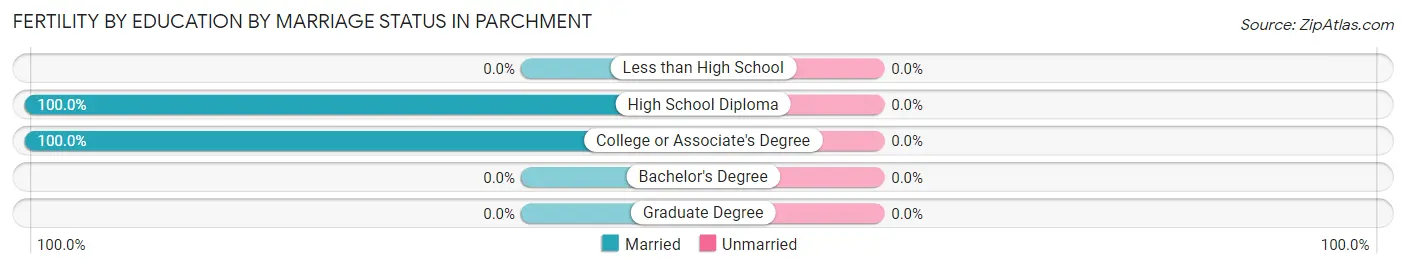
| Educational Attainment | Married | Unmarried |
| Less than High School | 0 (0.0%) | 0 (0.0%) |
| High School Diploma | 2 (100.0%) | 0 (0.0%) |
| College or Associate's Degree | 7 (100.0%) | 0 (0.0%) |
| Bachelor's Degree | 0 (0.0%) | 0 (0.0%) |
| Graduate Degree | 0 (0.0%) | 0 (0.0%) |
| Total | 9 (100.0%) | 0 (0.0%) |
Employment Characteristics in Parchment
Employment by Class of Employer in Parchment
Among the 1,068 employed individuals in Parchment, private company employees (747 | 69.9%), local government employees (106 | 9.9%), and not-for-profit organizations (104 | 9.7%) make up the most common classes of employment.
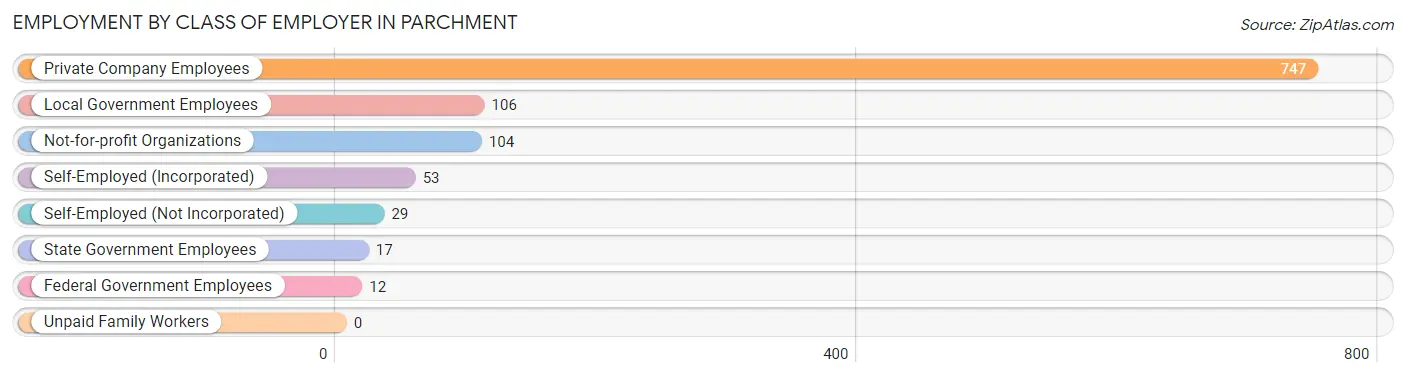
| Employer Class | # Employees | % Employees |
| Private Company Employees | 747 | 69.9% |
| Self-Employed (Incorporated) | 53 | 5.0% |
| Self-Employed (Not Incorporated) | 29 | 2.7% |
| Not-for-profit Organizations | 104 | 9.7% |
| Local Government Employees | 106 | 9.9% |
| State Government Employees | 17 | 1.6% |
| Federal Government Employees | 12 | 1.1% |
| Unpaid Family Workers | 0 | 0.0% |
| Total | 1,068 | 100.0% |
Employment Status by Age in Parchment
According to the labor force statistics for Parchment, out of the total population over 16 years of age (1,682), 71.0% or 1,194 individuals are in the labor force, with 8.4% or 100 of them unemployed. The age group with the highest labor force participation rate is 25 to 29 years, with 93.4% or 270 individuals in the labor force. Within the labor force, the 20 to 24 years age range has the highest percentage of unemployed individuals, with 29.4% or 52 of them being unemployed.
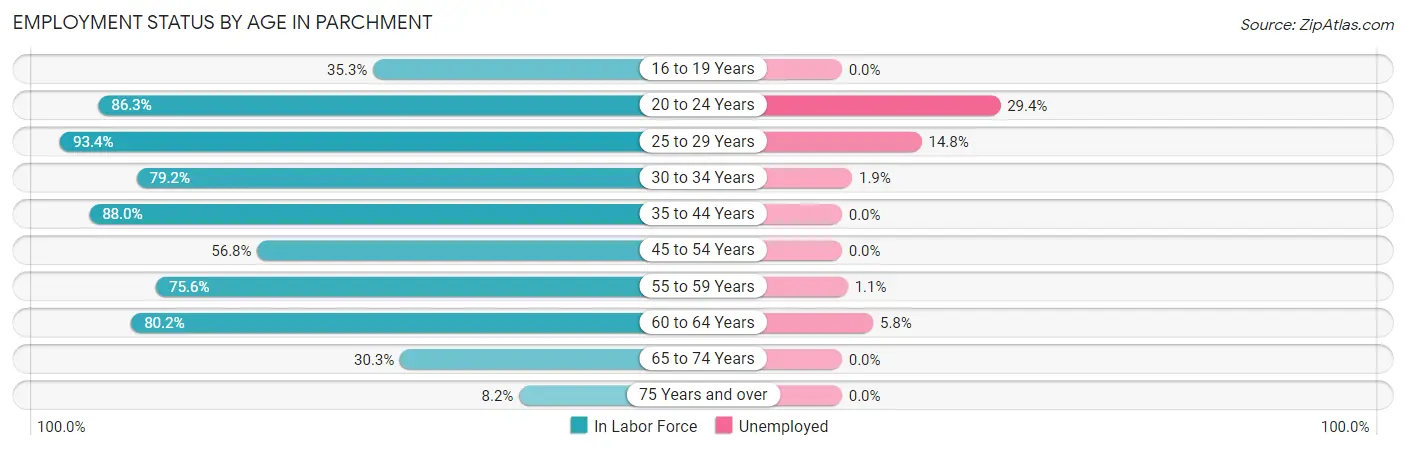
| Age Bracket | In Labor Force | Unemployed |
| 16 to 19 Years | 36 (35.3%) | 0 (0.0%) |
| 20 to 24 Years | 177 (86.3%) | 52 (29.4%) |
| 25 to 29 Years | 270 (93.4%) | 40 (14.8%) |
| 30 to 34 Years | 160 (79.2%) | 3 (1.9%) |
| 35 to 44 Years | 250 (88.0%) | 0 (0.0%) |
| 45 to 54 Years | 100 (56.8%) | 0 (0.0%) |
| 55 to 59 Years | 90 (75.6%) | 1 (1.1%) |
| 60 to 64 Years | 69 (80.2%) | 4 (5.8%) |
| 65 to 74 Years | 33 (30.3%) | 0 (0.0%) |
| 75 Years and over | 9 (8.2%) | 0 (0.0%) |
| Total | 1,194 (71.0%) | 100 (8.4%) |
Employment Status by Educational Attainment in Parchment
According to labor force statistics for Parchment, 81.2% of individuals (939) out of the total population between 25 and 64 years of age (1,156) are in the labor force, with 5.1% or 48 of them being unemployed. The group with the highest labor force participation rate are those with the educational attainment of bachelor's degree or higher, with 91.3% or 220 individuals in the labor force. Within the labor force, individuals with less than high school education have the highest percentage of unemployment, with 14.3% or 3 of them being unemployed.
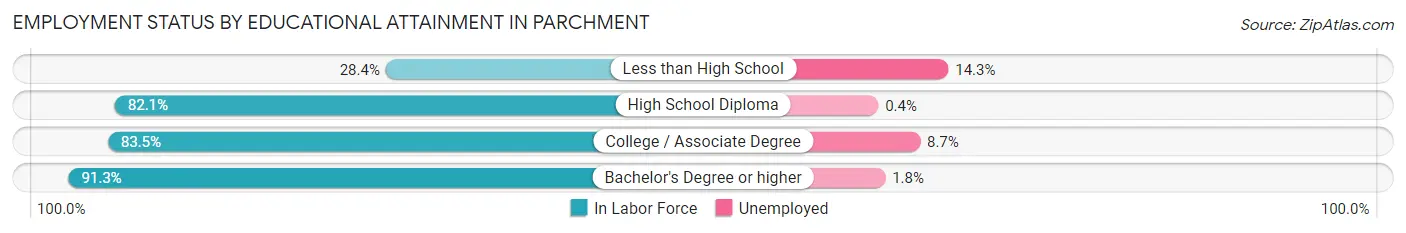
| Educational Attainment | In Labor Force | Unemployed |
| Less than High School | 21 (28.4%) | 11 (14.3%) |
| High School Diploma | 238 (82.1%) | 1 (0.4%) |
| College / Associate Degree | 460 (83.5%) | 48 (8.7%) |
| Bachelor's Degree or higher | 220 (91.3%) | 4 (1.8%) |
| Total | 939 (81.2%) | 59 (5.1%) |
Employment Occupations by Sex in Parchment
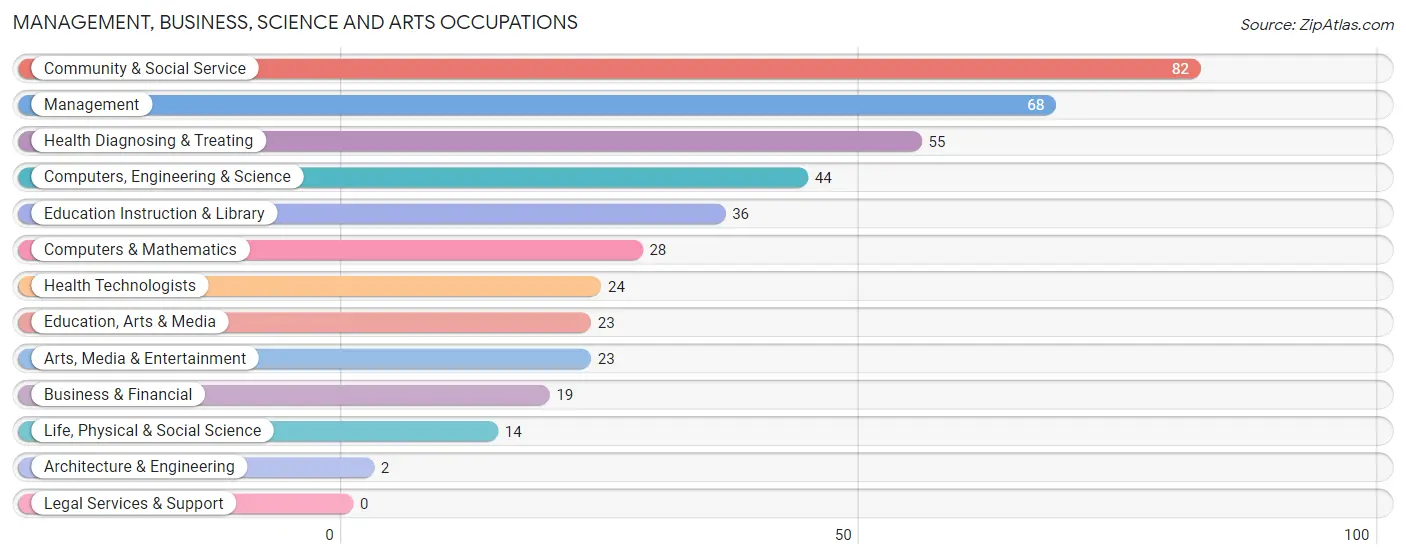
Management, Business, Science and Arts Occupations
The most common Management, Business, Science and Arts occupations in Parchment are Community & Social Service (82 | 7.5%), Management (68 | 6.2%), Health Diagnosing & Treating (55 | 5.0%), Computers, Engineering & Science (44 | 4.0%), and Education Instruction & Library (36 | 3.3%).
Management, Business, Science and Arts Occupations by Sex
Within the Management, Business, Science and Arts occupations in Parchment, the most male-oriented occupations are Business & Financial (100.0%), Computers & Mathematics (100.0%), and Architecture & Engineering (100.0%), while the most female-oriented occupations are Health Diagnosing & Treating (81.8%), Health Technologists (79.2%), and Education, Arts & Media (73.9%).

| Occupation | Male | Female |
| Management | 30 (44.1%) | 38 (55.9%) |
| Business & Financial | 19 (100.0%) | 0 (0.0%) |
| Computers, Engineering & Science | 41 (93.2%) | 3 (6.8%) |
| Computers & Mathematics | 28 (100.0%) | 0 (0.0%) |
| Architecture & Engineering | 2 (100.0%) | 0 (0.0%) |
| Life, Physical & Social Science | 11 (78.6%) | 3 (21.4%) |
| Community & Social Service | 27 (32.9%) | 55 (67.1%) |
| Education, Arts & Media | 6 (26.1%) | 17 (73.9%) |
| Legal Services & Support | 0 (0.0%) | 0 (0.0%) |
| Education Instruction & Library | 11 (30.6%) | 25 (69.4%) |
| Arts, Media & Entertainment | 10 (43.5%) | 13 (56.5%) |
| Health Diagnosing & Treating | 10 (18.2%) | 45 (81.8%) |
| Health Technologists | 5 (20.8%) | 19 (79.2%) |
| Total (Category) | 127 (47.4%) | 141 (52.6%) |
| Total (Overall) | 559 (51.1%) | 535 (48.9%) |
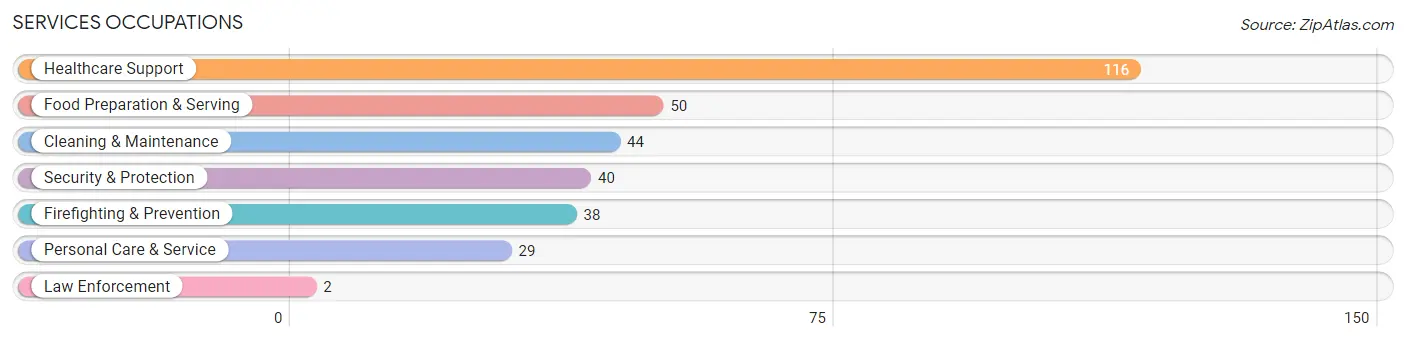
Services Occupations
The most common Services occupations in Parchment are Healthcare Support (116 | 10.6%), Food Preparation & Serving (50 | 4.6%), Cleaning & Maintenance (44 | 4.0%), Security & Protection (40 | 3.7%), and Firefighting & Prevention (38 | 3.5%).
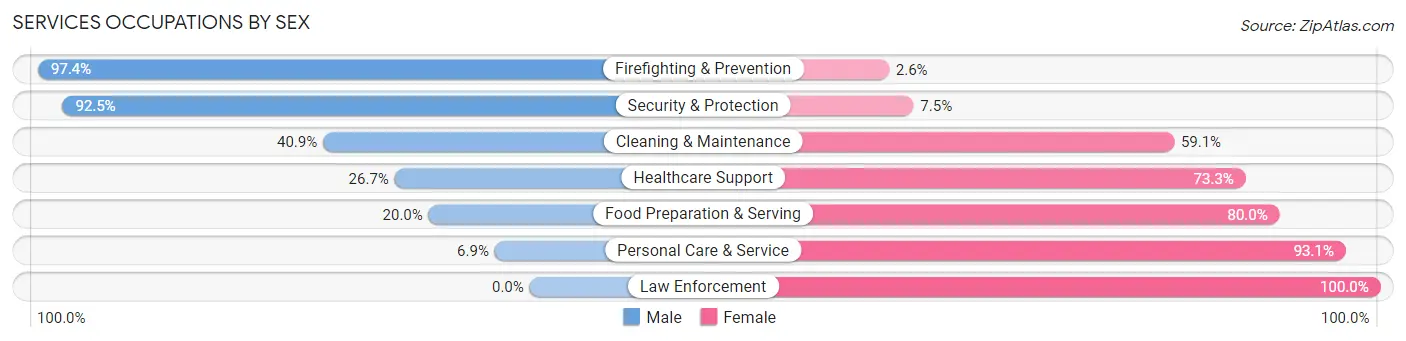
Services Occupations by Sex
Within the Services occupations in Parchment, the most male-oriented occupations are Firefighting & Prevention (97.4%), Security & Protection (92.5%), and Cleaning & Maintenance (40.9%), while the most female-oriented occupations are Law Enforcement (100.0%), Personal Care & Service (93.1%), and Food Preparation & Serving (80.0%).
| Occupation | Male | Female |
| Healthcare Support | 31 (26.7%) | 85 (73.3%) |
| Security & Protection | 37 (92.5%) | 3 (7.5%) |
| Firefighting & Prevention | 37 (97.4%) | 1 (2.6%) |
| Law Enforcement | 0 (0.0%) | 2 (100.0%) |
| Food Preparation & Serving | 10 (20.0%) | 40 (80.0%) |
| Cleaning & Maintenance | 18 (40.9%) | 26 (59.1%) |
| Personal Care & Service | 2 (6.9%) | 27 (93.1%) |
| Total (Category) | 98 (35.1%) | 181 (64.9%) |
| Total (Overall) | 559 (51.1%) | 535 (48.9%) |
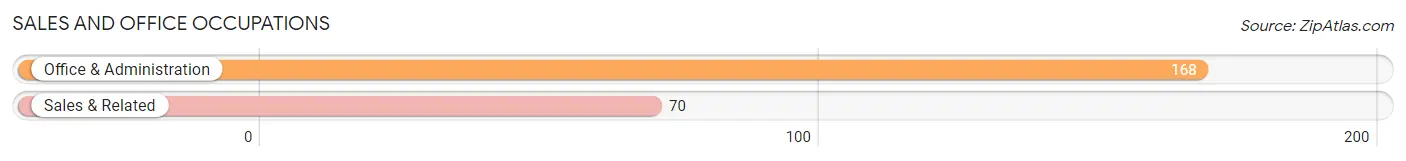
Sales and Office Occupations
The most common Sales and Office occupations in Parchment are Office & Administration (168 | 15.4%), and Sales & Related (70 | 6.4%).
Sales and Office Occupations by Sex
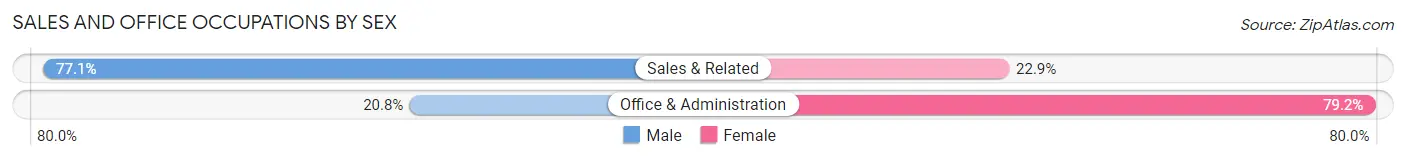
| Occupation | Male | Female |
| Sales & Related | 54 (77.1%) | 16 (22.9%) |
| Office & Administration | 35 (20.8%) | 133 (79.2%) |
| Total (Category) | 89 (37.4%) | 149 (62.6%) |
| Total (Overall) | 559 (51.1%) | 535 (48.9%) |
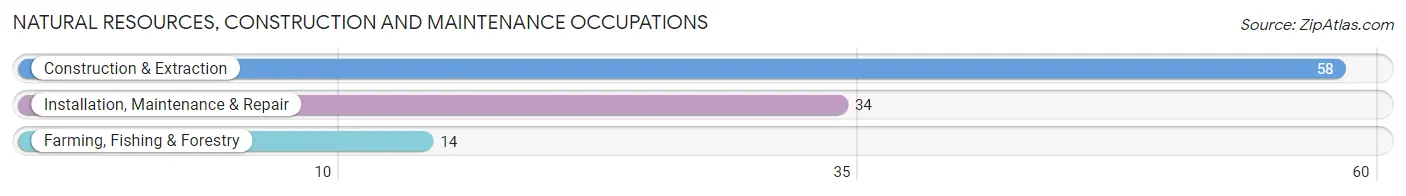
Natural Resources, Construction and Maintenance Occupations
The most common Natural Resources, Construction and Maintenance occupations in Parchment are Construction & Extraction (58 | 5.3%), Installation, Maintenance & Repair (34 | 3.1%), and Farming, Fishing & Forestry (14 | 1.3%).
Natural Resources, Construction and Maintenance Occupations by Sex
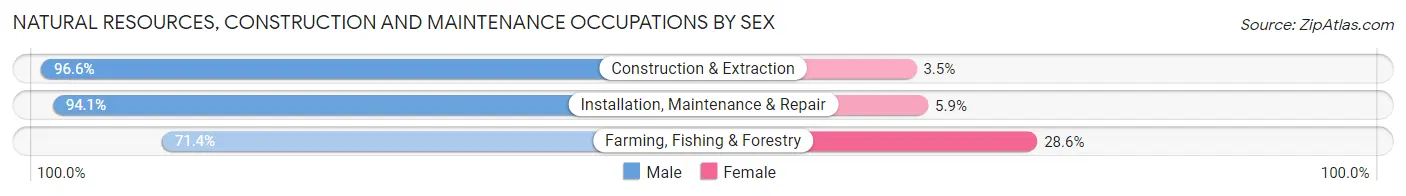
| Occupation | Male | Female |
| Farming, Fishing & Forestry | 10 (71.4%) | 4 (28.6%) |
| Construction & Extraction | 56 (96.6%) | 2 (3.5%) |
| Installation, Maintenance & Repair | 32 (94.1%) | 2 (5.9%) |
| Total (Category) | 98 (92.4%) | 8 (7.5%) |
| Total (Overall) | 559 (51.1%) | 535 (48.9%) |
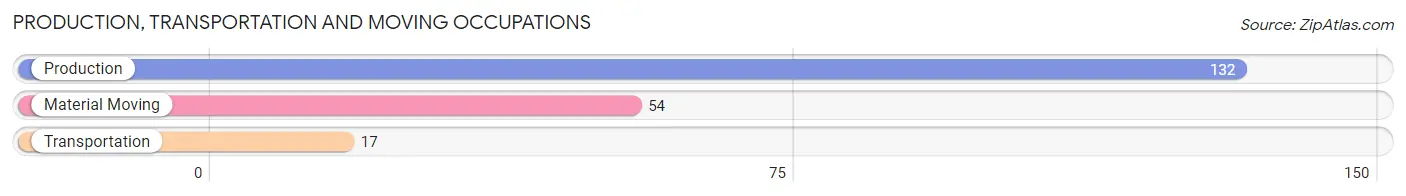
Production, Transportation and Moving Occupations
The most common Production, Transportation and Moving occupations in Parchment are Production (132 | 12.1%), Material Moving (54 | 4.9%), and Transportation (17 | 1.5%).
Production, Transportation and Moving Occupations by Sex
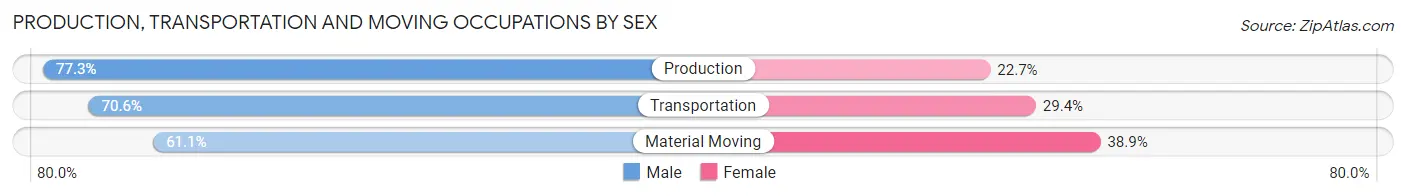
| Occupation | Male | Female |
| Production | 102 (77.3%) | 30 (22.7%) |
| Transportation | 12 (70.6%) | 5 (29.4%) |
| Material Moving | 33 (61.1%) | 21 (38.9%) |
| Total (Category) | 147 (72.4%) | 56 (27.6%) |
| Total (Overall) | 559 (51.1%) | 535 (48.9%) |
Employment Industries by Sex in Parchment
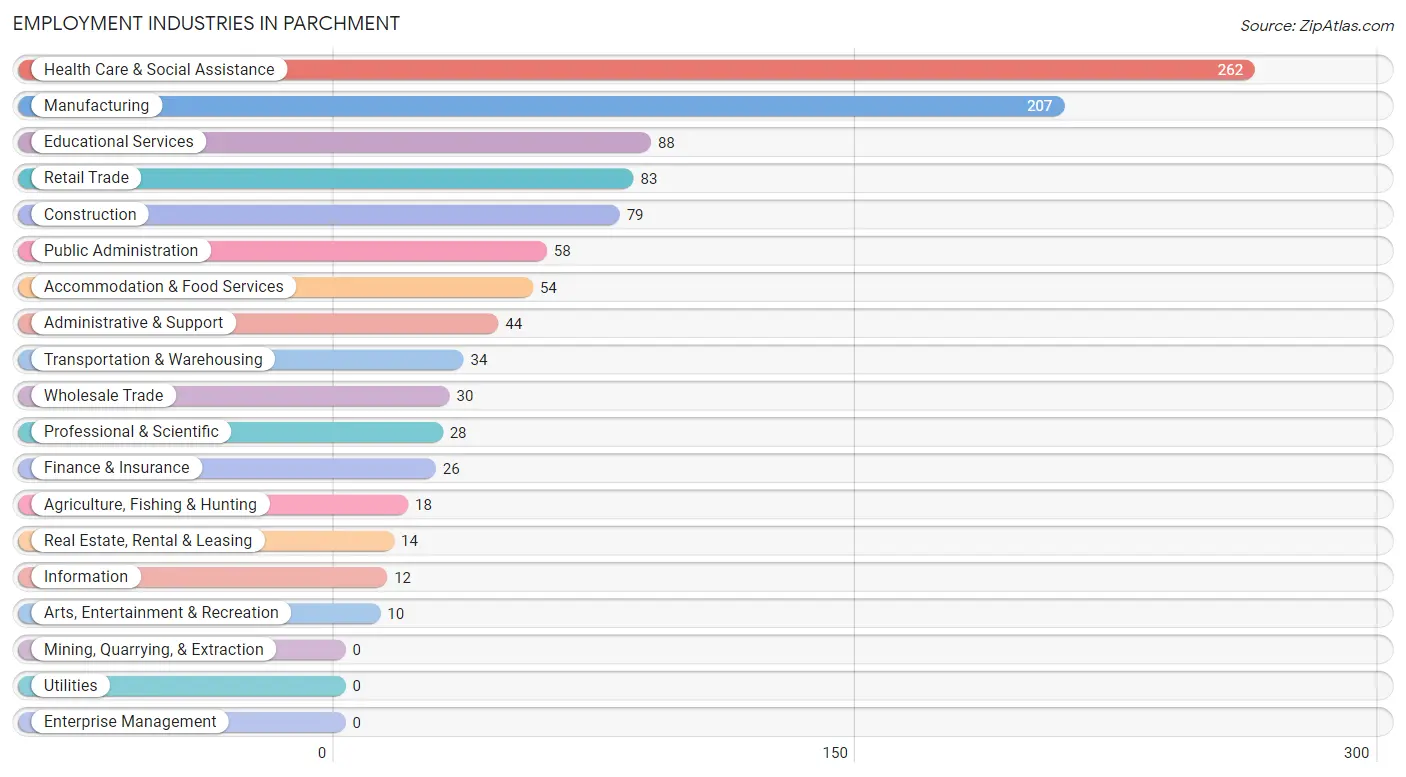
Employment Industries in Parchment
The major employment industries in Parchment include Health Care & Social Assistance (262 | 23.9%), Manufacturing (207 | 18.9%), Educational Services (88 | 8.0%), Retail Trade (83 | 7.6%), and Construction (79 | 7.2%).
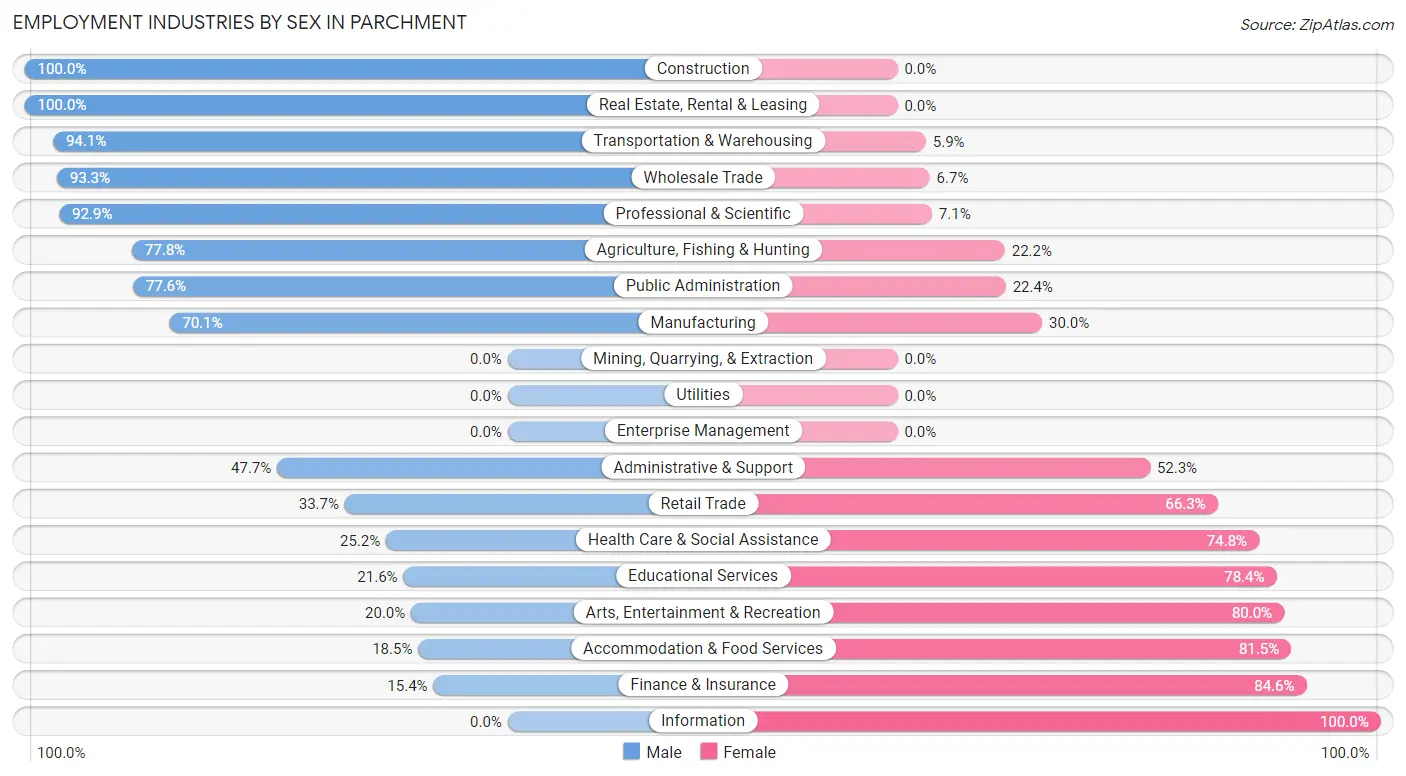
Employment Industries by Sex in Parchment
The Parchment industries that see more men than women are Construction (100.0%), Real Estate, Rental & Leasing (100.0%), and Transportation & Warehousing (94.1%), whereas the industries that tend to have a higher number of women are Information (100.0%), Finance & Insurance (84.6%), and Accommodation & Food Services (81.5%).
| Industry | Male | Female |
| Agriculture, Fishing & Hunting | 14 (77.8%) | 4 (22.2%) |
| Mining, Quarrying, & Extraction | 0 (0.0%) | 0 (0.0%) |
| Construction | 79 (100.0%) | 0 (0.0%) |
| Manufacturing | 145 (70.1%) | 62 (29.9%) |
| Wholesale Trade | 28 (93.3%) | 2 (6.7%) |
| Retail Trade | 28 (33.7%) | 55 (66.3%) |
| Transportation & Warehousing | 32 (94.1%) | 2 (5.9%) |
| Utilities | 0 (0.0%) | 0 (0.0%) |
| Information | 0 (0.0%) | 12 (100.0%) |
| Finance & Insurance | 4 (15.4%) | 22 (84.6%) |
| Real Estate, Rental & Leasing | 14 (100.0%) | 0 (0.0%) |
| Professional & Scientific | 26 (92.9%) | 2 (7.1%) |
| Enterprise Management | 0 (0.0%) | 0 (0.0%) |
| Administrative & Support | 21 (47.7%) | 23 (52.3%) |
| Educational Services | 19 (21.6%) | 69 (78.4%) |
| Health Care & Social Assistance | 66 (25.2%) | 196 (74.8%) |
| Arts, Entertainment & Recreation | 2 (20.0%) | 8 (80.0%) |
| Accommodation & Food Services | 10 (18.5%) | 44 (81.5%) |
| Public Administration | 45 (77.6%) | 13 (22.4%) |
| Total | 559 (51.1%) | 535 (48.9%) |
Education in Parchment
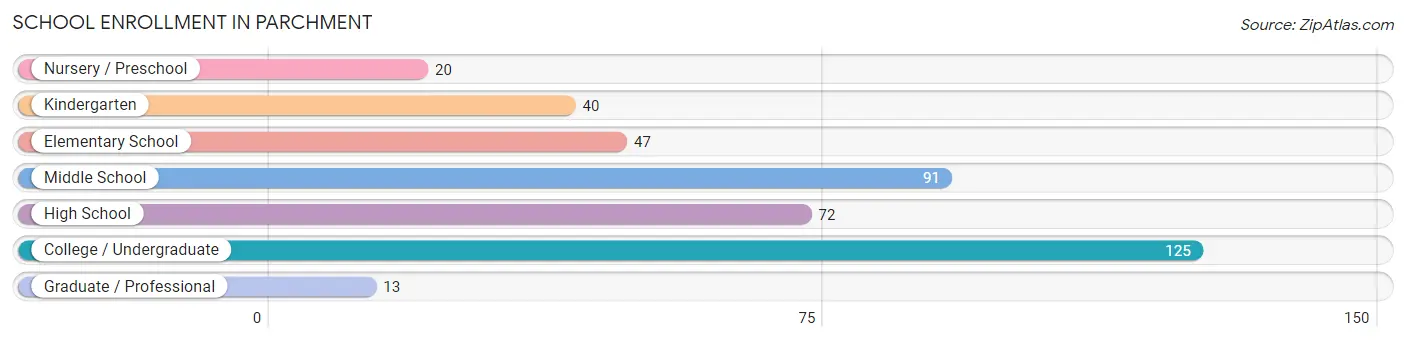
School Enrollment in Parchment
The most common levels of schooling among the 408 students in Parchment are college / undergraduate (125 | 30.6%), middle school (91 | 22.3%), and high school (72 | 17.6%).
| School Level | # Students | % Students |
| Nursery / Preschool | 20 | 4.9% |
| Kindergarten | 40 | 9.8% |
| Elementary School | 47 | 11.5% |
| Middle School | 91 | 22.3% |
| High School | 72 | 17.6% |
| College / Undergraduate | 125 | 30.6% |
| Graduate / Professional | 13 | 3.2% |
| Total | 408 | 100.0% |
School Enrollment by Age by Funding Source in Parchment
Out of a total of 408 students who are enrolled in schools in Parchment, 24 (5.9%) attend a private institution, while the remaining 384 (94.1%) are enrolled in public schools. The age group of 3 to 4 year olds has the highest likelihood of being enrolled in private schools, with 10 (50.0% in the age bracket) enrolled. Conversely, the age group of 5 to 9 year old has the lowest likelihood of being enrolled in a private school, with 87 (100.0% in the age bracket) attending a public institution.
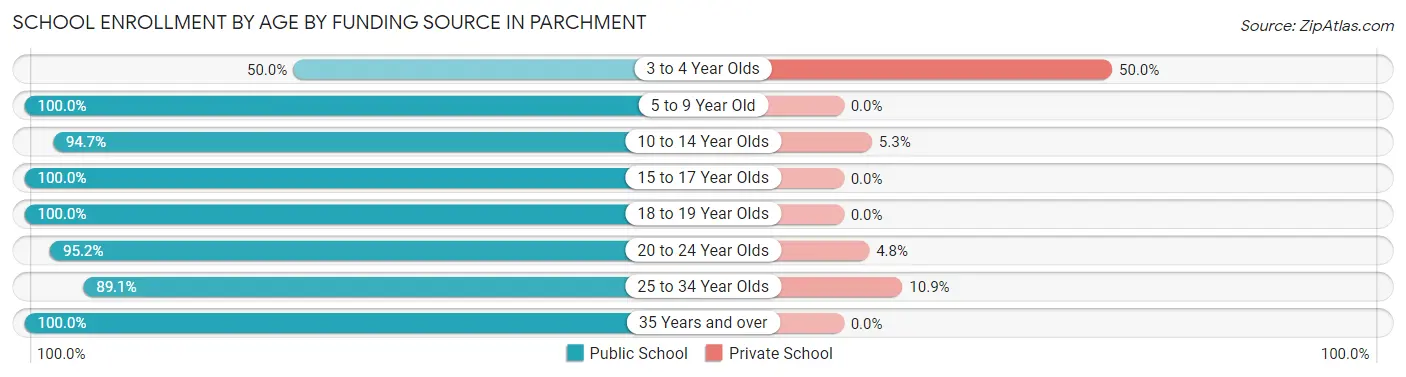
| Age Bracket | Public School | Private School |
| 3 to 4 Year Olds | 10 (50.0%) | 10 (50.0%) |
| 5 to 9 Year Old | 87 (100.0%) | 0 (0.0%) |
| 10 to 14 Year Olds | 90 (94.7%) | 5 (5.3%) |
| 15 to 17 Year Olds | 57 (100.0%) | 0 (0.0%) |
| 18 to 19 Year Olds | 34 (100.0%) | 0 (0.0%) |
| 20 to 24 Year Olds | 40 (95.2%) | 2 (4.8%) |
| 25 to 34 Year Olds | 57 (89.1%) | 7 (10.9%) |
| 35 Years and over | 9 (100.0%) | 0 (0.0%) |
| Total | 384 (94.1%) | 24 (5.9%) |
Educational Attainment by Field of Study in Parchment
Business (85 | 24.1%), science & technology (46 | 13.0%), education (46 | 13.0%), arts & humanities (27 | 7.6%), and literature & languages (26 | 7.4%) are the most common fields of study among 353 individuals in Parchment who have obtained a bachelor's degree or higher.
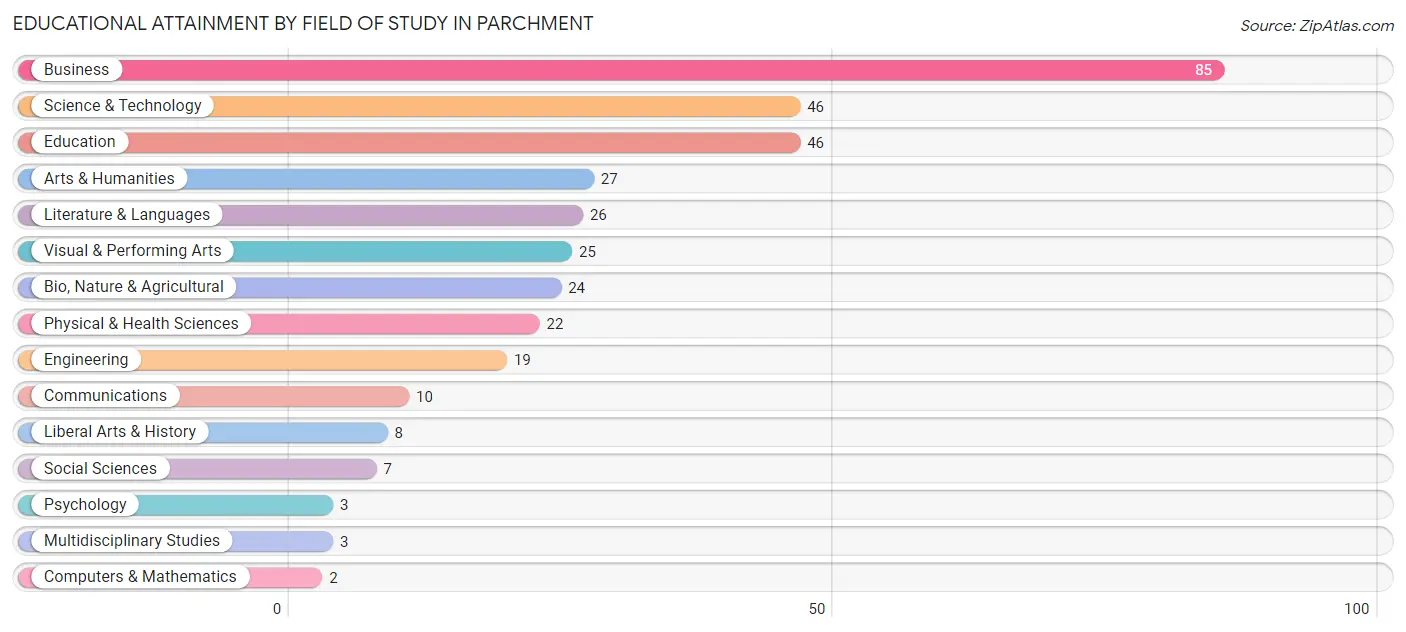
| Field of Study | # Graduates | % Graduates |
| Computers & Mathematics | 2 | 0.6% |
| Bio, Nature & Agricultural | 24 | 6.8% |
| Physical & Health Sciences | 22 | 6.2% |
| Psychology | 3 | 0.9% |
| Social Sciences | 7 | 2.0% |
| Engineering | 19 | 5.4% |
| Multidisciplinary Studies | 3 | 0.9% |
| Science & Technology | 46 | 13.0% |
| Business | 85 | 24.1% |
| Education | 46 | 13.0% |
| Literature & Languages | 26 | 7.4% |
| Liberal Arts & History | 8 | 2.3% |
| Visual & Performing Arts | 25 | 7.1% |
| Communications | 10 | 2.8% |
| Arts & Humanities | 27 | 7.6% |
| Total | 353 | 100.0% |
Transportation & Commute in Parchment
Vehicle Availability by Sex in Parchment
The most prevalent vehicle ownership categories in Parchment are males with 3 vehicles (208, accounting for 37.2%) and females with 3 vehicles (145, making up 40.9%).
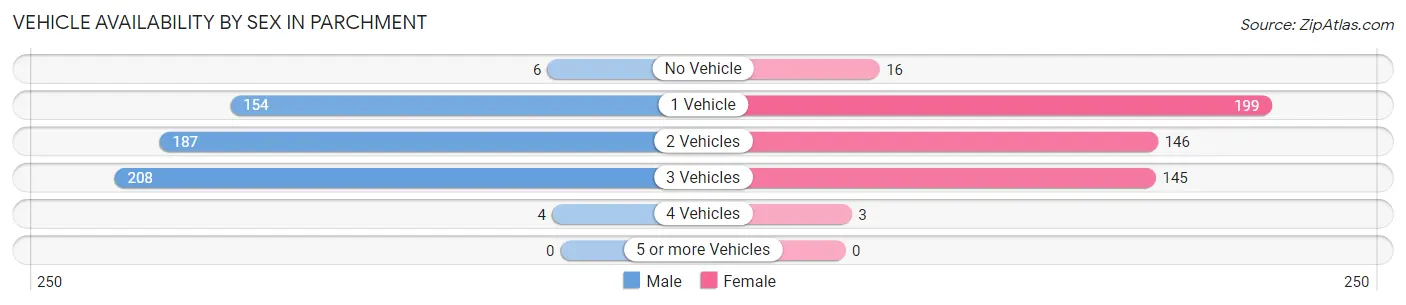
| Vehicles Available | Male | Female |
| No Vehicle | 6 (1.1%) | 16 (3.1%) |
| 1 Vehicle | 154 (27.6%) | 199 (39.1%) |
| 2 Vehicles | 187 (33.5%) | 146 (28.7%) |
| 3 Vehicles | 208 (37.2%) | 145 (28.5%) |
| 4 Vehicles | 4 (0.7%) | 3 (0.6%) |
| 5 or more Vehicles | 0 (0.0%) | 0 (0.0%) |
| Total | 559 (100.0%) | 509 (100.0%) |
Commute Time in Parchment
The most frequently occuring commute durations in Parchment are 20 to 24 minutes (275 commuters, 27.3%), 15 to 19 minutes (185 commuters, 18.3%), and 10 to 14 minutes (168 commuters, 16.7%).
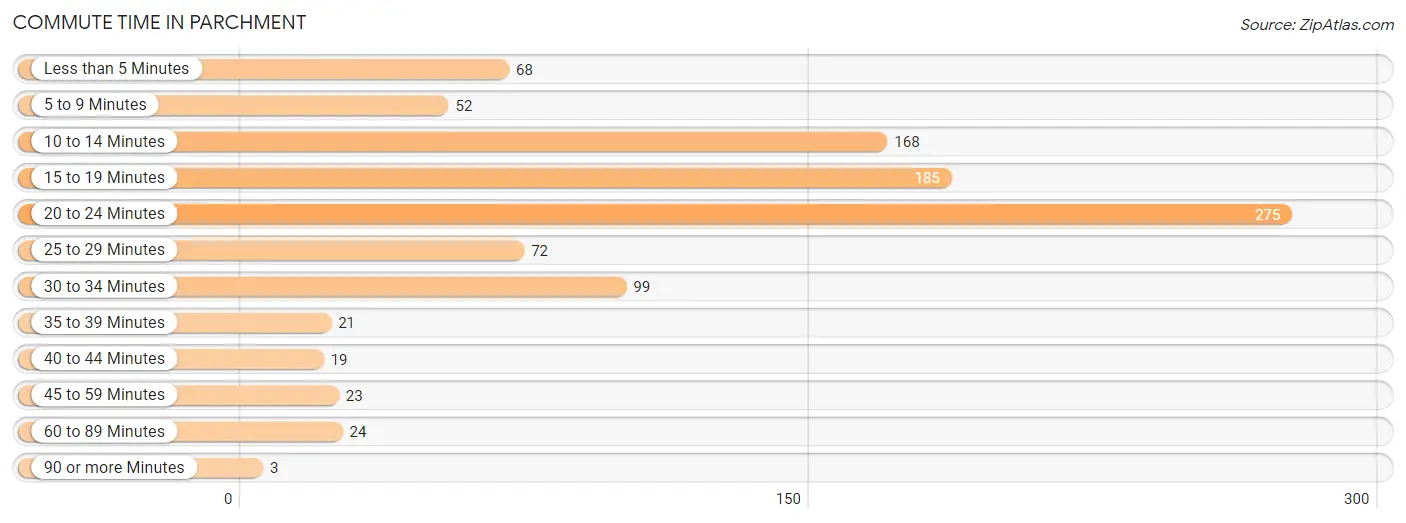
| Commute Time | # Commuters | % Commuters |
| Less than 5 Minutes | 68 | 6.7% |
| 5 to 9 Minutes | 52 | 5.1% |
| 10 to 14 Minutes | 168 | 16.7% |
| 15 to 19 Minutes | 185 | 18.3% |
| 20 to 24 Minutes | 275 | 27.3% |
| 25 to 29 Minutes | 72 | 7.1% |
| 30 to 34 Minutes | 99 | 9.8% |
| 35 to 39 Minutes | 21 | 2.1% |
| 40 to 44 Minutes | 19 | 1.9% |
| 45 to 59 Minutes | 23 | 2.3% |
| 60 to 89 Minutes | 24 | 2.4% |
| 90 or more Minutes | 3 | 0.3% |
Commute Time by Sex in Parchment
The most common commute times in Parchment are 20 to 24 minutes (126 commuters, 24.0%) for males and 20 to 24 minutes (149 commuters, 30.8%) for females.
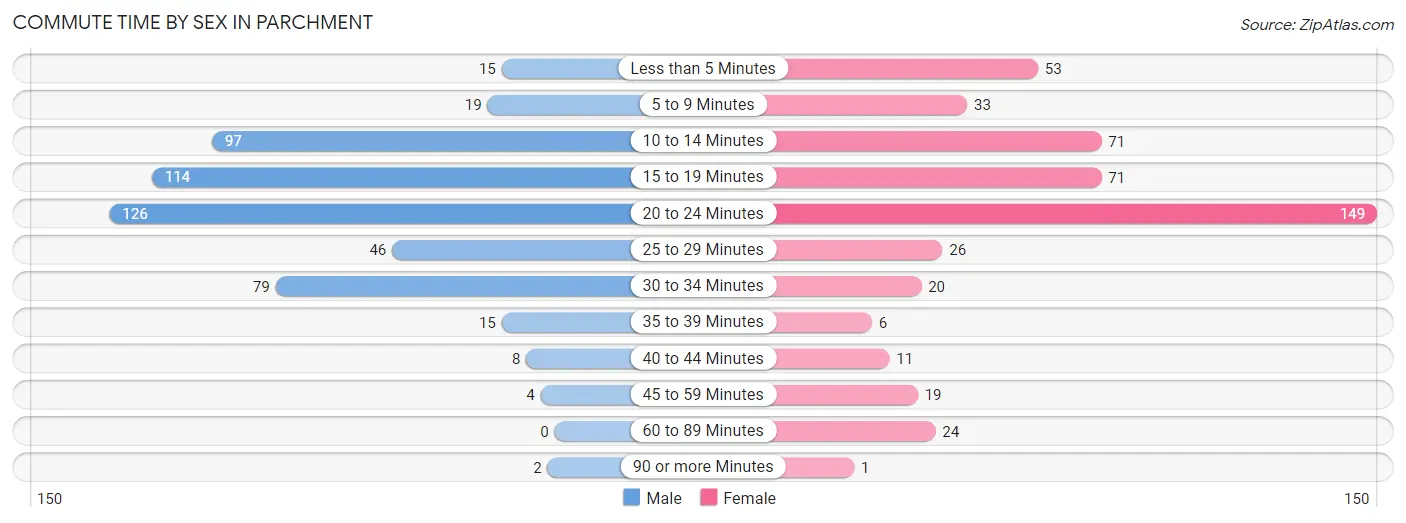
| Commute Time | Male | Female |
| Less than 5 Minutes | 15 (2.9%) | 53 (11.0%) |
| 5 to 9 Minutes | 19 (3.6%) | 33 (6.8%) |
| 10 to 14 Minutes | 97 (18.5%) | 71 (14.7%) |
| 15 to 19 Minutes | 114 (21.7%) | 71 (14.7%) |
| 20 to 24 Minutes | 126 (24.0%) | 149 (30.8%) |
| 25 to 29 Minutes | 46 (8.8%) | 26 (5.4%) |
| 30 to 34 Minutes | 79 (15.0%) | 20 (4.1%) |
| 35 to 39 Minutes | 15 (2.9%) | 6 (1.2%) |
| 40 to 44 Minutes | 8 (1.5%) | 11 (2.3%) |
| 45 to 59 Minutes | 4 (0.8%) | 19 (3.9%) |
| 60 to 89 Minutes | 0 (0.0%) | 24 (5.0%) |
| 90 or more Minutes | 2 (0.4%) | 1 (0.2%) |
Time of Departure to Work by Sex in Parchment
The most frequent times of departure to work in Parchment are 12:00 PM to 3:59 PM (89, 17.0%) for males and 7:30 AM to 7:59 AM (119, 24.6%) for females.
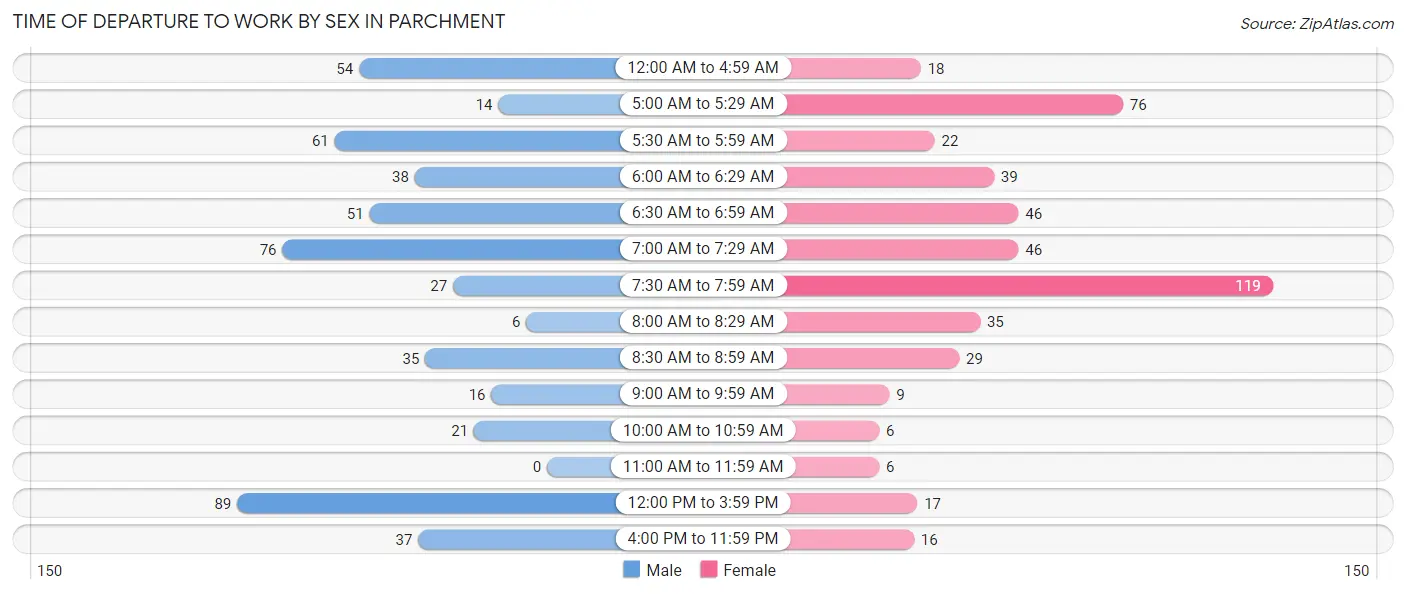
| Time of Departure | Male | Female |
| 12:00 AM to 4:59 AM | 54 (10.3%) | 18 (3.7%) |
| 5:00 AM to 5:29 AM | 14 (2.7%) | 76 (15.7%) |
| 5:30 AM to 5:59 AM | 61 (11.6%) | 22 (4.5%) |
| 6:00 AM to 6:29 AM | 38 (7.2%) | 39 (8.1%) |
| 6:30 AM to 6:59 AM | 51 (9.7%) | 46 (9.5%) |
| 7:00 AM to 7:29 AM | 76 (14.5%) | 46 (9.5%) |
| 7:30 AM to 7:59 AM | 27 (5.1%) | 119 (24.6%) |
| 8:00 AM to 8:29 AM | 6 (1.1%) | 35 (7.2%) |
| 8:30 AM to 8:59 AM | 35 (6.7%) | 29 (6.0%) |
| 9:00 AM to 9:59 AM | 16 (3.0%) | 9 (1.9%) |
| 10:00 AM to 10:59 AM | 21 (4.0%) | 6 (1.2%) |
| 11:00 AM to 11:59 AM | 0 (0.0%) | 6 (1.2%) |
| 12:00 PM to 3:59 PM | 89 (17.0%) | 17 (3.5%) |
| 4:00 PM to 11:59 PM | 37 (7.0%) | 16 (3.3%) |
| Total | 525 (100.0%) | 484 (100.0%) |
Housing Occupancy in Parchment
Occupancy by Ownership in Parchment
Of the total 879 dwellings in Parchment, owner-occupied units account for 534 (60.8%), while renter-occupied units make up 345 (39.3%).
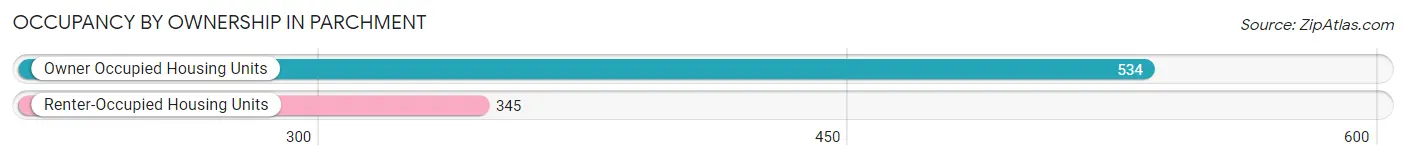
| Occupancy | # Housing Units | % Housing Units |
| Owner Occupied Housing Units | 534 | 60.8% |
| Renter-Occupied Housing Units | 345 | 39.3% |
| Total Occupied Housing Units | 879 | 100.0% |
Occupancy by Household Size in Parchment
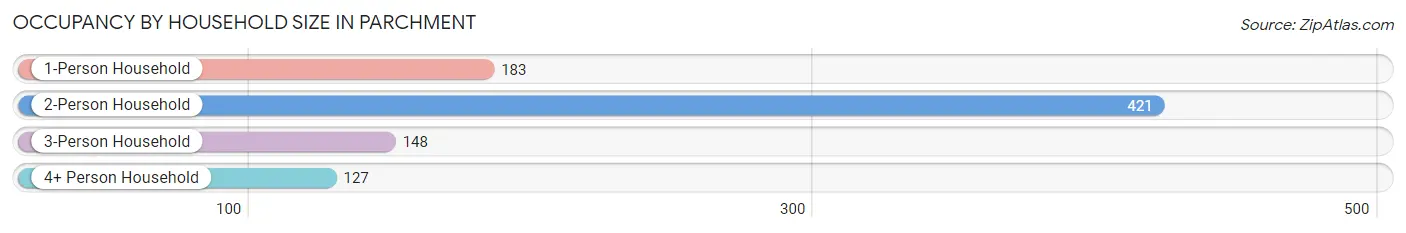
| Household Size | # Housing Units | % Housing Units |
| 1-Person Household | 183 | 20.8% |
| 2-Person Household | 421 | 47.9% |
| 3-Person Household | 148 | 16.8% |
| 4+ Person Household | 127 | 14.4% |
| Total Housing Units | 879 | 100.0% |
Occupancy by Ownership by Household Size in Parchment
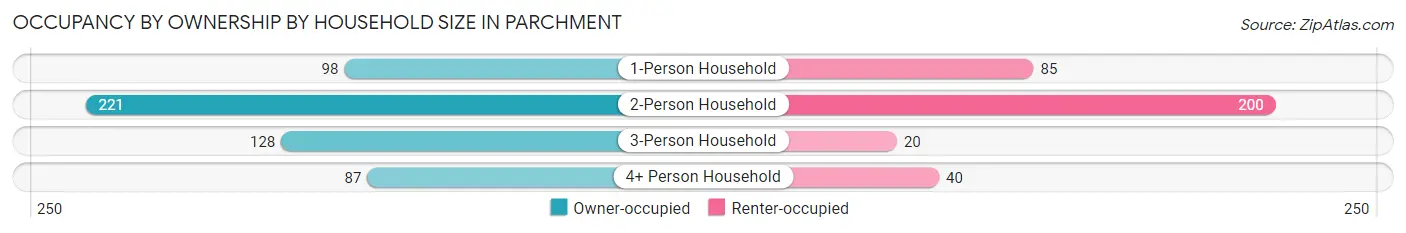
| Household Size | Owner-occupied | Renter-occupied |
| 1-Person Household | 98 (53.5%) | 85 (46.5%) |
| 2-Person Household | 221 (52.5%) | 200 (47.5%) |
| 3-Person Household | 128 (86.5%) | 20 (13.5%) |
| 4+ Person Household | 87 (68.5%) | 40 (31.5%) |
| Total Housing Units | 534 (60.8%) | 345 (39.3%) |
Occupancy by Educational Attainment in Parchment
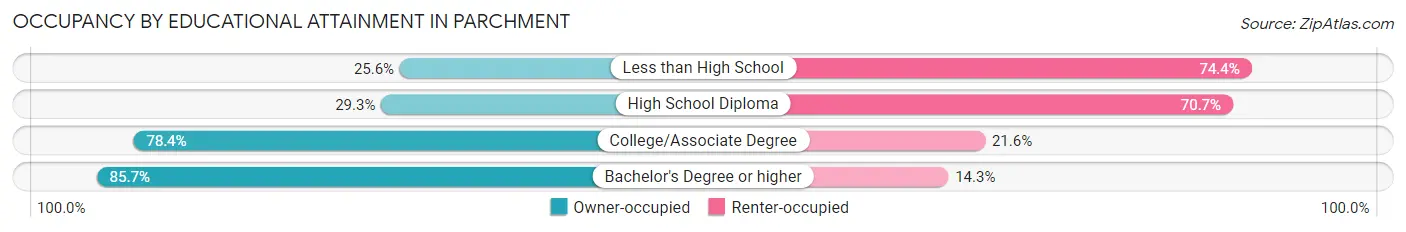
| Household Size | Owner-occupied | Renter-occupied |
| Less than High School | 11 (25.6%) | 32 (74.4%) |
| High School Diploma | 87 (29.3%) | 210 (70.7%) |
| College/Associate Degree | 280 (78.4%) | 77 (21.6%) |
| Bachelor's Degree or higher | 156 (85.7%) | 26 (14.3%) |
Occupancy by Age of Householder in Parchment
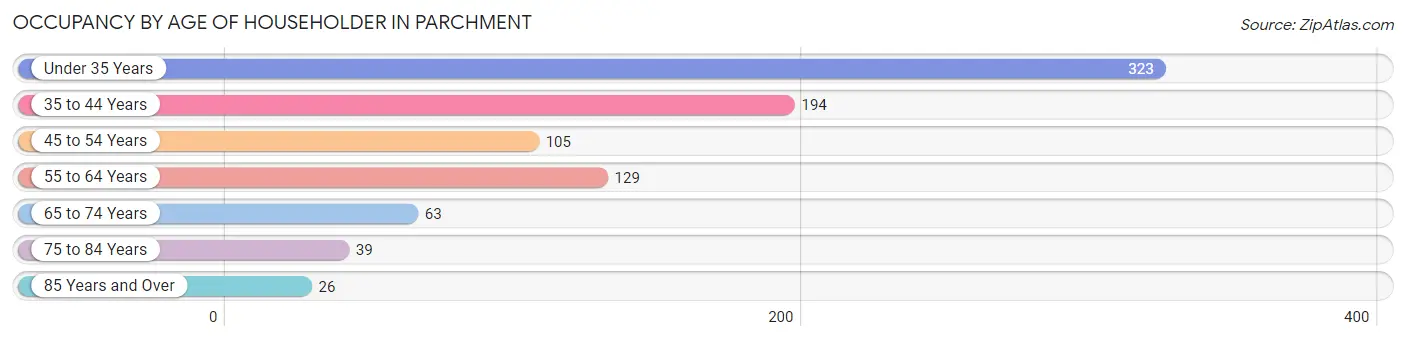
| Age Bracket | # Households | % Households |
| Under 35 Years | 323 | 36.7% |
| 35 to 44 Years | 194 | 22.1% |
| 45 to 54 Years | 105 | 11.9% |
| 55 to 64 Years | 129 | 14.7% |
| 65 to 74 Years | 63 | 7.2% |
| 75 to 84 Years | 39 | 4.4% |
| 85 Years and Over | 26 | 3.0% |
| Total | 879 | 100.0% |
Housing Finances in Parchment
Median Income by Occupancy in Parchment
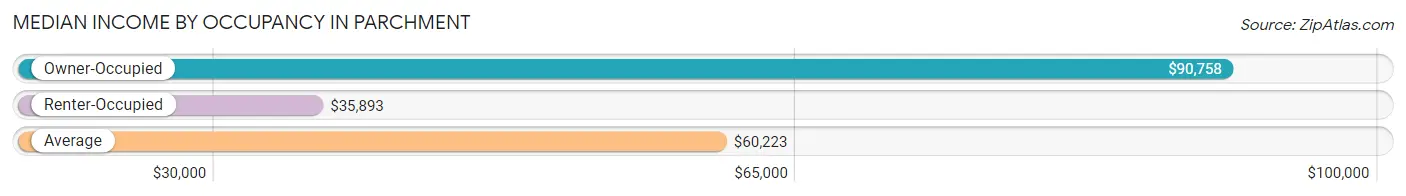
| Occupancy Type | # Households | Median Income |
| Owner-Occupied | 534 (60.8%) | $90,758 |
| Renter-Occupied | 345 (39.3%) | $35,893 |
| Average | 879 (100.0%) | $60,223 |
Occupancy by Householder Income Bracket in Parchment
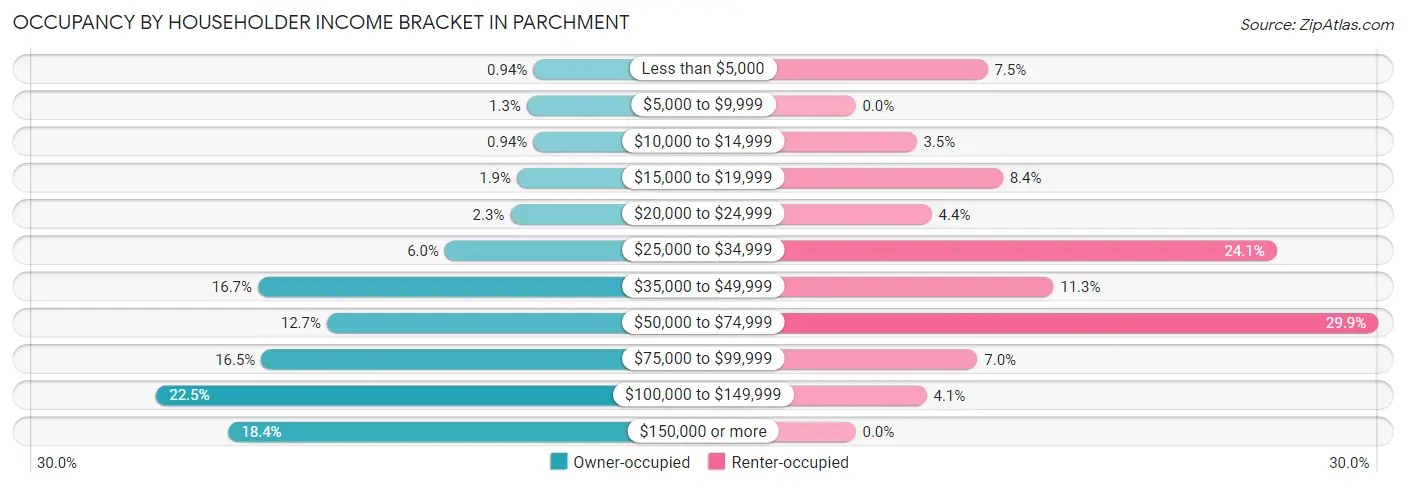
| Income Bracket | Owner-occupied | Renter-occupied |
| Less than $5,000 | 5 (0.9%) | 26 (7.5%) |
| $5,000 to $9,999 | 7 (1.3%) | 0 (0.0%) |
| $10,000 to $14,999 | 5 (0.9%) | 12 (3.5%) |
| $15,000 to $19,999 | 10 (1.9%) | 29 (8.4%) |
| $20,000 to $24,999 | 12 (2.2%) | 15 (4.3%) |
| $25,000 to $34,999 | 32 (6.0%) | 83 (24.1%) |
| $35,000 to $49,999 | 89 (16.7%) | 39 (11.3%) |
| $50,000 to $74,999 | 68 (12.7%) | 103 (29.9%) |
| $75,000 to $99,999 | 88 (16.5%) | 24 (7.0%) |
| $100,000 to $149,999 | 120 (22.5%) | 14 (4.1%) |
| $150,000 or more | 98 (18.3%) | 0 (0.0%) |
| Total | 534 (100.0%) | 345 (100.0%) |
Monthly Housing Cost Tiers in Parchment
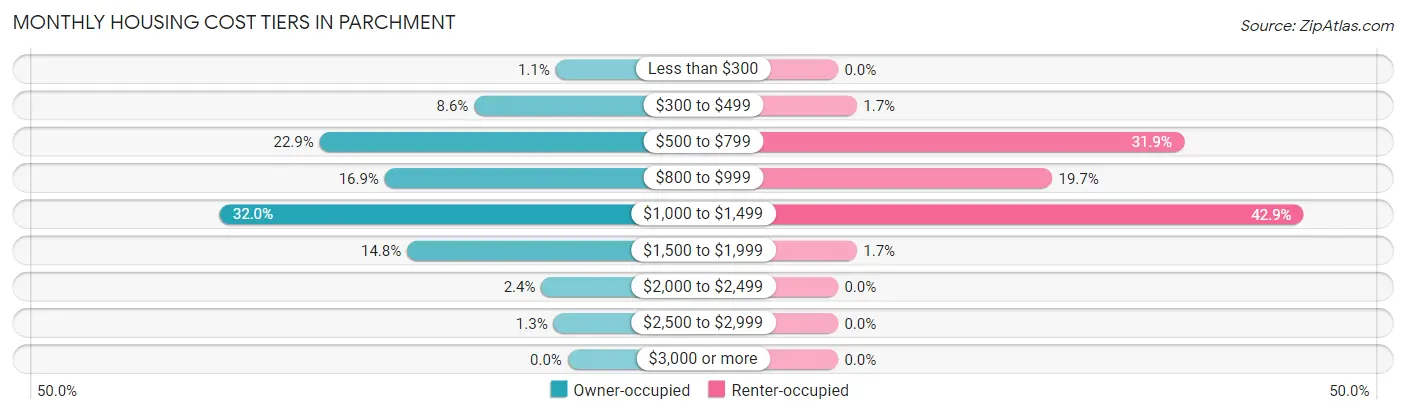
| Monthly Cost | Owner-occupied | Renter-occupied |
| Less than $300 | 6 (1.1%) | 0 (0.0%) |
| $300 to $499 | 46 (8.6%) | 6 (1.7%) |
| $500 to $799 | 122 (22.9%) | 110 (31.9%) |
| $800 to $999 | 90 (16.9%) | 68 (19.7%) |
| $1,000 to $1,499 | 171 (32.0%) | 148 (42.9%) |
| $1,500 to $1,999 | 79 (14.8%) | 6 (1.7%) |
| $2,000 to $2,499 | 13 (2.4%) | 0 (0.0%) |
| $2,500 to $2,999 | 7 (1.3%) | 0 (0.0%) |
| $3,000 or more | 0 (0.0%) | 0 (0.0%) |
| Total | 534 (100.0%) | 345 (100.0%) |
Physical Housing Characteristics in Parchment
Housing Structures in Parchment
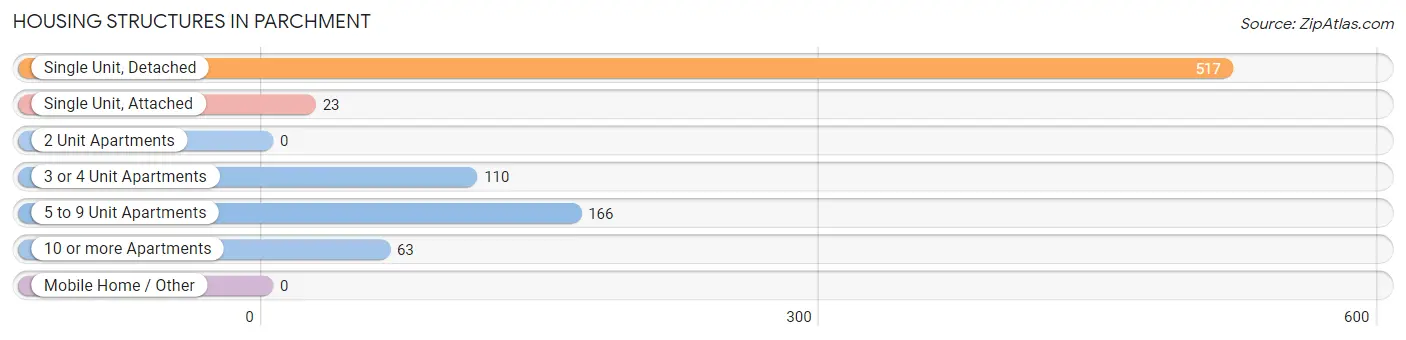
| Structure Type | # Housing Units | % Housing Units |
| Single Unit, Detached | 517 | 58.8% |
| Single Unit, Attached | 23 | 2.6% |
| 2 Unit Apartments | 0 | 0.0% |
| 3 or 4 Unit Apartments | 110 | 12.5% |
| 5 to 9 Unit Apartments | 166 | 18.9% |
| 10 or more Apartments | 63 | 7.2% |
| Mobile Home / Other | 0 | 0.0% |
| Total | 879 | 100.0% |
Housing Structures by Occupancy in Parchment
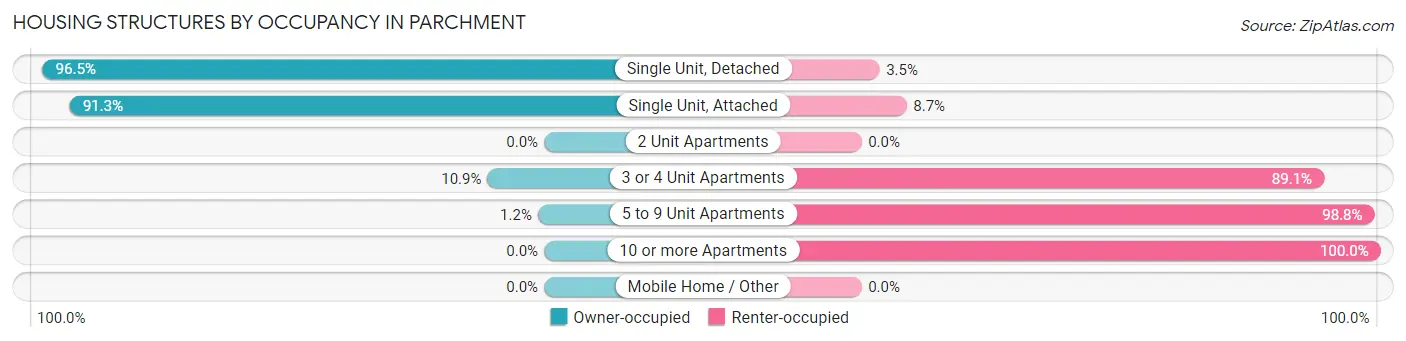
| Structure Type | Owner-occupied | Renter-occupied |
| Single Unit, Detached | 499 (96.5%) | 18 (3.5%) |
| Single Unit, Attached | 21 (91.3%) | 2 (8.7%) |
| 2 Unit Apartments | 0 (0.0%) | 0 (0.0%) |
| 3 or 4 Unit Apartments | 12 (10.9%) | 98 (89.1%) |
| 5 to 9 Unit Apartments | 2 (1.2%) | 164 (98.8%) |
| 10 or more Apartments | 0 (0.0%) | 63 (100.0%) |
| Mobile Home / Other | 0 (0.0%) | 0 (0.0%) |
| Total | 534 (60.8%) | 345 (39.3%) |
Housing Structures by Number of Rooms in Parchment
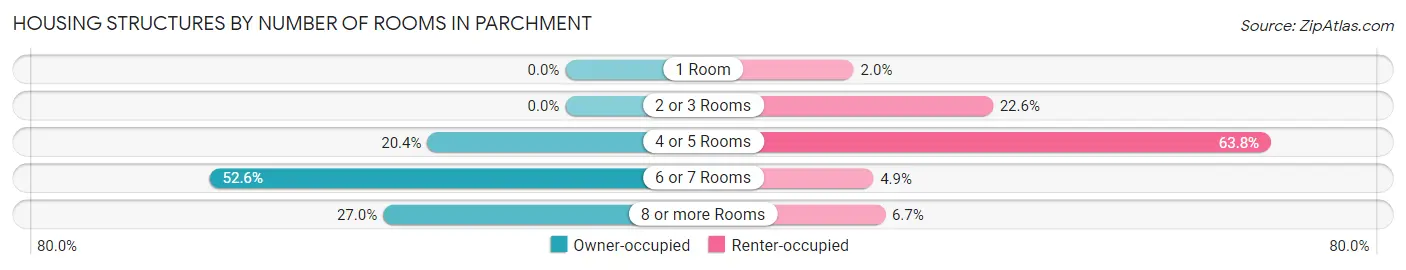
| Number of Rooms | Owner-occupied | Renter-occupied |
| 1 Room | 0 (0.0%) | 7 (2.0%) |
| 2 or 3 Rooms | 0 (0.0%) | 78 (22.6%) |
| 4 or 5 Rooms | 109 (20.4%) | 220 (63.8%) |
| 6 or 7 Rooms | 281 (52.6%) | 17 (4.9%) |
| 8 or more Rooms | 144 (27.0%) | 23 (6.7%) |
| Total | 534 (100.0%) | 345 (100.0%) |
Housing Structure by Heating Type in Parchment
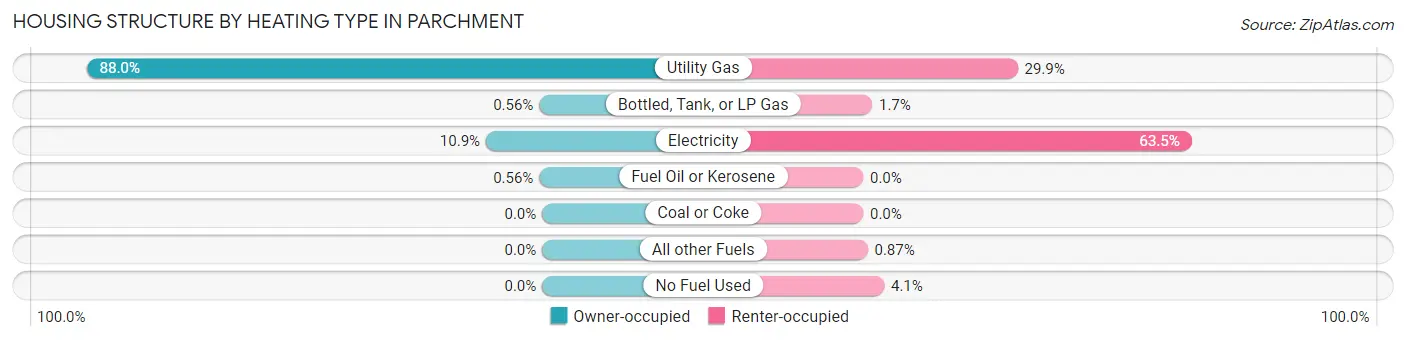
| Heating Type | Owner-occupied | Renter-occupied |
| Utility Gas | 470 (88.0%) | 103 (29.9%) |
| Bottled, Tank, or LP Gas | 3 (0.6%) | 6 (1.7%) |
| Electricity | 58 (10.9%) | 219 (63.5%) |
| Fuel Oil or Kerosene | 3 (0.6%) | 0 (0.0%) |
| Coal or Coke | 0 (0.0%) | 0 (0.0%) |
| All other Fuels | 0 (0.0%) | 3 (0.9%) |
| No Fuel Used | 0 (0.0%) | 14 (4.1%) |
| Total | 534 (100.0%) | 345 (100.0%) |
Household Vehicle Usage in Parchment
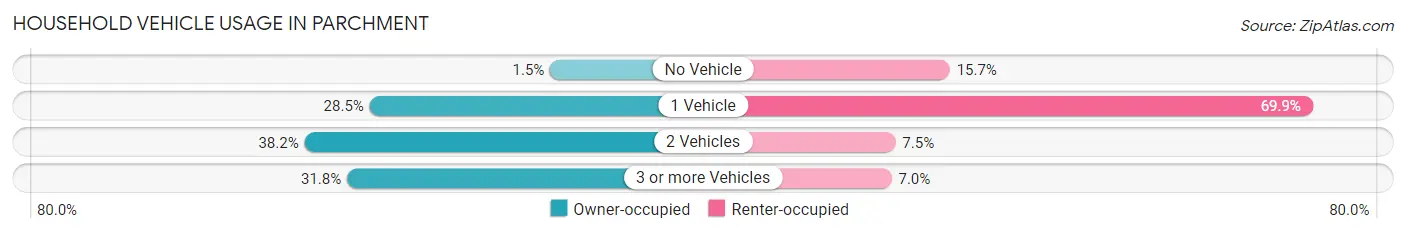
| Vehicles per Household | Owner-occupied | Renter-occupied |
| No Vehicle | 8 (1.5%) | 54 (15.7%) |
| 1 Vehicle | 152 (28.5%) | 241 (69.9%) |
| 2 Vehicles | 204 (38.2%) | 26 (7.5%) |
| 3 or more Vehicles | 170 (31.8%) | 24 (7.0%) |
| Total | 534 (100.0%) | 345 (100.0%) |
Real Estate & Mortgages in Parchment
Real Estate and Mortgage Overview in Parchment
| Characteristic | Without Mortgage | With Mortgage |
| Housing Units | 166 | 368 |
| Median Property Value | $152,000 | $160,400 |
| Median Household Income | $57,500 | $76 |
| Monthly Housing Costs | $609 | $0 |
| Real Estate Taxes | $3,190 | $13 |
Property Value by Mortgage Status in Parchment
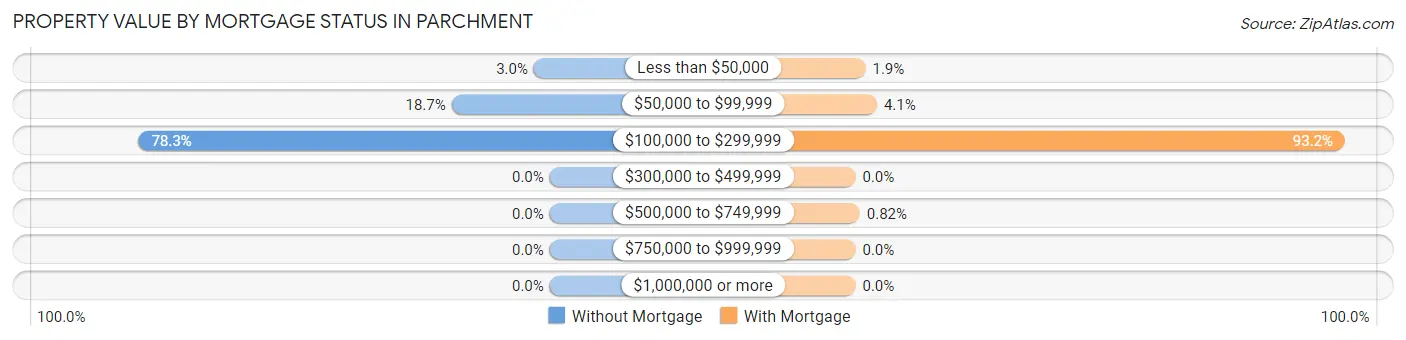
| Property Value | Without Mortgage | With Mortgage |
| Less than $50,000 | 5 (3.0%) | 7 (1.9%) |
| $50,000 to $99,999 | 31 (18.7%) | 15 (4.1%) |
| $100,000 to $299,999 | 130 (78.3%) | 343 (93.2%) |
| $300,000 to $499,999 | 0 (0.0%) | 0 (0.0%) |
| $500,000 to $749,999 | 0 (0.0%) | 3 (0.8%) |
| $750,000 to $999,999 | 0 (0.0%) | 0 (0.0%) |
| $1,000,000 or more | 0 (0.0%) | 0 (0.0%) |
| Total | 166 (100.0%) | 368 (100.0%) |
Household Income by Mortgage Status in Parchment
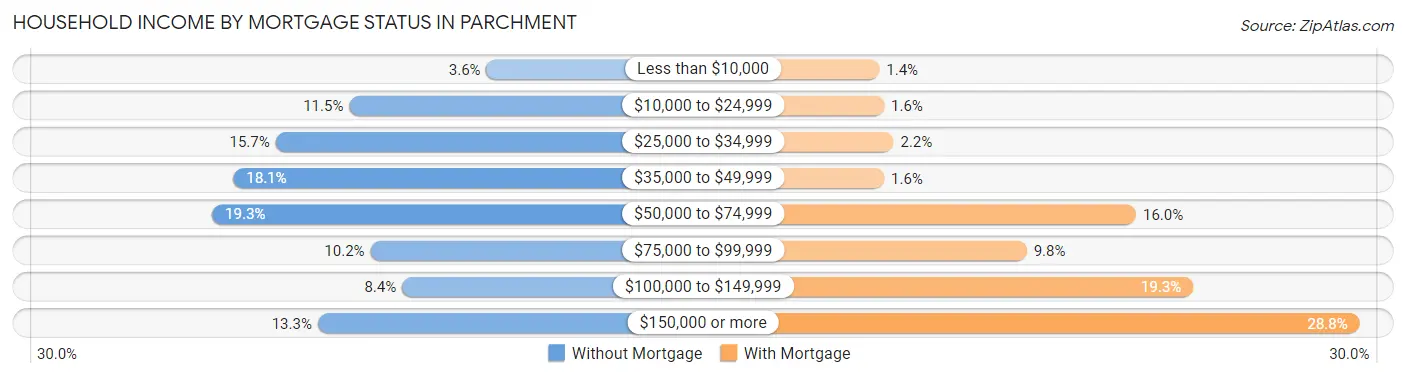
| Household Income | Without Mortgage | With Mortgage |
| Less than $10,000 | 6 (3.6%) | 5 (1.4%) |
| $10,000 to $24,999 | 19 (11.5%) | 6 (1.6%) |
| $25,000 to $34,999 | 26 (15.7%) | 8 (2.2%) |
| $35,000 to $49,999 | 30 (18.1%) | 6 (1.6%) |
| $50,000 to $74,999 | 32 (19.3%) | 59 (16.0%) |
| $75,000 to $99,999 | 17 (10.2%) | 36 (9.8%) |
| $100,000 to $149,999 | 14 (8.4%) | 71 (19.3%) |
| $150,000 or more | 22 (13.3%) | 106 (28.8%) |
| Total | 166 (100.0%) | 368 (100.0%) |
Property Value to Household Income Ratio in Parchment
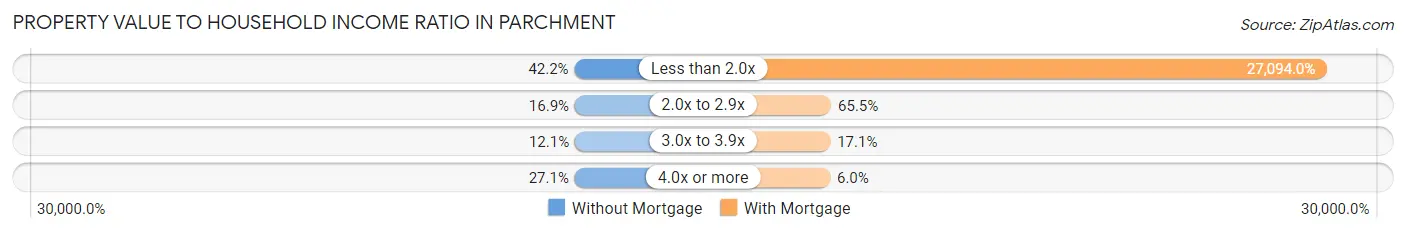
| Value-to-Income Ratio | Without Mortgage | With Mortgage |
| Less than 2.0x | 70 (42.2%) | 99,706 (27,094.0%) |
| 2.0x to 2.9x | 28 (16.9%) | 241 (65.5%) |
| 3.0x to 3.9x | 20 (12.0%) | 63 (17.1%) |
| 4.0x or more | 45 (27.1%) | 22 (6.0%) |
| Total | 166 (100.0%) | 368 (100.0%) |
Real Estate Taxes by Mortgage Status in Parchment
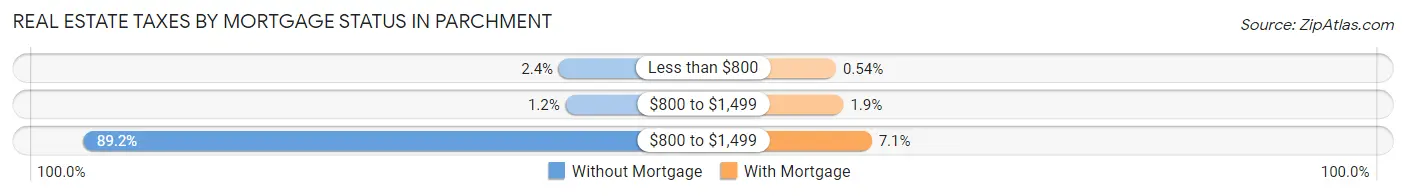
| Property Taxes | Without Mortgage | With Mortgage |
| Less than $800 | 4 (2.4%) | 2 (0.5%) |
| $800 to $1,499 | 2 (1.2%) | 7 (1.9%) |
| $800 to $1,499 | 148 (89.2%) | 26 (7.1%) |
| Total | 166 (100.0%) | 368 (100.0%) |
Health & Disability in Parchment
Health Insurance Coverage by Age in Parchment
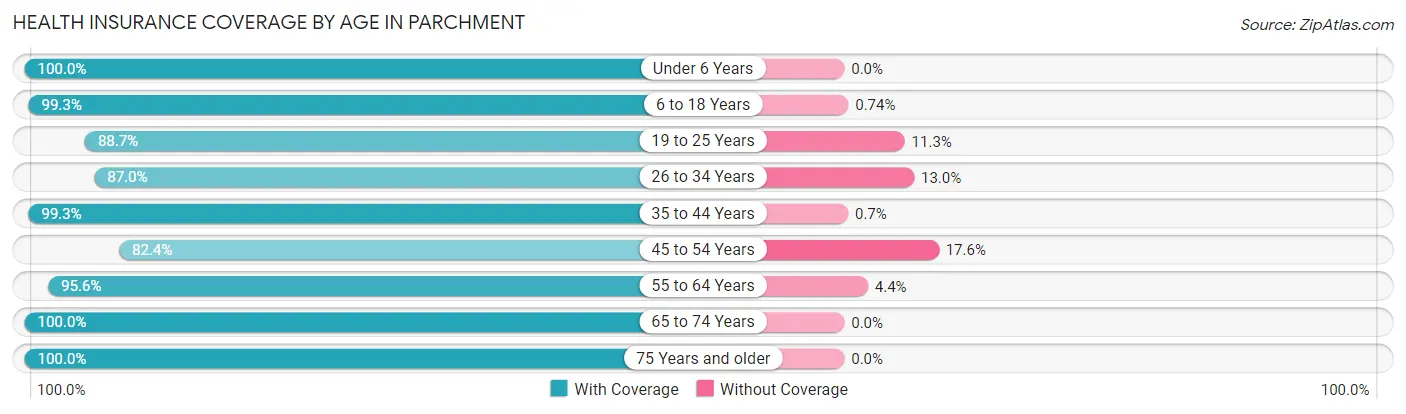
| Age Bracket | With Coverage | Without Coverage |
| Under 6 Years | 163 (100.0%) | 0 (0.0%) |
| 6 to 18 Years | 267 (99.3%) | 2 (0.7%) |
| 19 to 25 Years | 268 (88.7%) | 34 (11.3%) |
| 26 to 34 Years | 368 (87.0%) | 55 (13.0%) |
| 35 to 44 Years | 282 (99.3%) | 2 (0.7%) |
| 45 to 54 Years | 145 (82.4%) | 31 (17.6%) |
| 55 to 64 Years | 196 (95.6%) | 9 (4.4%) |
| 65 to 74 Years | 109 (100.0%) | 0 (0.0%) |
| 75 Years and older | 110 (100.0%) | 0 (0.0%) |
| Total | 1,908 (93.5%) | 133 (6.5%) |
Health Insurance Coverage by Citizenship Status in Parchment
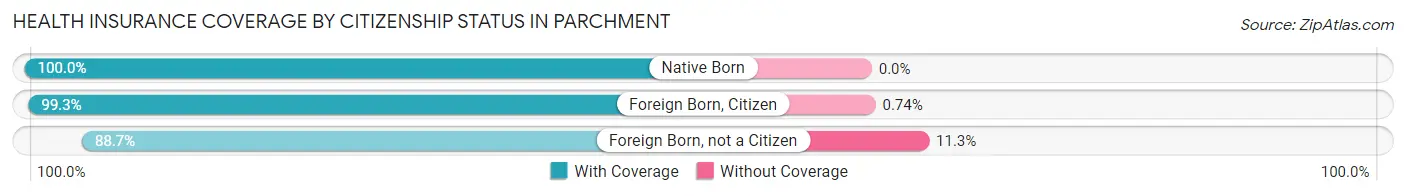
| Citizenship Status | With Coverage | Without Coverage |
| Native Born | 163 (100.0%) | 0 (0.0%) |
| Foreign Born, Citizen | 267 (99.3%) | 2 (0.7%) |
| Foreign Born, not a Citizen | 268 (88.7%) | 34 (11.3%) |
Health Insurance Coverage by Household Income in Parchment
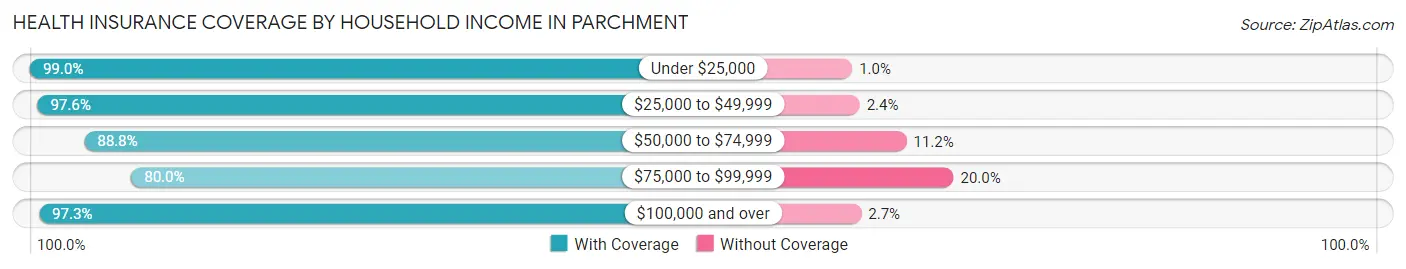
| Household Income | With Coverage | Without Coverage |
| Under $25,000 | 194 (99.0%) | 2 (1.0%) |
| $25,000 to $49,999 | 483 (97.6%) | 12 (2.4%) |
| $50,000 to $74,999 | 373 (88.8%) | 47 (11.2%) |
| $75,000 to $99,999 | 216 (80.0%) | 54 (20.0%) |
| $100,000 and over | 642 (97.3%) | 18 (2.7%) |
Public vs Private Health Insurance Coverage by Age in Parchment
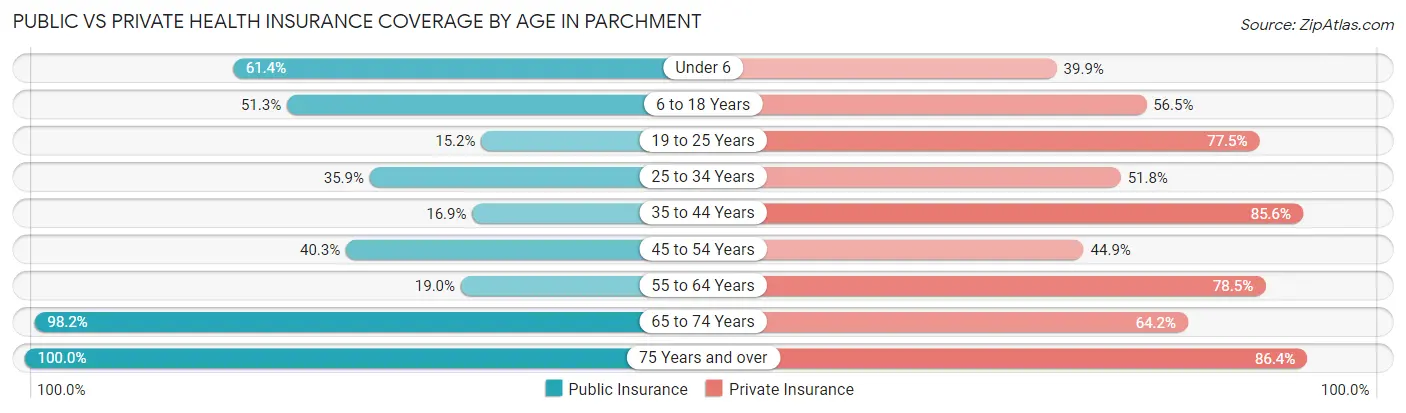
| Age Bracket | Public Insurance | Private Insurance |
| Under 6 | 100 (61.4%) | 65 (39.9%) |
| 6 to 18 Years | 138 (51.3%) | 152 (56.5%) |
| 19 to 25 Years | 46 (15.2%) | 234 (77.5%) |
| 25 to 34 Years | 152 (35.9%) | 219 (51.8%) |
| 35 to 44 Years | 48 (16.9%) | 243 (85.6%) |
| 45 to 54 Years | 71 (40.3%) | 79 (44.9%) |
| 55 to 64 Years | 39 (19.0%) | 161 (78.5%) |
| 65 to 74 Years | 107 (98.2%) | 70 (64.2%) |
| 75 Years and over | 110 (100.0%) | 95 (86.4%) |
| Total | 811 (39.7%) | 1,318 (64.6%) |
Disability Status by Sex by Age in Parchment
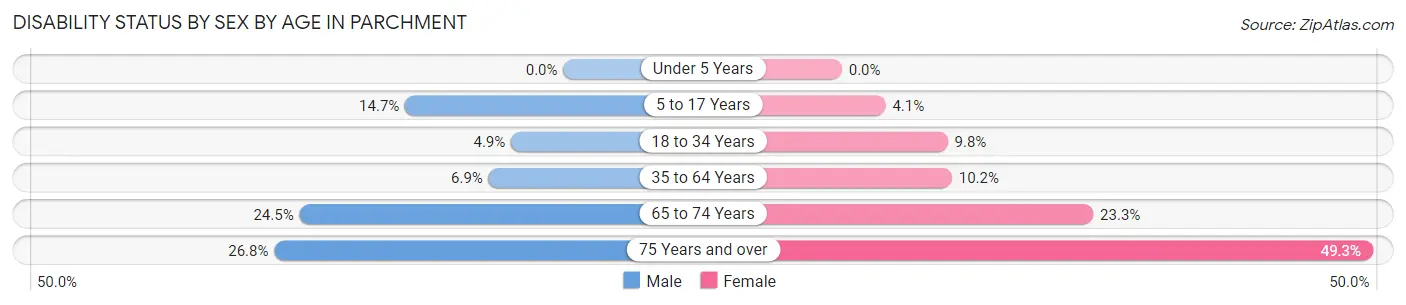
| Age Bracket | Male | Female |
| Under 5 Years | 0 (0.0%) | 0 (0.0%) |
| 5 to 17 Years | 16 (14.7%) | 7 (4.1%) |
| 18 to 34 Years | 15 (4.9%) | 43 (9.8%) |
| 35 to 64 Years | 23 (6.9%) | 34 (10.2%) |
| 65 to 74 Years | 12 (24.5%) | 14 (23.3%) |
| 75 Years and over | 11 (26.8%) | 34 (49.3%) |
Disability Class by Sex by Age in Parchment
Disability Class: Hearing Difficulty
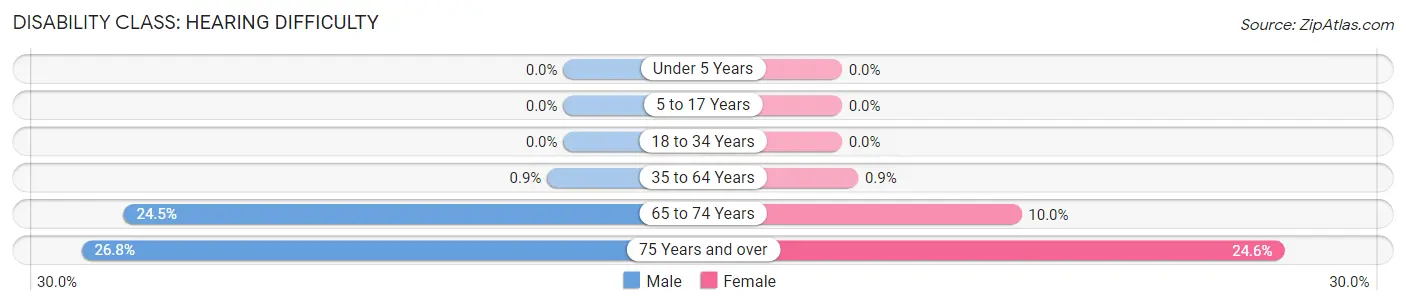
| Age Bracket | Male | Female |
| Under 5 Years | 0 (0.0%) | 0 (0.0%) |
| 5 to 17 Years | 0 (0.0%) | 0 (0.0%) |
| 18 to 34 Years | 0 (0.0%) | 0 (0.0%) |
| 35 to 64 Years | 3 (0.9%) | 3 (0.9%) |
| 65 to 74 Years | 12 (24.5%) | 6 (10.0%) |
| 75 Years and over | 11 (26.8%) | 17 (24.6%) |
Disability Class: Vision Difficulty
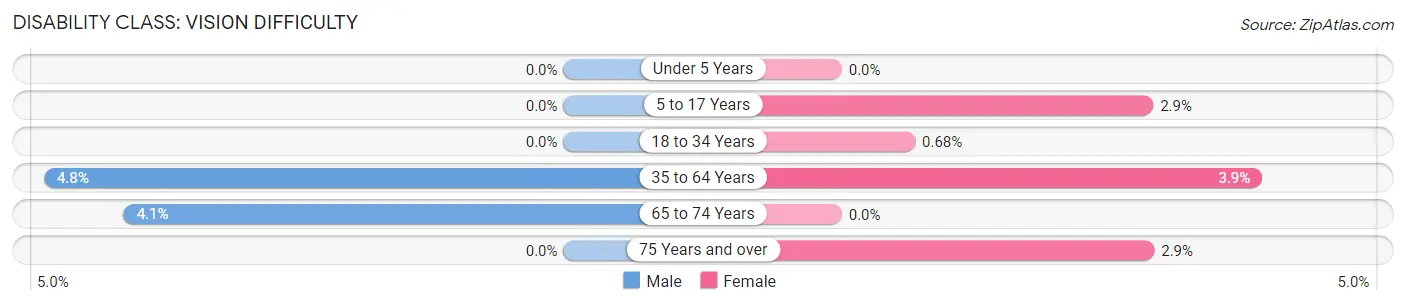
| Age Bracket | Male | Female |
| Under 5 Years | 0 (0.0%) | 0 (0.0%) |
| 5 to 17 Years | 0 (0.0%) | 5 (2.9%) |
| 18 to 34 Years | 0 (0.0%) | 3 (0.7%) |
| 35 to 64 Years | 16 (4.8%) | 13 (3.9%) |
| 65 to 74 Years | 2 (4.1%) | 0 (0.0%) |
| 75 Years and over | 0 (0.0%) | 2 (2.9%) |
Disability Class: Cognitive Difficulty
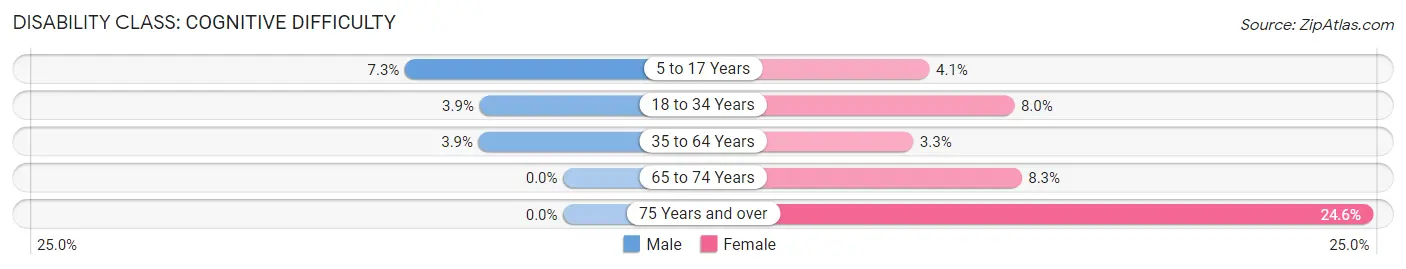
| Age Bracket | Male | Female |
| 5 to 17 Years | 8 (7.3%) | 7 (4.1%) |
| 18 to 34 Years | 12 (3.9%) | 35 (8.0%) |
| 35 to 64 Years | 13 (3.9%) | 11 (3.3%) |
| 65 to 74 Years | 0 (0.0%) | 5 (8.3%) |
| 75 Years and over | 0 (0.0%) | 17 (24.6%) |
Disability Class: Ambulatory Difficulty
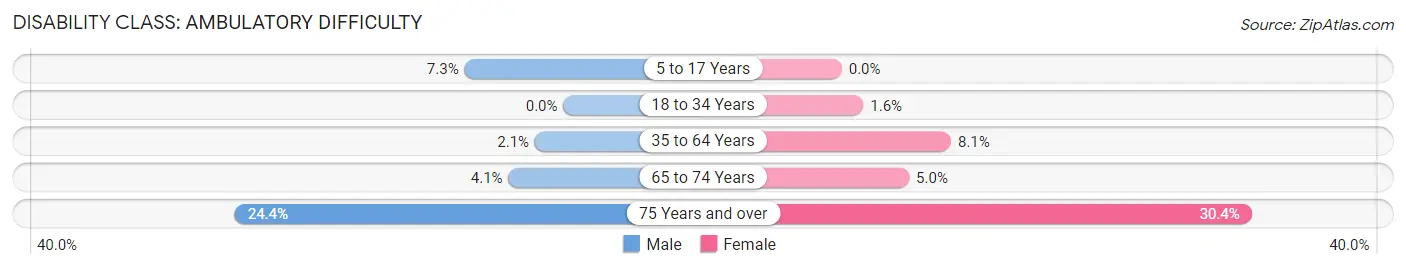
| Age Bracket | Male | Female |
| 5 to 17 Years | 8 (7.3%) | 0 (0.0%) |
| 18 to 34 Years | 0 (0.0%) | 7 (1.6%) |
| 35 to 64 Years | 7 (2.1%) | 27 (8.1%) |
| 65 to 74 Years | 2 (4.1%) | 3 (5.0%) |
| 75 Years and over | 10 (24.4%) | 21 (30.4%) |
Disability Class: Self-Care Difficulty
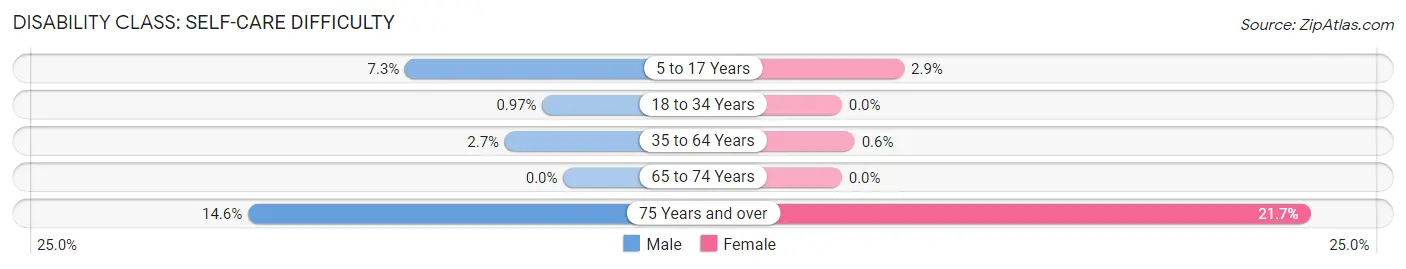
| Age Bracket | Male | Female |
| 5 to 17 Years | 8 (7.3%) | 5 (2.9%) |
| 18 to 34 Years | 3 (1.0%) | 0 (0.0%) |
| 35 to 64 Years | 9 (2.7%) | 2 (0.6%) |
| 65 to 74 Years | 0 (0.0%) | 0 (0.0%) |
| 75 Years and over | 6 (14.6%) | 15 (21.7%) |
Technology Access in Parchment
Computing Device Access in Parchment
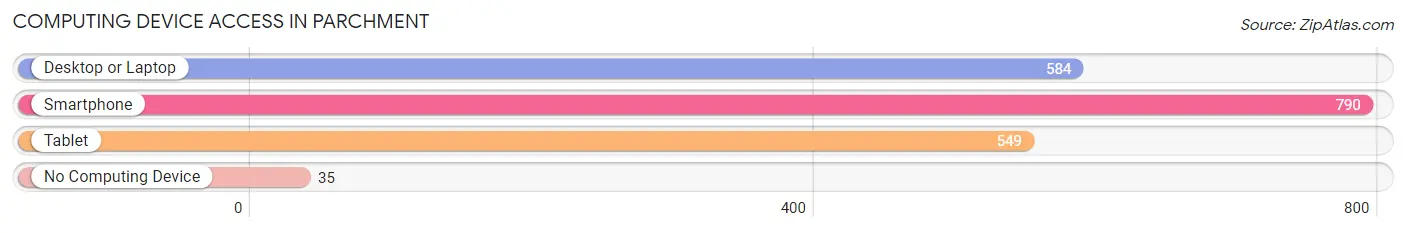
| Device Type | # Households | % Households |
| Desktop or Laptop | 584 | 66.4% |
| Smartphone | 790 | 89.9% |
| Tablet | 549 | 62.5% |
| No Computing Device | 35 | 4.0% |
| Total | 879 | 100.0% |
Internet Access in Parchment
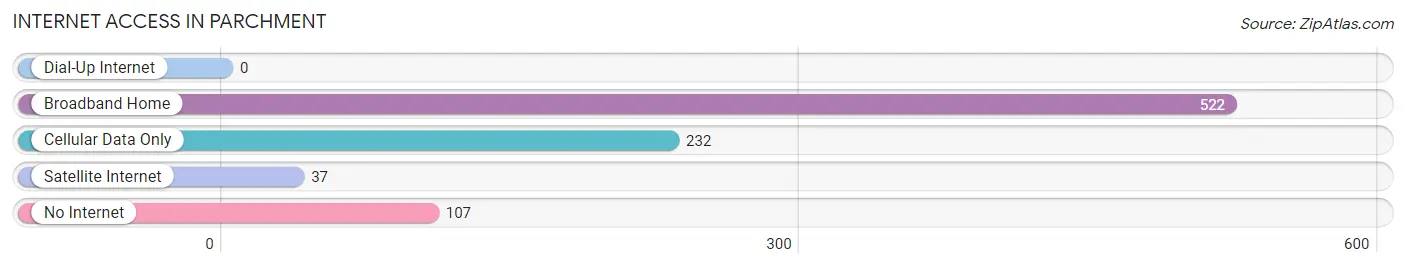
| Internet Type | # Households | % Households |
| Dial-Up Internet | 0 | 0.0% |
| Broadband Home | 522 | 59.4% |
| Cellular Data Only | 232 | 26.4% |
| Satellite Internet | 37 | 4.2% |
| No Internet | 107 | 12.2% |
| Total | 879 | 100.0% |
Parchment Summary
Parchment, Michigan is a small city located in Kalamazoo County, Michigan. It is situated on the Kalamazoo River, approximately five miles north of the city of Kalamazoo. The city has a population of approximately 3,000 people and is part of the Kalamazoo-Portage Metropolitan Statistical Area.
Geography
Parchment is located in southwestern Michigan, approximately five miles north of the city of Kalamazoo. The city is situated on the Kalamazoo River, which flows through the city from east to west. The city is bordered by the cities of Kalamazoo to the south, Comstock to the west, and Cooper to the north. The city is located in a flat, low-lying area, with an elevation of approximately 830 feet above sea level.
The climate in Parchment is classified as humid continental, with hot, humid summers and cold, snowy winters. The average annual temperature is approximately 50 degrees Fahrenheit, with average highs in the summer reaching into the mid-80s and average lows in the winter dipping into the mid-20s. The average annual precipitation is approximately 33 inches, with most of the precipitation occurring in the spring and summer months.
Economy
The economy of Parchment is largely based on manufacturing and retail. The city is home to several manufacturing companies, including Parchment Paper Company, which produces paper products, and Parchment Products, which produces plastic products. The city is also home to several retail stores, including a grocery store, a hardware store, and several clothing stores.
The city is also home to several small businesses, including restaurants, bars, and other service-oriented businesses. The city is also home to several medical facilities, including a hospital and several clinics.
Demographics
As of the 2010 census, the population of Parchment was 3,180. The racial makeup of the city was 94.3% White, 1.2% African American, 0.3% Native American, 0.7% Asian, 0.1% Pacific Islander, 1.2% from other races, and 2.3% from two or more races. Hispanic or Latino of any race were 3.2% of the population.
The median household income in Parchment was $41,944, and the median family income was $50,917. The per capita income for the city was $20,845. About 11.2% of families and 14.2% of the population were below the poverty line, including 19.2% of those under age 18 and 8.2% of those age 65 or over.
Conclusion
Parchment, Michigan is a small city located in Kalamazoo County, Michigan. It is situated on the Kalamazoo River, approximately five miles north of the city of Kalamazoo. The city has a population of approximately 3,000 people and is part of the Kalamazoo-Portage Metropolitan Statistical Area. The economy of Parchment is largely based on manufacturing and retail, and the city is home to several small businesses, including restaurants, bars, and other service-oriented businesses. The racial makeup of the city is 94.3% White, 1.2% African American, 0.3% Native American, 0.7% Asian, 0.1% Pacific Islander, 1.2% from other races, and 2.3% from two or more races. The median household income in Parchment was $41,944, and the median family income was $50,917. The per capita income for the city was $20,845.
Common Questions
What is Per Capita Income in Parchment?
Per Capita income in Parchment is $32,991.
What is the Median Family Income in Parchment?
Median Family Income in Parchment is $60,938.
What is the Median Household income in Parchment?
Median Household Income in Parchment is $60,223.
What is Income or Wage Gap in Parchment?
Income or Wage Gap in Parchment is 28.4%.
Women in Parchment earn 71.6 cents for every dollar earned by a man.
What is Inequality or Gini Index in Parchment?
Inequality or Gini Index in Parchment is 0.39.
What is the Total Population of Parchment?
Total Population of Parchment is 2,041.
What is the Total Male Population of Parchment?
Total Male Population of Parchment is 955.
What is the Total Female Population of Parchment?
Total Female Population of Parchment is 1,086.
What is the Ratio of Males per 100 Females in Parchment?
There are 87.94 Males per 100 Females in Parchment.
What is the Ratio of Females per 100 Males in Parchment?
There are 113.72 Females per 100 Males in Parchment.
What is the Median Population Age in Parchment?
Median Population Age in Parchment is 31.0 Years.
What is the Average Family Size in Parchment
Average Family Size in Parchment is 2.7 People.
What is the Average Household Size in Parchment
Average Household Size in Parchment is 2.3 People.
How Large is the Labor Force in Parchment?
There are 1,194 People in the Labor Forcein in Parchment.
What is the Percentage of People in the Labor Force in Parchment?
71.0% of People are in the Labor Force in Parchment.
What is the Unemployment Rate in Parchment?
Unemployment Rate in Parchment is 8.4%.