Owosso, MI Map & Demographics
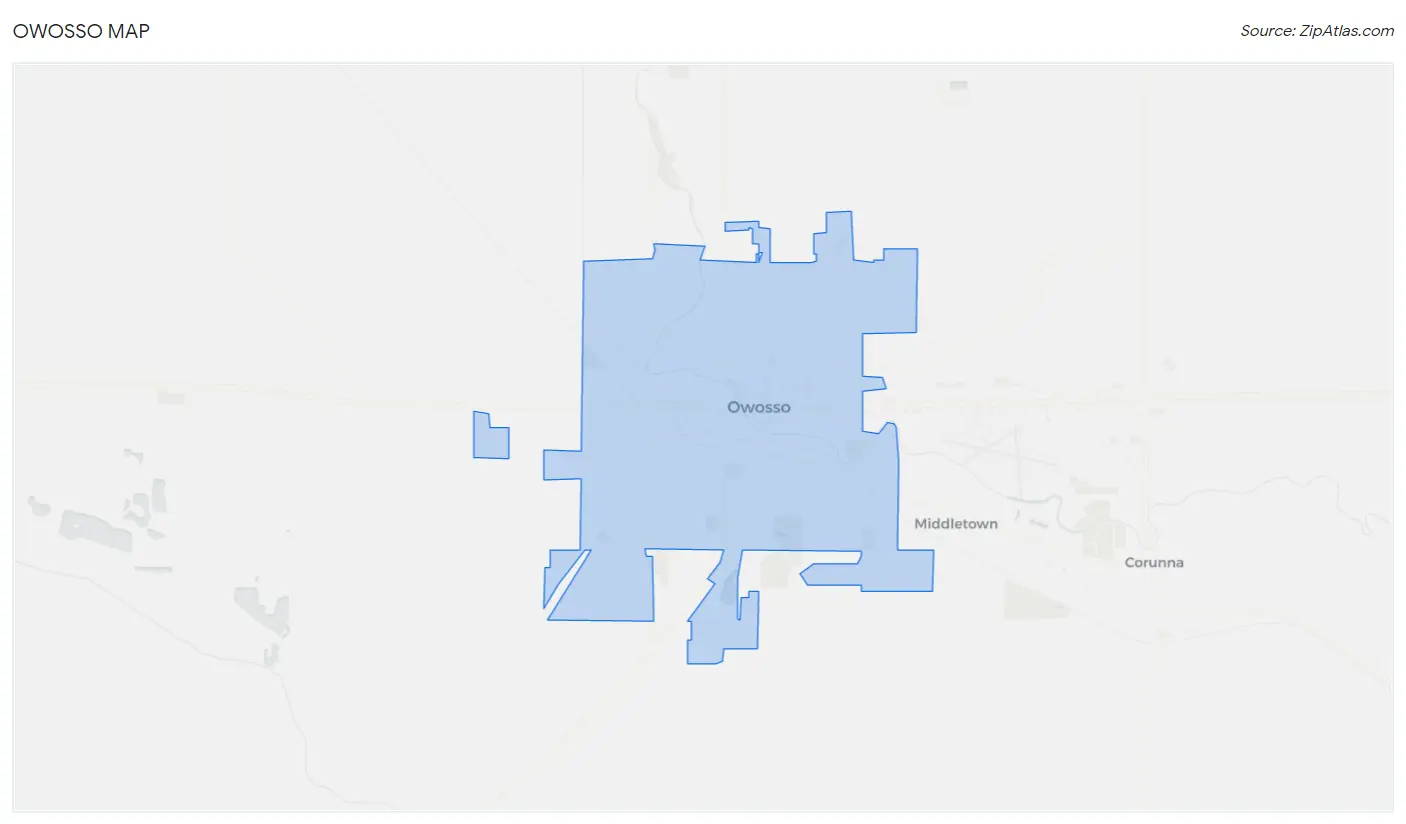
Owosso Map
Owosso Overview
$30,837
PER CAPITA INCOME
$63,804
AVG FAMILY INCOME
$51,794
AVG HOUSEHOLD INCOME
26.2%
WAGE / INCOME GAP [ % ]
73.8¢/ $1
WAGE / INCOME GAP [ $ ]
$8,503
FAMILY INCOME DEFICIT
0.45
INEQUALITY / GINI INDEX
14,678
TOTAL POPULATION
7,111
MALE POPULATION
7,567
FEMALE POPULATION
93.97
MALES / 100 FEMALES
106.41
FEMALES / 100 MALES
37.2
MEDIAN AGE
3.0
AVG FAMILY SIZE
2.3
AVG HOUSEHOLD SIZE
7,776
LABOR FORCE [ PEOPLE ]
65.4%
PERCENT IN LABOR FORCE
4.5%
UNEMPLOYMENT RATE
Owosso Zip Codes
Owosso Area Codes
Income in Owosso
Income Overview in Owosso
Per Capita Income in Owosso is $30,837, while median incomes of families and households are $63,804 and $51,794 respectively.
| Characteristic | Number | Measure |
| Per Capita Income | 14,678 | $30,837 |
| Median Family Income | 3,534 | $63,804 |
| Mean Family Income | 3,534 | $88,879 |
| Median Household Income | 6,307 | $51,794 |
| Mean Household Income | 6,307 | $69,170 |
| Income Deficit | 3,534 | $8,503 |
| Wage / Income Gap (%) | 14,678 | 26.19% |
| Wage / Income Gap ($) | 14,678 | 73.81¢ per $1 |
| Gini / Inequality Index | 14,678 | 0.45 |
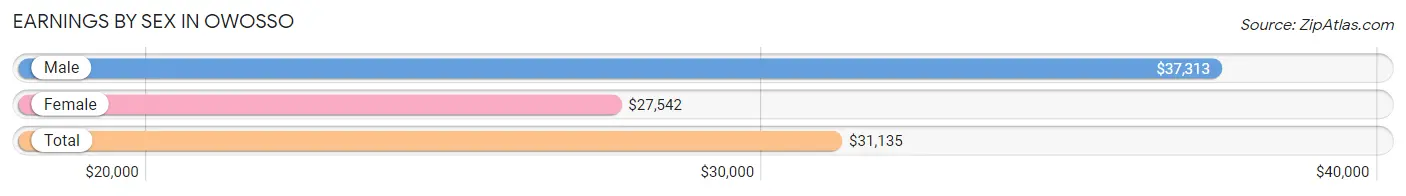
Earnings by Sex in Owosso
Average Earnings in Owosso are $31,135, $37,313 for men and $27,542 for women, a difference of 26.2%.
| Sex | Number | Average Earnings |
| Male | 4,116 (51.9%) | $37,313 |
| Female | 3,811 (48.1%) | $27,542 |
| Total | 7,927 (100.0%) | $31,135 |
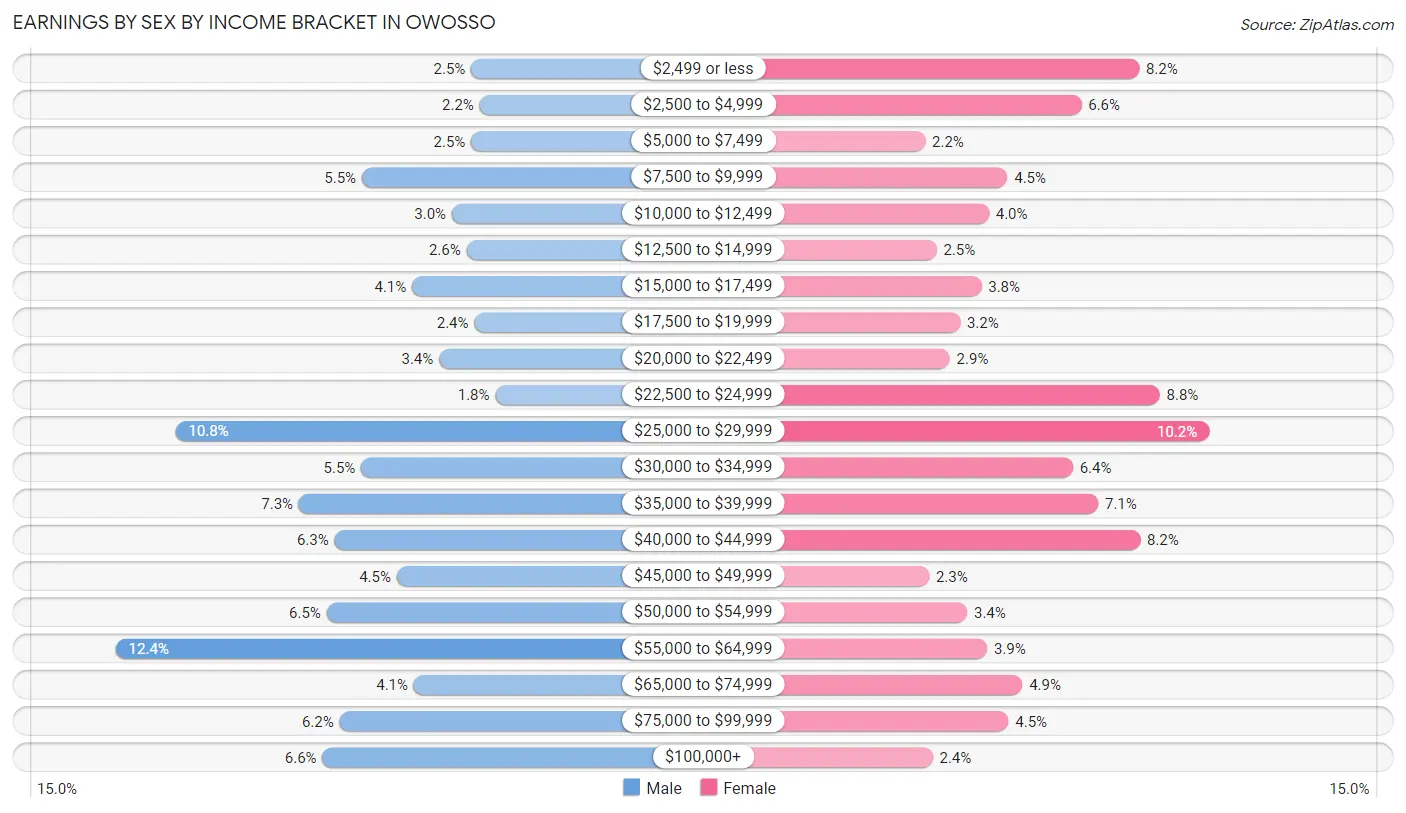
Earnings by Sex by Income Bracket in Owosso
The most common earnings brackets in Owosso are $55,000 to $64,999 for men (512 | 12.4%) and $25,000 to $29,999 for women (388 | 10.2%).
| Income | Male | Female |
| $2,499 or less | 101 (2.5%) | 313 (8.2%) |
| $2,500 to $4,999 | 91 (2.2%) | 251 (6.6%) |
| $5,000 to $7,499 | 101 (2.5%) | 84 (2.2%) |
| $7,500 to $9,999 | 227 (5.5%) | 172 (4.5%) |
| $10,000 to $12,499 | 123 (3.0%) | 152 (4.0%) |
| $12,500 to $14,999 | 106 (2.6%) | 96 (2.5%) |
| $15,000 to $17,499 | 169 (4.1%) | 144 (3.8%) |
| $17,500 to $19,999 | 97 (2.4%) | 121 (3.2%) |
| $20,000 to $22,499 | 138 (3.4%) | 110 (2.9%) |
| $22,500 to $24,999 | 73 (1.8%) | 335 (8.8%) |
| $25,000 to $29,999 | 443 (10.8%) | 388 (10.2%) |
| $30,000 to $34,999 | 228 (5.5%) | 242 (6.4%) |
| $35,000 to $39,999 | 300 (7.3%) | 269 (7.1%) |
| $40,000 to $44,999 | 259 (6.3%) | 314 (8.2%) |
| $45,000 to $49,999 | 187 (4.5%) | 88 (2.3%) |
| $50,000 to $54,999 | 268 (6.5%) | 129 (3.4%) |
| $55,000 to $64,999 | 512 (12.4%) | 150 (3.9%) |
| $65,000 to $74,999 | 167 (4.1%) | 188 (4.9%) |
| $75,000 to $99,999 | 253 (6.1%) | 173 (4.5%) |
| $100,000+ | 273 (6.6%) | 92 (2.4%) |
| Total | 4,116 (100.0%) | 3,811 (100.0%) |
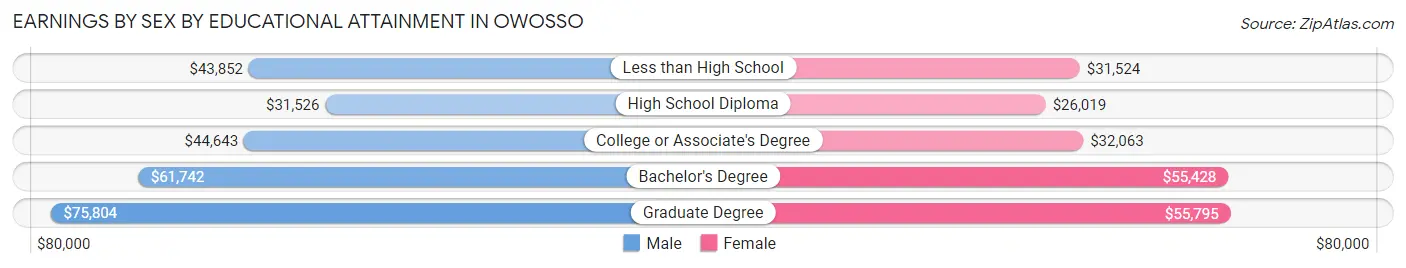
Earnings by Sex by Educational Attainment in Owosso
Average earnings in Owosso are $43,922 for men and $32,656 for women, a difference of 25.7%. Men with an educational attainment of graduate degree enjoy the highest average annual earnings of $75,804, while those with high school diploma education earn the least with $31,526. Women with an educational attainment of graduate degree earn the most with the average annual earnings of $55,795, while those with high school diploma education have the smallest earnings of $26,019.
| Educational Attainment | Male Income | Female Income |
| Less than High School | $43,852 | $31,524 |
| High School Diploma | $31,526 | $26,019 |
| College or Associate's Degree | $44,643 | $32,063 |
| Bachelor's Degree | $61,742 | $55,428 |
| Graduate Degree | $75,804 | $55,795 |
| Total | $43,922 | $32,656 |
Family Income in Owosso
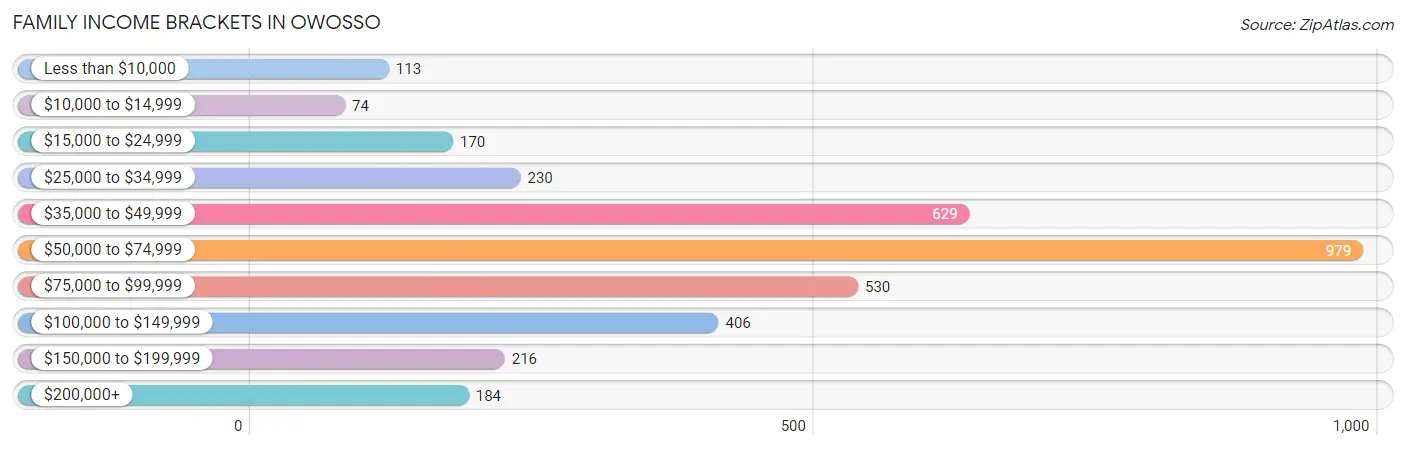
Family Income Brackets in Owosso
According to the Owosso family income data, there are 979 families falling into the $50,000 to $74,999 income range, which is the most common income bracket and makes up 27.7% of all families. Conversely, the $10,000 to $14,999 income bracket is the least frequent group with only 74 families (2.1%) belonging to this category.
| Income Bracket | # Families | % Families |
| Less than $10,000 | 113 | 3.2% |
| $10,000 to $14,999 | 74 | 2.1% |
| $15,000 to $24,999 | 170 | 4.8% |
| $25,000 to $34,999 | 230 | 6.5% |
| $35,000 to $49,999 | 629 | 17.8% |
| $50,000 to $74,999 | 979 | 27.7% |
| $75,000 to $99,999 | 530 | 15.0% |
| $100,000 to $149,999 | 406 | 11.5% |
| $150,000 to $199,999 | 216 | 6.1% |
| $200,000+ | 184 | 5.2% |
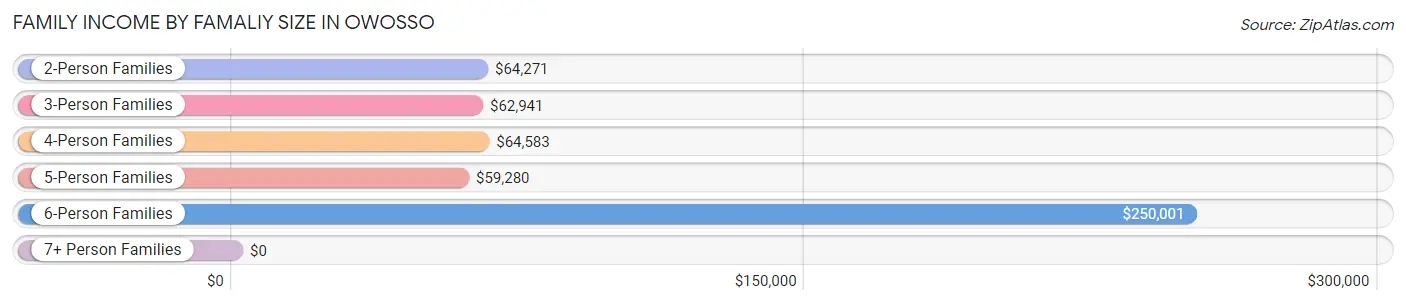
Family Income by Famaliy Size in Owosso
6-person families (68 | 1.9%) account for the highest median family income in Owosso with $250,001 per family, while 6-person families (68 | 1.9%) have the highest median income of $41,667 per family member.
| Income Bracket | # Families | Median Income |
| 2-Person Families | 1,761 (49.8%) | $64,271 |
| 3-Person Families | 934 (26.4%) | $62,941 |
| 4-Person Families | 570 (16.1%) | $64,583 |
| 5-Person Families | 166 (4.7%) | $59,280 |
| 6-Person Families | 68 (1.9%) | $250,001 |
| 7+ Person Families | 35 (1.0%) | $0 |
| Total | 3,534 (100.0%) | $63,804 |
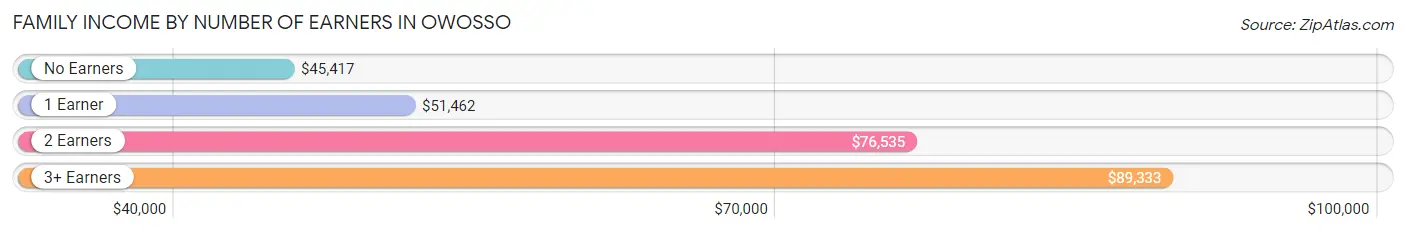
Family Income by Number of Earners in Owosso
The median family income in Owosso is $63,804, with families comprising 3+ earners (394) having the highest median family income of $89,333, while families with no earners (664) have the lowest median family income of $45,417, accounting for 11.2% and 18.8% of families, respectively.
| Number of Earners | # Families | Median Income |
| No Earners | 664 (18.8%) | $45,417 |
| 1 Earner | 1,195 (33.8%) | $51,462 |
| 2 Earners | 1,281 (36.2%) | $76,535 |
| 3+ Earners | 394 (11.2%) | $89,333 |
| Total | 3,534 (100.0%) | $63,804 |
Household Income in Owosso
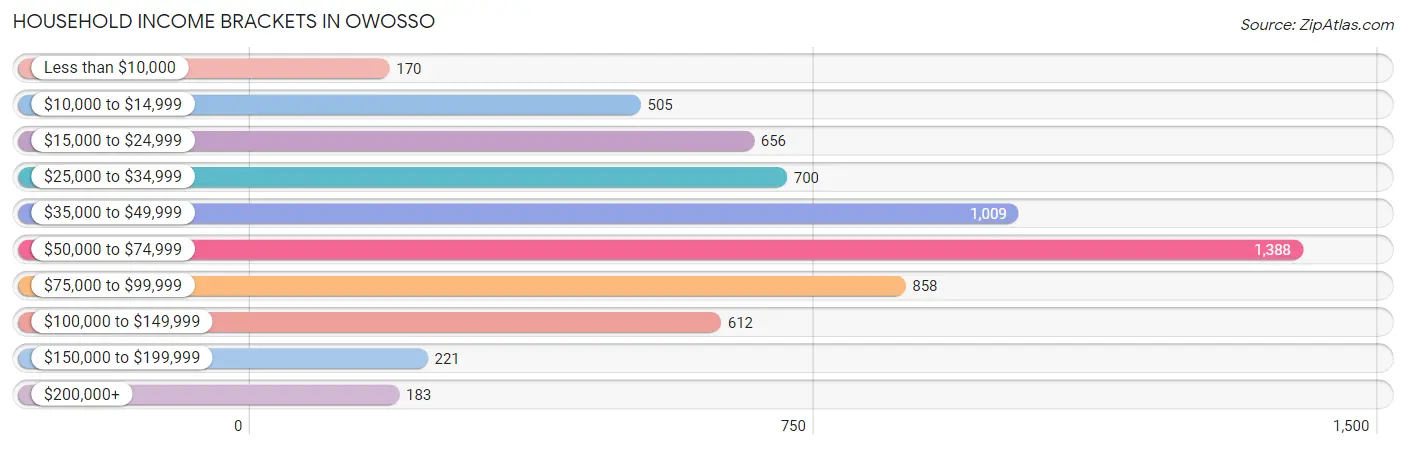
Household Income Brackets in Owosso
With 1,388 households falling in the category, the $50,000 to $74,999 income range is the most frequent in Owosso, accounting for 22.0% of all households. In contrast, only 170 households (2.7%) fall into the less than $10,000 income bracket, making it the least populous group.
| Income Bracket | # Households | % Households |
| Less than $10,000 | 170 | 2.7% |
| $10,000 to $14,999 | 505 | 8.0% |
| $15,000 to $24,999 | 656 | 10.4% |
| $25,000 to $34,999 | 700 | 11.1% |
| $35,000 to $49,999 | 1,009 | 16.0% |
| $50,000 to $74,999 | 1,388 | 22.0% |
| $75,000 to $99,999 | 858 | 13.6% |
| $100,000 to $149,999 | 612 | 9.7% |
| $150,000 to $199,999 | 221 | 3.5% |
| $200,000+ | 183 | 2.9% |
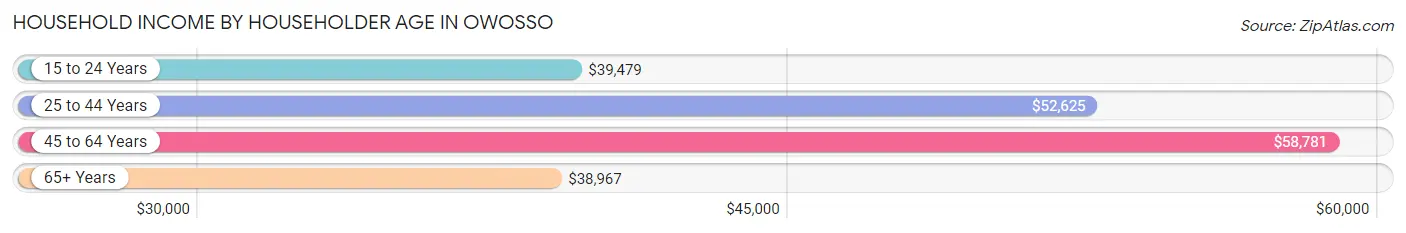
Household Income by Householder Age in Owosso
The median household income in Owosso is $51,794, with the highest median household income of $58,781 found in the 45 to 64 years age bracket for the primary householder. A total of 2,101 households (33.3%) fall into this category. Meanwhile, the 65+ years age bracket for the primary householder has the lowest median household income of $38,967, with 1,654 households (26.2%) in this group.
| Income Bracket | # Households | Median Income |
| 15 to 24 Years | 314 (5.0%) | $39,479 |
| 25 to 44 Years | 2,238 (35.5%) | $52,625 |
| 45 to 64 Years | 2,101 (33.3%) | $58,781 |
| 65+ Years | 1,654 (26.2%) | $38,967 |
| Total | 6,307 (100.0%) | $51,794 |
Poverty in Owosso
Income Below Poverty by Sex and Age in Owosso
With 12.6% poverty level for males and 13.6% for females among the residents of Owosso, 15 year old males and 35 to 44 year old females are the most vulnerable to poverty, with 40 males (80.0%) and 175 females (20.5%) in their respective age groups living below the poverty level.
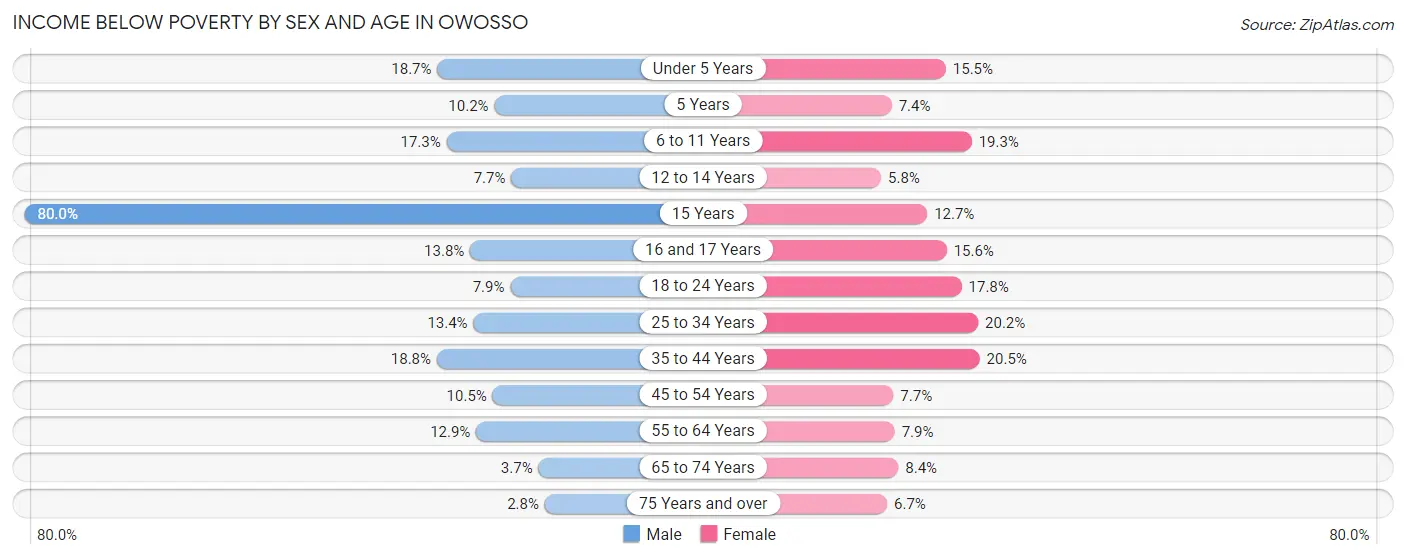
| Age Bracket | Male | Female |
| Under 5 Years | 84 (18.7%) | 59 (15.4%) |
| 5 Years | 17 (10.2%) | 6 (7.4%) |
| 6 to 11 Years | 81 (17.3%) | 120 (19.3%) |
| 12 to 14 Years | 16 (7.7%) | 13 (5.8%) |
| 15 Years | 40 (80.0%) | 9 (12.7%) |
| 16 and 17 Years | 22 (13.8%) | 31 (15.6%) |
| 18 to 24 Years | 54 (7.9%) | 142 (17.8%) |
| 25 to 34 Years | 152 (13.4%) | 220 (20.2%) |
| 35 to 44 Years | 182 (18.8%) | 175 (20.5%) |
| 45 to 54 Years | 93 (10.5%) | 57 (7.7%) |
| 55 to 64 Years | 96 (12.9%) | 85 (7.9%) |
| 65 to 74 Years | 27 (3.7%) | 61 (8.4%) |
| 75 Years and over | 8 (2.8%) | 42 (6.7%) |
| Total | 872 (12.6%) | 1,020 (13.6%) |
Income Above Poverty by Sex and Age in Owosso
According to the poverty statistics in Owosso, males aged 75 years and over and females aged 12 to 14 years are the age groups that are most secure financially, with 97.3% of males and 94.2% of females in these age groups living above the poverty line.
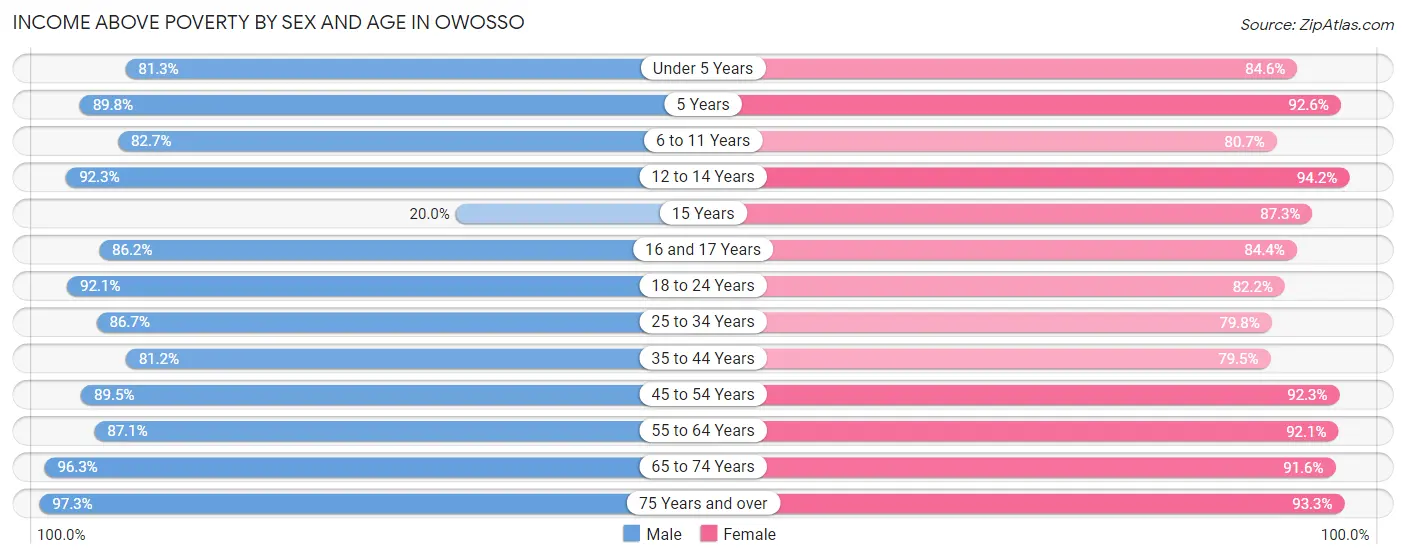
| Age Bracket | Male | Female |
| Under 5 Years | 365 (81.3%) | 323 (84.6%) |
| 5 Years | 149 (89.8%) | 75 (92.6%) |
| 6 to 11 Years | 386 (82.7%) | 502 (80.7%) |
| 12 to 14 Years | 191 (92.3%) | 210 (94.2%) |
| 15 Years | 10 (20.0%) | 62 (87.3%) |
| 16 and 17 Years | 137 (86.2%) | 168 (84.4%) |
| 18 to 24 Years | 631 (92.1%) | 656 (82.2%) |
| 25 to 34 Years | 987 (86.7%) | 867 (79.8%) |
| 35 to 44 Years | 787 (81.2%) | 680 (79.5%) |
| 45 to 54 Years | 793 (89.5%) | 687 (92.3%) |
| 55 to 64 Years | 646 (87.1%) | 996 (92.1%) |
| 65 to 74 Years | 704 (96.3%) | 665 (91.6%) |
| 75 Years and over | 283 (97.3%) | 582 (93.3%) |
| Total | 6,069 (87.4%) | 6,473 (86.4%) |
Income Below Poverty Among Married-Couple Families in Owosso
The poverty statistics for married-couple families in Owosso show that 3.1% or 68 of the total 2,198 families live below the poverty line. Families with 3 or 4 children have the highest poverty rate of 14.5%, comprising of 20 families. On the other hand, families with no children have the lowest poverty rate of 1.9%, which includes 25 families.
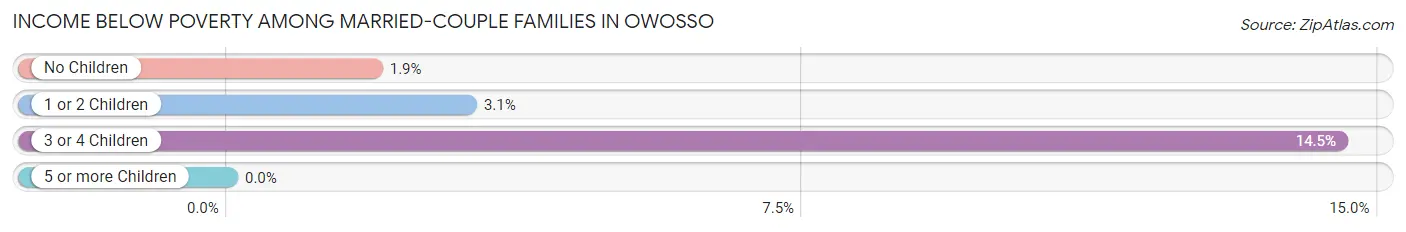
| Children | Above Poverty | Below Poverty |
| No Children | 1,298 (98.1%) | 25 (1.9%) |
| 1 or 2 Children | 714 (96.9%) | 23 (3.1%) |
| 3 or 4 Children | 118 (85.5%) | 20 (14.5%) |
| 5 or more Children | 0 (0.0%) | 0 (0.0%) |
| Total | 2,130 (96.9%) | 68 (3.1%) |
Income Below Poverty Among Single-Parent Households in Owosso
According to the poverty data in Owosso, 13.6% or 55 single-father households and 24.7% or 230 single-mother households are living below the poverty line. Among single-father households, those with no children have the highest poverty rate, with 36 households (21.6%) experiencing poverty. Likewise, among single-mother households, those with 3 or 4 children have the highest poverty rate, with 16 households (38.1%) falling below the poverty line.
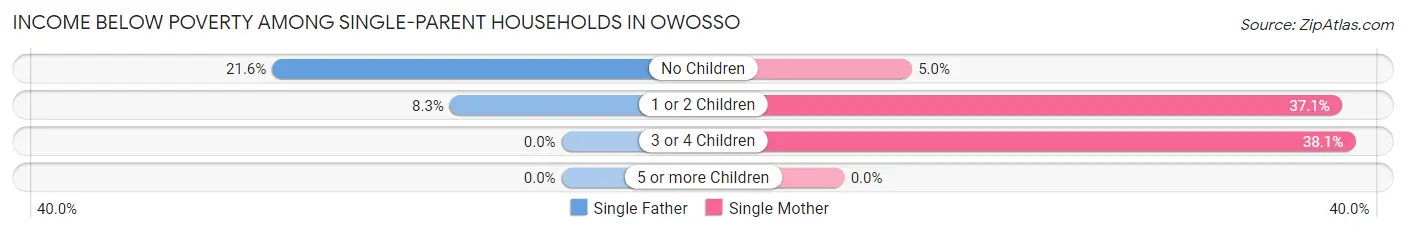
| Children | Single Father | Single Mother |
| No Children | 36 (21.6%) | 17 (5.0%) |
| 1 or 2 Children | 19 (8.3%) | 197 (37.1%) |
| 3 or 4 Children | 0 (0.0%) | 16 (38.1%) |
| 5 or more Children | 0 (0.0%) | 0 (0.0%) |
| Total | 55 (13.6%) | 230 (24.7%) |
Income Below Poverty Among Married-Couple vs Single-Parent Households in Owosso
The poverty data for Owosso shows that 68 of the married-couple family households (3.1%) and 285 of the single-parent households (21.3%) are living below the poverty level. Within the married-couple family households, those with 3 or 4 children have the highest poverty rate, with 20 households (14.5%) falling below the poverty line. Among the single-parent households, those with 3 or 4 children have the highest poverty rate, with 16 household (31.4%) living below poverty.
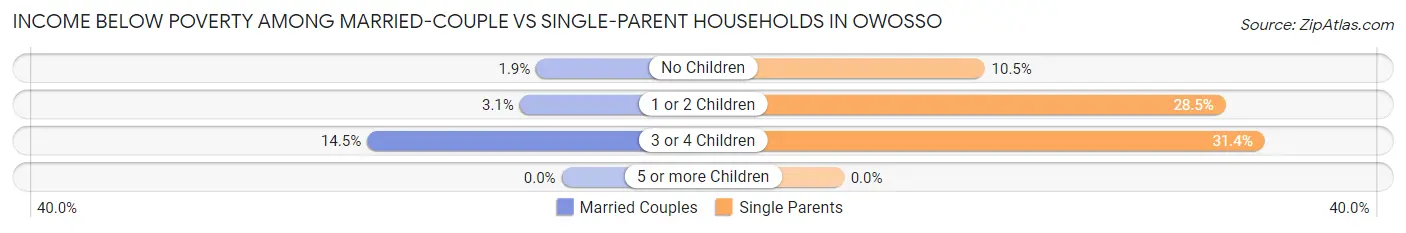
| Children | Married-Couple Families | Single-Parent Households |
| No Children | 25 (1.9%) | 53 (10.5%) |
| 1 or 2 Children | 23 (3.1%) | 216 (28.5%) |
| 3 or 4 Children | 20 (14.5%) | 16 (31.4%) |
| 5 or more Children | 0 (0.0%) | 0 (0.0%) |
| Total | 68 (3.1%) | 285 (21.3%) |
Race in Owosso
The most populous races in Owosso are White / Caucasian (13,921 | 94.8%), Hispanic or Latino (518 | 3.5%), and Two or more Races (400 | 2.7%).
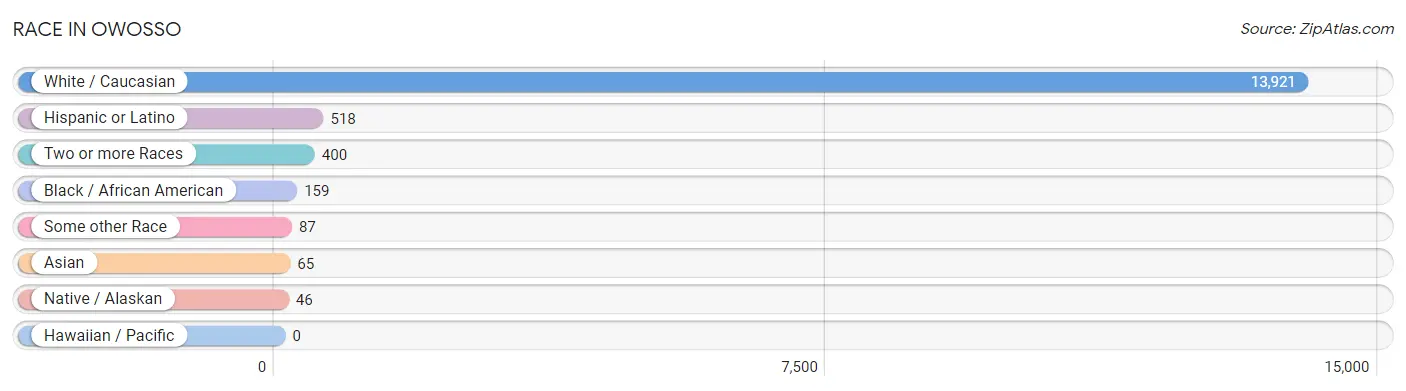
| Race | # Population | % Population |
| Asian | 65 | 0.4% |
| Black / African American | 159 | 1.1% |
| Hawaiian / Pacific | 0 | 0.0% |
| Hispanic or Latino | 518 | 3.5% |
| Native / Alaskan | 46 | 0.3% |
| White / Caucasian | 13,921 | 94.8% |
| Two or more Races | 400 | 2.7% |
| Some other Race | 87 | 0.6% |
| Total | 14,678 | 100.0% |
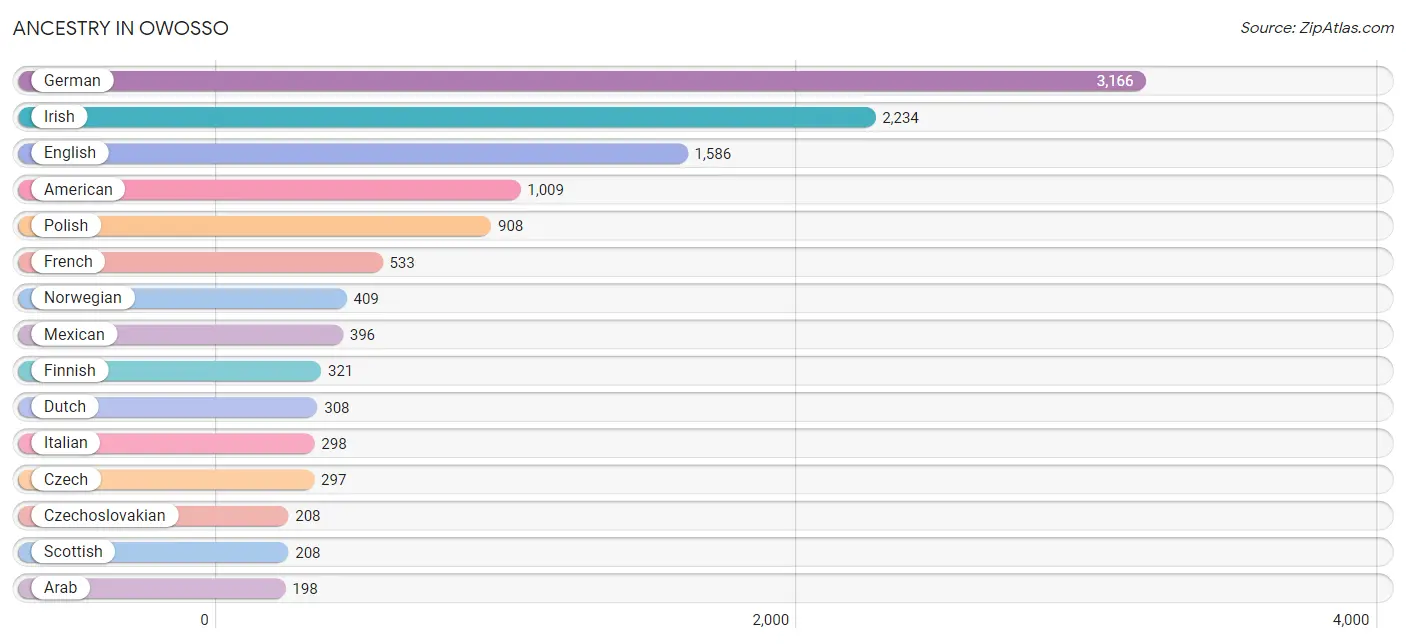
Ancestry in Owosso
The most populous ancestries reported in Owosso are German (3,166 | 21.6%), Irish (2,234 | 15.2%), English (1,586 | 10.8%), American (1,009 | 6.9%), and Polish (908 | 6.2%), together accounting for 60.7% of all Owosso residents.
| Ancestry | # Population | % Population |
| African | 99 | 0.7% |
| American | 1,009 | 6.9% |
| Apache | 40 | 0.3% |
| Arab | 198 | 1.3% |
| Austrian | 45 | 0.3% |
| Belgian | 38 | 0.3% |
| Bhutanese | 56 | 0.4% |
| Blackfeet | 14 | 0.1% |
| British | 26 | 0.2% |
| Canadian | 38 | 0.3% |
| Cherokee | 21 | 0.1% |
| Chippewa | 39 | 0.3% |
| Croatian | 10 | 0.1% |
| Czech | 297 | 2.0% |
| Czechoslovakian | 208 | 1.4% |
| Dutch | 308 | 2.1% |
| Eastern European | 27 | 0.2% |
| English | 1,586 | 10.8% |
| European | 99 | 0.7% |
| Finnish | 321 | 2.2% |
| French | 533 | 3.6% |
| French Canadian | 168 | 1.1% |
| German | 3,166 | 21.6% |
| Greek | 128 | 0.9% |
| Hungarian | 196 | 1.3% |
| Indian (Asian) | 32 | 0.2% |
| Iranian | 34 | 0.2% |
| Irish | 2,234 | 15.2% |
| Italian | 298 | 2.0% |
| Jamaican | 18 | 0.1% |
| Jordanian | 24 | 0.2% |
| Korean | 8 | 0.1% |
| Lebanese | 9 | 0.1% |
| Lumbee | 7 | 0.1% |
| Mexican | 396 | 2.7% |
| Northern European | 15 | 0.1% |
| Norwegian | 409 | 2.8% |
| Polish | 908 | 6.2% |
| Portuguese | 3 | 0.0% |
| Puerto Rican | 29 | 0.2% |
| Russian | 33 | 0.2% |
| Scandinavian | 43 | 0.3% |
| Scotch-Irish | 64 | 0.4% |
| Scottish | 208 | 1.4% |
| Slovak | 34 | 0.2% |
| South American | 34 | 0.2% |
| Spaniard | 14 | 0.1% |
| Sri Lankan | 37 | 0.3% |
| Subsaharan African | 99 | 0.7% |
| Swedish | 160 | 1.1% |
| Thai | 3 | 0.0% |
| Turkish | 34 | 0.2% |
| Ukrainian | 59 | 0.4% |
| Welsh | 52 | 0.4% | View All 54 Rows |
Immigrants in Owosso
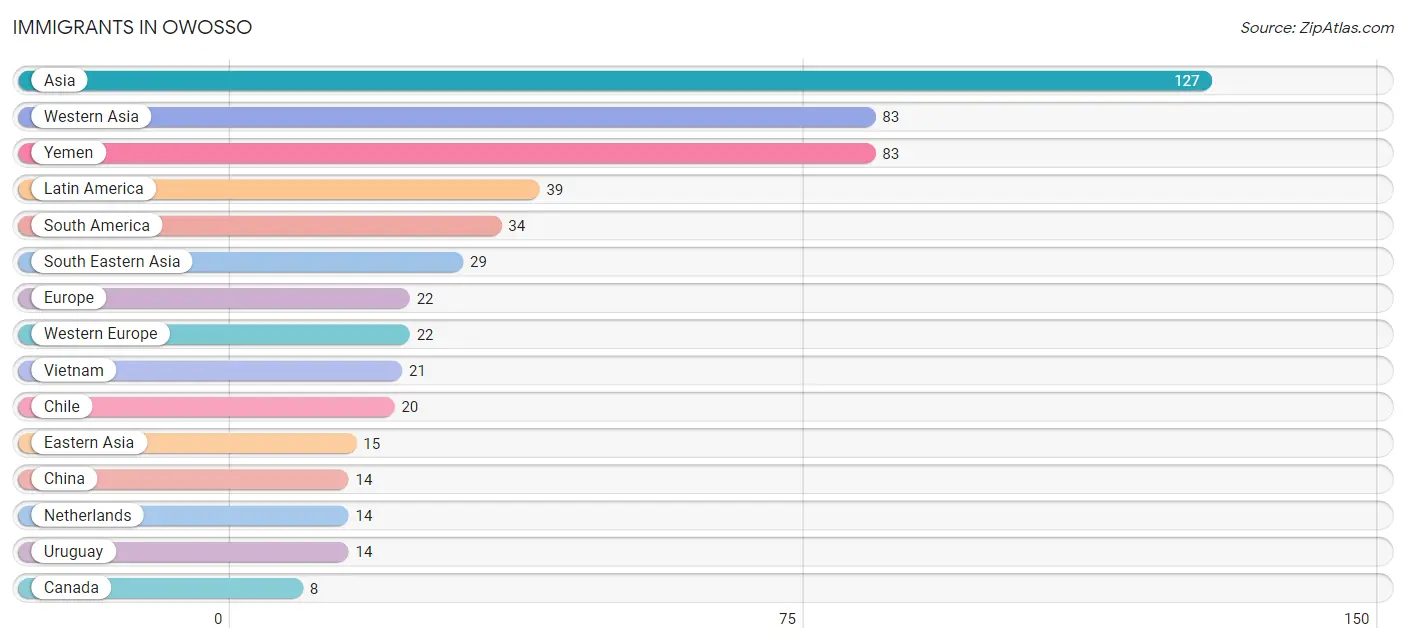
The most numerous immigrant groups reported in Owosso came from Asia (127 | 0.9%), Western Asia (83 | 0.6%), Yemen (83 | 0.6%), Latin America (39 | 0.3%), and South America (34 | 0.2%), together accounting for 2.5% of all Owosso residents.
| Immigration Origin | # Population | % Population |
| Asia | 127 | 0.9% |
| Canada | 8 | 0.1% |
| Central America | 5 | 0.0% |
| Chile | 20 | 0.1% |
| China | 14 | 0.1% |
| Eastern Asia | 15 | 0.1% |
| Europe | 22 | 0.2% |
| Germany | 8 | 0.1% |
| Hong Kong | 7 | 0.1% |
| Japan | 1 | 0.0% |
| Latin America | 39 | 0.3% |
| Mexico | 5 | 0.0% |
| Netherlands | 14 | 0.1% |
| Philippines | 8 | 0.1% |
| South America | 34 | 0.2% |
| South Eastern Asia | 29 | 0.2% |
| Uruguay | 14 | 0.1% |
| Vietnam | 21 | 0.1% |
| Western Asia | 83 | 0.6% |
| Western Europe | 22 | 0.2% |
| Yemen | 83 | 0.6% | View All 21 Rows |
Sex and Age in Owosso
Sex and Age in Owosso
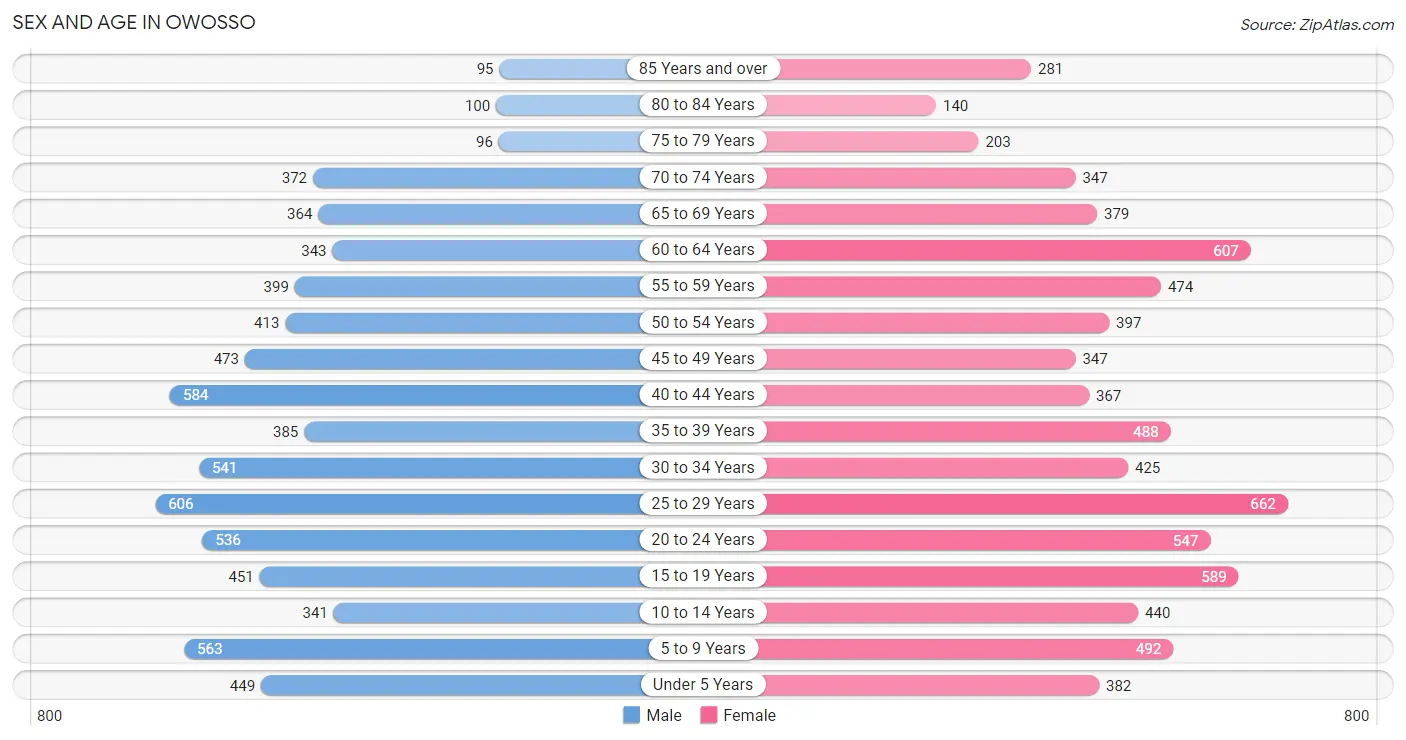
The most populous age groups in Owosso are 25 to 29 Years (606 | 8.5%) for men and 25 to 29 Years (662 | 8.7%) for women.
| Age Bracket | Male | Female |
| Under 5 Years | 449 (6.3%) | 382 (5.1%) |
| 5 to 9 Years | 563 (7.9%) | 492 (6.5%) |
| 10 to 14 Years | 341 (4.8%) | 440 (5.8%) |
| 15 to 19 Years | 451 (6.3%) | 589 (7.8%) |
| 20 to 24 Years | 536 (7.5%) | 547 (7.2%) |
| 25 to 29 Years | 606 (8.5%) | 662 (8.7%) |
| 30 to 34 Years | 541 (7.6%) | 425 (5.6%) |
| 35 to 39 Years | 385 (5.4%) | 488 (6.5%) |
| 40 to 44 Years | 584 (8.2%) | 367 (4.9%) |
| 45 to 49 Years | 473 (6.7%) | 347 (4.6%) |
| 50 to 54 Years | 413 (5.8%) | 397 (5.2%) |
| 55 to 59 Years | 399 (5.6%) | 474 (6.3%) |
| 60 to 64 Years | 343 (4.8%) | 607 (8.0%) |
| 65 to 69 Years | 364 (5.1%) | 379 (5.0%) |
| 70 to 74 Years | 372 (5.2%) | 347 (4.6%) |
| 75 to 79 Years | 96 (1.3%) | 203 (2.7%) |
| 80 to 84 Years | 100 (1.4%) | 140 (1.8%) |
| 85 Years and over | 95 (1.3%) | 281 (3.7%) |
| Total | 7,111 (100.0%) | 7,567 (100.0%) |
Families and Households in Owosso
Median Family Size in Owosso
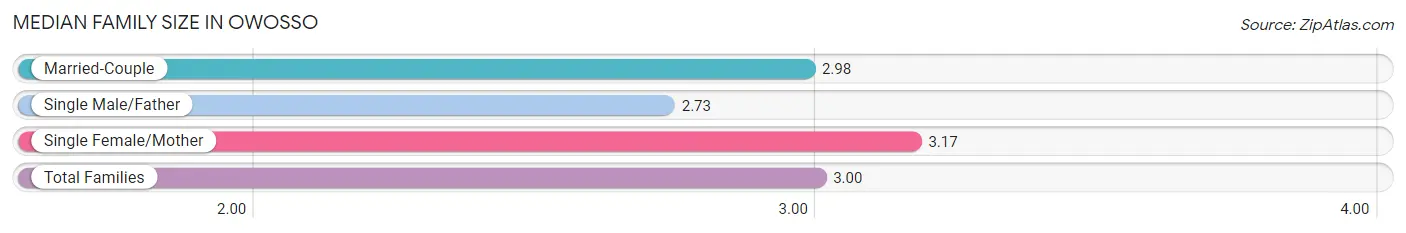
The median family size in Owosso is 3.00 persons per family, with single female/mother families (932 | 26.4%) accounting for the largest median family size of 3.17 persons per family. On the other hand, single male/father families (404 | 11.4%) represent the smallest median family size with 2.73 persons per family.
| Family Type | # Families | Family Size |
| Married-Couple | 2,198 (62.2%) | 2.98 |
| Single Male/Father | 404 (11.4%) | 2.73 |
| Single Female/Mother | 932 (26.4%) | 3.17 |
| Total Families | 3,534 (100.0%) | 3.00 |
Median Household Size in Owosso
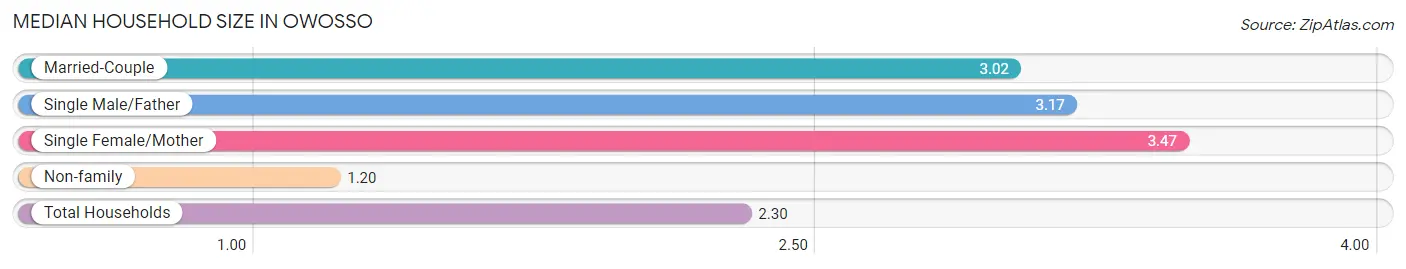
The median household size in Owosso is 2.30 persons per household, with single female/mother households (932 | 14.8%) accounting for the largest median household size of 3.47 persons per household. non-family households (2,773 | 44.0%) represent the smallest median household size with 1.20 persons per household.
| Household Type | # Households | Household Size |
| Married-Couple | 2,198 (34.8%) | 3.02 |
| Single Male/Father | 404 (6.4%) | 3.17 |
| Single Female/Mother | 932 (14.8%) | 3.47 |
| Non-family | 2,773 (44.0%) | 1.20 |
| Total Households | 6,307 (100.0%) | 2.30 |
Household Size by Marriage Status in Owosso
Out of a total of 6,307 households in Owosso, 3,534 (56.0%) are family households, while 2,773 (44.0%) are nonfamily households. The most numerous type of family households are 2-person households, comprising 1,602, and the most common type of nonfamily households are 1-person households, comprising 2,287.
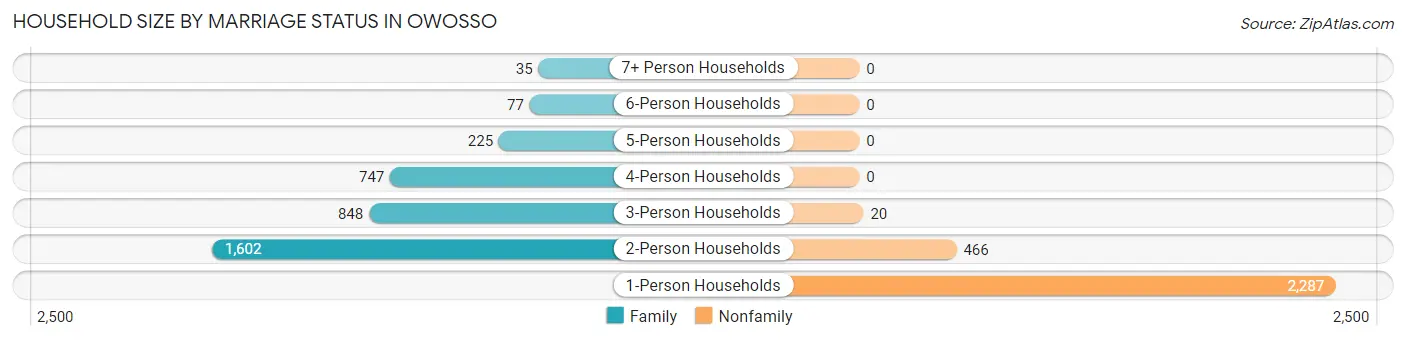
| Household Size | Family Households | Nonfamily Households |
| 1-Person Households | - | 2,287 (36.3%) |
| 2-Person Households | 1,602 (25.4%) | 466 (7.4%) |
| 3-Person Households | 848 (13.5%) | 20 (0.3%) |
| 4-Person Households | 747 (11.8%) | 0 (0.0%) |
| 5-Person Households | 225 (3.6%) | 0 (0.0%) |
| 6-Person Households | 77 (1.2%) | 0 (0.0%) |
| 7+ Person Households | 35 (0.5%) | 0 (0.0%) |
| Total | 3,534 (56.0%) | 2,773 (44.0%) |
Female Fertility in Owosso
Fertility by Age in Owosso
Average fertility rate in Owosso is 51.0 births per 1,000 women. Women in the age bracket of 20 to 34 years have the highest fertility rate with 100.0 births per 1,000 women. Women in the age bracket of 20 to 34 years acount for 90.6% of all women with births.
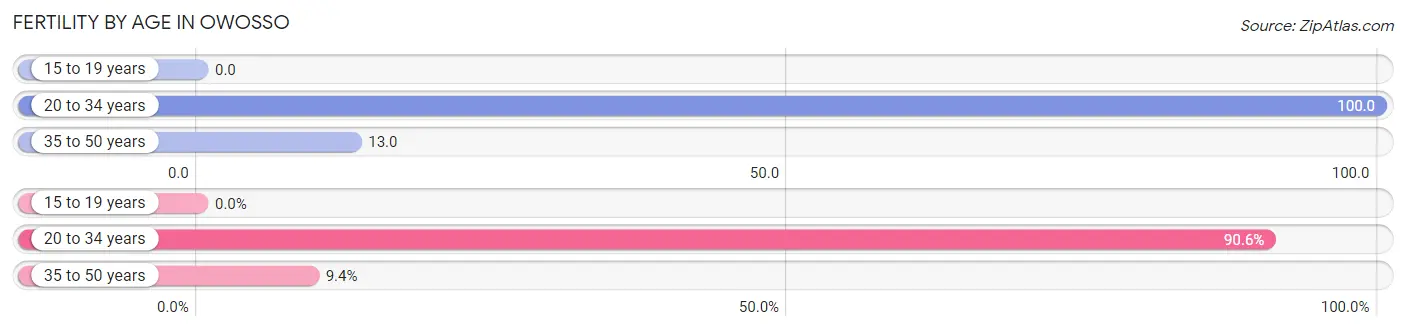
| Age Bracket | Women with Births | Births / 1,000 Women |
| 15 to 19 years | 0 (0.0%) | 0.0 |
| 20 to 34 years | 164 (90.6%) | 100.0 |
| 35 to 50 years | 17 (9.4%) | 13.0 |
| Total | 181 (100.0%) | 51.0 |
Fertility by Age by Marriage Status in Owosso
61.9% of women with births (181) in Owosso are married. The highest percentage of unmarried women with births falls into 20 to 34 years age bracket with 42.1% of them unmarried at the time of birth, while the lowest percentage of unmarried women with births belong to 35 to 50 years age bracket with 0.0% of them unmarried.
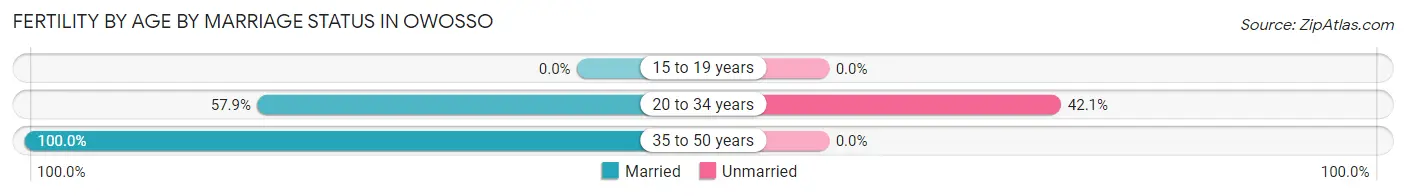
| Age Bracket | Married | Unmarried |
| 15 to 19 years | 0 (0.0%) | 0 (0.0%) |
| 20 to 34 years | 95 (57.9%) | 69 (42.1%) |
| 35 to 50 years | 17 (100.0%) | 0 (0.0%) |
| Total | 112 (61.9%) | 69 (38.1%) |
Fertility by Education in Owosso
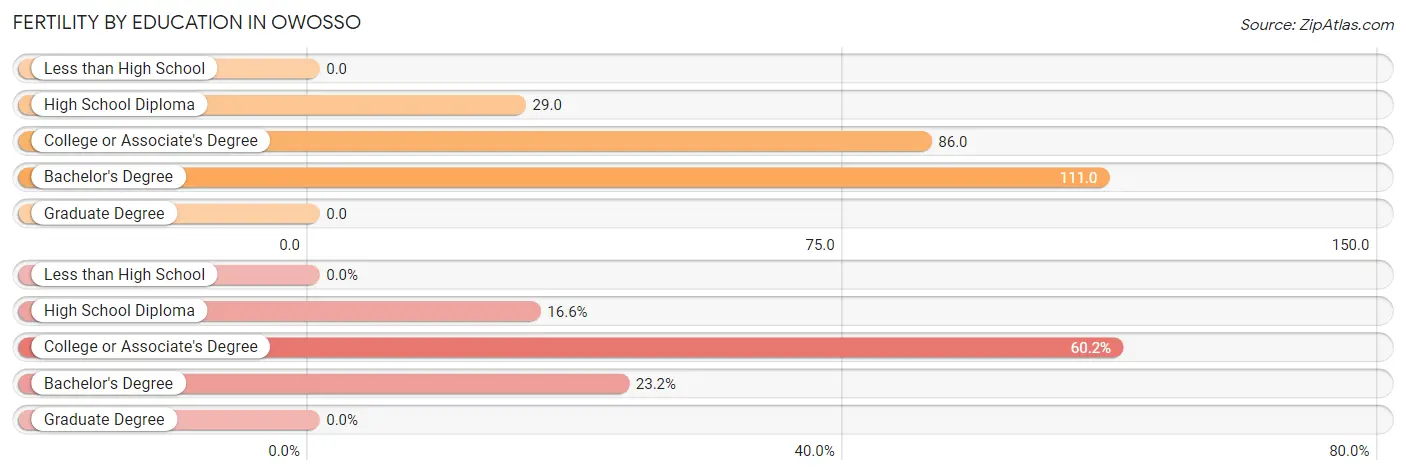
| Educational Attainment | Women with Births | Births / 1,000 Women |
| Less than High School | 0 (0.0%) | 0.0 |
| High School Diploma | 30 (16.6%) | 29.0 |
| College or Associate's Degree | 109 (60.2%) | 86.0 |
| Bachelor's Degree | 42 (23.2%) | 111.0 |
| Graduate Degree | 0 (0.0%) | 0.0 |
| Total | 181 (100.0%) | 51.0 |
Fertility by Education by Marriage Status in Owosso
38.1% of women with births in Owosso are unmarried. Women with the educational attainment of bachelor's degree are most likely to be married with 100.0% of them married at childbirth, while women with the educational attainment of high school diploma are least likely to be married with 70.0% of them unmarried at childbirth.
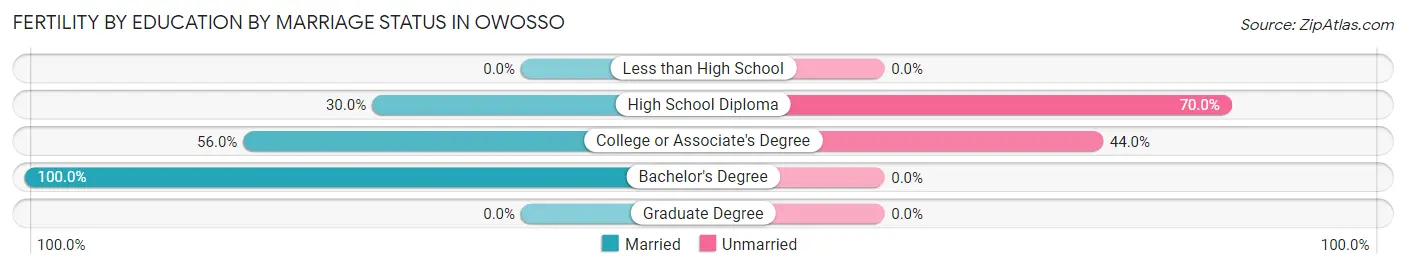
| Educational Attainment | Married | Unmarried |
| Less than High School | 0 (0.0%) | 0 (0.0%) |
| High School Diploma | 9 (30.0%) | 21 (70.0%) |
| College or Associate's Degree | 61 (56.0%) | 48 (44.0%) |
| Bachelor's Degree | 42 (100.0%) | 0 (0.0%) |
| Graduate Degree | 0 (0.0%) | 0 (0.0%) |
| Total | 112 (61.9%) | 69 (38.1%) |
Employment Characteristics in Owosso
Employment by Class of Employer in Owosso
Among the 7,334 employed individuals in Owosso, private company employees (5,634 | 76.8%), not-for-profit organizations (669 | 9.1%), and self-employed (not incorporated) (399 | 5.4%) make up the most common classes of employment.
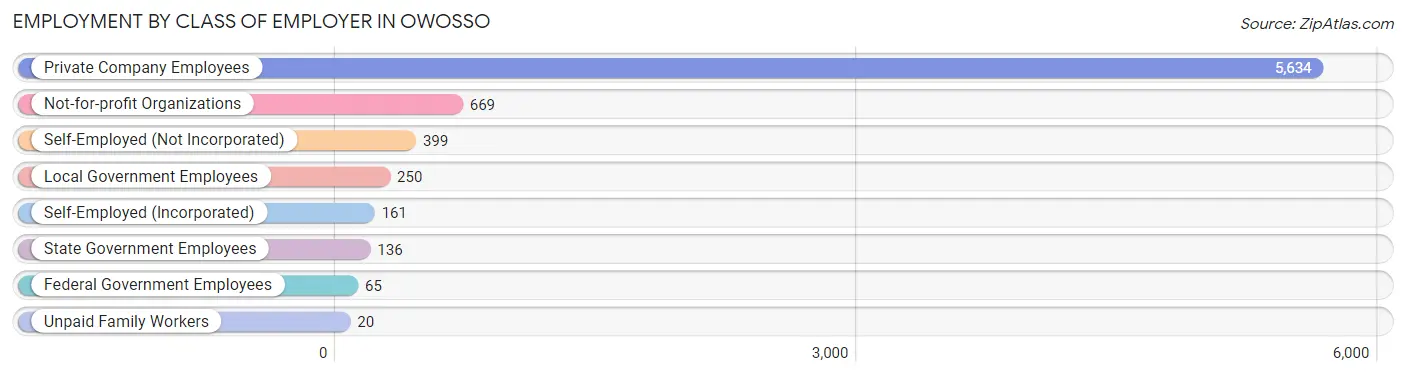
| Employer Class | # Employees | % Employees |
| Private Company Employees | 5,634 | 76.8% |
| Self-Employed (Incorporated) | 161 | 2.2% |
| Self-Employed (Not Incorporated) | 399 | 5.4% |
| Not-for-profit Organizations | 669 | 9.1% |
| Local Government Employees | 250 | 3.4% |
| State Government Employees | 136 | 1.8% |
| Federal Government Employees | 65 | 0.9% |
| Unpaid Family Workers | 20 | 0.3% |
| Total | 7,334 | 100.0% |
Employment Status by Age in Owosso
According to the labor force statistics for Owosso, out of the total population over 16 years of age (11,890), 65.4% or 7,776 individuals are in the labor force, with 4.5% or 350 of them unemployed. The age group with the highest labor force participation rate is 25 to 29 years, with 87.9% or 1,115 individuals in the labor force. Within the labor force, the 16 to 19 years age range has the highest percentage of unemployed individuals, with 19.4% or 100 of them being unemployed.
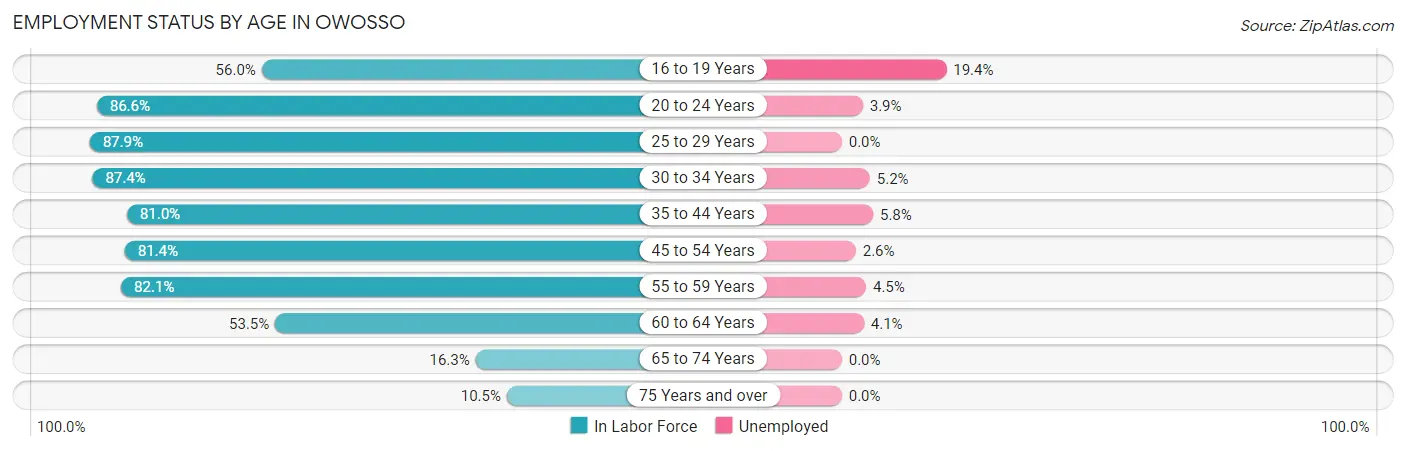
| Age Bracket | In Labor Force | Unemployed |
| 16 to 19 Years | 515 (56.0%) | 100 (19.4%) |
| 20 to 24 Years | 938 (86.6%) | 37 (3.9%) |
| 25 to 29 Years | 1,115 (87.9%) | 0 (0.0%) |
| 30 to 34 Years | 844 (87.4%) | 44 (5.2%) |
| 35 to 44 Years | 1,477 (81.0%) | 86 (5.8%) |
| 45 to 54 Years | 1,327 (81.4%) | 35 (2.6%) |
| 55 to 59 Years | 717 (82.1%) | 32 (4.5%) |
| 60 to 64 Years | 508 (53.5%) | 21 (4.1%) |
| 65 to 74 Years | 238 (16.3%) | 0 (0.0%) |
| 75 Years and over | 96 (10.5%) | 0 (0.0%) |
| Total | 7,776 (65.4%) | 350 (4.5%) |
Employment Status by Educational Attainment in Owosso
According to labor force statistics for Owosso, 79.7% of individuals (5,986) out of the total population between 25 and 64 years of age (7,511) are in the labor force, with 3.6% or 215 of them being unemployed. The group with the highest labor force participation rate are those with the educational attainment of bachelor's degree or higher, with 88.9% or 1,133 individuals in the labor force. Within the labor force, individuals with less than high school education have the highest percentage of unemployment, with 7.6% or 47 of them being unemployed.
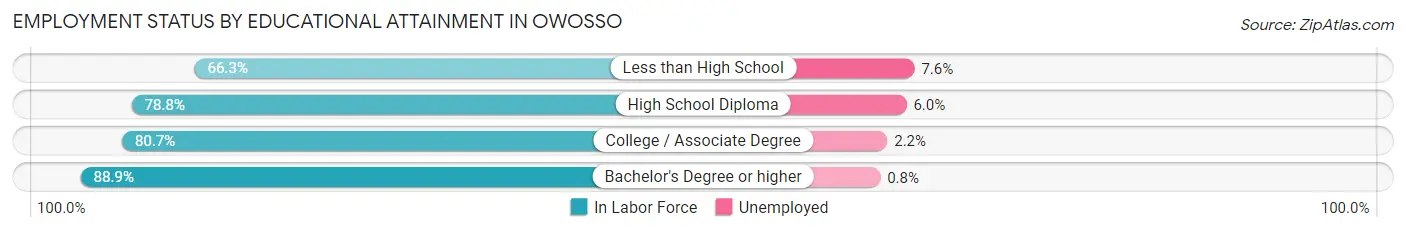
| Educational Attainment | In Labor Force | Unemployed |
| Less than High School | 622 (66.3%) | 71 (7.6%) |
| High School Diploma | 1,779 (78.8%) | 135 (6.0%) |
| College / Associate Degree | 2,455 (80.7%) | 67 (2.2%) |
| Bachelor's Degree or higher | 1,133 (88.9%) | 10 (0.8%) |
| Total | 5,986 (79.7%) | 270 (3.6%) |
Employment Occupations by Sex in Owosso
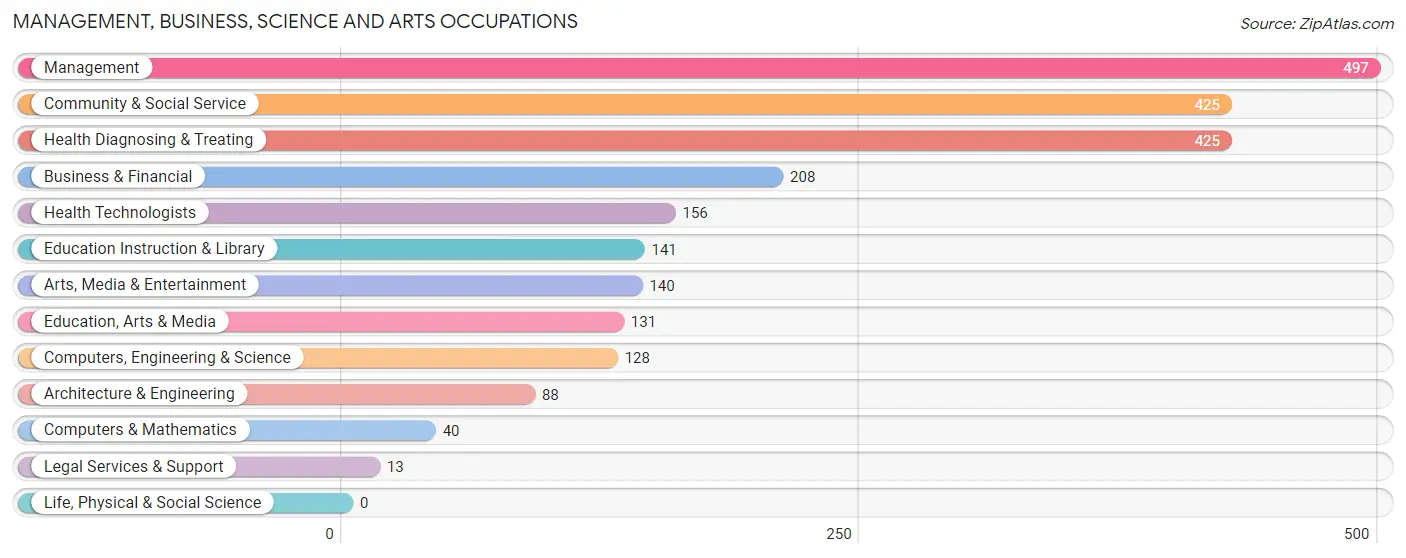
Management, Business, Science and Arts Occupations
The most common Management, Business, Science and Arts occupations in Owosso are Management (497 | 6.7%), Community & Social Service (425 | 5.8%), Health Diagnosing & Treating (425 | 5.8%), Business & Financial (208 | 2.8%), and Health Technologists (156 | 2.1%).
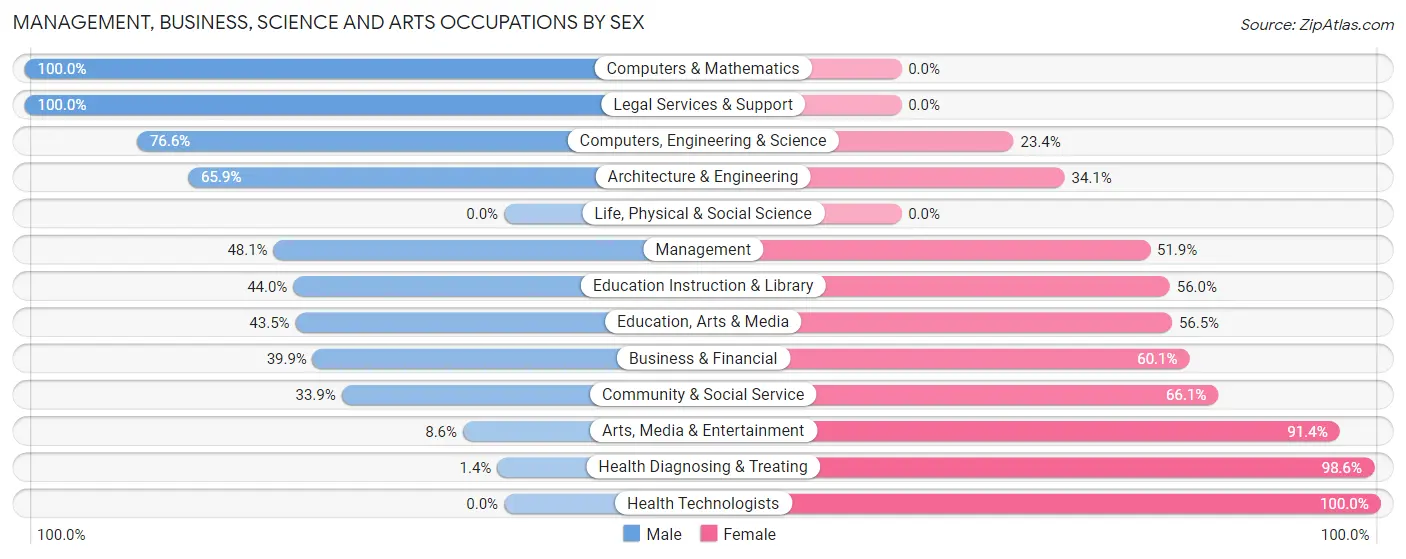
Management, Business, Science and Arts Occupations by Sex
Within the Management, Business, Science and Arts occupations in Owosso, the most male-oriented occupations are Computers & Mathematics (100.0%), Legal Services & Support (100.0%), and Computers, Engineering & Science (76.6%), while the most female-oriented occupations are Health Technologists (100.0%), Health Diagnosing & Treating (98.6%), and Arts, Media & Entertainment (91.4%).
| Occupation | Male | Female |
| Management | 239 (48.1%) | 258 (51.9%) |
| Business & Financial | 83 (39.9%) | 125 (60.1%) |
| Computers, Engineering & Science | 98 (76.6%) | 30 (23.4%) |
| Computers & Mathematics | 40 (100.0%) | 0 (0.0%) |
| Architecture & Engineering | 58 (65.9%) | 30 (34.1%) |
| Life, Physical & Social Science | 0 (0.0%) | 0 (0.0%) |
| Community & Social Service | 144 (33.9%) | 281 (66.1%) |
| Education, Arts & Media | 57 (43.5%) | 74 (56.5%) |
| Legal Services & Support | 13 (100.0%) | 0 (0.0%) |
| Education Instruction & Library | 62 (44.0%) | 79 (56.0%) |
| Arts, Media & Entertainment | 12 (8.6%) | 128 (91.4%) |
| Health Diagnosing & Treating | 6 (1.4%) | 419 (98.6%) |
| Health Technologists | 0 (0.0%) | 156 (100.0%) |
| Total (Category) | 570 (33.9%) | 1,113 (66.1%) |
| Total (Overall) | 3,820 (51.7%) | 3,568 (48.3%) |
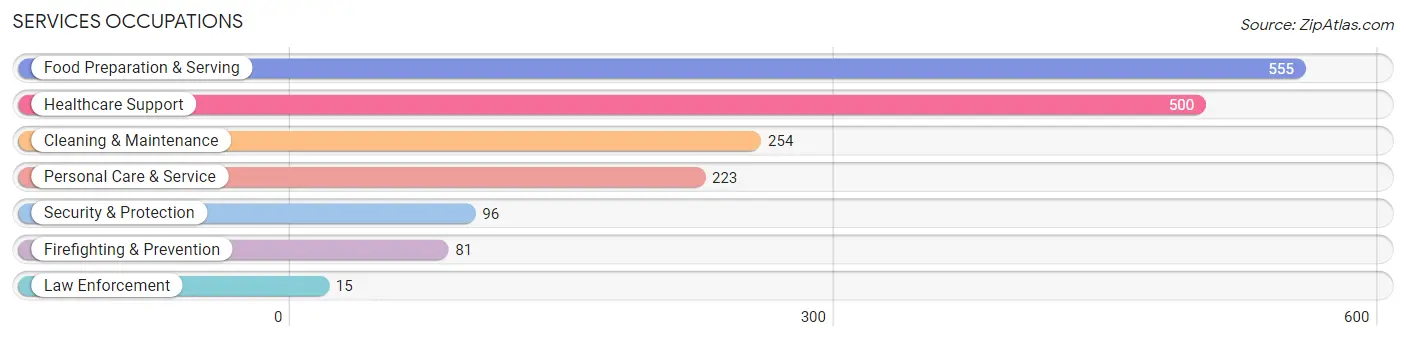
Services Occupations
The most common Services occupations in Owosso are Food Preparation & Serving (555 | 7.5%), Healthcare Support (500 | 6.8%), Cleaning & Maintenance (254 | 3.4%), Personal Care & Service (223 | 3.0%), and Security & Protection (96 | 1.3%).
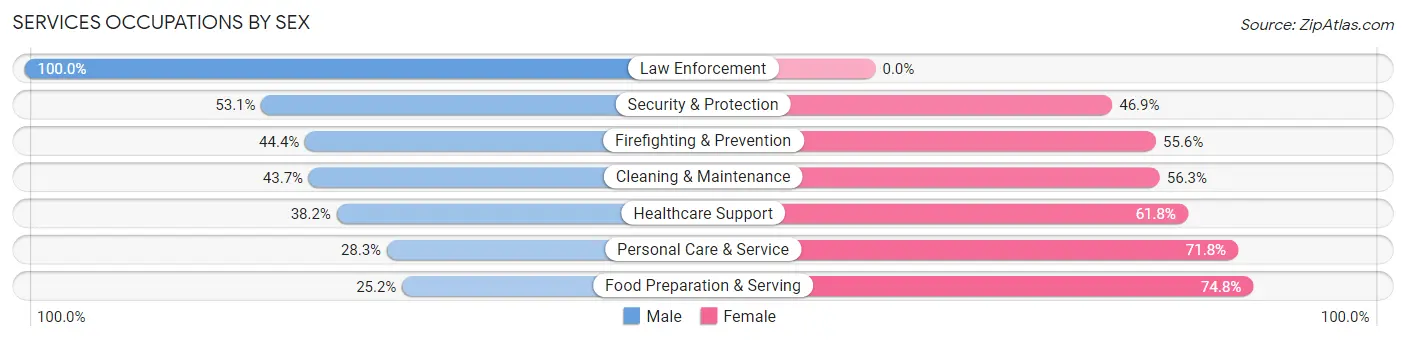
Services Occupations by Sex
Within the Services occupations in Owosso, the most male-oriented occupations are Law Enforcement (100.0%), Security & Protection (53.1%), and Firefighting & Prevention (44.4%), while the most female-oriented occupations are Food Preparation & Serving (74.8%), Personal Care & Service (71.8%), and Healthcare Support (61.8%).
| Occupation | Male | Female |
| Healthcare Support | 191 (38.2%) | 309 (61.8%) |
| Security & Protection | 51 (53.1%) | 45 (46.9%) |
| Firefighting & Prevention | 36 (44.4%) | 45 (55.6%) |
| Law Enforcement | 15 (100.0%) | 0 (0.0%) |
| Food Preparation & Serving | 140 (25.2%) | 415 (74.8%) |
| Cleaning & Maintenance | 111 (43.7%) | 143 (56.3%) |
| Personal Care & Service | 63 (28.2%) | 160 (71.8%) |
| Total (Category) | 556 (34.2%) | 1,072 (65.8%) |
| Total (Overall) | 3,820 (51.7%) | 3,568 (48.3%) |
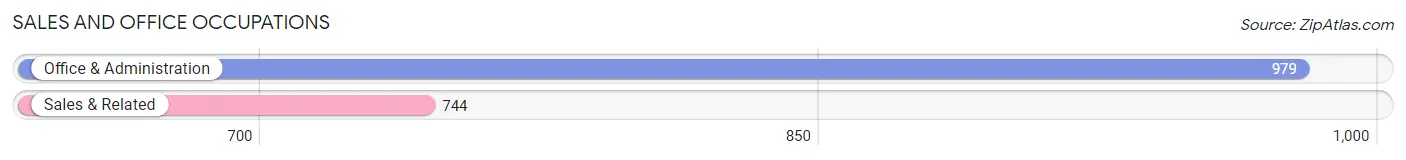
Sales and Office Occupations
The most common Sales and Office occupations in Owosso are Office & Administration (979 | 13.3%), and Sales & Related (744 | 10.1%).
Sales and Office Occupations by Sex
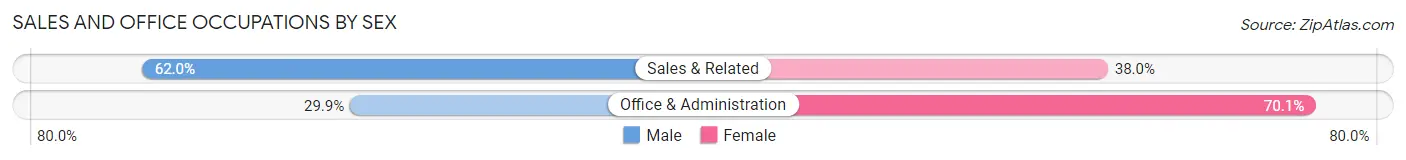
| Occupation | Male | Female |
| Sales & Related | 461 (62.0%) | 283 (38.0%) |
| Office & Administration | 293 (29.9%) | 686 (70.1%) |
| Total (Category) | 754 (43.8%) | 969 (56.2%) |
| Total (Overall) | 3,820 (51.7%) | 3,568 (48.3%) |
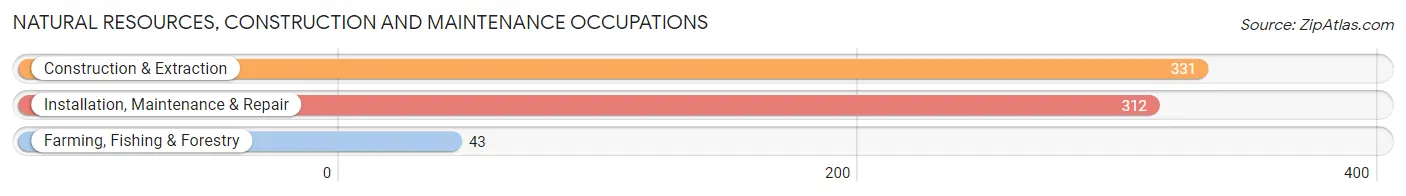
Natural Resources, Construction and Maintenance Occupations
The most common Natural Resources, Construction and Maintenance occupations in Owosso are Construction & Extraction (331 | 4.5%), Installation, Maintenance & Repair (312 | 4.2%), and Farming, Fishing & Forestry (43 | 0.6%).
Natural Resources, Construction and Maintenance Occupations by Sex
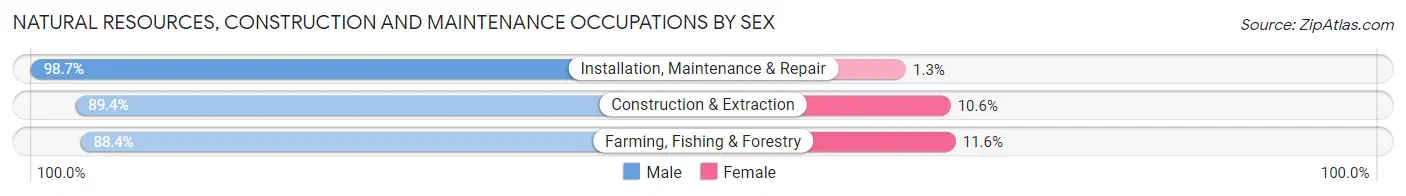
| Occupation | Male | Female |
| Farming, Fishing & Forestry | 38 (88.4%) | 5 (11.6%) |
| Construction & Extraction | 296 (89.4%) | 35 (10.6%) |
| Installation, Maintenance & Repair | 308 (98.7%) | 4 (1.3%) |
| Total (Category) | 642 (93.6%) | 44 (6.4%) |
| Total (Overall) | 3,820 (51.7%) | 3,568 (48.3%) |
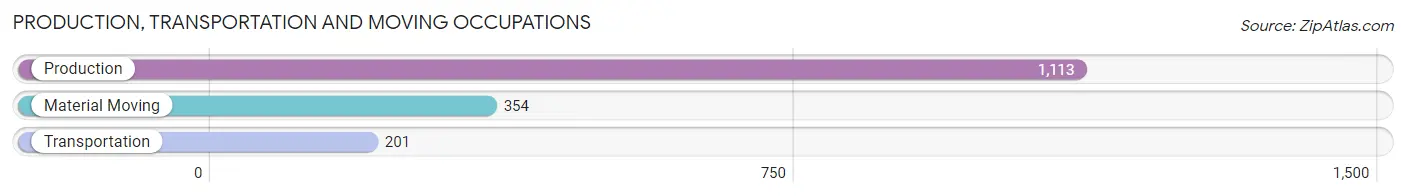
Production, Transportation and Moving Occupations
The most common Production, Transportation and Moving occupations in Owosso are Production (1,113 | 15.1%), Material Moving (354 | 4.8%), and Transportation (201 | 2.7%).
Production, Transportation and Moving Occupations by Sex
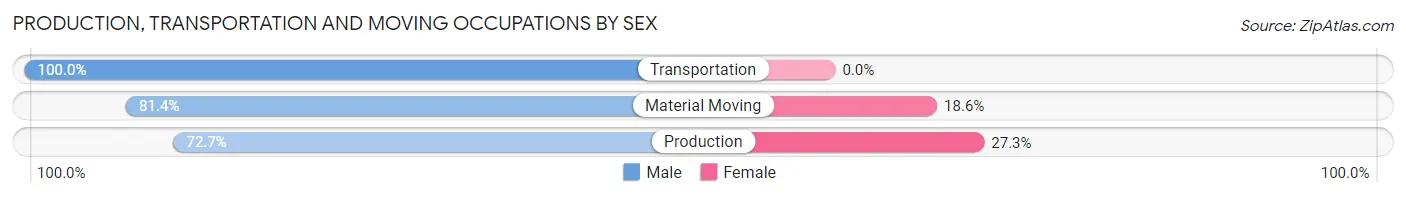
| Occupation | Male | Female |
| Production | 809 (72.7%) | 304 (27.3%) |
| Transportation | 201 (100.0%) | 0 (0.0%) |
| Material Moving | 288 (81.4%) | 66 (18.6%) |
| Total (Category) | 1,298 (77.8%) | 370 (22.2%) |
| Total (Overall) | 3,820 (51.7%) | 3,568 (48.3%) |
Employment Industries by Sex in Owosso
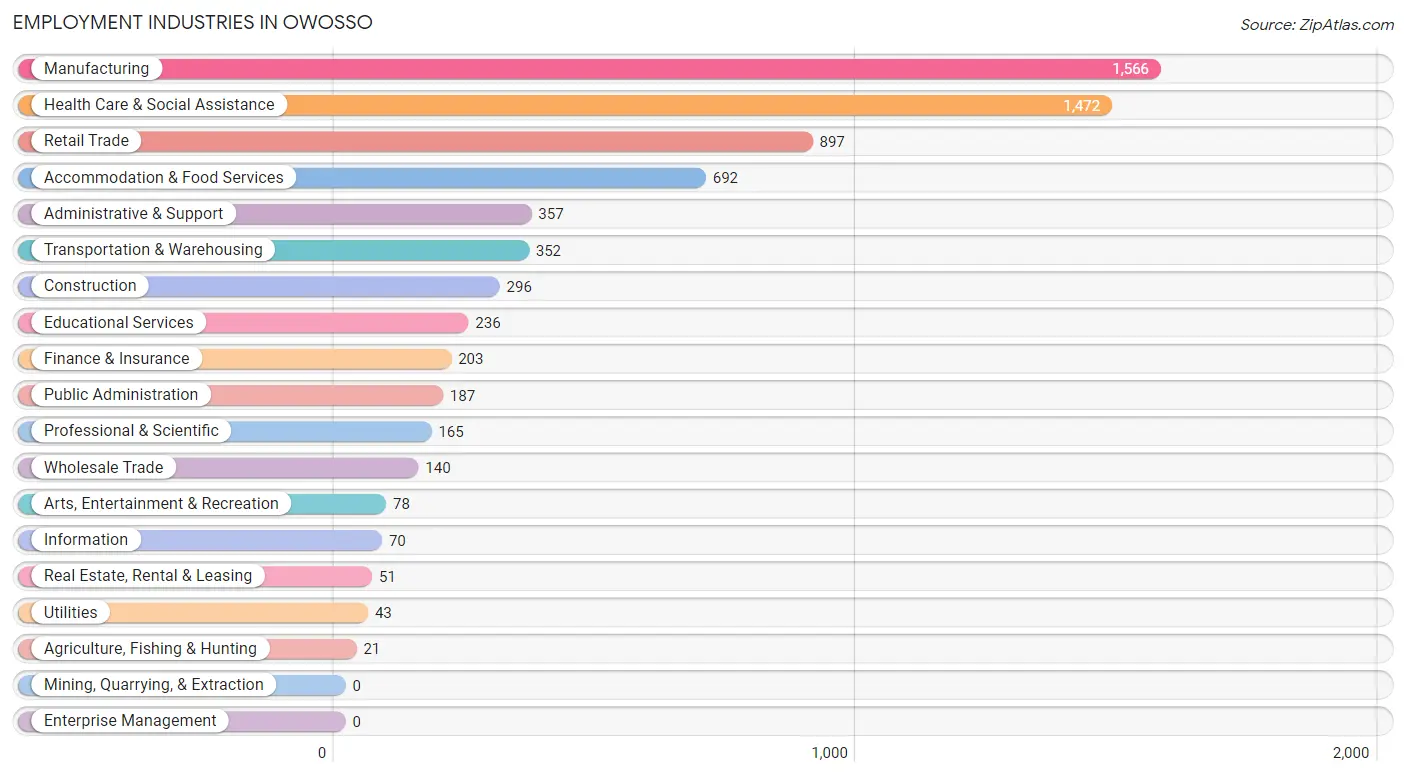
Employment Industries in Owosso
The major employment industries in Owosso include Manufacturing (1,566 | 21.2%), Health Care & Social Assistance (1,472 | 19.9%), Retail Trade (897 | 12.1%), Accommodation & Food Services (692 | 9.4%), and Administrative & Support (357 | 4.8%).
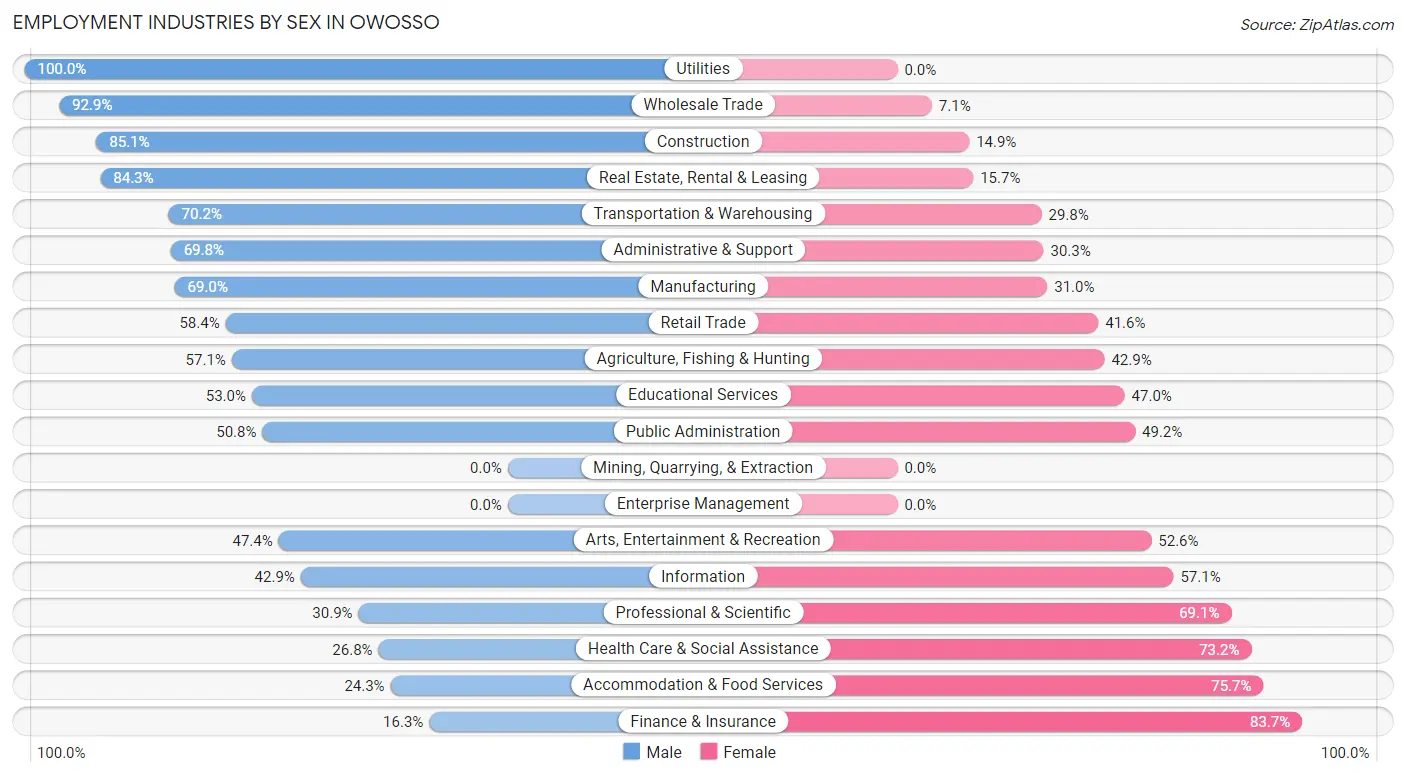
Employment Industries by Sex in Owosso
The Owosso industries that see more men than women are Utilities (100.0%), Wholesale Trade (92.9%), and Construction (85.1%), whereas the industries that tend to have a higher number of women are Finance & Insurance (83.7%), Accommodation & Food Services (75.7%), and Health Care & Social Assistance (73.2%).
| Industry | Male | Female |
| Agriculture, Fishing & Hunting | 12 (57.1%) | 9 (42.9%) |
| Mining, Quarrying, & Extraction | 0 (0.0%) | 0 (0.0%) |
| Construction | 252 (85.1%) | 44 (14.9%) |
| Manufacturing | 1,080 (69.0%) | 486 (31.0%) |
| Wholesale Trade | 130 (92.9%) | 10 (7.1%) |
| Retail Trade | 524 (58.4%) | 373 (41.6%) |
| Transportation & Warehousing | 247 (70.2%) | 105 (29.8%) |
| Utilities | 43 (100.0%) | 0 (0.0%) |
| Information | 30 (42.9%) | 40 (57.1%) |
| Finance & Insurance | 33 (16.3%) | 170 (83.7%) |
| Real Estate, Rental & Leasing | 43 (84.3%) | 8 (15.7%) |
| Professional & Scientific | 51 (30.9%) | 114 (69.1%) |
| Enterprise Management | 0 (0.0%) | 0 (0.0%) |
| Administrative & Support | 249 (69.8%) | 108 (30.2%) |
| Educational Services | 125 (53.0%) | 111 (47.0%) |
| Health Care & Social Assistance | 394 (26.8%) | 1,078 (73.2%) |
| Arts, Entertainment & Recreation | 37 (47.4%) | 41 (52.6%) |
| Accommodation & Food Services | 168 (24.3%) | 524 (75.7%) |
| Public Administration | 95 (50.8%) | 92 (49.2%) |
| Total | 3,820 (51.7%) | 3,568 (48.3%) |
Education in Owosso
School Enrollment in Owosso
The most common levels of schooling among the 2,933 students in Owosso are elementary school (761 | 26.0%), high school (611 | 20.8%), and middle school (593 | 20.2%).
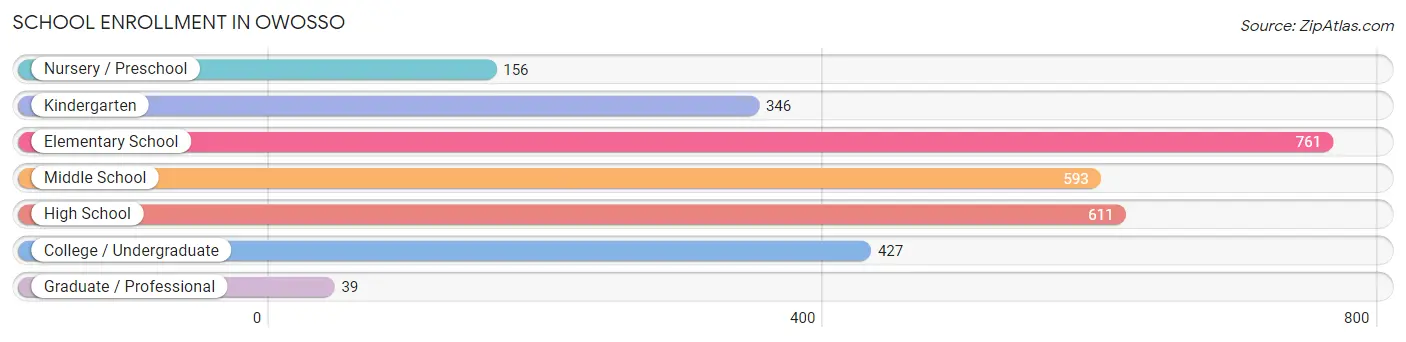
| School Level | # Students | % Students |
| Nursery / Preschool | 156 | 5.3% |
| Kindergarten | 346 | 11.8% |
| Elementary School | 761 | 26.0% |
| Middle School | 593 | 20.2% |
| High School | 611 | 20.8% |
| College / Undergraduate | 427 | 14.6% |
| Graduate / Professional | 39 | 1.3% |
| Total | 2,933 | 100.0% |
School Enrollment by Age by Funding Source in Owosso
Out of a total of 2,933 students who are enrolled in schools in Owosso, 323 (11.0%) attend a private institution, while the remaining 2,610 (89.0%) are enrolled in public schools. The age group of 20 to 24 year olds has the highest likelihood of being enrolled in private schools, with 60 (42.5% in the age bracket) enrolled. Conversely, the age group of 35 years and over has the lowest likelihood of being enrolled in a private school, with 81 (100.0% in the age bracket) attending a public institution.
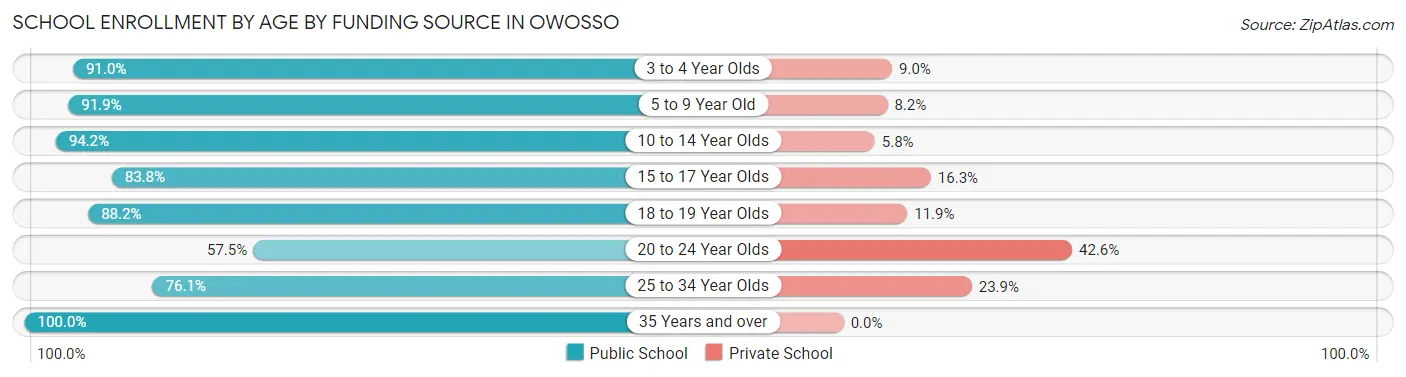
| Age Bracket | Public School | Private School |
| 3 to 4 Year Olds | 121 (91.0%) | 12 (9.0%) |
| 5 to 9 Year Old | 969 (91.8%) | 86 (8.2%) |
| 10 to 14 Year Olds | 665 (94.2%) | 41 (5.8%) |
| 15 to 17 Year Olds | 335 (83.8%) | 65 (16.3%) |
| 18 to 19 Year Olds | 290 (88.1%) | 39 (11.8%) |
| 20 to 24 Year Olds | 81 (57.5%) | 60 (42.5%) |
| 25 to 34 Year Olds | 67 (76.1%) | 21 (23.9%) |
| 35 Years and over | 81 (100.0%) | 0 (0.0%) |
| Total | 2,610 (89.0%) | 323 (11.0%) |
Educational Attainment by Field of Study in Owosso
Business (477 | 25.6%), education (296 | 15.9%), arts & humanities (223 | 12.0%), science & technology (205 | 11.0%), and psychology (121 | 6.5%) are the most common fields of study among 1,863 individuals in Owosso who have obtained a bachelor's degree or higher.
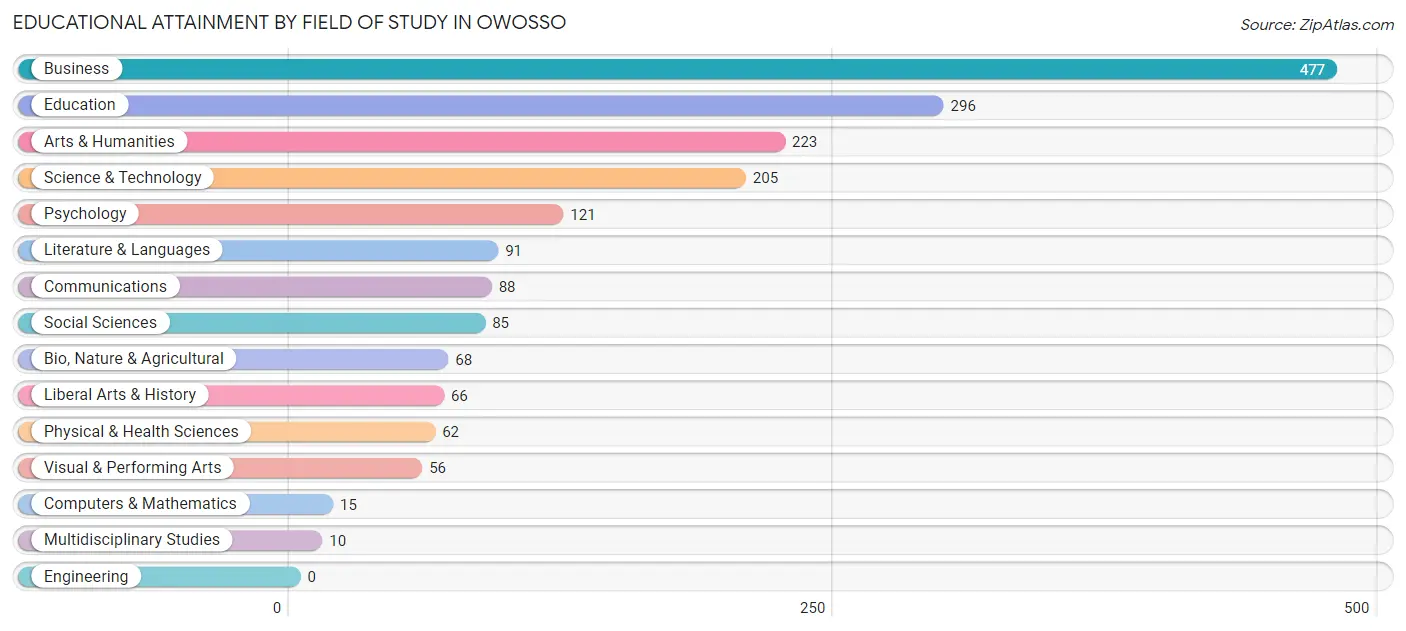
| Field of Study | # Graduates | % Graduates |
| Computers & Mathematics | 15 | 0.8% |
| Bio, Nature & Agricultural | 68 | 3.6% |
| Physical & Health Sciences | 62 | 3.3% |
| Psychology | 121 | 6.5% |
| Social Sciences | 85 | 4.6% |
| Engineering | 0 | 0.0% |
| Multidisciplinary Studies | 10 | 0.5% |
| Science & Technology | 205 | 11.0% |
| Business | 477 | 25.6% |
| Education | 296 | 15.9% |
| Literature & Languages | 91 | 4.9% |
| Liberal Arts & History | 66 | 3.5% |
| Visual & Performing Arts | 56 | 3.0% |
| Communications | 88 | 4.7% |
| Arts & Humanities | 223 | 12.0% |
| Total | 1,863 | 100.0% |
Transportation & Commute in Owosso
Vehicle Availability by Sex in Owosso
The most prevalent vehicle ownership categories in Owosso are males with 2 vehicles (1,629, accounting for 43.1%) and females with 2 vehicles (1,498, making up 46.6%).
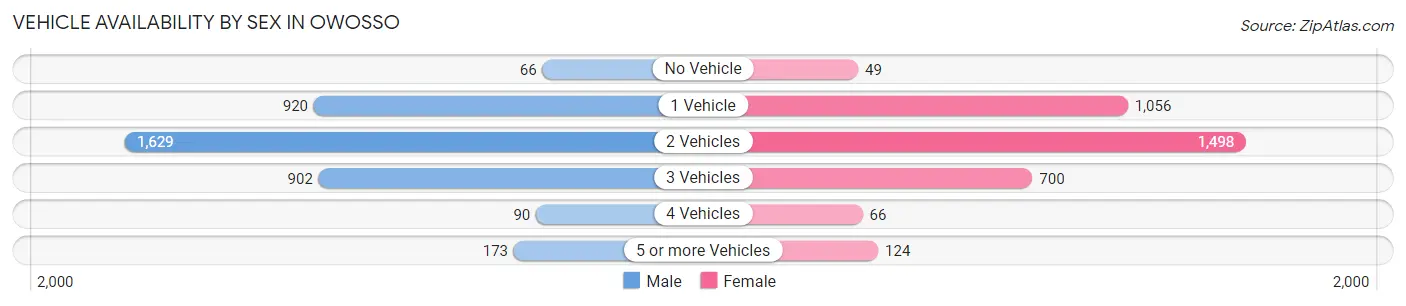
| Vehicles Available | Male | Female |
| No Vehicle | 66 (1.8%) | 49 (1.4%) |
| 1 Vehicle | 920 (24.3%) | 1,056 (30.2%) |
| 2 Vehicles | 1,629 (43.1%) | 1,498 (42.9%) |
| 3 Vehicles | 902 (23.9%) | 700 (20.0%) |
| 4 Vehicles | 90 (2.4%) | 66 (1.9%) |
| 5 or more Vehicles | 173 (4.6%) | 124 (3.5%) |
| Total | 3,780 (100.0%) | 3,493 (100.0%) |
Commute Time in Owosso
The most frequently occuring commute durations in Owosso are 5 to 9 minutes (1,893 commuters, 26.7%), 10 to 14 minutes (1,124 commuters, 15.8%), and 40 to 44 minutes (598 commuters, 8.4%).
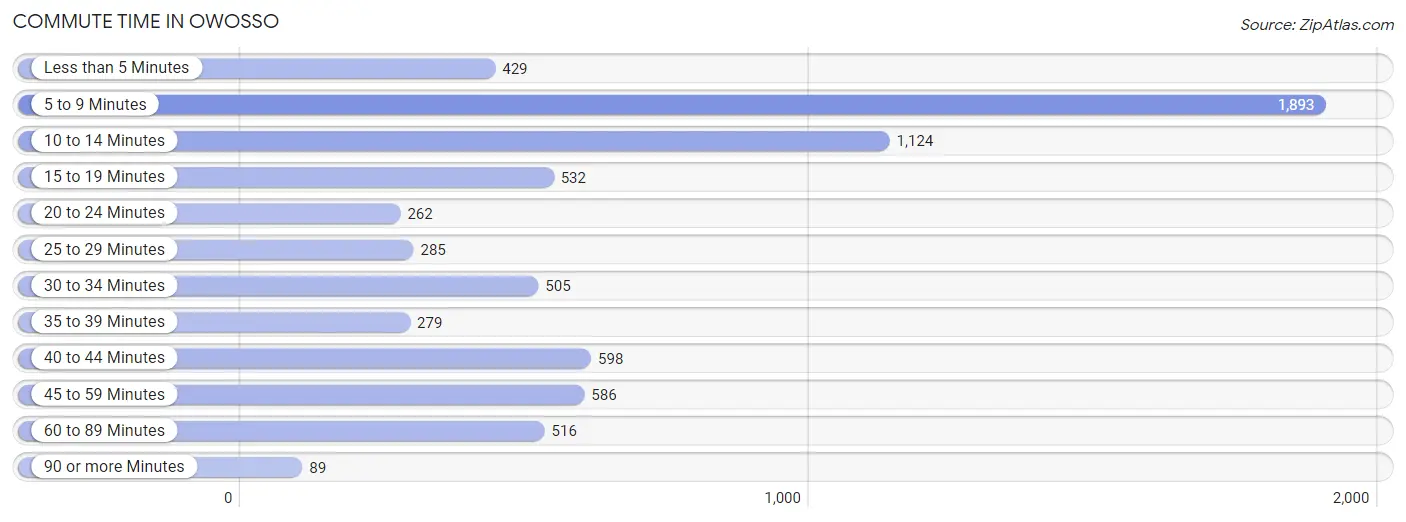
| Commute Time | # Commuters | % Commuters |
| Less than 5 Minutes | 429 | 6.0% |
| 5 to 9 Minutes | 1,893 | 26.7% |
| 10 to 14 Minutes | 1,124 | 15.8% |
| 15 to 19 Minutes | 532 | 7.5% |
| 20 to 24 Minutes | 262 | 3.7% |
| 25 to 29 Minutes | 285 | 4.0% |
| 30 to 34 Minutes | 505 | 7.1% |
| 35 to 39 Minutes | 279 | 3.9% |
| 40 to 44 Minutes | 598 | 8.4% |
| 45 to 59 Minutes | 586 | 8.3% |
| 60 to 89 Minutes | 516 | 7.3% |
| 90 or more Minutes | 89 | 1.3% |
Commute Time by Sex in Owosso
The most common commute times in Owosso are 5 to 9 minutes (824 commuters, 22.2%) for males and 5 to 9 minutes (1,069 commuters, 31.5%) for females.
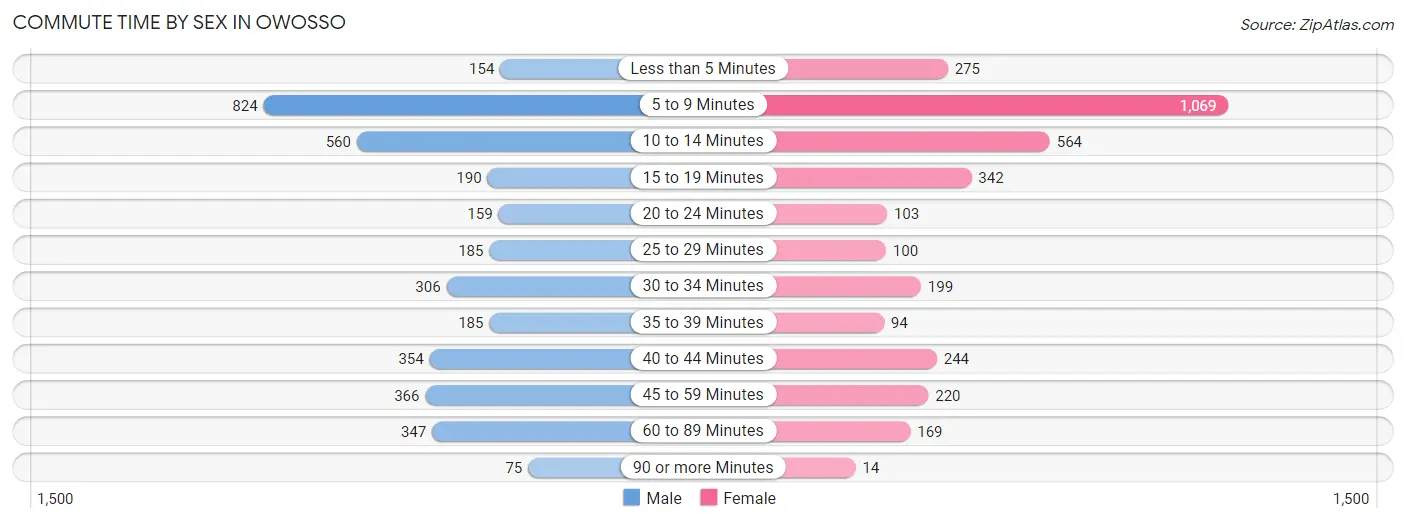
| Commute Time | Male | Female |
| Less than 5 Minutes | 154 (4.2%) | 275 (8.1%) |
| 5 to 9 Minutes | 824 (22.2%) | 1,069 (31.5%) |
| 10 to 14 Minutes | 560 (15.1%) | 564 (16.6%) |
| 15 to 19 Minutes | 190 (5.1%) | 342 (10.1%) |
| 20 to 24 Minutes | 159 (4.3%) | 103 (3.0%) |
| 25 to 29 Minutes | 185 (5.0%) | 100 (2.9%) |
| 30 to 34 Minutes | 306 (8.3%) | 199 (5.9%) |
| 35 to 39 Minutes | 185 (5.0%) | 94 (2.8%) |
| 40 to 44 Minutes | 354 (9.6%) | 244 (7.2%) |
| 45 to 59 Minutes | 366 (9.9%) | 220 (6.5%) |
| 60 to 89 Minutes | 347 (9.4%) | 169 (5.0%) |
| 90 or more Minutes | 75 (2.0%) | 14 (0.4%) |
Time of Departure to Work by Sex in Owosso
The most frequent times of departure to work in Owosso are 6:30 AM to 6:59 AM (459, 12.4%) for males and 7:30 AM to 7:59 AM (499, 14.7%) for females.
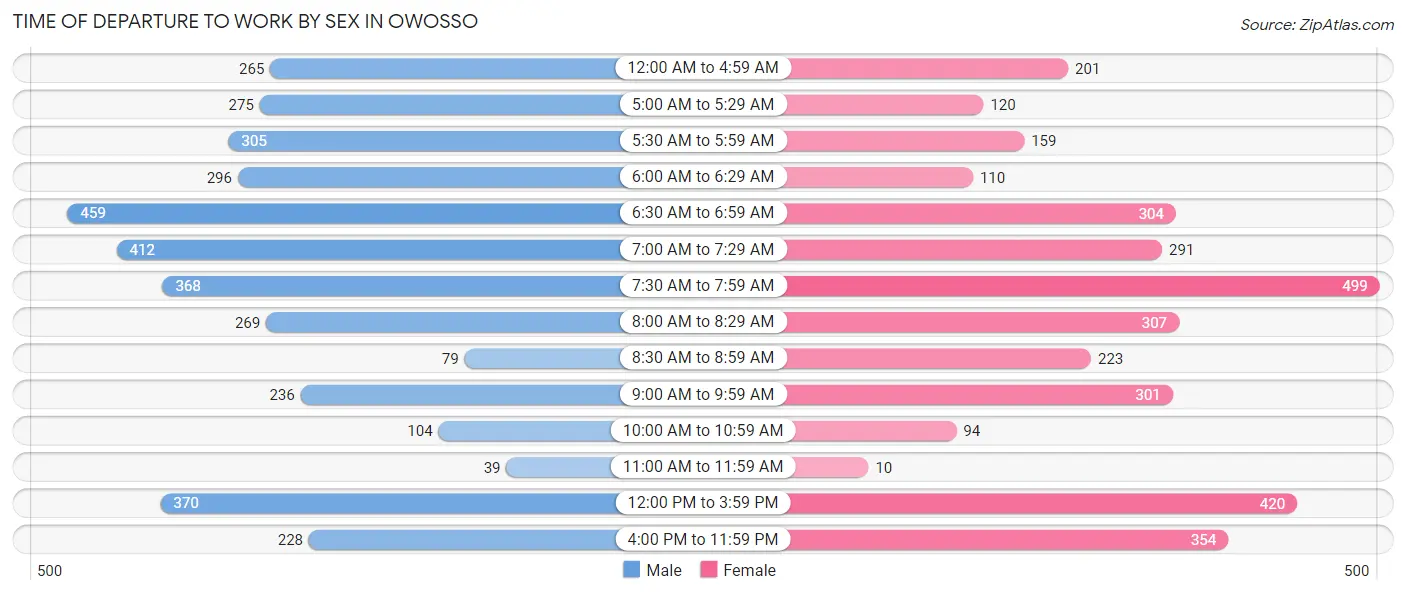
| Time of Departure | Male | Female |
| 12:00 AM to 4:59 AM | 265 (7.1%) | 201 (5.9%) |
| 5:00 AM to 5:29 AM | 275 (7.4%) | 120 (3.5%) |
| 5:30 AM to 5:59 AM | 305 (8.2%) | 159 (4.7%) |
| 6:00 AM to 6:29 AM | 296 (8.0%) | 110 (3.2%) |
| 6:30 AM to 6:59 AM | 459 (12.4%) | 304 (9.0%) |
| 7:00 AM to 7:29 AM | 412 (11.1%) | 291 (8.6%) |
| 7:30 AM to 7:59 AM | 368 (9.9%) | 499 (14.7%) |
| 8:00 AM to 8:29 AM | 269 (7.3%) | 307 (9.0%) |
| 8:30 AM to 8:59 AM | 79 (2.1%) | 223 (6.6%) |
| 9:00 AM to 9:59 AM | 236 (6.4%) | 301 (8.9%) |
| 10:00 AM to 10:59 AM | 104 (2.8%) | 94 (2.8%) |
| 11:00 AM to 11:59 AM | 39 (1.1%) | 10 (0.3%) |
| 12:00 PM to 3:59 PM | 370 (10.0%) | 420 (12.4%) |
| 4:00 PM to 11:59 PM | 228 (6.1%) | 354 (10.4%) |
| Total | 3,705 (100.0%) | 3,393 (100.0%) |
Housing Occupancy in Owosso
Occupancy by Ownership in Owosso
Of the total 6,307 dwellings in Owosso, owner-occupied units account for 4,034 (64.0%), while renter-occupied units make up 2,273 (36.0%).
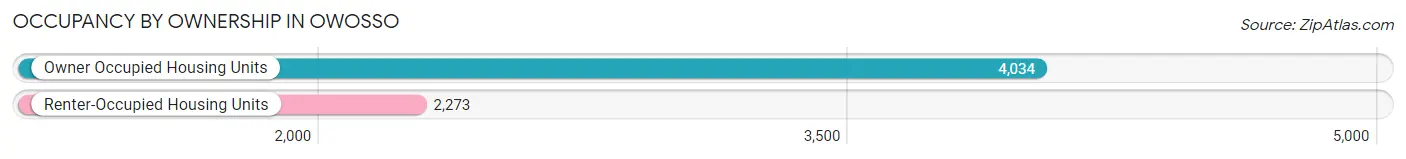
| Occupancy | # Housing Units | % Housing Units |
| Owner Occupied Housing Units | 4,034 | 64.0% |
| Renter-Occupied Housing Units | 2,273 | 36.0% |
| Total Occupied Housing Units | 6,307 | 100.0% |
Occupancy by Household Size in Owosso
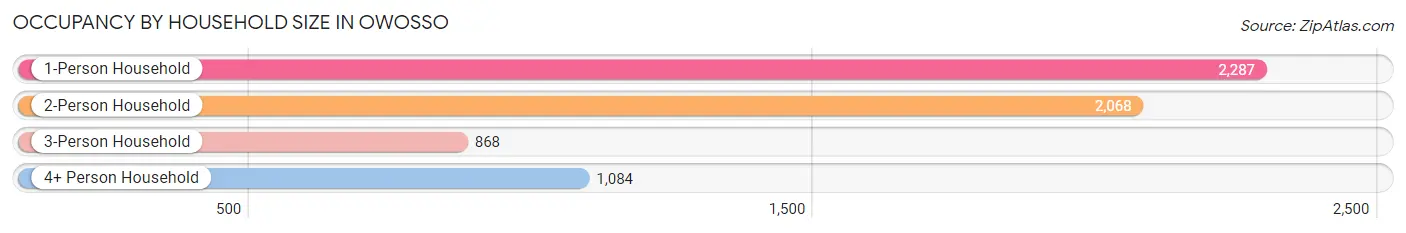
| Household Size | # Housing Units | % Housing Units |
| 1-Person Household | 2,287 | 36.3% |
| 2-Person Household | 2,068 | 32.8% |
| 3-Person Household | 868 | 13.8% |
| 4+ Person Household | 1,084 | 17.2% |
| Total Housing Units | 6,307 | 100.0% |
Occupancy by Ownership by Household Size in Owosso
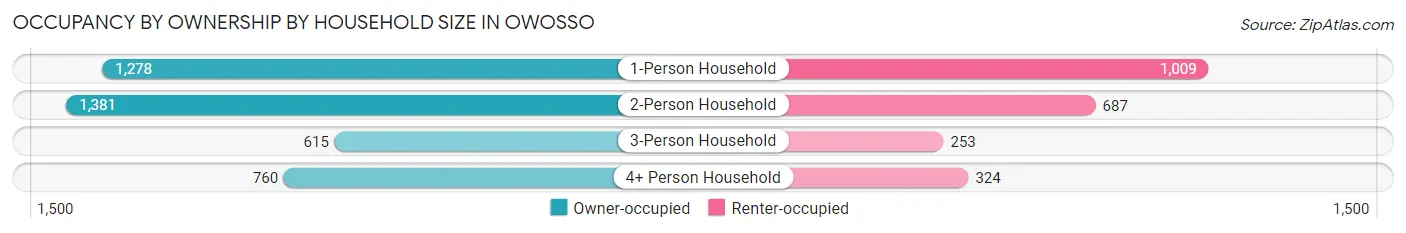
| Household Size | Owner-occupied | Renter-occupied |
| 1-Person Household | 1,278 (55.9%) | 1,009 (44.1%) |
| 2-Person Household | 1,381 (66.8%) | 687 (33.2%) |
| 3-Person Household | 615 (70.9%) | 253 (29.1%) |
| 4+ Person Household | 760 (70.1%) | 324 (29.9%) |
| Total Housing Units | 4,034 (64.0%) | 2,273 (36.0%) |
Occupancy by Educational Attainment in Owosso
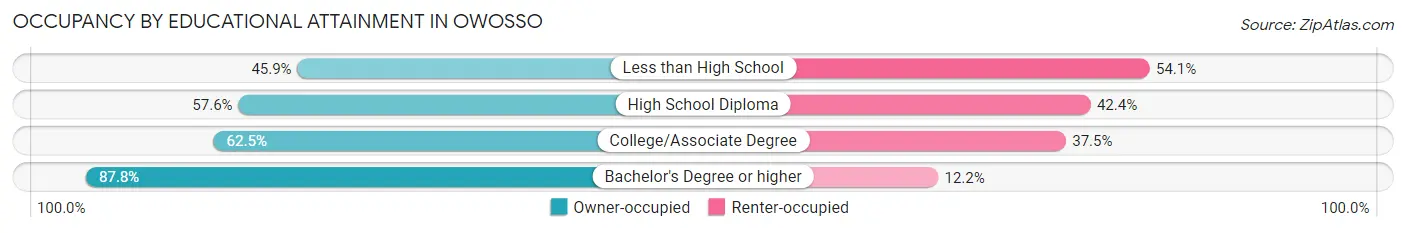
| Household Size | Owner-occupied | Renter-occupied |
| Less than High School | 297 (45.9%) | 350 (54.1%) |
| High School Diploma | 1,136 (57.6%) | 836 (42.4%) |
| College/Associate Degree | 1,576 (62.5%) | 945 (37.5%) |
| Bachelor's Degree or higher | 1,025 (87.8%) | 142 (12.2%) |
Occupancy by Age of Householder in Owosso
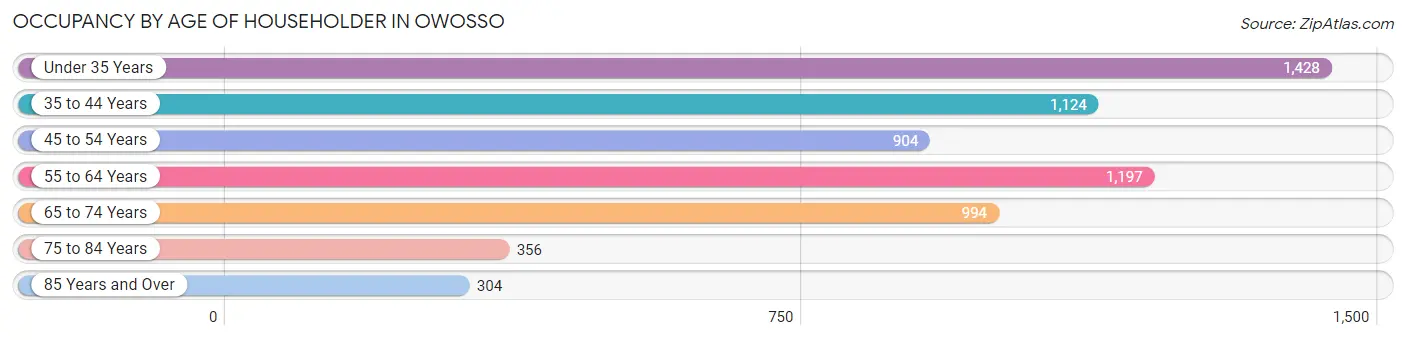
| Age Bracket | # Households | % Households |
| Under 35 Years | 1,428 | 22.6% |
| 35 to 44 Years | 1,124 | 17.8% |
| 45 to 54 Years | 904 | 14.3% |
| 55 to 64 Years | 1,197 | 19.0% |
| 65 to 74 Years | 994 | 15.8% |
| 75 to 84 Years | 356 | 5.6% |
| 85 Years and Over | 304 | 4.8% |
| Total | 6,307 | 100.0% |
Housing Finances in Owosso
Median Income by Occupancy in Owosso
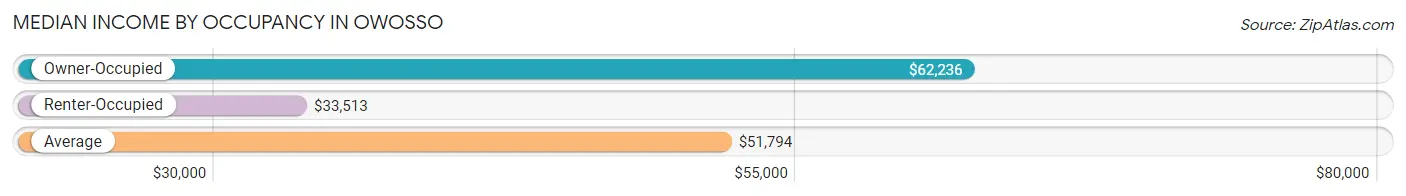
| Occupancy Type | # Households | Median Income |
| Owner-Occupied | 4,034 (64.0%) | $62,236 |
| Renter-Occupied | 2,273 (36.0%) | $33,513 |
| Average | 6,307 (100.0%) | $51,794 |
Occupancy by Householder Income Bracket in Owosso
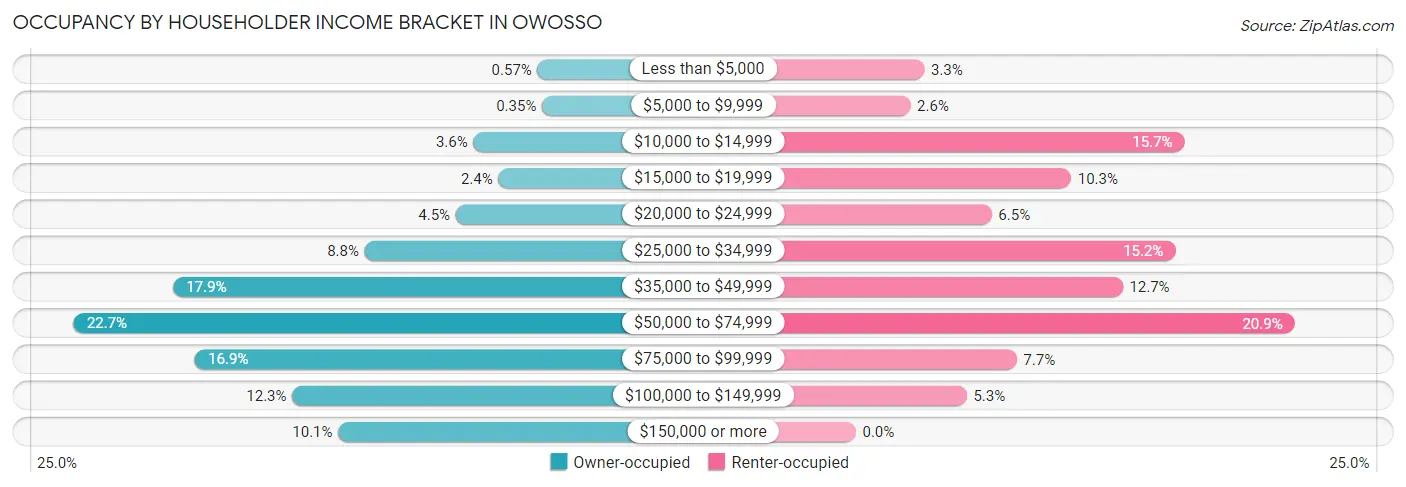
| Income Bracket | Owner-occupied | Renter-occupied |
| Less than $5,000 | 23 (0.6%) | 74 (3.3%) |
| $5,000 to $9,999 | 14 (0.4%) | 59 (2.6%) |
| $10,000 to $14,999 | 146 (3.6%) | 356 (15.7%) |
| $15,000 to $19,999 | 98 (2.4%) | 233 (10.2%) |
| $20,000 to $24,999 | 180 (4.5%) | 147 (6.5%) |
| $25,000 to $34,999 | 355 (8.8%) | 346 (15.2%) |
| $35,000 to $49,999 | 723 (17.9%) | 289 (12.7%) |
| $50,000 to $74,999 | 914 (22.7%) | 475 (20.9%) |
| $75,000 to $99,999 | 681 (16.9%) | 174 (7.7%) |
| $100,000 to $149,999 | 494 (12.2%) | 120 (5.3%) |
| $150,000 or more | 406 (10.1%) | 0 (0.0%) |
| Total | 4,034 (100.0%) | 2,273 (100.0%) |
Monthly Housing Cost Tiers in Owosso
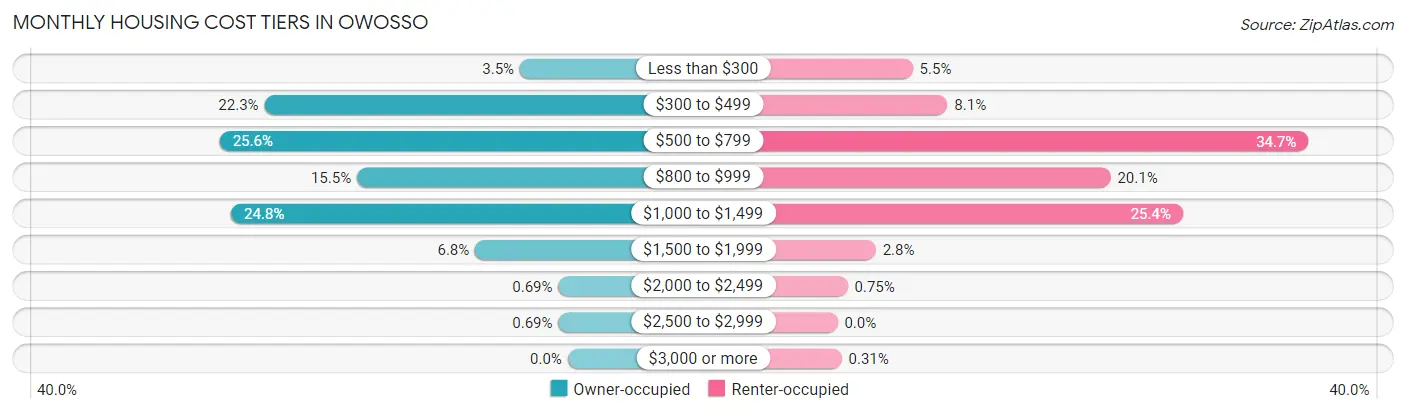
| Monthly Cost | Owner-occupied | Renter-occupied |
| Less than $300 | 142 (3.5%) | 126 (5.5%) |
| $300 to $499 | 901 (22.3%) | 184 (8.1%) |
| $500 to $799 | 1,034 (25.6%) | 788 (34.7%) |
| $800 to $999 | 626 (15.5%) | 457 (20.1%) |
| $1,000 to $1,499 | 1,000 (24.8%) | 578 (25.4%) |
| $1,500 to $1,999 | 275 (6.8%) | 64 (2.8%) |
| $2,000 to $2,499 | 28 (0.7%) | 17 (0.7%) |
| $2,500 to $2,999 | 28 (0.7%) | 0 (0.0%) |
| $3,000 or more | 0 (0.0%) | 7 (0.3%) |
| Total | 4,034 (100.0%) | 2,273 (100.0%) |
Physical Housing Characteristics in Owosso
Housing Structures in Owosso
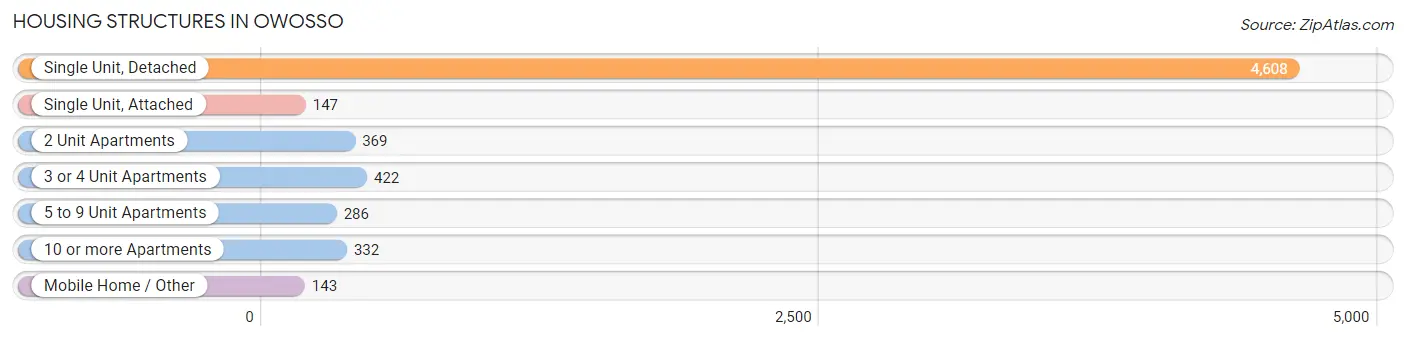
| Structure Type | # Housing Units | % Housing Units |
| Single Unit, Detached | 4,608 | 73.1% |
| Single Unit, Attached | 147 | 2.3% |
| 2 Unit Apartments | 369 | 5.9% |
| 3 or 4 Unit Apartments | 422 | 6.7% |
| 5 to 9 Unit Apartments | 286 | 4.5% |
| 10 or more Apartments | 332 | 5.3% |
| Mobile Home / Other | 143 | 2.3% |
| Total | 6,307 | 100.0% |
Housing Structures by Occupancy in Owosso
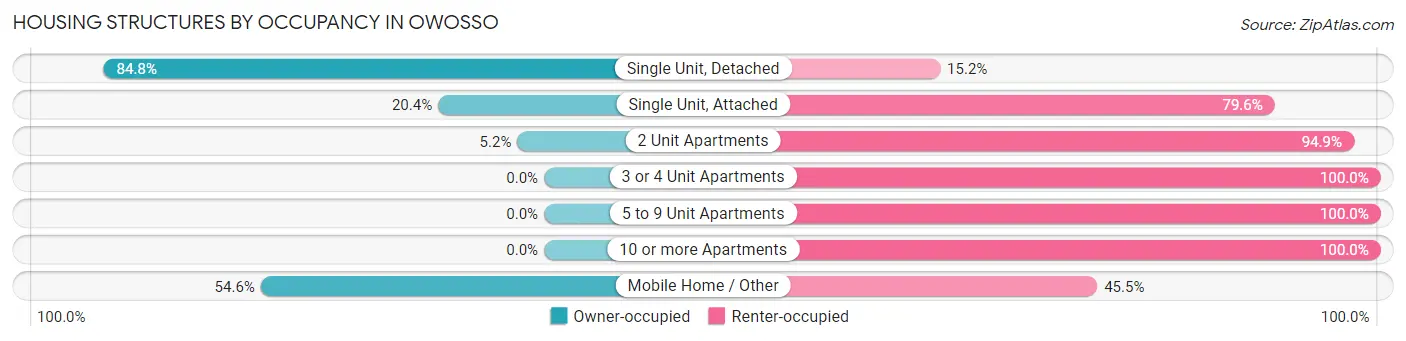
| Structure Type | Owner-occupied | Renter-occupied |
| Single Unit, Detached | 3,907 (84.8%) | 701 (15.2%) |
| Single Unit, Attached | 30 (20.4%) | 117 (79.6%) |
| 2 Unit Apartments | 19 (5.1%) | 350 (94.9%) |
| 3 or 4 Unit Apartments | 0 (0.0%) | 422 (100.0%) |
| 5 to 9 Unit Apartments | 0 (0.0%) | 286 (100.0%) |
| 10 or more Apartments | 0 (0.0%) | 332 (100.0%) |
| Mobile Home / Other | 78 (54.5%) | 65 (45.5%) |
| Total | 4,034 (64.0%) | 2,273 (36.0%) |
Housing Structures by Number of Rooms in Owosso
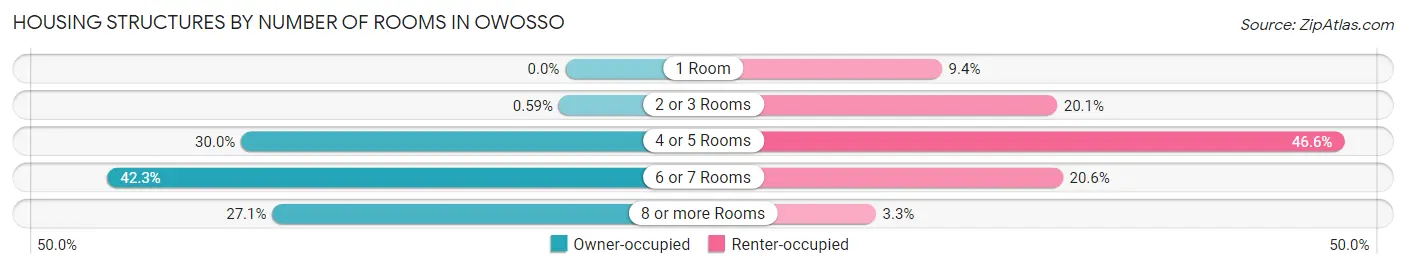
| Number of Rooms | Owner-occupied | Renter-occupied |
| 1 Room | 0 (0.0%) | 214 (9.4%) |
| 2 or 3 Rooms | 24 (0.6%) | 456 (20.1%) |
| 4 or 5 Rooms | 1,209 (30.0%) | 1,060 (46.6%) |
| 6 or 7 Rooms | 1,708 (42.3%) | 468 (20.6%) |
| 8 or more Rooms | 1,093 (27.1%) | 75 (3.3%) |
| Total | 4,034 (100.0%) | 2,273 (100.0%) |
Housing Structure by Heating Type in Owosso
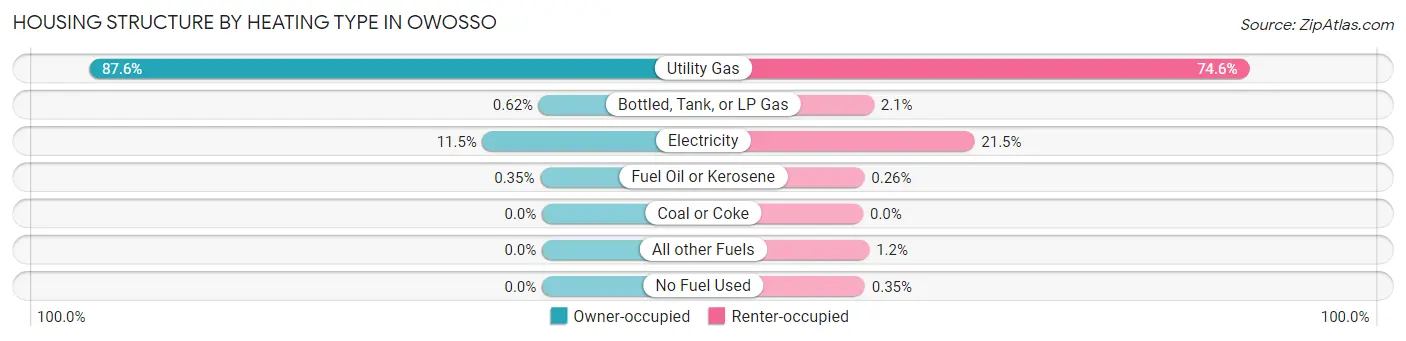
| Heating Type | Owner-occupied | Renter-occupied |
| Utility Gas | 3,532 (87.6%) | 1,696 (74.6%) |
| Bottled, Tank, or LP Gas | 25 (0.6%) | 47 (2.1%) |
| Electricity | 463 (11.5%) | 489 (21.5%) |
| Fuel Oil or Kerosene | 14 (0.4%) | 6 (0.3%) |
| Coal or Coke | 0 (0.0%) | 0 (0.0%) |
| All other Fuels | 0 (0.0%) | 27 (1.2%) |
| No Fuel Used | 0 (0.0%) | 8 (0.4%) |
| Total | 4,034 (100.0%) | 2,273 (100.0%) |
Household Vehicle Usage in Owosso
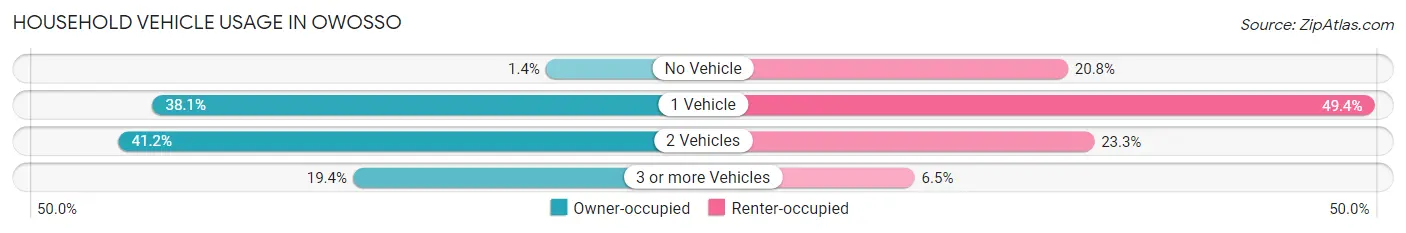
| Vehicles per Household | Owner-occupied | Renter-occupied |
| No Vehicle | 55 (1.4%) | 473 (20.8%) |
| 1 Vehicle | 1,535 (38.1%) | 1,123 (49.4%) |
| 2 Vehicles | 1,663 (41.2%) | 529 (23.3%) |
| 3 or more Vehicles | 781 (19.4%) | 148 (6.5%) |
| Total | 4,034 (100.0%) | 2,273 (100.0%) |
Real Estate & Mortgages in Owosso
Real Estate and Mortgage Overview in Owosso
| Characteristic | Without Mortgage | With Mortgage |
| Housing Units | 1,797 | 2,237 |
| Median Property Value | $117,700 | $110,400 |
| Median Household Income | $48,053 | $290 |
| Monthly Housing Costs | $469 | $0 |
| Real Estate Taxes | $2,092 | $48 |
Property Value by Mortgage Status in Owosso
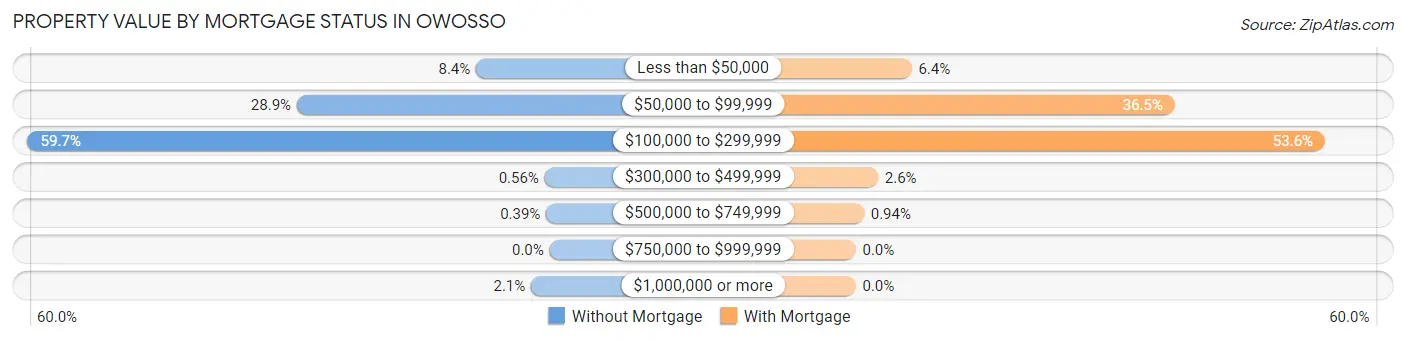
| Property Value | Without Mortgage | With Mortgage |
| Less than $50,000 | 151 (8.4%) | 143 (6.4%) |
| $50,000 to $99,999 | 519 (28.9%) | 816 (36.5%) |
| $100,000 to $299,999 | 1,072 (59.7%) | 1,200 (53.6%) |
| $300,000 to $499,999 | 10 (0.6%) | 57 (2.5%) |
| $500,000 to $749,999 | 7 (0.4%) | 21 (0.9%) |
| $750,000 to $999,999 | 0 (0.0%) | 0 (0.0%) |
| $1,000,000 or more | 38 (2.1%) | 0 (0.0%) |
| Total | 1,797 (100.0%) | 2,237 (100.0%) |
Household Income by Mortgage Status in Owosso
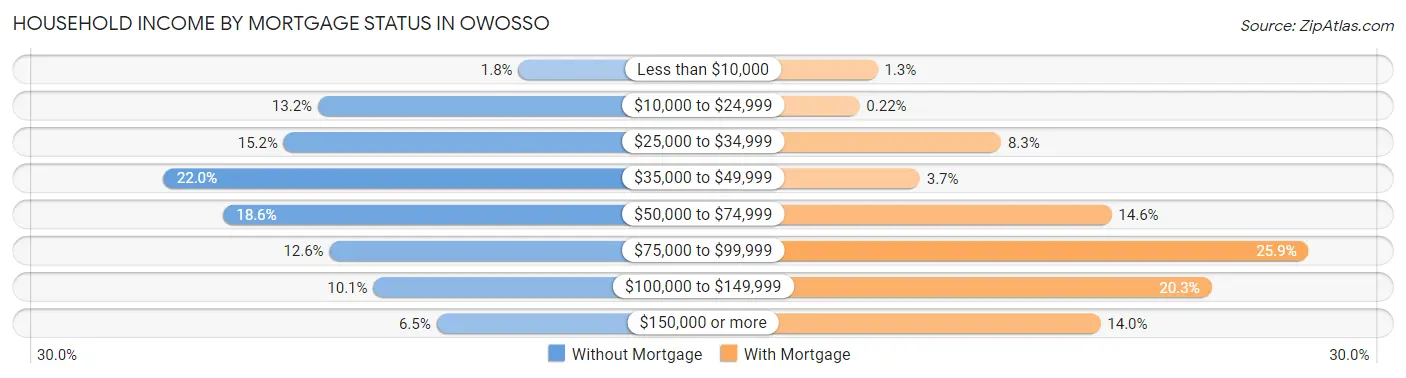
| Household Income | Without Mortgage | With Mortgage |
| Less than $10,000 | 32 (1.8%) | 28 (1.3%) |
| $10,000 to $24,999 | 238 (13.2%) | 5 (0.2%) |
| $25,000 to $34,999 | 273 (15.2%) | 186 (8.3%) |
| $35,000 to $49,999 | 396 (22.0%) | 82 (3.7%) |
| $50,000 to $74,999 | 335 (18.6%) | 327 (14.6%) |
| $75,000 to $99,999 | 226 (12.6%) | 579 (25.9%) |
| $100,000 to $149,999 | 181 (10.1%) | 455 (20.3%) |
| $150,000 or more | 116 (6.5%) | 313 (14.0%) |
| Total | 1,797 (100.0%) | 2,237 (100.0%) |
Property Value to Household Income Ratio in Owosso
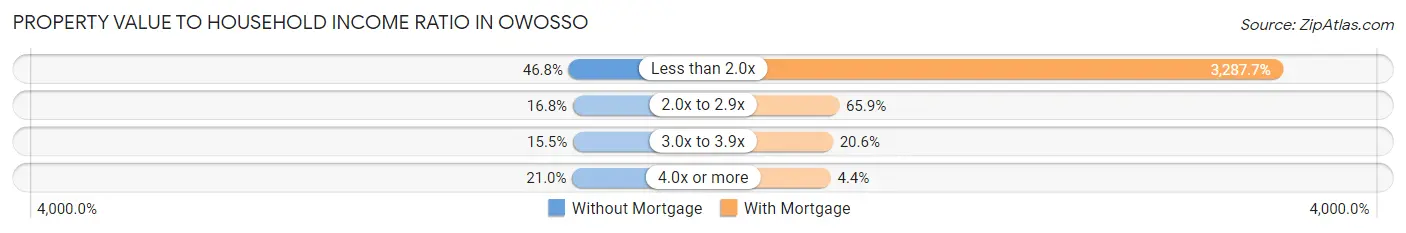
| Value-to-Income Ratio | Without Mortgage | With Mortgage |
| Less than 2.0x | 841 (46.8%) | 73,546 (3,287.7%) |
| 2.0x to 2.9x | 301 (16.8%) | 1,475 (65.9%) |
| 3.0x to 3.9x | 278 (15.5%) | 460 (20.6%) |
| 4.0x or more | 377 (21.0%) | 99 (4.4%) |
| Total | 1,797 (100.0%) | 2,237 (100.0%) |
Real Estate Taxes by Mortgage Status in Owosso
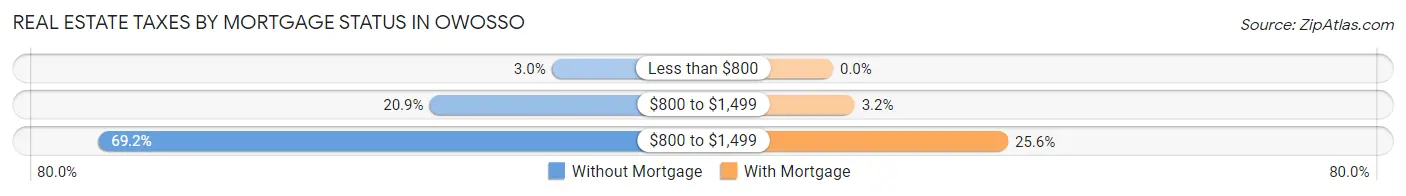
| Property Taxes | Without Mortgage | With Mortgage |
| Less than $800 | 54 (3.0%) | 0 (0.0%) |
| $800 to $1,499 | 375 (20.9%) | 71 (3.2%) |
| $800 to $1,499 | 1,244 (69.2%) | 572 (25.6%) |
| Total | 1,797 (100.0%) | 2,237 (100.0%) |
Health & Disability in Owosso
Health Insurance Coverage by Age in Owosso
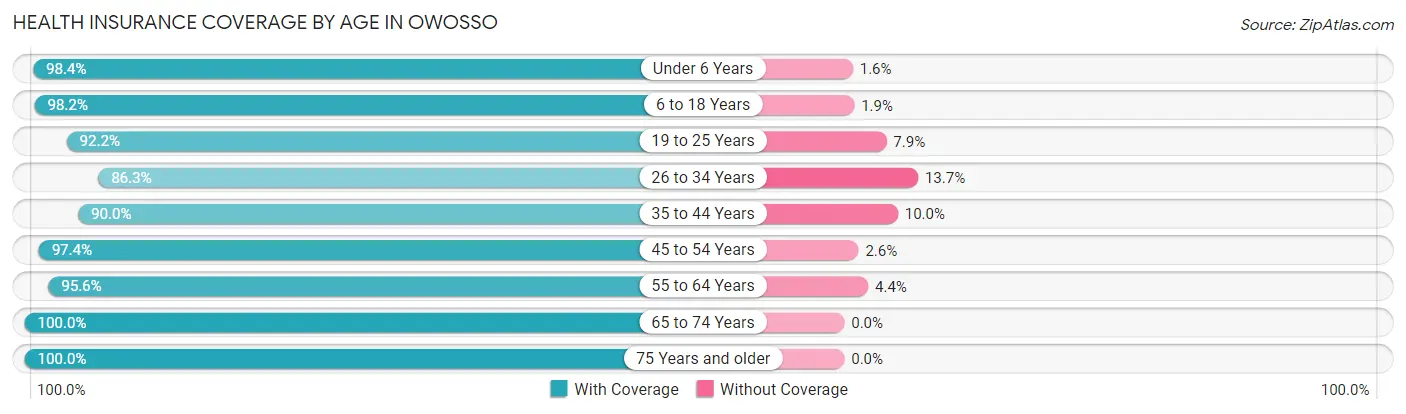
| Age Bracket | With Coverage | Without Coverage |
| Under 6 Years | 1,061 (98.4%) | 17 (1.6%) |
| 6 to 18 Years | 2,280 (98.2%) | 43 (1.8%) |
| 19 to 25 Years | 1,480 (92.1%) | 126 (7.9%) |
| 26 to 34 Years | 1,702 (86.3%) | 271 (13.7%) |
| 35 to 44 Years | 1,642 (90.0%) | 182 (10.0%) |
| 45 to 54 Years | 1,587 (97.4%) | 43 (2.6%) |
| 55 to 64 Years | 1,742 (95.6%) | 81 (4.4%) |
| 65 to 74 Years | 1,457 (100.0%) | 0 (0.0%) |
| 75 Years and older | 915 (100.0%) | 0 (0.0%) |
| Total | 13,866 (94.8%) | 763 (5.2%) |
Health Insurance Coverage by Citizenship Status in Owosso
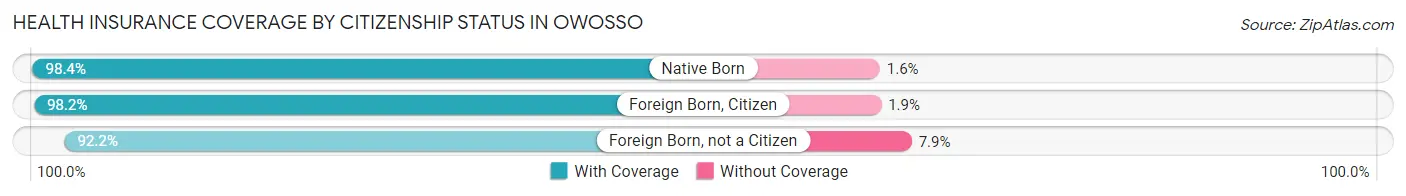
| Citizenship Status | With Coverage | Without Coverage |
| Native Born | 1,061 (98.4%) | 17 (1.6%) |
| Foreign Born, Citizen | 2,280 (98.2%) | 43 (1.8%) |
| Foreign Born, not a Citizen | 1,480 (92.1%) | 126 (7.9%) |
Health Insurance Coverage by Household Income in Owosso
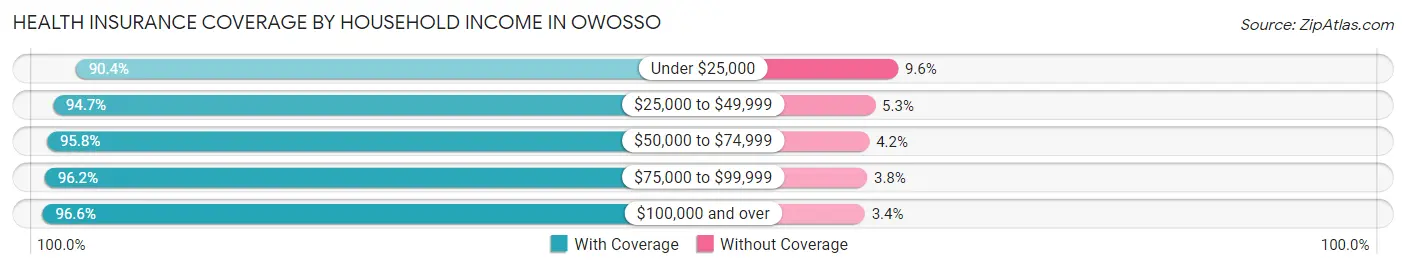
| Household Income | With Coverage | Without Coverage |
| Under $25,000 | 1,718 (90.4%) | 182 (9.6%) |
| $25,000 to $49,999 | 3,300 (94.7%) | 185 (5.3%) |
| $50,000 to $74,999 | 3,356 (95.8%) | 147 (4.2%) |
| $75,000 to $99,999 | 2,487 (96.2%) | 98 (3.8%) |
| $100,000 and over | 2,880 (96.6%) | 100 (3.4%) |
Public vs Private Health Insurance Coverage by Age in Owosso
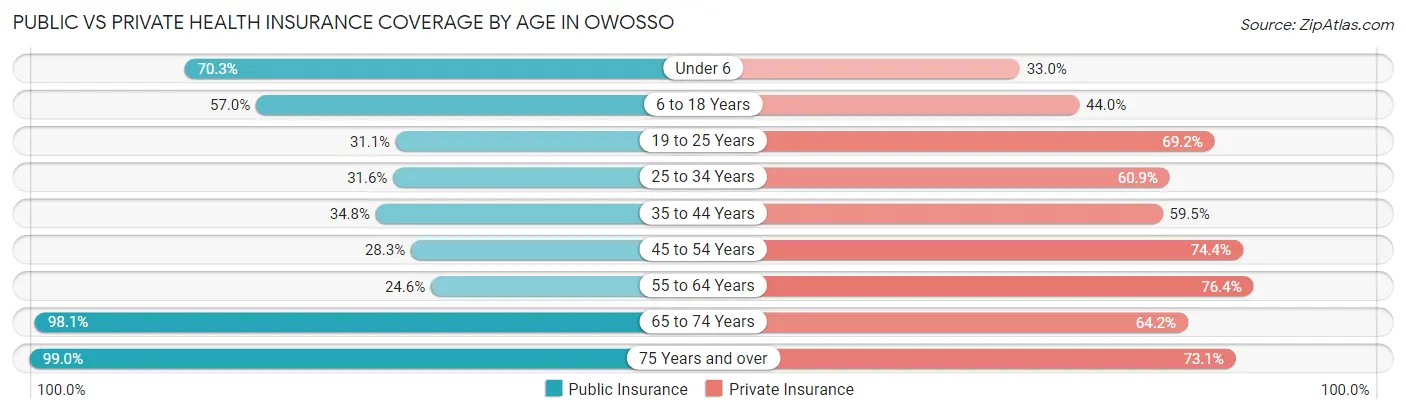
| Age Bracket | Public Insurance | Private Insurance |
| Under 6 | 758 (70.3%) | 356 (33.0%) |
| 6 to 18 Years | 1,325 (57.0%) | 1,023 (44.0%) |
| 19 to 25 Years | 499 (31.1%) | 1,111 (69.2%) |
| 25 to 34 Years | 623 (31.6%) | 1,201 (60.9%) |
| 35 to 44 Years | 635 (34.8%) | 1,086 (59.5%) |
| 45 to 54 Years | 461 (28.3%) | 1,213 (74.4%) |
| 55 to 64 Years | 448 (24.6%) | 1,393 (76.4%) |
| 65 to 74 Years | 1,429 (98.1%) | 936 (64.2%) |
| 75 Years and over | 906 (99.0%) | 669 (73.1%) |
| Total | 7,084 (48.4%) | 8,988 (61.4%) |
Disability Status by Sex by Age in Owosso
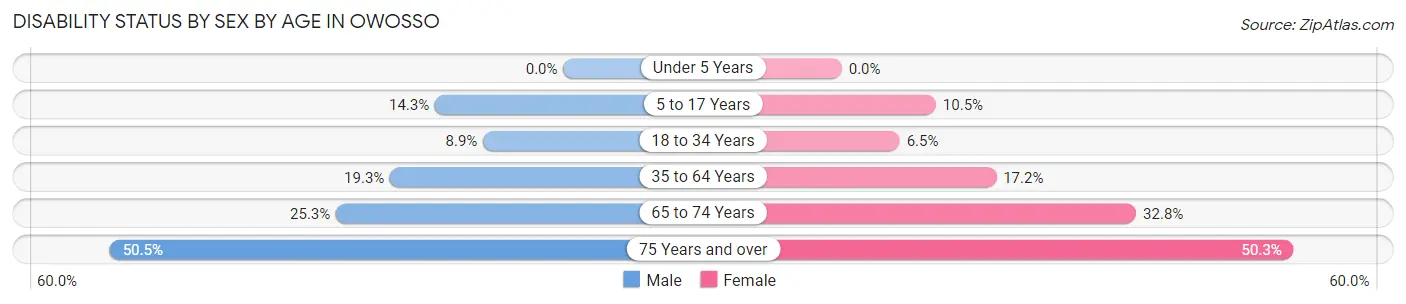
| Age Bracket | Male | Female |
| Under 5 Years | 0 (0.0%) | 0 (0.0%) |
| 5 to 17 Years | 159 (14.3%) | 126 (10.5%) |
| 18 to 34 Years | 168 (8.9%) | 126 (6.5%) |
| 35 to 64 Years | 501 (19.3%) | 461 (17.2%) |
| 65 to 74 Years | 185 (25.3%) | 238 (32.8%) |
| 75 Years and over | 147 (50.5%) | 314 (50.3%) |
Disability Class by Sex by Age in Owosso
Disability Class: Hearing Difficulty
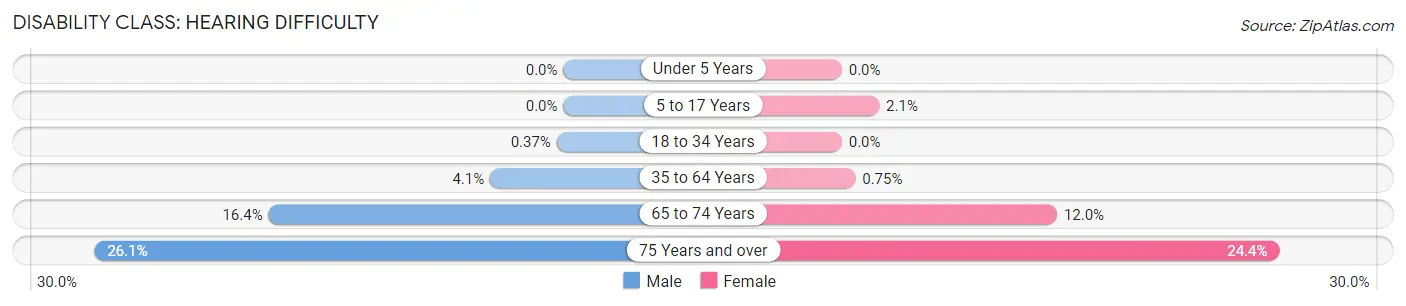
| Age Bracket | Male | Female |
| Under 5 Years | 0 (0.0%) | 0 (0.0%) |
| 5 to 17 Years | 0 (0.0%) | 25 (2.1%) |
| 18 to 34 Years | 7 (0.4%) | 0 (0.0%) |
| 35 to 64 Years | 106 (4.1%) | 20 (0.7%) |
| 65 to 74 Years | 120 (16.4%) | 87 (12.0%) |
| 75 Years and over | 76 (26.1%) | 152 (24.4%) |
Disability Class: Vision Difficulty
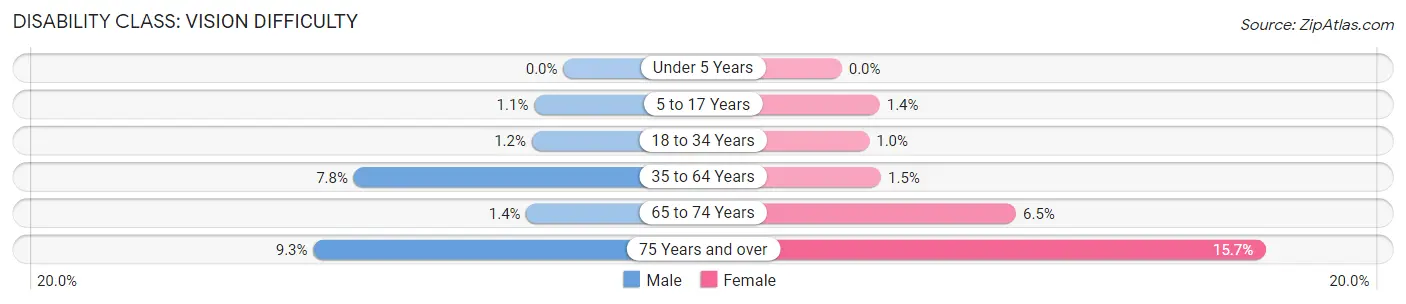
| Age Bracket | Male | Female |
| Under 5 Years | 0 (0.0%) | 0 (0.0%) |
| 5 to 17 Years | 12 (1.1%) | 17 (1.4%) |
| 18 to 34 Years | 22 (1.2%) | 20 (1.0%) |
| 35 to 64 Years | 202 (7.8%) | 39 (1.5%) |
| 65 to 74 Years | 10 (1.4%) | 47 (6.5%) |
| 75 Years and over | 27 (9.3%) | 98 (15.7%) |
Disability Class: Cognitive Difficulty
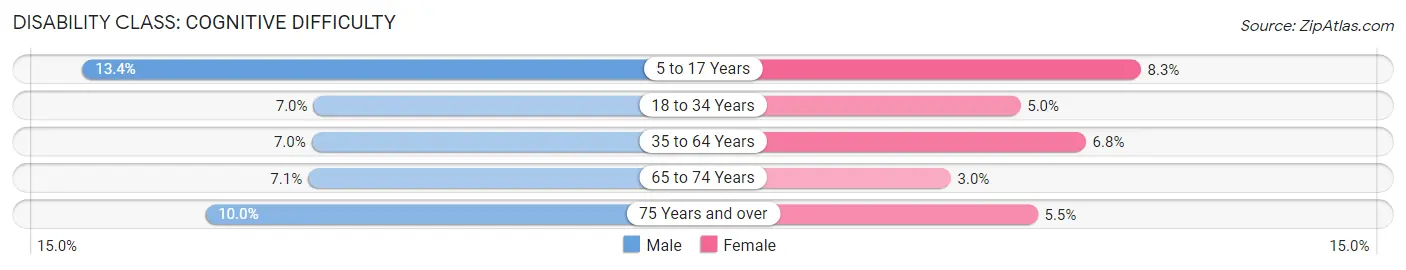
| Age Bracket | Male | Female |
| 5 to 17 Years | 149 (13.4%) | 100 (8.3%) |
| 18 to 34 Years | 131 (7.0%) | 97 (5.0%) |
| 35 to 64 Years | 182 (7.0%) | 182 (6.8%) |
| 65 to 74 Years | 52 (7.1%) | 22 (3.0%) |
| 75 Years and over | 29 (10.0%) | 34 (5.4%) |
Disability Class: Ambulatory Difficulty
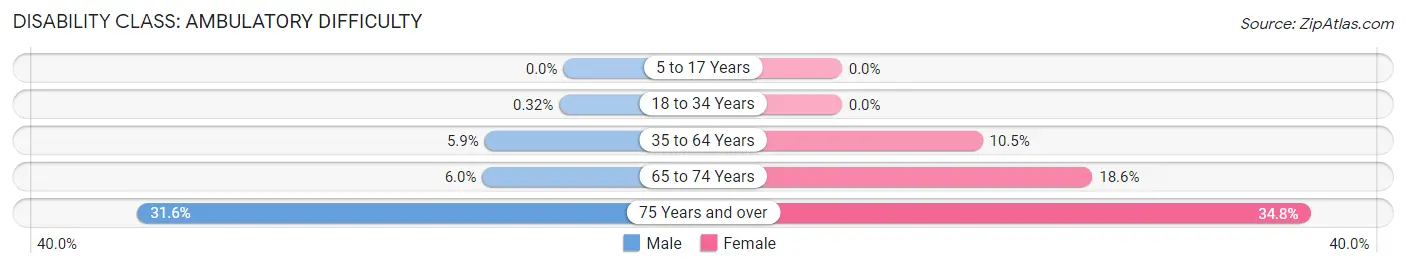
| Age Bracket | Male | Female |
| 5 to 17 Years | 0 (0.0%) | 0 (0.0%) |
| 18 to 34 Years | 6 (0.3%) | 0 (0.0%) |
| 35 to 64 Years | 152 (5.9%) | 280 (10.4%) |
| 65 to 74 Years | 44 (6.0%) | 135 (18.6%) |
| 75 Years and over | 92 (31.6%) | 217 (34.8%) |
Disability Class: Self-Care Difficulty
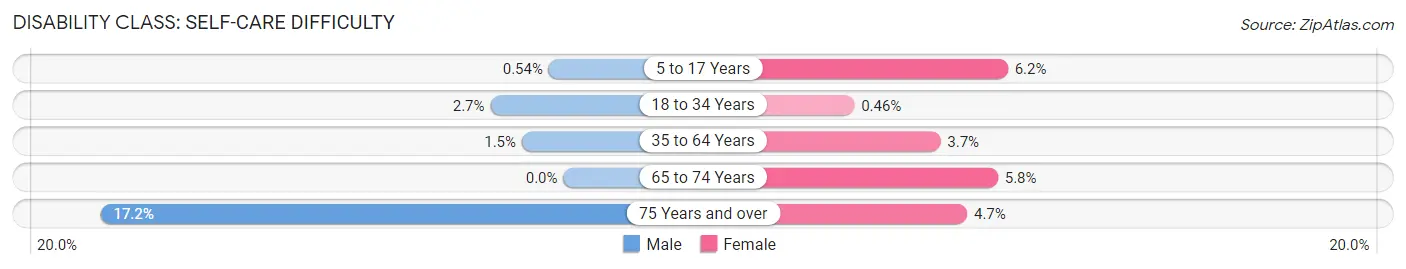
| Age Bracket | Male | Female |
| 5 to 17 Years | 6 (0.5%) | 74 (6.2%) |
| 18 to 34 Years | 51 (2.7%) | 9 (0.5%) |
| 35 to 64 Years | 40 (1.5%) | 98 (3.7%) |
| 65 to 74 Years | 0 (0.0%) | 42 (5.8%) |
| 75 Years and over | 50 (17.2%) | 29 (4.6%) |
Technology Access in Owosso
Computing Device Access in Owosso
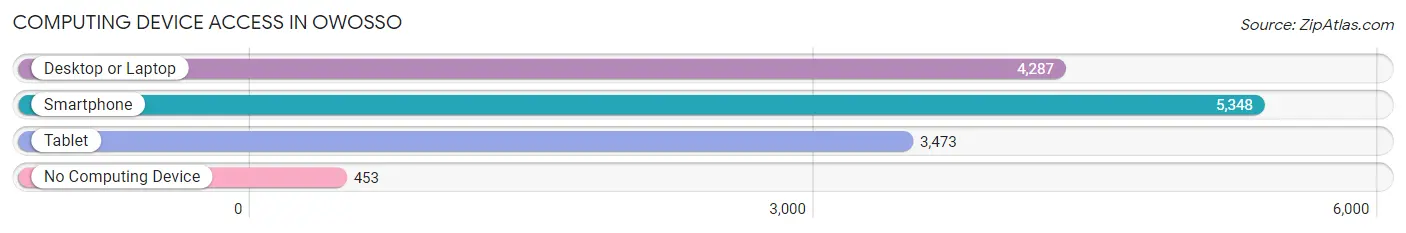
| Device Type | # Households | % Households |
| Desktop or Laptop | 4,287 | 68.0% |
| Smartphone | 5,348 | 84.8% |
| Tablet | 3,473 | 55.1% |
| No Computing Device | 453 | 7.2% |
| Total | 6,307 | 100.0% |
Internet Access in Owosso
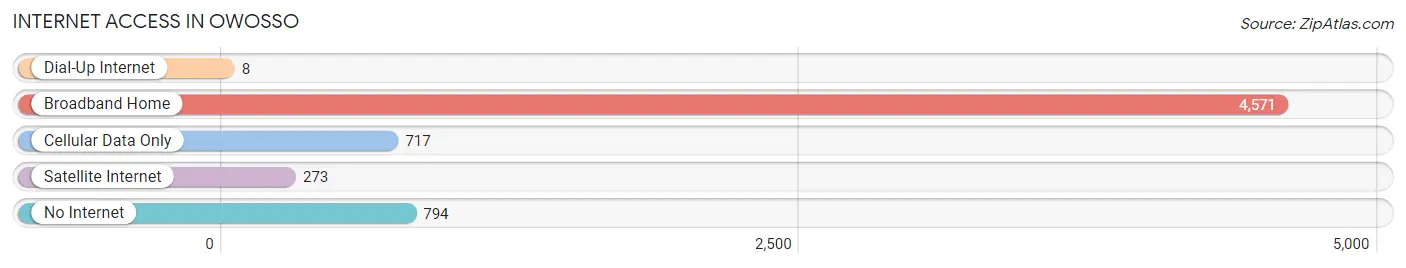
| Internet Type | # Households | % Households |
| Dial-Up Internet | 8 | 0.1% |
| Broadband Home | 4,571 | 72.5% |
| Cellular Data Only | 717 | 11.4% |
| Satellite Internet | 273 | 4.3% |
| No Internet | 794 | 12.6% |
| Total | 6,307 | 100.0% |
Owosso Summary
Owosso is a city located in Shiawassee County, Michigan, United States. It is the county seat of Shiawassee County. The population was 15,194 at the 2010 census, a decline from 15,720 at the 2000 census. It is the principal city of the Owosso Micropolitan Statistical Area, which includes all of Shiawassee County.
History
Owosso was founded in 1836 by George Willard and his brother, Daniel. The city was named after the Ojibwe word for "clarion river". The city was incorporated in 1859.
In the late 19th century, Owosso was home to the Michigan State Normal School (now Eastern Michigan University). The school was founded in 1849 and was the first teacher-training school in the state.
Geography
Owosso is located at the intersection of M-21 and M-52. It is situated on the Shiawassee River, which flows through the city. The city is located approximately 30 miles northeast of Lansing, Michigan.
Owosso has a total area of 8.2 square miles, of which 8.1 square miles is land and 0.1 square miles is water.
Economy
Owosso is home to several major employers, including the Owosso Public Schools, the Shiawassee Regional Education Service District, the Shiawassee County Health Department, and the Shiawassee County Sheriff's Office. The city is also home to several manufacturing companies, including the Owosso Corporation, which produces automotive parts, and the Owosso Tool and Die Company, which produces industrial tools.
Demographics
As of the 2010 census, there were 15,194 people, 6,072 households, and 3,845 families residing in the city. The population density was 1,876.3 people per square mile. The racial makeup of the city was 90.2% White, 4.2% African American, 0.5% Native American, 1.2% Asian, 0.1% Pacific Islander, 1.3% from other races, and 2.5% from two or more races. Hispanic or Latino of any race were 4.2% of the population.
The median income for a household in the city was $37,945, and the median income for a family was $48,945. The per capita income for the city was $20,845. About 11.2% of families and 14.2% of the population were below the poverty line, including 19.2% of those under age 18 and 8.2% of those age 65 or over.
Common Questions
What is Per Capita Income in Owosso?
Per Capita income in Owosso is $30,837.
What is the Median Family Income in Owosso?
Median Family Income in Owosso is $63,804.
What is the Median Household income in Owosso?
Median Household Income in Owosso is $51,794.
What is Income or Wage Gap in Owosso?
Income or Wage Gap in Owosso is 26.2%.
Women in Owosso earn 73.8 cents for every dollar earned by a man.
What is Family Income Deficit in Owosso?
Family Income Deficit in Owosso is $8,503.
Families that are below poverty line in Owosso earn $8,503 less on average than the poverty threshold level.
What is Inequality or Gini Index in Owosso?
Inequality or Gini Index in Owosso is 0.45.
What is the Total Population of Owosso?
Total Population of Owosso is 14,678.
What is the Total Male Population of Owosso?
Total Male Population of Owosso is 7,111.
What is the Total Female Population of Owosso?
Total Female Population of Owosso is 7,567.
What is the Ratio of Males per 100 Females in Owosso?
There are 93.97 Males per 100 Females in Owosso.
What is the Ratio of Females per 100 Males in Owosso?
There are 106.41 Females per 100 Males in Owosso.
What is the Median Population Age in Owosso?
Median Population Age in Owosso is 37.2 Years.
What is the Average Family Size in Owosso
Average Family Size in Owosso is 3.0 People.
What is the Average Household Size in Owosso
Average Household Size in Owosso is 2.3 People.
How Large is the Labor Force in Owosso?
There are 7,776 People in the Labor Forcein in Owosso.
What is the Percentage of People in the Labor Force in Owosso?
65.4% of People are in the Labor Force in Owosso.
What is the Unemployment Rate in Owosso?
Unemployment Rate in Owosso is 4.5%.