Highland Park, MI Map & Demographics
Highland Park Map
Highland Park Overview
$23,710
PER CAPITA INCOME
$45,938
AVG FAMILY INCOME
$30,341
AVG HOUSEHOLD INCOME
32.8%
WAGE / INCOME GAP [ % ]
67.2¢/ $1
WAGE / INCOME GAP [ $ ]
$8,261
FAMILY INCOME DEFICIT
0.57
INEQUALITY / GINI INDEX
9,032
TOTAL POPULATION
4,266
MALE POPULATION
4,766
FEMALE POPULATION
89.51
MALES / 100 FEMALES
111.72
FEMALES / 100 MALES
45.9
MEDIAN AGE
3.6
AVG FAMILY SIZE
2.2
AVG HOUSEHOLD SIZE
3,701
LABOR FORCE [ PEOPLE ]
49.8%
PERCENT IN LABOR FORCE
18.2%
UNEMPLOYMENT RATE
Highland Park Zip Codes
Highland Park Area Codes
Income in Highland Park
Income Overview in Highland Park
Per Capita Income in Highland Park is $23,710, while median incomes of families and households are $45,938 and $30,341 respectively.
| Characteristic | Number | Measure |
| Per Capita Income | 9,032 | $23,710 |
| Median Family Income | 1,544 | $45,938 |
| Mean Family Income | 1,544 | $82,802 |
| Median Household Income | 3,849 | $30,341 |
| Mean Household Income | 3,849 | $51,687 |
| Income Deficit | 1,544 | $8,261 |
| Wage / Income Gap (%) | 9,032 | 32.79% |
| Wage / Income Gap ($) | 9,032 | 67.21¢ per $1 |
| Gini / Inequality Index | 9,032 | 0.57 |
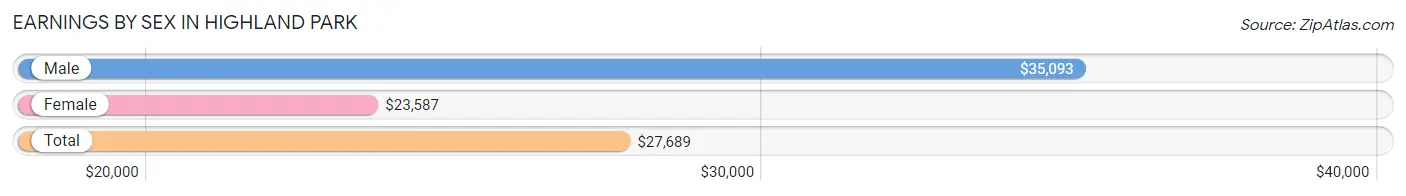
Earnings by Sex in Highland Park
Average Earnings in Highland Park are $27,689, $35,093 for men and $23,587 for women, a difference of 32.8%.
| Sex | Number | Average Earnings |
| Male | 1,460 (42.1%) | $35,093 |
| Female | 2,010 (57.9%) | $23,587 |
| Total | 3,470 (100.0%) | $27,689 |
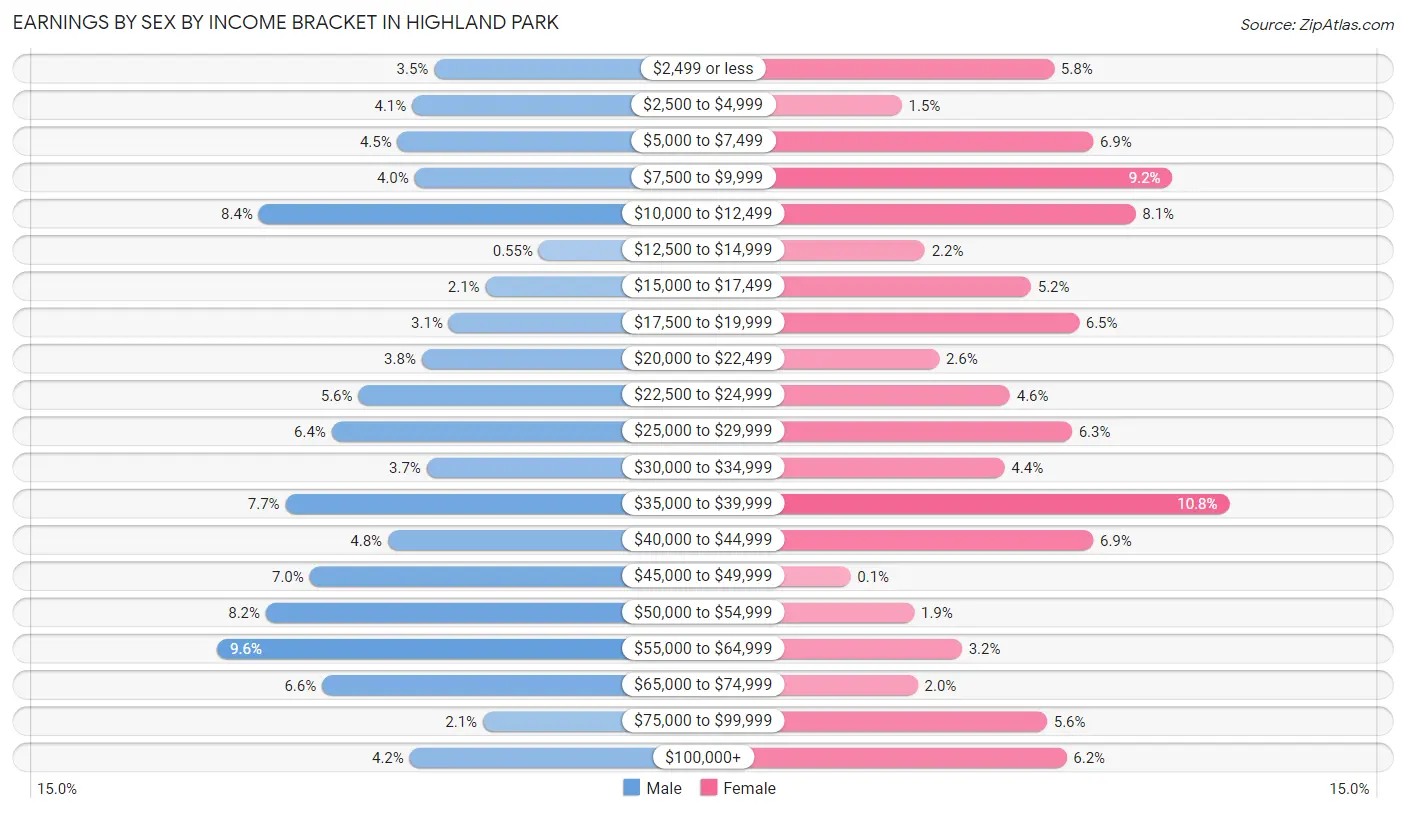
Earnings by Sex by Income Bracket in Highland Park
The most common earnings brackets in Highland Park are $55,000 to $64,999 for men (140 | 9.6%) and $35,000 to $39,999 for women (216 | 10.7%).
| Income | Male | Female |
| $2,499 or less | 51 (3.5%) | 117 (5.8%) |
| $2,500 to $4,999 | 60 (4.1%) | 31 (1.5%) |
| $5,000 to $7,499 | 66 (4.5%) | 139 (6.9%) |
| $7,500 to $9,999 | 59 (4.0%) | 184 (9.1%) |
| $10,000 to $12,499 | 123 (8.4%) | 163 (8.1%) |
| $12,500 to $14,999 | 8 (0.5%) | 44 (2.2%) |
| $15,000 to $17,499 | 30 (2.1%) | 104 (5.2%) |
| $17,500 to $19,999 | 45 (3.1%) | 131 (6.5%) |
| $20,000 to $22,499 | 56 (3.8%) | 52 (2.6%) |
| $22,500 to $24,999 | 82 (5.6%) | 92 (4.6%) |
| $25,000 to $29,999 | 93 (6.4%) | 127 (6.3%) |
| $30,000 to $34,999 | 54 (3.7%) | 89 (4.4%) |
| $35,000 to $39,999 | 112 (7.7%) | 216 (10.7%) |
| $40,000 to $44,999 | 70 (4.8%) | 139 (6.9%) |
| $45,000 to $49,999 | 102 (7.0%) | 2 (0.1%) |
| $50,000 to $54,999 | 120 (8.2%) | 38 (1.9%) |
| $55,000 to $64,999 | 140 (9.6%) | 65 (3.2%) |
| $65,000 to $74,999 | 97 (6.6%) | 40 (2.0%) |
| $75,000 to $99,999 | 31 (2.1%) | 113 (5.6%) |
| $100,000+ | 61 (4.2%) | 124 (6.2%) |
| Total | 1,460 (100.0%) | 2,010 (100.0%) |
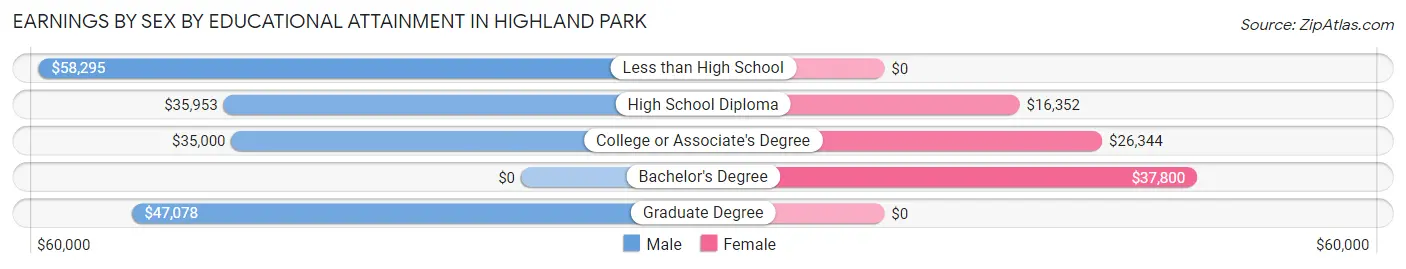
Earnings by Sex by Educational Attainment in Highland Park
Average earnings in Highland Park are $40,328 for men and $28,516 for women, a difference of 29.3%. Men with an educational attainment of less than high school enjoy the highest average annual earnings of $58,295, while those with college or associate's degree education earn the least with $35,000. Women with an educational attainment of bachelor's degree earn the most with the average annual earnings of $37,800, while those with high school diploma education have the smallest earnings of $16,352.
| Educational Attainment | Male Income | Female Income |
| Less than High School | $58,295 | $0 |
| High School Diploma | $35,953 | $16,352 |
| College or Associate's Degree | $35,000 | $26,344 |
| Bachelor's Degree | - | - |
| Graduate Degree | $47,078 | $0 |
| Total | $40,328 | $28,516 |
Family Income in Highland Park
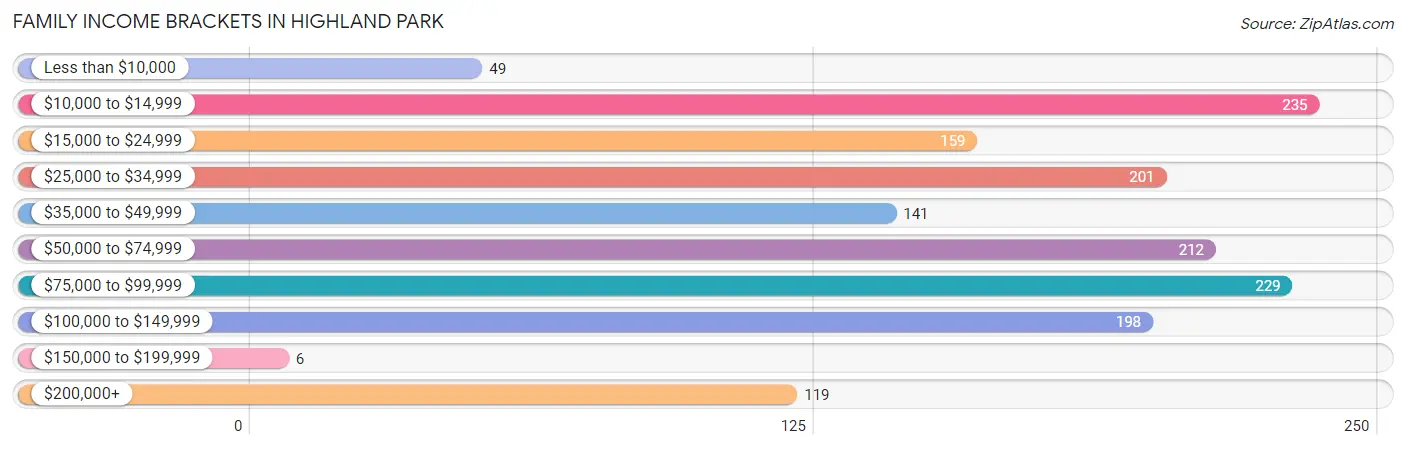
Family Income Brackets in Highland Park
According to the Highland Park family income data, there are 235 families falling into the $10,000 to $14,999 income range, which is the most common income bracket and makes up 15.2% of all families. Conversely, the $150,000 to $199,999 income bracket is the least frequent group with only 6 families (0.4%) belonging to this category.
| Income Bracket | # Families | % Families |
| Less than $10,000 | 49 | 3.2% |
| $10,000 to $14,999 | 235 | 15.2% |
| $15,000 to $24,999 | 159 | 10.3% |
| $25,000 to $34,999 | 201 | 13.0% |
| $35,000 to $49,999 | 141 | 9.1% |
| $50,000 to $74,999 | 212 | 13.7% |
| $75,000 to $99,999 | 229 | 14.8% |
| $100,000 to $149,999 | 198 | 12.8% |
| $150,000 to $199,999 | 6 | 0.4% |
| $200,000+ | 119 | 7.7% |
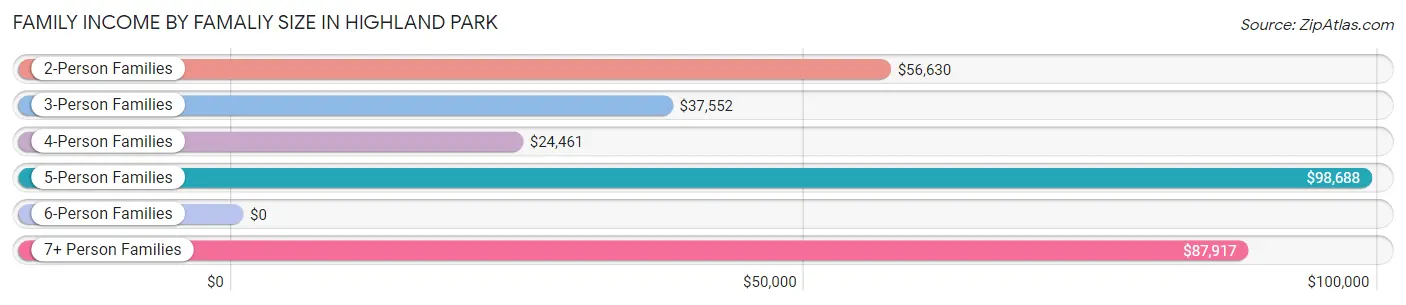
Family Income by Famaliy Size in Highland Park
5-person families (82 | 5.3%) account for the highest median family income in Highland Park with $98,688 per family, while 2-person families (662 | 42.9%) have the highest median income of $28,315 per family member.
| Income Bracket | # Families | Median Income |
| 2-Person Families | 662 (42.9%) | $56,630 |
| 3-Person Families | 529 (34.3%) | $37,552 |
| 4-Person Families | 148 (9.6%) | $24,461 |
| 5-Person Families | 82 (5.3%) | $98,688 |
| 6-Person Families | 43 (2.8%) | $0 |
| 7+ Person Families | 80 (5.2%) | $87,917 |
| Total | 1,544 (100.0%) | $45,938 |
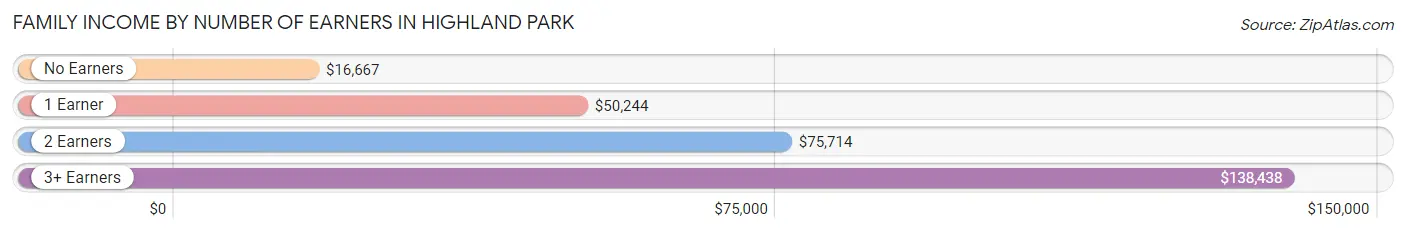
Family Income by Number of Earners in Highland Park
The median family income in Highland Park is $45,938, with families comprising 3+ earners (166) having the highest median family income of $138,438, while families with no earners (392) have the lowest median family income of $16,667, accounting for 10.7% and 25.4% of families, respectively.
| Number of Earners | # Families | Median Income |
| No Earners | 392 (25.4%) | $16,667 |
| 1 Earner | 728 (47.1%) | $50,244 |
| 2 Earners | 258 (16.7%) | $75,714 |
| 3+ Earners | 166 (10.7%) | $138,438 |
| Total | 1,544 (100.0%) | $45,938 |
Household Income in Highland Park
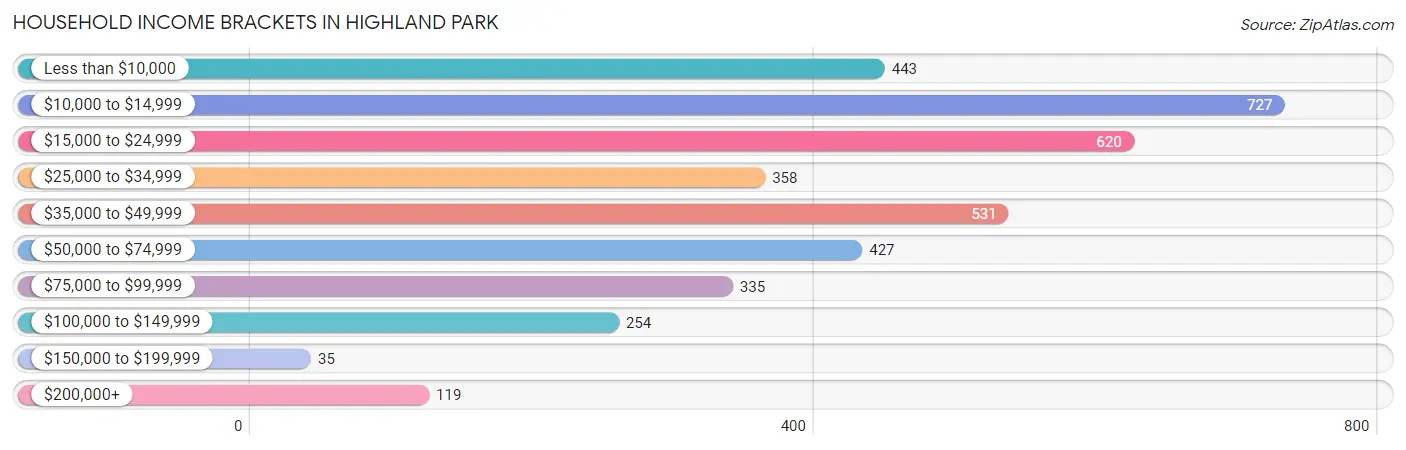
Household Income Brackets in Highland Park
With 727 households falling in the category, the $10,000 to $14,999 income range is the most frequent in Highland Park, accounting for 18.9% of all households. In contrast, only 35 households (0.9%) fall into the $150,000 to $199,999 income bracket, making it the least populous group.
| Income Bracket | # Households | % Households |
| Less than $10,000 | 443 | 11.5% |
| $10,000 to $14,999 | 727 | 18.9% |
| $15,000 to $24,999 | 620 | 16.1% |
| $25,000 to $34,999 | 358 | 9.3% |
| $35,000 to $49,999 | 531 | 13.8% |
| $50,000 to $74,999 | 427 | 11.1% |
| $75,000 to $99,999 | 335 | 8.7% |
| $100,000 to $149,999 | 254 | 6.6% |
| $150,000 to $199,999 | 35 | 0.9% |
| $200,000+ | 119 | 3.1% |
Household Income by Householder Age in Highland Park
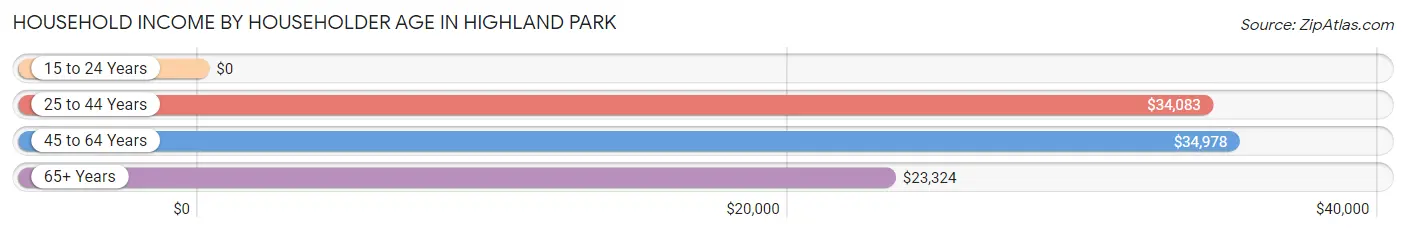
The median household income in Highland Park is $30,341, with the highest median household income of $34,978 found in the 45 to 64 years age bracket for the primary householder. A total of 1,533 households (39.8%) fall into this category. Meanwhile, the 15 to 24 years age bracket for the primary householder has the lowest median household income of $0, with 40 households (1.0%) in this group.
| Income Bracket | # Households | Median Income |
| 15 to 24 Years | 40 (1.0%) | $0 |
| 25 to 44 Years | 744 (19.3%) | $34,083 |
| 45 to 64 Years | 1,533 (39.8%) | $34,978 |
| 65+ Years | 1,532 (39.8%) | $23,324 |
| Total | 3,849 (100.0%) | $30,341 |
Poverty in Highland Park
Income Below Poverty by Sex and Age in Highland Park
With 37.6% poverty level for males and 37.6% for females among the residents of Highland Park, 5 year old males and 5 year old females are the most vulnerable to poverty, with 12 males (100.0%) and 20 females (100.0%) in their respective age groups living below the poverty level.
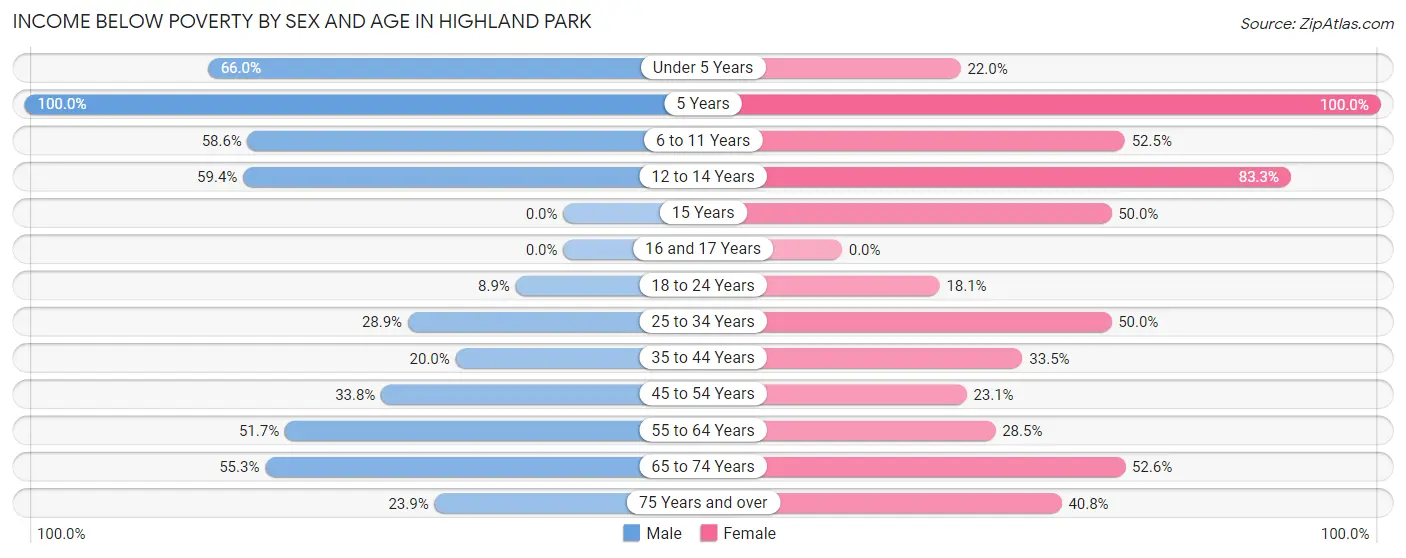
| Age Bracket | Male | Female |
| Under 5 Years | 132 (66.0%) | 50 (22.0%) |
| 5 Years | 12 (100.0%) | 20 (100.0%) |
| 6 to 11 Years | 191 (58.6%) | 177 (52.5%) |
| 12 to 14 Years | 145 (59.4%) | 35 (83.3%) |
| 15 Years | 0 (0.0%) | 36 (50.0%) |
| 16 and 17 Years | 0 (0.0%) | 0 (0.0%) |
| 18 to 24 Years | 33 (8.8%) | 70 (18.1%) |
| 25 to 34 Years | 105 (28.8%) | 266 (50.0%) |
| 35 to 44 Years | 86 (20.0%) | 178 (33.5%) |
| 45 to 54 Years | 191 (33.8%) | 106 (23.1%) |
| 55 to 64 Years | 309 (51.7%) | 235 (28.5%) |
| 65 to 74 Years | 218 (55.3%) | 411 (52.6%) |
| 75 Years and over | 111 (23.9%) | 181 (40.8%) |
| Total | 1,533 (37.6%) | 1,765 (37.6%) |
Income Above Poverty by Sex and Age in Highland Park
According to the poverty statistics in Highland Park, males aged 15 years and females aged 16 and 17 years are the age groups that are most secure financially, with 100.0% of males and 100.0% of females in these age groups living above the poverty line.
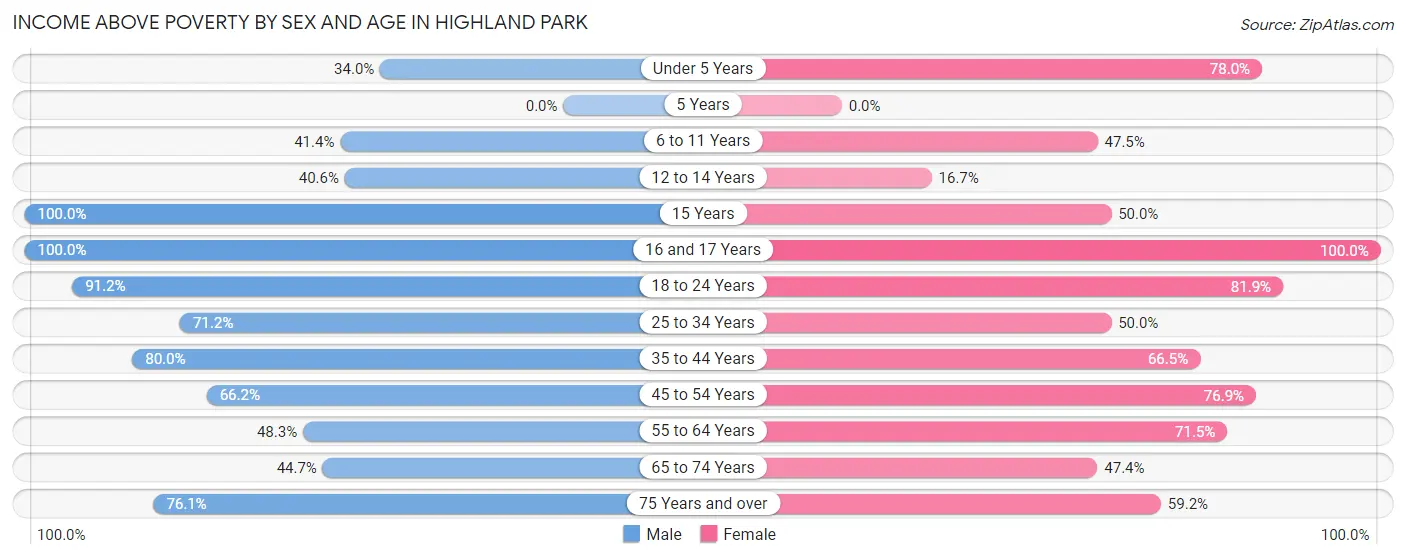
| Age Bracket | Male | Female |
| Under 5 Years | 68 (34.0%) | 177 (78.0%) |
| 5 Years | 0 (0.0%) | 0 (0.0%) |
| 6 to 11 Years | 135 (41.4%) | 160 (47.5%) |
| 12 to 14 Years | 99 (40.6%) | 7 (16.7%) |
| 15 Years | 62 (100.0%) | 36 (50.0%) |
| 16 and 17 Years | 51 (100.0%) | 38 (100.0%) |
| 18 to 24 Years | 340 (91.1%) | 316 (81.9%) |
| 25 to 34 Years | 259 (71.2%) | 266 (50.0%) |
| 35 to 44 Years | 344 (80.0%) | 353 (66.5%) |
| 45 to 54 Years | 374 (66.2%) | 352 (76.9%) |
| 55 to 64 Years | 289 (48.3%) | 590 (71.5%) |
| 65 to 74 Years | 176 (44.7%) | 371 (47.4%) |
| 75 Years and over | 353 (76.1%) | 263 (59.2%) |
| Total | 2,550 (62.5%) | 2,929 (62.4%) |
Income Below Poverty Among Married-Couple Families in Highland Park
The poverty statistics for married-couple families in Highland Park show that 12.0% or 71 of the total 592 families live below the poverty line. Families with no children have the highest poverty rate of 16.4%, comprising of 65 families. On the other hand, families with 3 or 4 children have the lowest poverty rate of 0.0%, which includes 0 families.
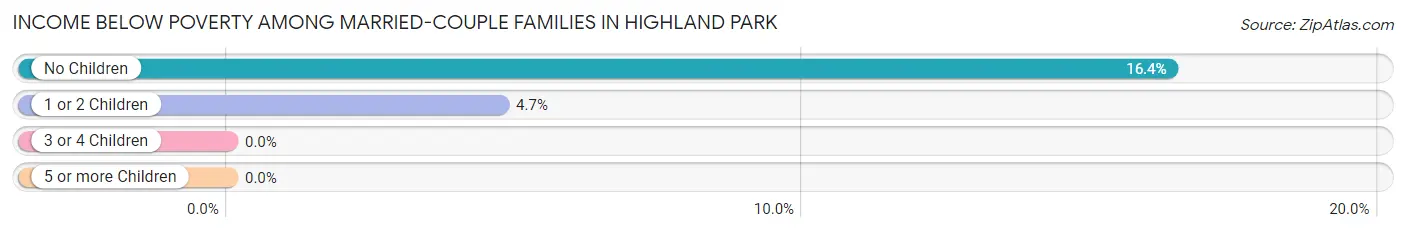
| Children | Above Poverty | Below Poverty |
| No Children | 332 (83.6%) | 65 (16.4%) |
| 1 or 2 Children | 121 (95.3%) | 6 (4.7%) |
| 3 or 4 Children | 50 (100.0%) | 0 (0.0%) |
| 5 or more Children | 18 (100.0%) | 0 (0.0%) |
| Total | 521 (88.0%) | 71 (12.0%) |
Income Below Poverty Among Single-Parent Households in Highland Park
According to the poverty data in Highland Park, 51.8% or 43 single-father households and 40.7% or 354 single-mother households are living below the poverty line. Among single-father households, those with no children have the highest poverty rate, with 16 households (57.1%) experiencing poverty. Likewise, among single-mother households, those with 5 or more children have the highest poverty rate, with 26 households (100.0%) falling below the poverty line.
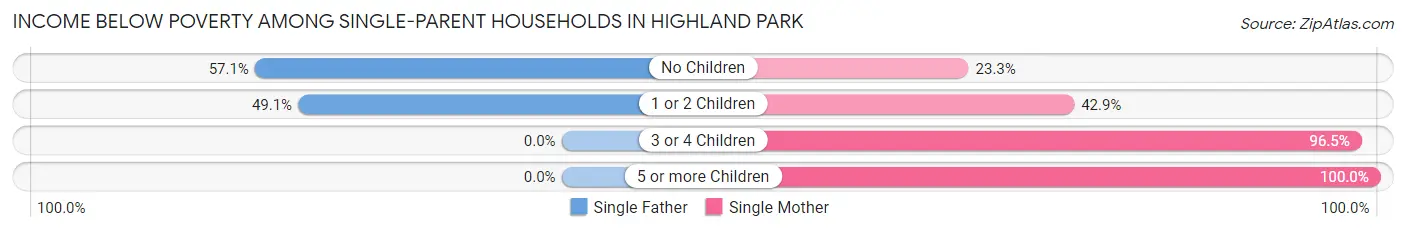
| Children | Single Father | Single Mother |
| No Children | 16 (57.1%) | 94 (23.3%) |
| 1 or 2 Children | 27 (49.1%) | 152 (42.9%) |
| 3 or 4 Children | 0 (0.0%) | 82 (96.5%) |
| 5 or more Children | 0 (0.0%) | 26 (100.0%) |
| Total | 43 (51.8%) | 354 (40.7%) |
Income Below Poverty Among Married-Couple vs Single-Parent Households in Highland Park
The poverty data for Highland Park shows that 71 of the married-couple family households (12.0%) and 397 of the single-parent households (41.7%) are living below the poverty level. Within the married-couple family households, those with no children have the highest poverty rate, with 65 households (16.4%) falling below the poverty line. Among the single-parent households, those with 5 or more children have the highest poverty rate, with 26 household (100.0%) living below poverty.
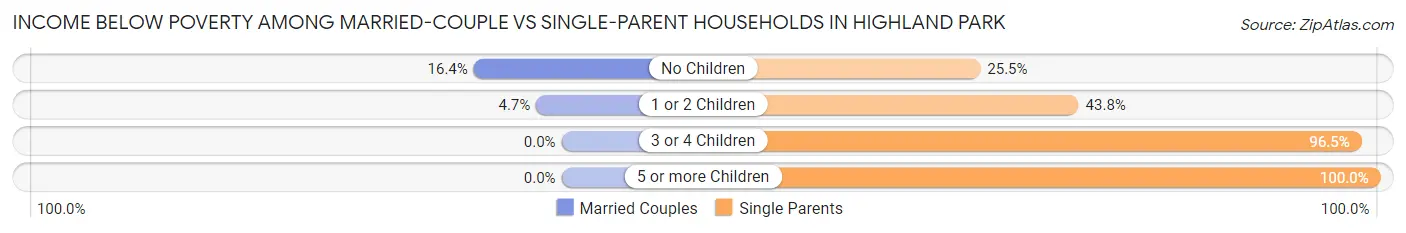
| Children | Married-Couple Families | Single-Parent Households |
| No Children | 65 (16.4%) | 110 (25.5%) |
| 1 or 2 Children | 6 (4.7%) | 179 (43.8%) |
| 3 or 4 Children | 0 (0.0%) | 82 (96.5%) |
| 5 or more Children | 0 (0.0%) | 26 (100.0%) |
| Total | 71 (12.0%) | 397 (41.7%) |
Race in Highland Park
The most populous races in Highland Park are Black / African American (7,959 | 88.1%), White / Caucasian (773 | 8.6%), and Two or more Races (232 | 2.6%).
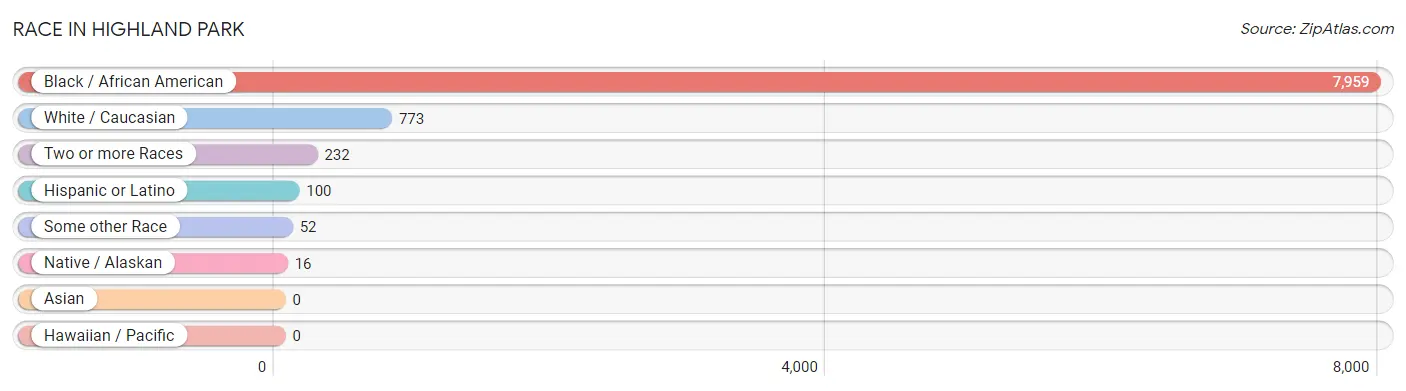
| Race | # Population | % Population |
| Asian | 0 | 0.0% |
| Black / African American | 7,959 | 88.1% |
| Hawaiian / Pacific | 0 | 0.0% |
| Hispanic or Latino | 100 | 1.1% |
| Native / Alaskan | 16 | 0.2% |
| White / Caucasian | 773 | 8.6% |
| Two or more Races | 232 | 2.6% |
| Some other Race | 52 | 0.6% |
| Total | 9,032 | 100.0% |
Ancestry in Highland Park
The most populous ancestries reported in Highland Park are Subsaharan African (394 | 4.4%), African (276 | 3.1%), American (262 | 2.9%), German (211 | 2.3%), and French (165 | 1.8%), together accounting for 14.5% of all Highland Park residents.
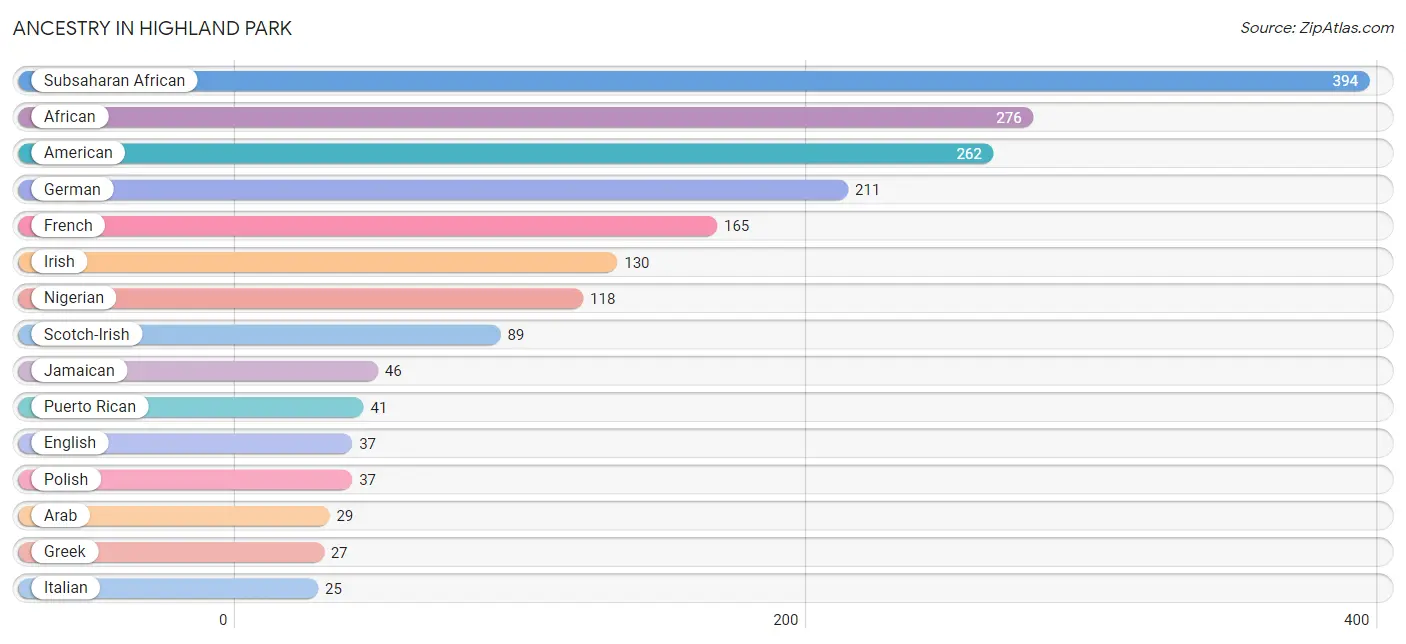
| Ancestry | # Population | % Population |
| African | 276 | 3.1% |
| American | 262 | 2.9% |
| Arab | 29 | 0.3% |
| Armenian | 3 | 0.0% |
| Blackfeet | 11 | 0.1% |
| Cherokee | 11 | 0.1% |
| Dutch | 15 | 0.2% |
| English | 37 | 0.4% |
| European | 1 | 0.0% |
| French | 165 | 1.8% |
| German | 211 | 2.3% |
| Greek | 27 | 0.3% |
| Hungarian | 6 | 0.1% |
| Irish | 130 | 1.4% |
| Italian | 25 | 0.3% |
| Jamaican | 46 | 0.5% |
| Lithuanian | 7 | 0.1% |
| Mexican | 18 | 0.2% |
| Nigerian | 118 | 1.3% |
| Norwegian | 10 | 0.1% |
| Polish | 37 | 0.4% |
| Puerto Rican | 41 | 0.4% |
| Russian | 12 | 0.1% |
| Scotch-Irish | 89 | 1.0% |
| Scottish | 20 | 0.2% |
| Serbian | 12 | 0.1% |
| Spanish American | 12 | 0.1% |
| Subsaharan African | 394 | 4.4% |
| Swedish | 11 | 0.1% | View All 29 Rows |
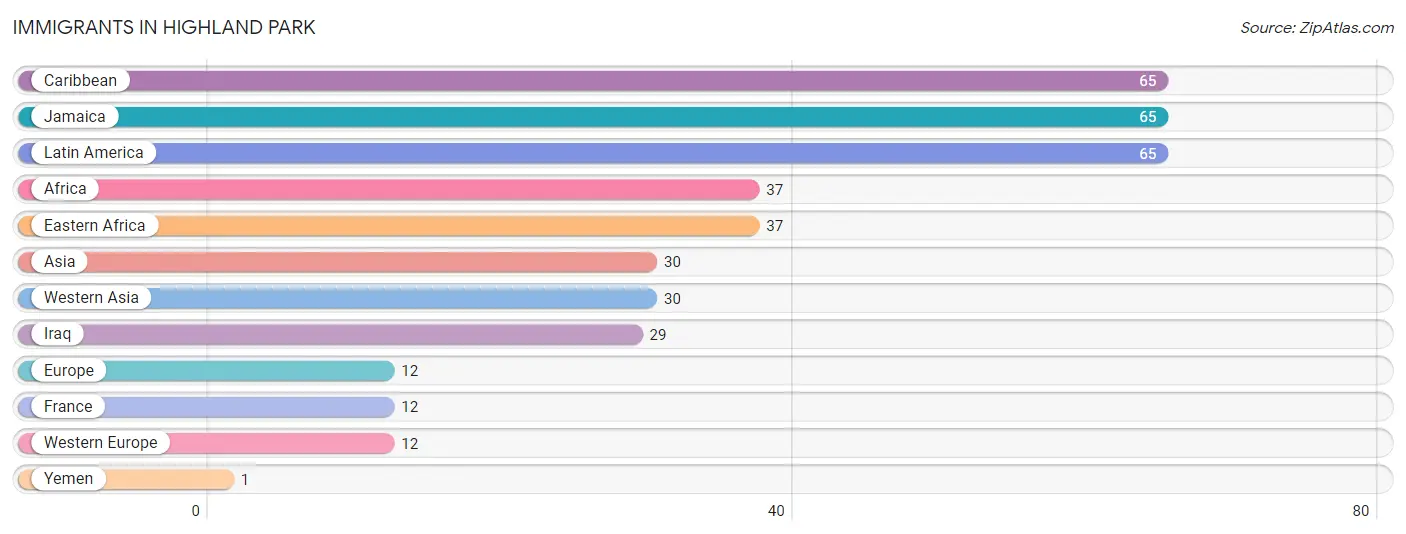
Immigrants in Highland Park
The most numerous immigrant groups reported in Highland Park came from Caribbean (65 | 0.7%), Jamaica (65 | 0.7%), Latin America (65 | 0.7%), Africa (37 | 0.4%), and Eastern Africa (37 | 0.4%), together accounting for 3.0% of all Highland Park residents.
| Immigration Origin | # Population | % Population |
| Africa | 37 | 0.4% |
| Asia | 30 | 0.3% |
| Caribbean | 65 | 0.7% |
| Eastern Africa | 37 | 0.4% |
| Europe | 12 | 0.1% |
| France | 12 | 0.1% |
| Iraq | 29 | 0.3% |
| Jamaica | 65 | 0.7% |
| Latin America | 65 | 0.7% |
| Western Asia | 30 | 0.3% |
| Western Europe | 12 | 0.1% |
| Yemen | 1 | 0.0% | View All 12 Rows |
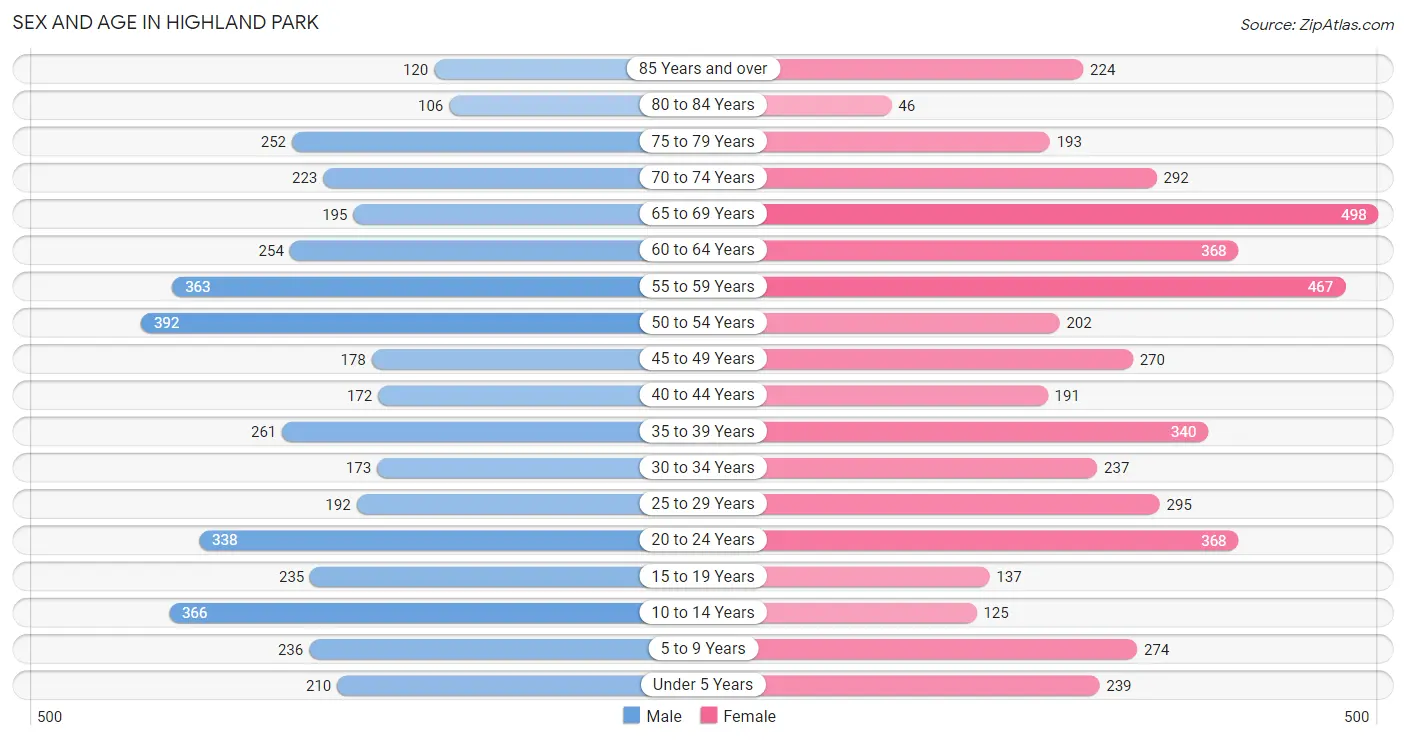
Sex and Age in Highland Park
Sex and Age in Highland Park
The most populous age groups in Highland Park are 50 to 54 Years (392 | 9.2%) for men and 65 to 69 Years (498 | 10.4%) for women.
| Age Bracket | Male | Female |
| Under 5 Years | 210 (4.9%) | 239 (5.0%) |
| 5 to 9 Years | 236 (5.5%) | 274 (5.8%) |
| 10 to 14 Years | 366 (8.6%) | 125 (2.6%) |
| 15 to 19 Years | 235 (5.5%) | 137 (2.9%) |
| 20 to 24 Years | 338 (7.9%) | 368 (7.7%) |
| 25 to 29 Years | 192 (4.5%) | 295 (6.2%) |
| 30 to 34 Years | 173 (4.1%) | 237 (5.0%) |
| 35 to 39 Years | 261 (6.1%) | 340 (7.1%) |
| 40 to 44 Years | 172 (4.0%) | 191 (4.0%) |
| 45 to 49 Years | 178 (4.2%) | 270 (5.7%) |
| 50 to 54 Years | 392 (9.2%) | 202 (4.2%) |
| 55 to 59 Years | 363 (8.5%) | 467 (9.8%) |
| 60 to 64 Years | 254 (5.9%) | 368 (7.7%) |
| 65 to 69 Years | 195 (4.6%) | 498 (10.4%) |
| 70 to 74 Years | 223 (5.2%) | 292 (6.1%) |
| 75 to 79 Years | 252 (5.9%) | 193 (4.1%) |
| 80 to 84 Years | 106 (2.5%) | 46 (1.0%) |
| 85 Years and over | 120 (2.8%) | 224 (4.7%) |
| Total | 4,266 (100.0%) | 4,766 (100.0%) |
Families and Households in Highland Park
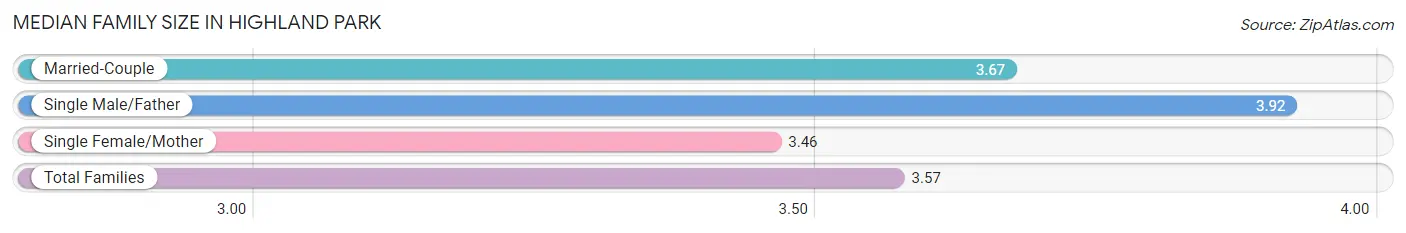
Median Family Size in Highland Park
The median family size in Highland Park is 3.57 persons per family, with single male/father families (83 | 5.4%) accounting for the largest median family size of 3.92 persons per family. On the other hand, single female/mother families (869 | 56.3%) represent the smallest median family size with 3.46 persons per family.
| Family Type | # Families | Family Size |
| Married-Couple | 592 (38.3%) | 3.67 |
| Single Male/Father | 83 (5.4%) | 3.92 |
| Single Female/Mother | 869 (56.3%) | 3.46 |
| Total Families | 1,544 (100.0%) | 3.57 |
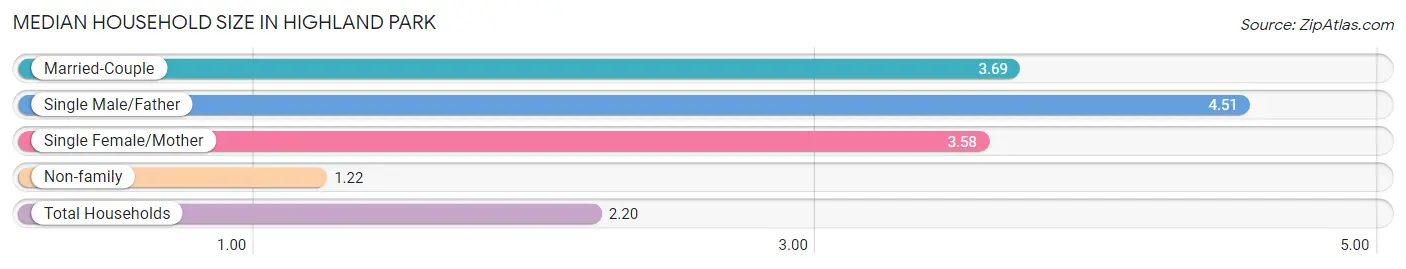
Median Household Size in Highland Park
The median household size in Highland Park is 2.20 persons per household, with single male/father households (83 | 2.2%) accounting for the largest median household size of 4.51 persons per household. non-family households (2,305 | 59.9%) represent the smallest median household size with 1.22 persons per household.
| Household Type | # Households | Household Size |
| Married-Couple | 592 (15.4%) | 3.69 |
| Single Male/Father | 83 (2.2%) | 4.51 |
| Single Female/Mother | 869 (22.6%) | 3.58 |
| Non-family | 2,305 (59.9%) | 1.22 |
| Total Households | 3,849 (100.0%) | 2.20 |
Household Size by Marriage Status in Highland Park
Out of a total of 3,849 households in Highland Park, 1,544 (40.1%) are family households, while 2,305 (59.9%) are nonfamily households. The most numerous type of family households are 2-person households, comprising 617, and the most common type of nonfamily households are 1-person households, comprising 1,963.
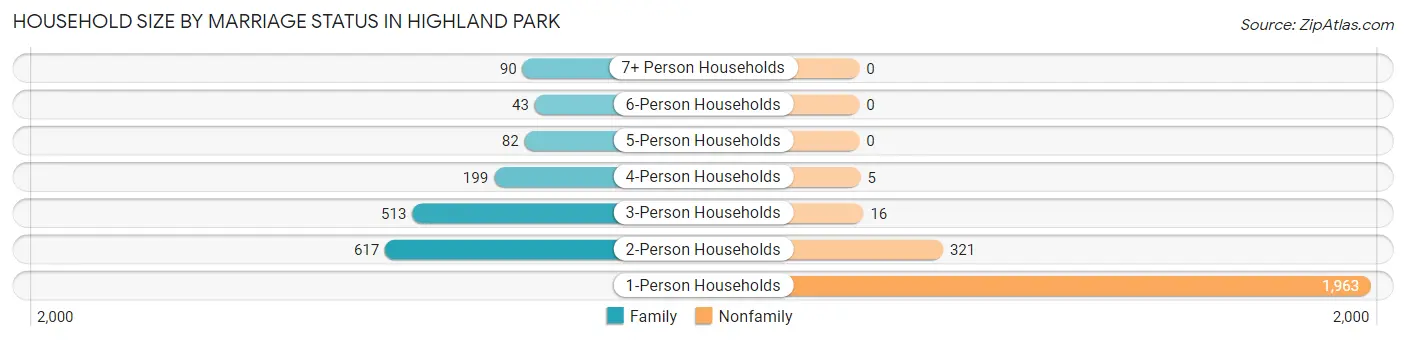
| Household Size | Family Households | Nonfamily Households |
| 1-Person Households | - | 1,963 (51.0%) |
| 2-Person Households | 617 (16.0%) | 321 (8.3%) |
| 3-Person Households | 513 (13.3%) | 16 (0.4%) |
| 4-Person Households | 199 (5.2%) | 5 (0.1%) |
| 5-Person Households | 82 (2.1%) | 0 (0.0%) |
| 6-Person Households | 43 (1.1%) | 0 (0.0%) |
| 7+ Person Households | 90 (2.3%) | 0 (0.0%) |
| Total | 1,544 (40.1%) | 2,305 (59.9%) |
Female Fertility in Highland Park
Fertility by Age in Highland Park
Average fertility rate in Highland Park is 29.0 births per 1,000 women. Women in the age bracket of 20 to 34 years have the highest fertility rate with 60.0 births per 1,000 women. Women in the age bracket of 20 to 34 years acount for 100.0% of all women with births.
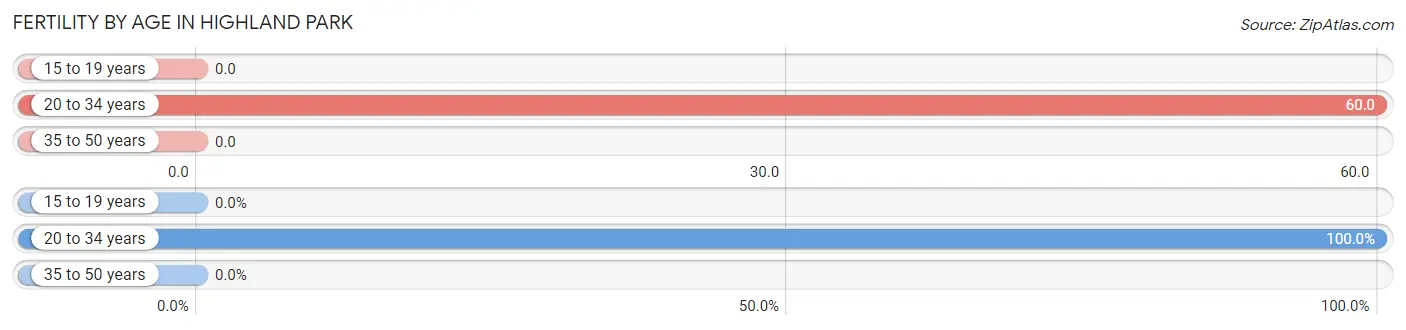
| Age Bracket | Women with Births | Births / 1,000 Women |
| 15 to 19 years | 0 (0.0%) | 0.0 |
| 20 to 34 years | 54 (100.0%) | 60.0 |
| 35 to 50 years | 0 (0.0%) | 0.0 |
| Total | 54 (100.0%) | 29.0 |
Fertility by Age by Marriage Status in Highland Park
14.8% of women with births (54) in Highland Park are married. The highest percentage of unmarried women with births falls into 20 to 34 years age bracket with 85.2% of them unmarried at the time of birth, while the lowest percentage of unmarried women with births belong to 20 to 34 years age bracket with 85.2% of them unmarried.
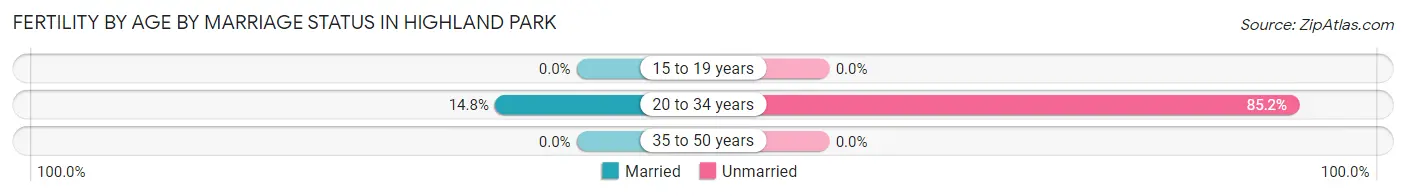
| Age Bracket | Married | Unmarried |
| 15 to 19 years | 0 (0.0%) | 0 (0.0%) |
| 20 to 34 years | 8 (14.8%) | 46 (85.2%) |
| 35 to 50 years | 0 (0.0%) | 0 (0.0%) |
| Total | 8 (14.8%) | 46 (85.2%) |
Fertility by Education in Highland Park
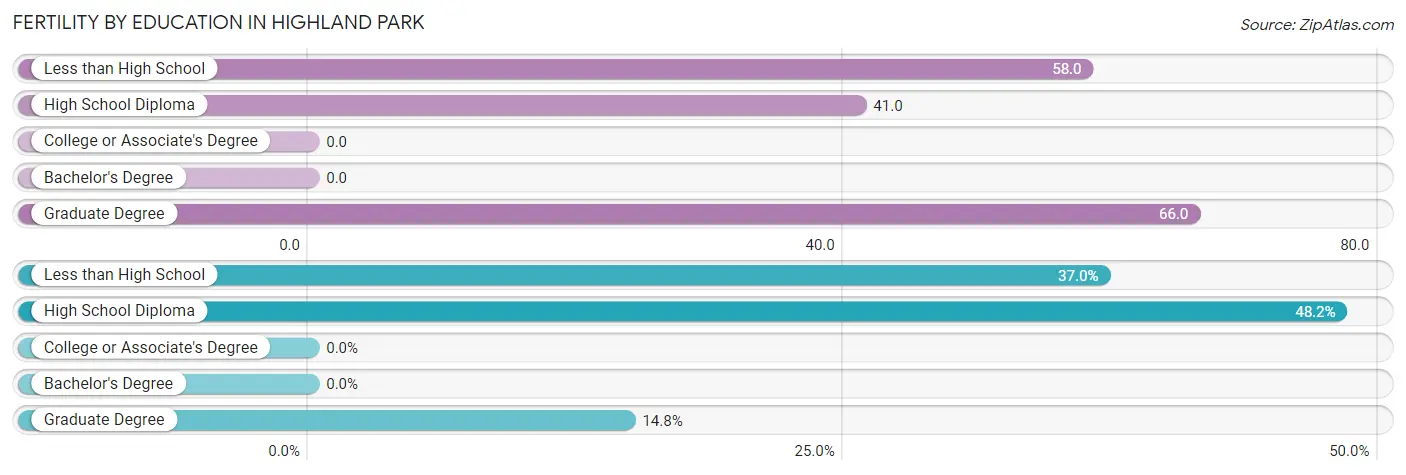
| Educational Attainment | Women with Births | Births / 1,000 Women |
| Less than High School | 20 (37.0%) | 58.0 |
| High School Diploma | 26 (48.1%) | 41.0 |
| College or Associate's Degree | 0 (0.0%) | 0.0 |
| Bachelor's Degree | 0 (0.0%) | 0.0 |
| Graduate Degree | 8 (14.8%) | 66.0 |
| Total | 54 (100.0%) | 29.0 |
Fertility by Education by Marriage Status in Highland Park
85.2% of women with births in Highland Park are unmarried. Women with the educational attainment of graduate degree are most likely to be married with 100.0% of them married at childbirth, while women with the educational attainment of less than high school are least likely to be married with 100.0% of them unmarried at childbirth.
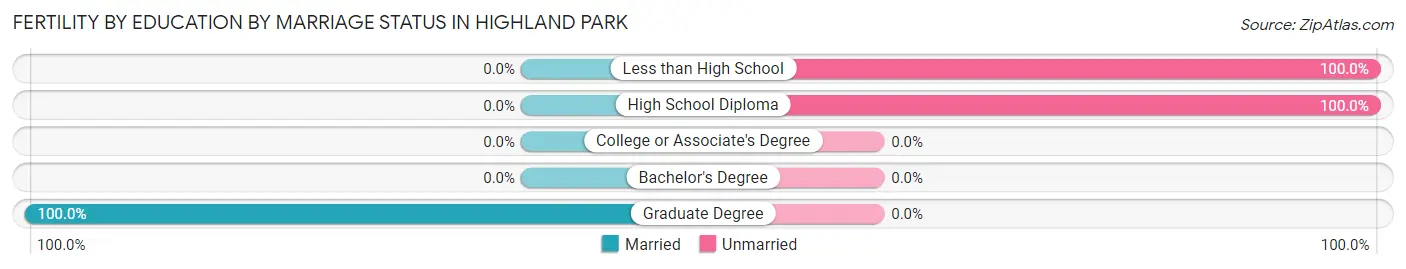
| Educational Attainment | Married | Unmarried |
| Less than High School | 0 (0.0%) | 20 (100.0%) |
| High School Diploma | 0 (0.0%) | 26 (100.0%) |
| College or Associate's Degree | 0 (0.0%) | 0 (0.0%) |
| Bachelor's Degree | 0 (0.0%) | 0 (0.0%) |
| Graduate Degree | 8 (100.0%) | 0 (0.0%) |
| Total | 8 (14.8%) | 46 (85.2%) |
Employment Characteristics in Highland Park
Employment by Class of Employer in Highland Park
Among the 2,940 employed individuals in Highland Park, private company employees (2,077 | 70.7%), not-for-profit organizations (279 | 9.5%), and local government employees (212 | 7.2%) make up the most common classes of employment.
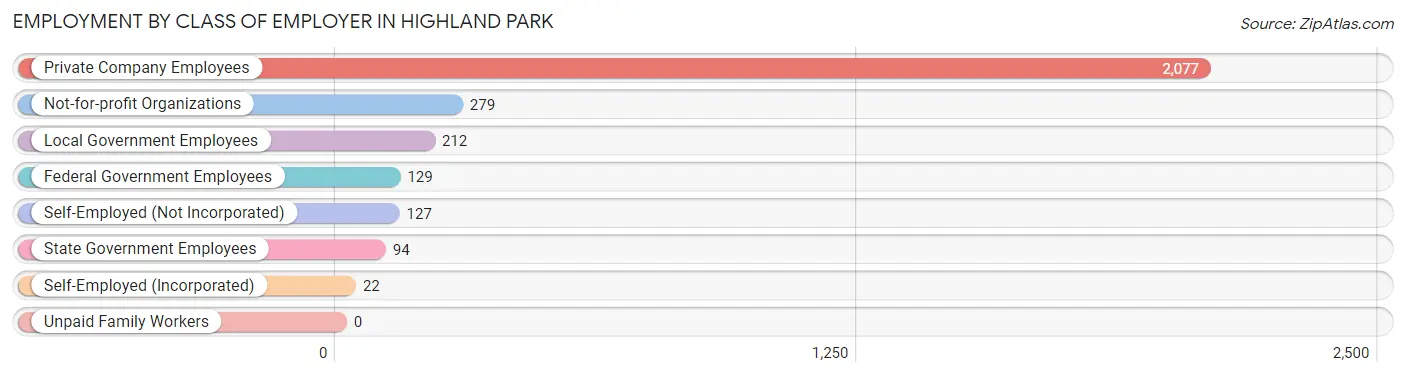
| Employer Class | # Employees | % Employees |
| Private Company Employees | 2,077 | 70.7% |
| Self-Employed (Incorporated) | 22 | 0.7% |
| Self-Employed (Not Incorporated) | 127 | 4.3% |
| Not-for-profit Organizations | 279 | 9.5% |
| Local Government Employees | 212 | 7.2% |
| State Government Employees | 94 | 3.2% |
| Federal Government Employees | 129 | 4.4% |
| Unpaid Family Workers | 0 | 0.0% |
| Total | 2,940 | 100.0% |
Employment Status by Age in Highland Park
According to the labor force statistics for Highland Park, out of the total population over 16 years of age (7,432), 49.8% or 3,701 individuals are in the labor force, with 18.2% or 674 of them unemployed. The age group with the highest labor force participation rate is 45 to 54 years, with 74.1% or 772 individuals in the labor force. Within the labor force, the 75 years and over age range has the highest percentage of unemployed individuals, with 66.7% or 22 of them being unemployed.
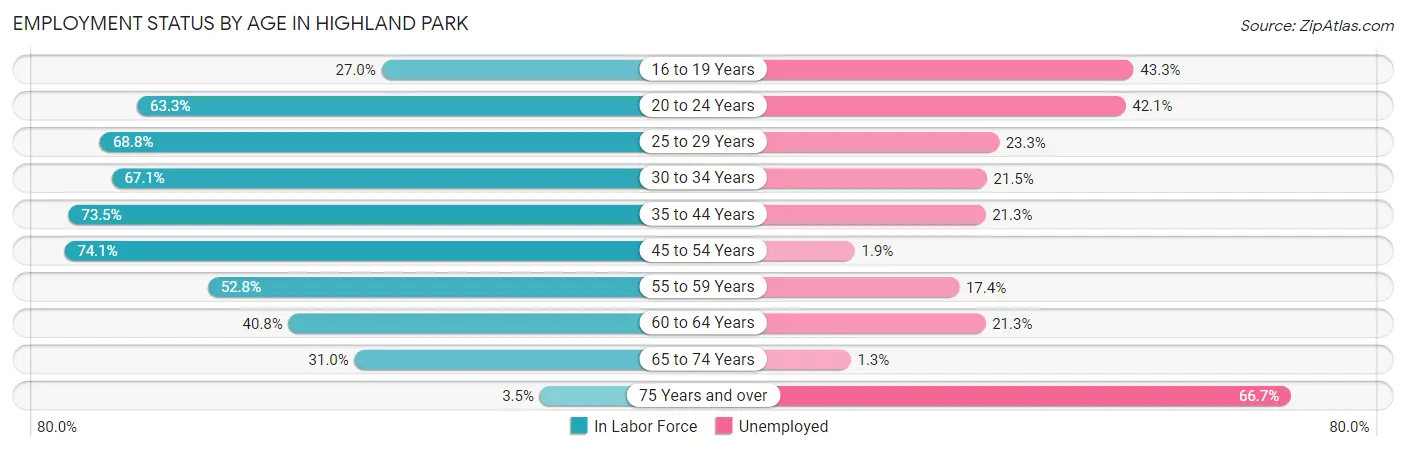
| Age Bracket | In Labor Force | Unemployed |
| 16 to 19 Years | 60 (27.0%) | 26 (43.3%) |
| 20 to 24 Years | 447 (63.3%) | 188 (42.1%) |
| 25 to 29 Years | 335 (68.8%) | 78 (23.3%) |
| 30 to 34 Years | 275 (67.1%) | 59 (21.5%) |
| 35 to 44 Years | 709 (73.5%) | 151 (21.3%) |
| 45 to 54 Years | 772 (74.1%) | 15 (1.9%) |
| 55 to 59 Years | 438 (52.8%) | 76 (17.4%) |
| 60 to 64 Years | 254 (40.8%) | 54 (21.3%) |
| 65 to 74 Years | 374 (31.0%) | 5 (1.3%) |
| 75 Years and over | 33 (3.5%) | 22 (66.7%) |
| Total | 3,701 (49.8%) | 674 (18.2%) |
Employment Status by Educational Attainment in Highland Park
According to labor force statistics for Highland Park, 63.9% of individuals (2,783) out of the total population between 25 and 64 years of age (4,355) are in the labor force, with 15.6% or 434 of them being unemployed. The group with the highest labor force participation rate are those with the educational attainment of bachelor's degree or higher, with 71.6% or 570 individuals in the labor force. Within the labor force, individuals with high school diploma education have the highest percentage of unemployment, with 27.9% or 285 of them being unemployed.
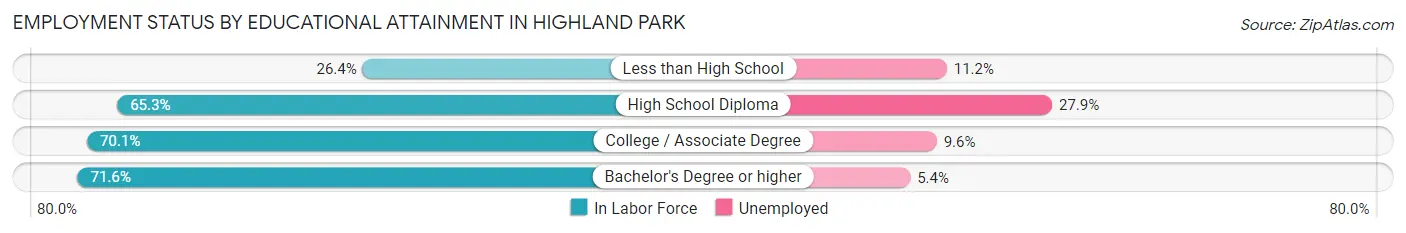
| Educational Attainment | In Labor Force | Unemployed |
| Less than High School | 125 (26.4%) | 53 (11.2%) |
| High School Diploma | 1,020 (65.3%) | 436 (27.9%) |
| College / Associate Degree | 1,068 (70.1%) | 146 (9.6%) |
| Bachelor's Degree or higher | 570 (71.6%) | 43 (5.4%) |
| Total | 2,783 (63.9%) | 679 (15.6%) |
Employment Occupations by Sex in Highland Park
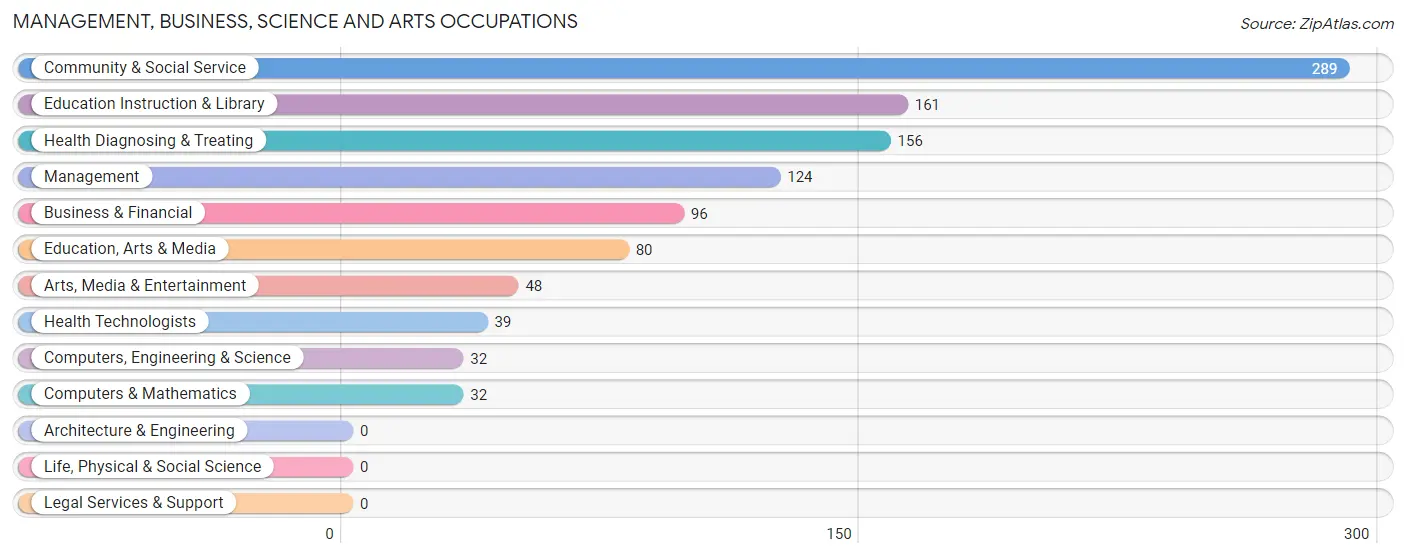
Management, Business, Science and Arts Occupations
The most common Management, Business, Science and Arts occupations in Highland Park are Community & Social Service (289 | 9.6%), Education Instruction & Library (161 | 5.3%), Health Diagnosing & Treating (156 | 5.2%), Management (124 | 4.1%), and Business & Financial (96 | 3.2%).
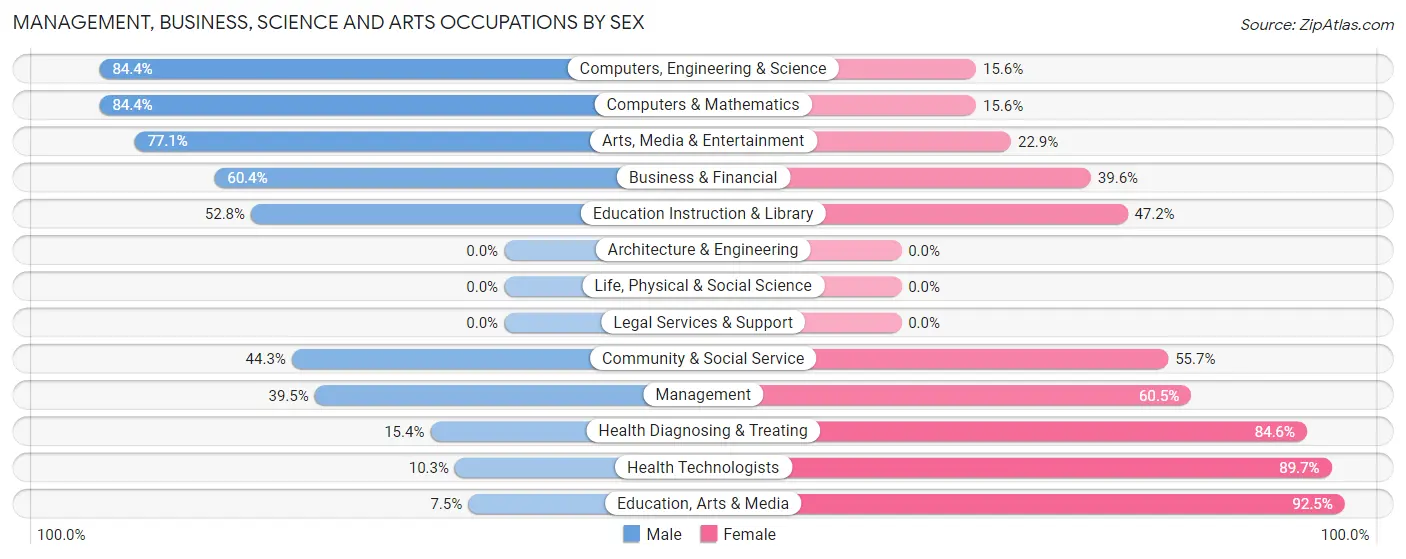
Management, Business, Science and Arts Occupations by Sex
Within the Management, Business, Science and Arts occupations in Highland Park, the most male-oriented occupations are Computers, Engineering & Science (84.4%), Computers & Mathematics (84.4%), and Arts, Media & Entertainment (77.1%), while the most female-oriented occupations are Education, Arts & Media (92.5%), Health Technologists (89.7%), and Health Diagnosing & Treating (84.6%).
| Occupation | Male | Female |
| Management | 49 (39.5%) | 75 (60.5%) |
| Business & Financial | 58 (60.4%) | 38 (39.6%) |
| Computers, Engineering & Science | 27 (84.4%) | 5 (15.6%) |
| Computers & Mathematics | 27 (84.4%) | 5 (15.6%) |
| Architecture & Engineering | 0 (0.0%) | 0 (0.0%) |
| Life, Physical & Social Science | 0 (0.0%) | 0 (0.0%) |
| Community & Social Service | 128 (44.3%) | 161 (55.7%) |
| Education, Arts & Media | 6 (7.5%) | 74 (92.5%) |
| Legal Services & Support | 0 (0.0%) | 0 (0.0%) |
| Education Instruction & Library | 85 (52.8%) | 76 (47.2%) |
| Arts, Media & Entertainment | 37 (77.1%) | 11 (22.9%) |
| Health Diagnosing & Treating | 24 (15.4%) | 132 (84.6%) |
| Health Technologists | 4 (10.3%) | 35 (89.7%) |
| Total (Category) | 286 (41.0%) | 411 (59.0%) |
| Total (Overall) | 1,266 (41.9%) | 1,758 (58.1%) |
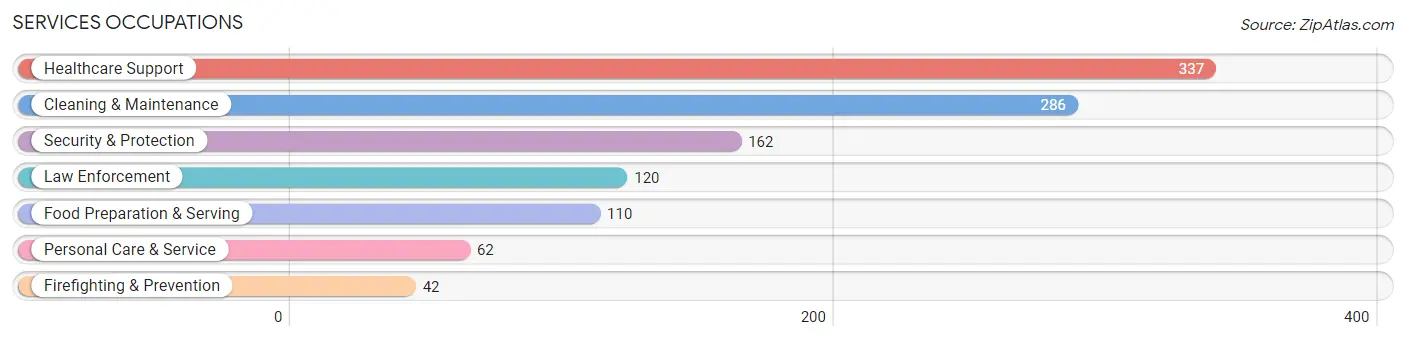
Services Occupations
The most common Services occupations in Highland Park are Healthcare Support (337 | 11.1%), Cleaning & Maintenance (286 | 9.5%), Security & Protection (162 | 5.4%), Law Enforcement (120 | 4.0%), and Food Preparation & Serving (110 | 3.6%).
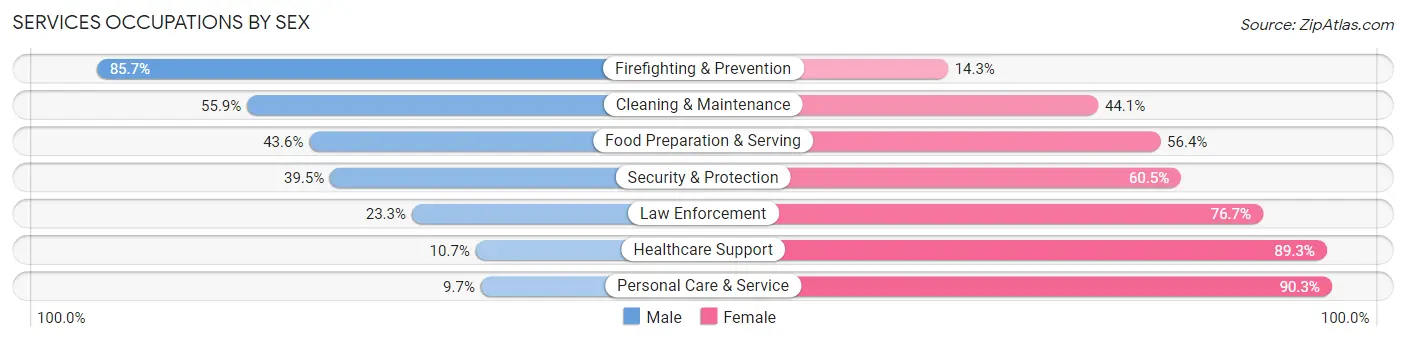
Services Occupations by Sex
Within the Services occupations in Highland Park, the most male-oriented occupations are Firefighting & Prevention (85.7%), Cleaning & Maintenance (55.9%), and Food Preparation & Serving (43.6%), while the most female-oriented occupations are Personal Care & Service (90.3%), Healthcare Support (89.3%), and Law Enforcement (76.7%).
| Occupation | Male | Female |
| Healthcare Support | 36 (10.7%) | 301 (89.3%) |
| Security & Protection | 64 (39.5%) | 98 (60.5%) |
| Firefighting & Prevention | 36 (85.7%) | 6 (14.3%) |
| Law Enforcement | 28 (23.3%) | 92 (76.7%) |
| Food Preparation & Serving | 48 (43.6%) | 62 (56.4%) |
| Cleaning & Maintenance | 160 (55.9%) | 126 (44.1%) |
| Personal Care & Service | 6 (9.7%) | 56 (90.3%) |
| Total (Category) | 314 (32.8%) | 643 (67.2%) |
| Total (Overall) | 1,266 (41.9%) | 1,758 (58.1%) |
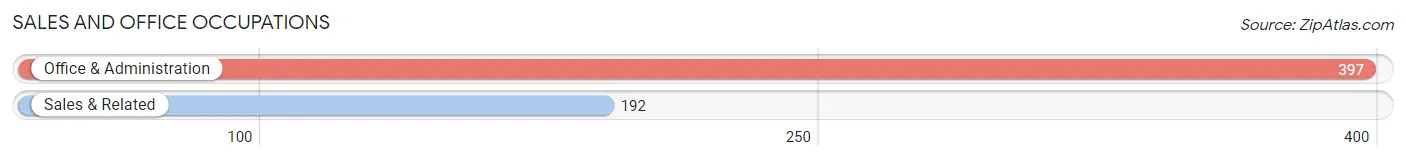
Sales and Office Occupations
The most common Sales and Office occupations in Highland Park are Office & Administration (397 | 13.1%), and Sales & Related (192 | 6.4%).
Sales and Office Occupations by Sex
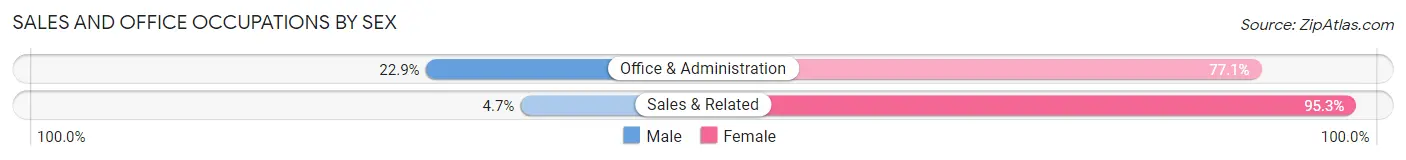
| Occupation | Male | Female |
| Sales & Related | 9 (4.7%) | 183 (95.3%) |
| Office & Administration | 91 (22.9%) | 306 (77.1%) |
| Total (Category) | 100 (17.0%) | 489 (83.0%) |
| Total (Overall) | 1,266 (41.9%) | 1,758 (58.1%) |
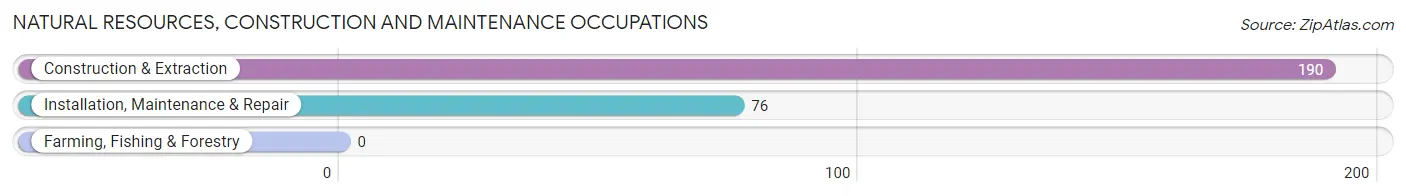
Natural Resources, Construction and Maintenance Occupations
The most common Natural Resources, Construction and Maintenance occupations in Highland Park are Construction & Extraction (190 | 6.3%), and Installation, Maintenance & Repair (76 | 2.5%).
Natural Resources, Construction and Maintenance Occupations by Sex
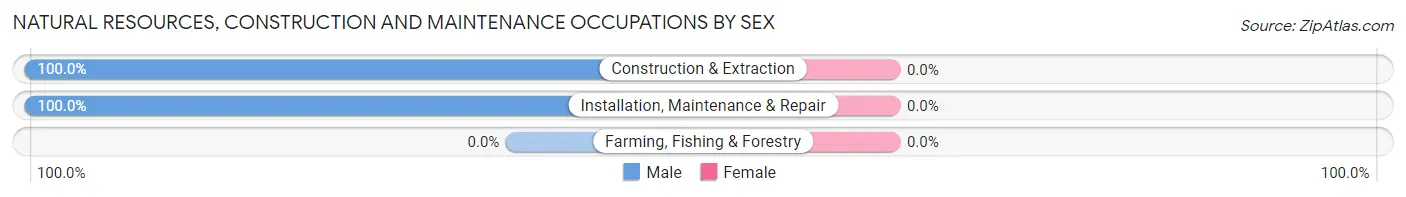
| Occupation | Male | Female |
| Farming, Fishing & Forestry | 0 (0.0%) | 0 (0.0%) |
| Construction & Extraction | 190 (100.0%) | 0 (0.0%) |
| Installation, Maintenance & Repair | 76 (100.0%) | 0 (0.0%) |
| Total (Category) | 266 (100.0%) | 0 (0.0%) |
| Total (Overall) | 1,266 (41.9%) | 1,758 (58.1%) |
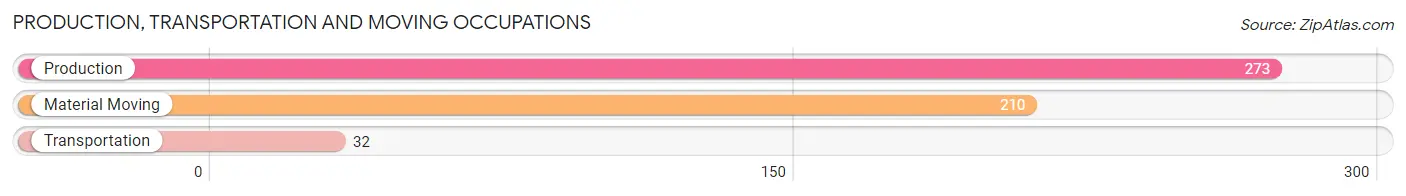
Production, Transportation and Moving Occupations
The most common Production, Transportation and Moving occupations in Highland Park are Production (273 | 9.0%), Material Moving (210 | 6.9%), and Transportation (32 | 1.1%).
Production, Transportation and Moving Occupations by Sex
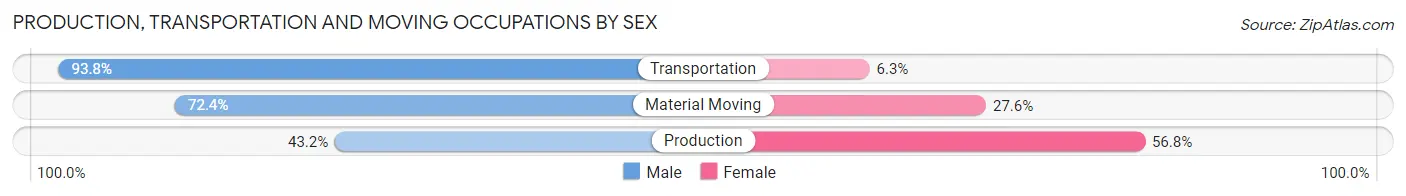
| Occupation | Male | Female |
| Production | 118 (43.2%) | 155 (56.8%) |
| Transportation | 30 (93.8%) | 2 (6.2%) |
| Material Moving | 152 (72.4%) | 58 (27.6%) |
| Total (Category) | 300 (58.3%) | 215 (41.7%) |
| Total (Overall) | 1,266 (41.9%) | 1,758 (58.1%) |
Employment Industries by Sex in Highland Park
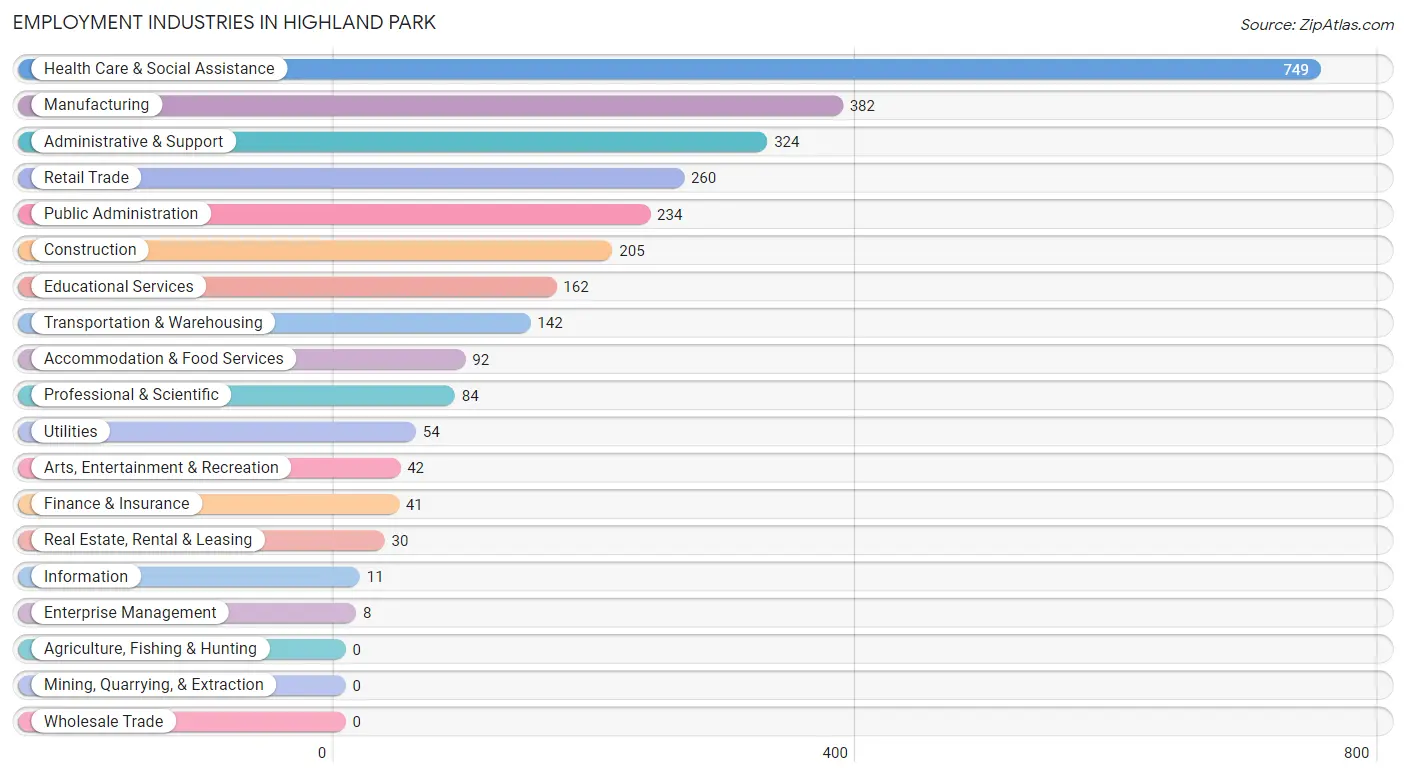
Employment Industries in Highland Park
The major employment industries in Highland Park include Health Care & Social Assistance (749 | 24.8%), Manufacturing (382 | 12.6%), Administrative & Support (324 | 10.7%), Retail Trade (260 | 8.6%), and Public Administration (234 | 7.7%).
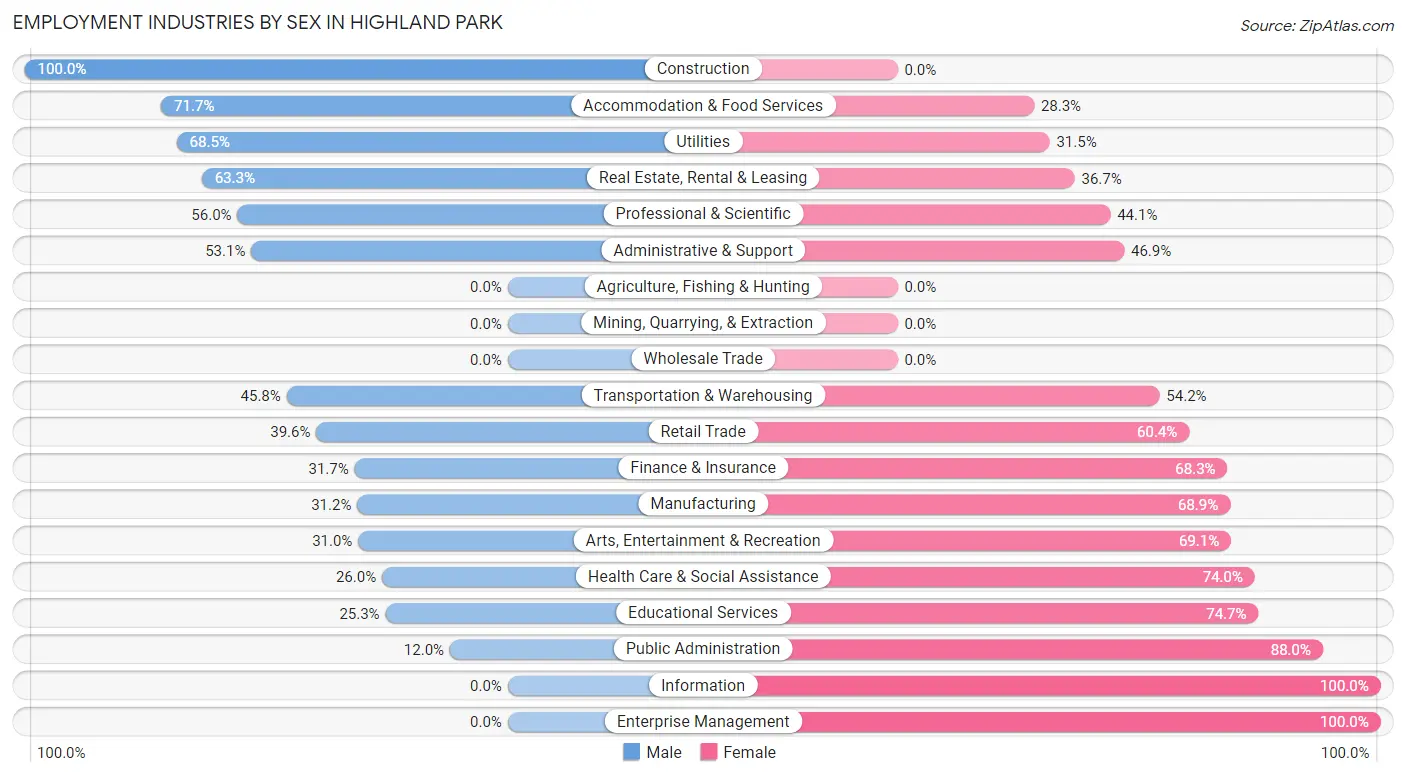
Employment Industries by Sex in Highland Park
The Highland Park industries that see more men than women are Construction (100.0%), Accommodation & Food Services (71.7%), and Utilities (68.5%), whereas the industries that tend to have a higher number of women are Information (100.0%), Enterprise Management (100.0%), and Public Administration (88.0%).
| Industry | Male | Female |
| Agriculture, Fishing & Hunting | 0 (0.0%) | 0 (0.0%) |
| Mining, Quarrying, & Extraction | 0 (0.0%) | 0 (0.0%) |
| Construction | 205 (100.0%) | 0 (0.0%) |
| Manufacturing | 119 (31.1%) | 263 (68.9%) |
| Wholesale Trade | 0 (0.0%) | 0 (0.0%) |
| Retail Trade | 103 (39.6%) | 157 (60.4%) |
| Transportation & Warehousing | 65 (45.8%) | 77 (54.2%) |
| Utilities | 37 (68.5%) | 17 (31.5%) |
| Information | 0 (0.0%) | 11 (100.0%) |
| Finance & Insurance | 13 (31.7%) | 28 (68.3%) |
| Real Estate, Rental & Leasing | 19 (63.3%) | 11 (36.7%) |
| Professional & Scientific | 47 (55.9%) | 37 (44.1%) |
| Enterprise Management | 0 (0.0%) | 8 (100.0%) |
| Administrative & Support | 172 (53.1%) | 152 (46.9%) |
| Educational Services | 41 (25.3%) | 121 (74.7%) |
| Health Care & Social Assistance | 195 (26.0%) | 554 (74.0%) |
| Arts, Entertainment & Recreation | 13 (30.9%) | 29 (69.1%) |
| Accommodation & Food Services | 66 (71.7%) | 26 (28.3%) |
| Public Administration | 28 (12.0%) | 206 (88.0%) |
| Total | 1,266 (41.9%) | 1,758 (58.1%) |
Education in Highland Park
School Enrollment in Highland Park
The most common levels of schooling among the 1,739 students in Highland Park are elementary school (496 | 28.5%), high school (448 | 25.8%), and middle school (386 | 22.2%).
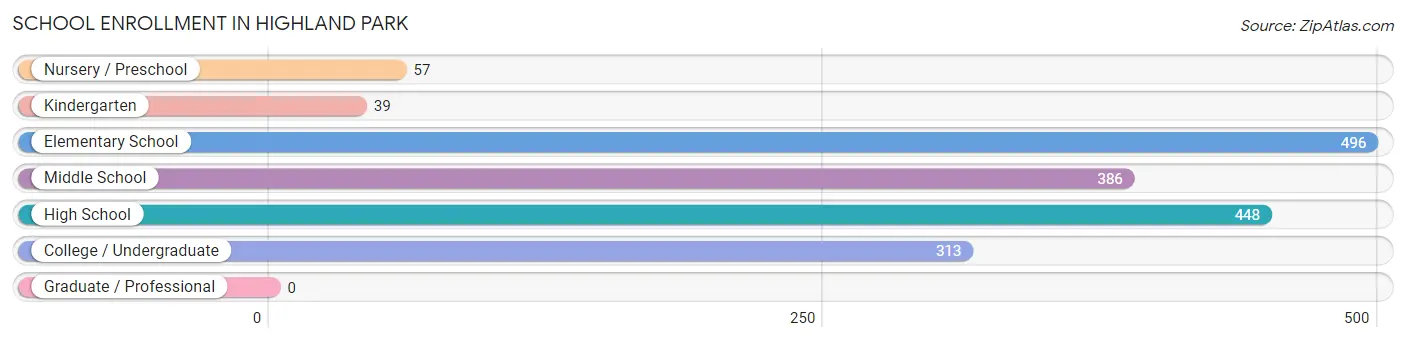
| School Level | # Students | % Students |
| Nursery / Preschool | 57 | 3.3% |
| Kindergarten | 39 | 2.2% |
| Elementary School | 496 | 28.5% |
| Middle School | 386 | 22.2% |
| High School | 448 | 25.8% |
| College / Undergraduate | 313 | 18.0% |
| Graduate / Professional | 0 | 0.0% |
| Total | 1,739 | 100.0% |
School Enrollment by Age by Funding Source in Highland Park
Out of a total of 1,739 students who are enrolled in schools in Highland Park, 217 (12.5%) attend a private institution, while the remaining 1,522 (87.5%) are enrolled in public schools. The age group of 35 years and over has the highest likelihood of being enrolled in private schools, with 45 (25.9% in the age bracket) enrolled. Conversely, the age group of 3 to 4 year olds has the lowest likelihood of being enrolled in a private school, with 57 (100.0% in the age bracket) attending a public institution.
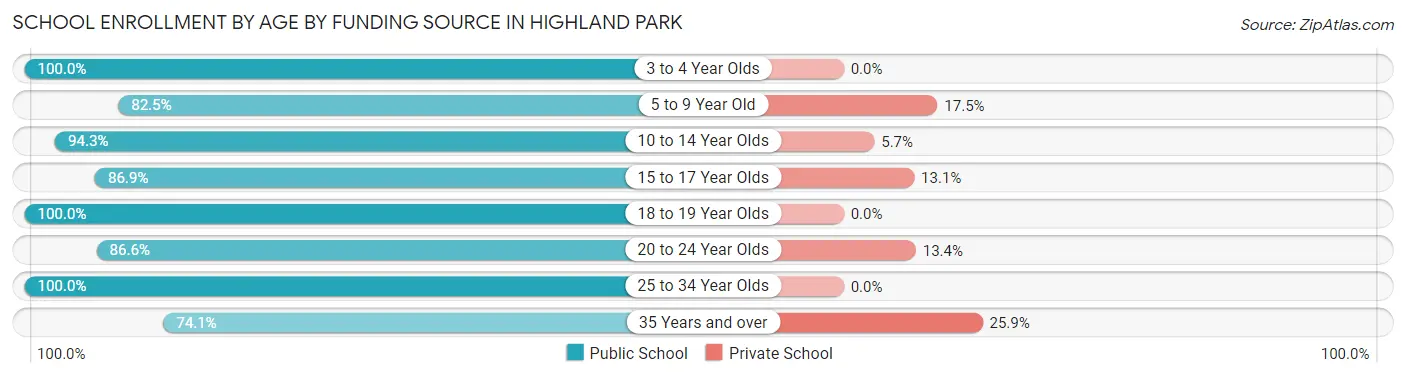
| Age Bracket | Public School | Private School |
| 3 to 4 Year Olds | 57 (100.0%) | 0 (0.0%) |
| 5 to 9 Year Old | 416 (82.5%) | 88 (17.5%) |
| 10 to 14 Year Olds | 463 (94.3%) | 28 (5.7%) |
| 15 to 17 Year Olds | 258 (86.9%) | 39 (13.1%) |
| 18 to 19 Year Olds | 58 (100.0%) | 0 (0.0%) |
| 20 to 24 Year Olds | 116 (86.6%) | 18 (13.4%) |
| 25 to 34 Year Olds | 24 (100.0%) | 0 (0.0%) |
| 35 Years and over | 129 (74.1%) | 45 (25.9%) |
| Total | 1,522 (87.5%) | 217 (12.5%) |
Educational Attainment by Field of Study in Highland Park
Business (208 | 19.1%), psychology (178 | 16.3%), liberal arts & history (157 | 14.4%), visual & performing arts (131 | 12.0%), and arts & humanities (104 | 9.5%) are the most common fields of study among 1,091 individuals in Highland Park who have obtained a bachelor's degree or higher.
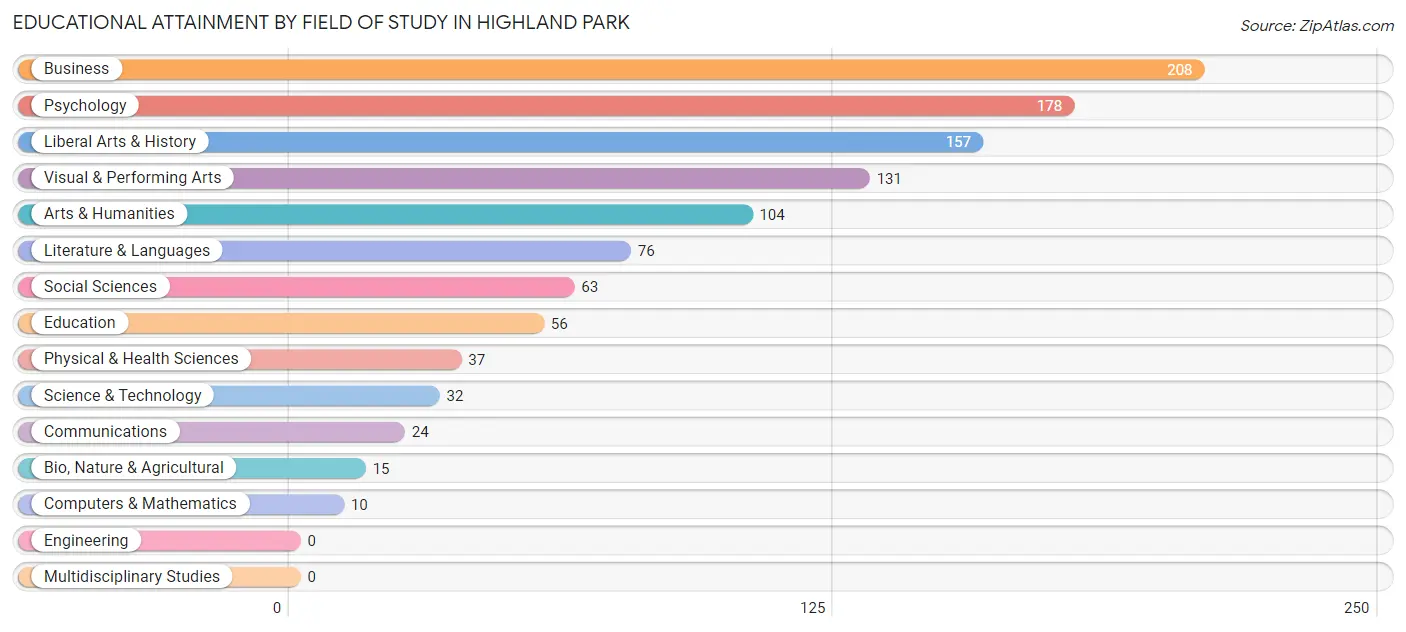
| Field of Study | # Graduates | % Graduates |
| Computers & Mathematics | 10 | 0.9% |
| Bio, Nature & Agricultural | 15 | 1.4% |
| Physical & Health Sciences | 37 | 3.4% |
| Psychology | 178 | 16.3% |
| Social Sciences | 63 | 5.8% |
| Engineering | 0 | 0.0% |
| Multidisciplinary Studies | 0 | 0.0% |
| Science & Technology | 32 | 2.9% |
| Business | 208 | 19.1% |
| Education | 56 | 5.1% |
| Literature & Languages | 76 | 7.0% |
| Liberal Arts & History | 157 | 14.4% |
| Visual & Performing Arts | 131 | 12.0% |
| Communications | 24 | 2.2% |
| Arts & Humanities | 104 | 9.5% |
| Total | 1,091 | 100.0% |
Transportation & Commute in Highland Park
Vehicle Availability by Sex in Highland Park
The most prevalent vehicle ownership categories in Highland Park are males with 2 vehicles (412, accounting for 34.1%) and females with 2 vehicles (459, making up 25.1%).
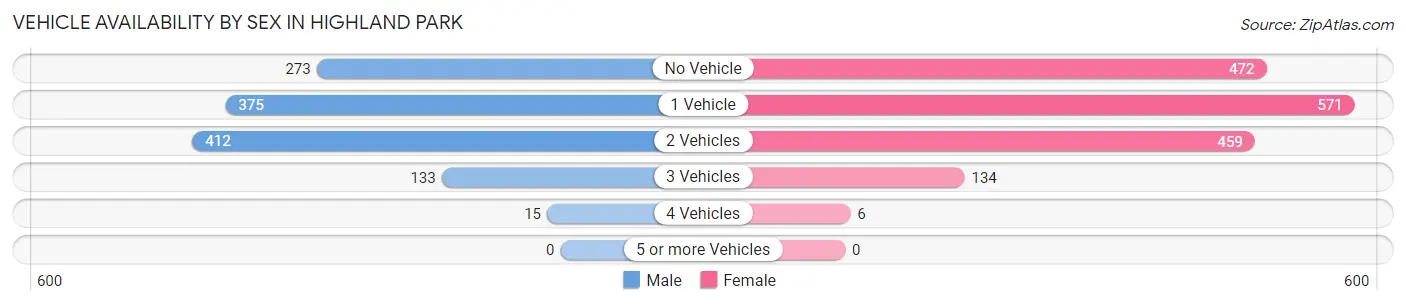
| Vehicles Available | Male | Female |
| No Vehicle | 273 (22.6%) | 472 (28.7%) |
| 1 Vehicle | 375 (31.0%) | 571 (34.8%) |
| 2 Vehicles | 412 (34.1%) | 459 (28.0%) |
| 3 Vehicles | 133 (11.0%) | 134 (8.2%) |
| 4 Vehicles | 15 (1.2%) | 6 (0.4%) |
| 5 or more Vehicles | 0 (0.0%) | 0 (0.0%) |
| Total | 1,208 (100.0%) | 1,642 (100.0%) |
Commute Time in Highland Park
The most frequently occuring commute durations in Highland Park are 20 to 24 minutes (619 commuters, 22.5%), 10 to 14 minutes (586 commuters, 21.2%), and 15 to 19 minutes (503 commuters, 18.2%).
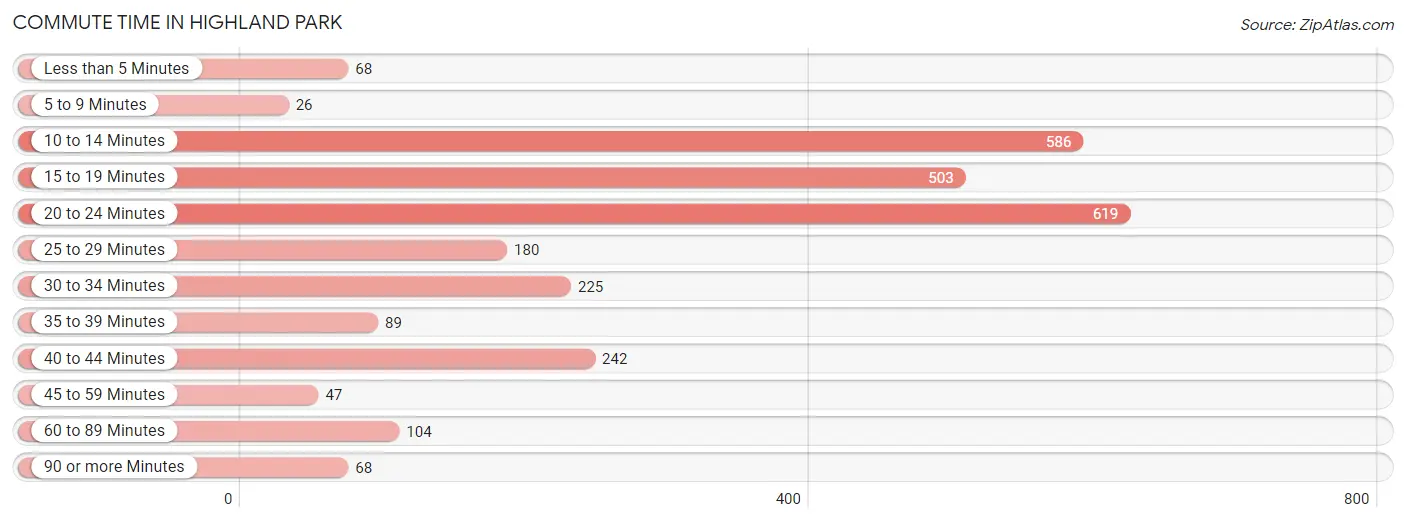
| Commute Time | # Commuters | % Commuters |
| Less than 5 Minutes | 68 | 2.5% |
| 5 to 9 Minutes | 26 | 0.9% |
| 10 to 14 Minutes | 586 | 21.2% |
| 15 to 19 Minutes | 503 | 18.2% |
| 20 to 24 Minutes | 619 | 22.5% |
| 25 to 29 Minutes | 180 | 6.5% |
| 30 to 34 Minutes | 225 | 8.2% |
| 35 to 39 Minutes | 89 | 3.2% |
| 40 to 44 Minutes | 242 | 8.8% |
| 45 to 59 Minutes | 47 | 1.7% |
| 60 to 89 Minutes | 104 | 3.8% |
| 90 or more Minutes | 68 | 2.5% |
Commute Time by Sex in Highland Park
The most common commute times in Highland Park are 15 to 19 minutes (313 commuters, 26.4%) for males and 10 to 14 minutes (447 commuters, 28.5%) for females.
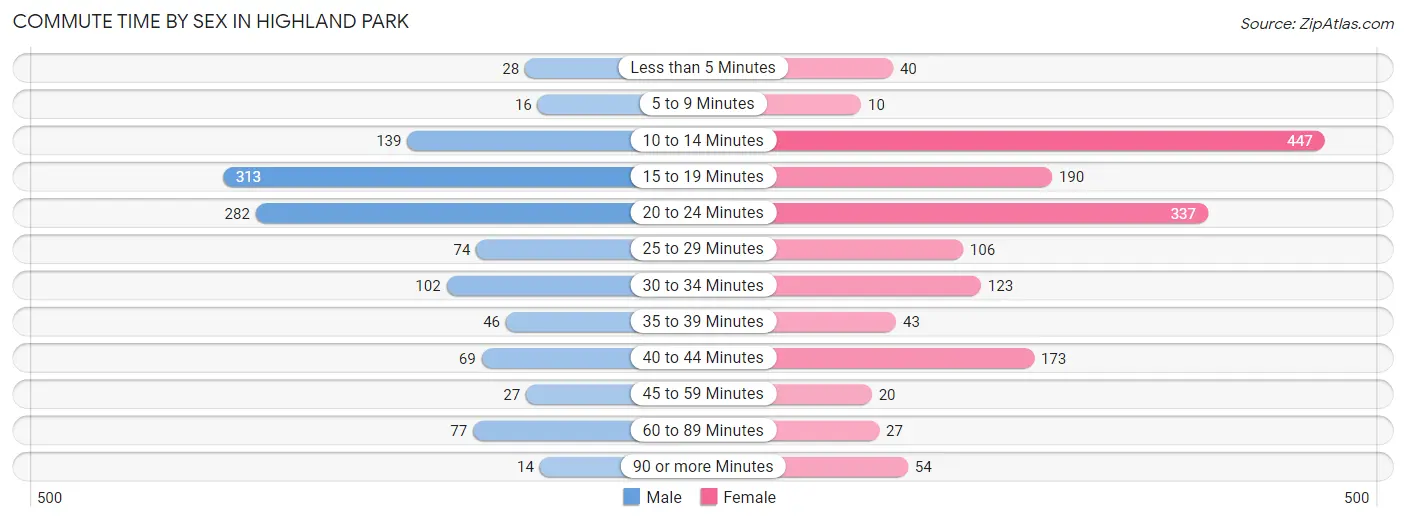
| Commute Time | Male | Female |
| Less than 5 Minutes | 28 (2.4%) | 40 (2.5%) |
| 5 to 9 Minutes | 16 (1.3%) | 10 (0.6%) |
| 10 to 14 Minutes | 139 (11.7%) | 447 (28.5%) |
| 15 to 19 Minutes | 313 (26.4%) | 190 (12.1%) |
| 20 to 24 Minutes | 282 (23.8%) | 337 (21.5%) |
| 25 to 29 Minutes | 74 (6.2%) | 106 (6.8%) |
| 30 to 34 Minutes | 102 (8.6%) | 123 (7.8%) |
| 35 to 39 Minutes | 46 (3.9%) | 43 (2.7%) |
| 40 to 44 Minutes | 69 (5.8%) | 173 (11.0%) |
| 45 to 59 Minutes | 27 (2.3%) | 20 (1.3%) |
| 60 to 89 Minutes | 77 (6.5%) | 27 (1.7%) |
| 90 or more Minutes | 14 (1.2%) | 54 (3.4%) |
Time of Departure to Work by Sex in Highland Park
The most frequent times of departure to work in Highland Park are 12:00 PM to 3:59 PM (226, 19.0%) for males and 11:00 AM to 11:59 AM (241, 15.3%) for females.
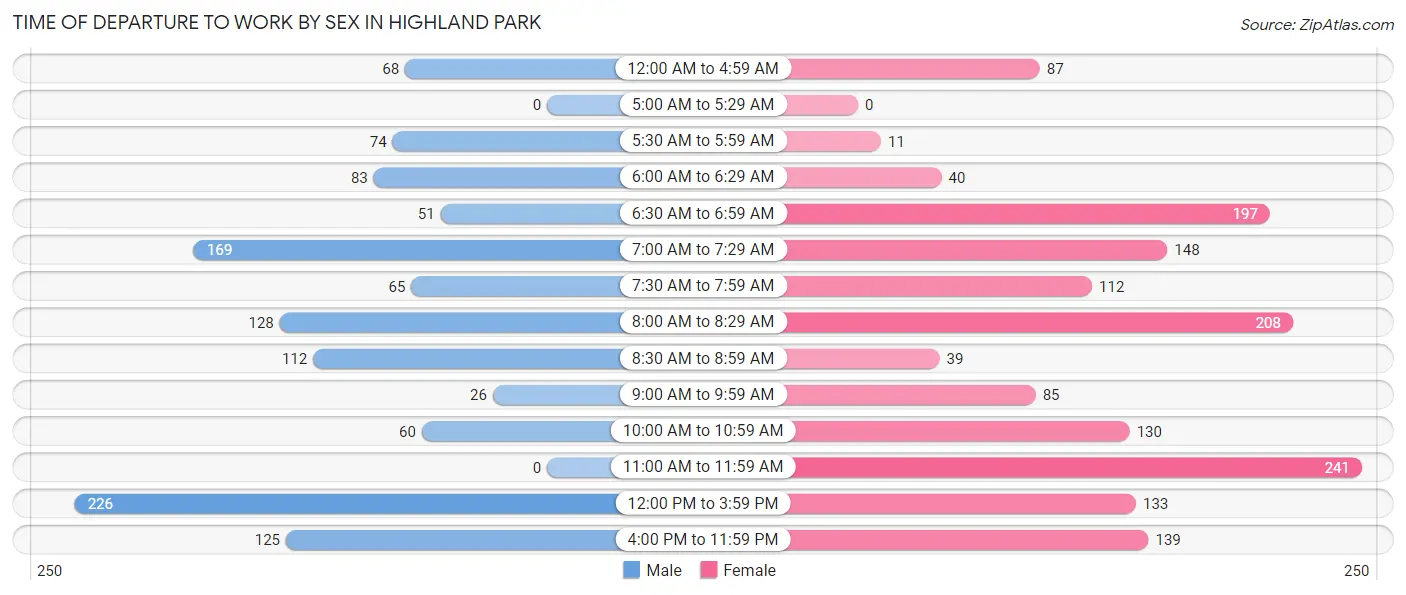
| Time of Departure | Male | Female |
| 12:00 AM to 4:59 AM | 68 (5.7%) | 87 (5.5%) |
| 5:00 AM to 5:29 AM | 0 (0.0%) | 0 (0.0%) |
| 5:30 AM to 5:59 AM | 74 (6.2%) | 11 (0.7%) |
| 6:00 AM to 6:29 AM | 83 (7.0%) | 40 (2.5%) |
| 6:30 AM to 6:59 AM | 51 (4.3%) | 197 (12.6%) |
| 7:00 AM to 7:29 AM | 169 (14.2%) | 148 (9.4%) |
| 7:30 AM to 7:59 AM | 65 (5.5%) | 112 (7.1%) |
| 8:00 AM to 8:29 AM | 128 (10.8%) | 208 (13.3%) |
| 8:30 AM to 8:59 AM | 112 (9.4%) | 39 (2.5%) |
| 9:00 AM to 9:59 AM | 26 (2.2%) | 85 (5.4%) |
| 10:00 AM to 10:59 AM | 60 (5.1%) | 130 (8.3%) |
| 11:00 AM to 11:59 AM | 0 (0.0%) | 241 (15.3%) |
| 12:00 PM to 3:59 PM | 226 (19.0%) | 133 (8.5%) |
| 4:00 PM to 11:59 PM | 125 (10.5%) | 139 (8.8%) |
| Total | 1,187 (100.0%) | 1,570 (100.0%) |
Housing Occupancy in Highland Park
Occupancy by Ownership in Highland Park
Of the total 3,849 dwellings in Highland Park, owner-occupied units account for 1,738 (45.2%), while renter-occupied units make up 2,111 (54.8%).

| Occupancy | # Housing Units | % Housing Units |
| Owner Occupied Housing Units | 1,738 | 45.2% |
| Renter-Occupied Housing Units | 2,111 | 54.8% |
| Total Occupied Housing Units | 3,849 | 100.0% |
Occupancy by Household Size in Highland Park
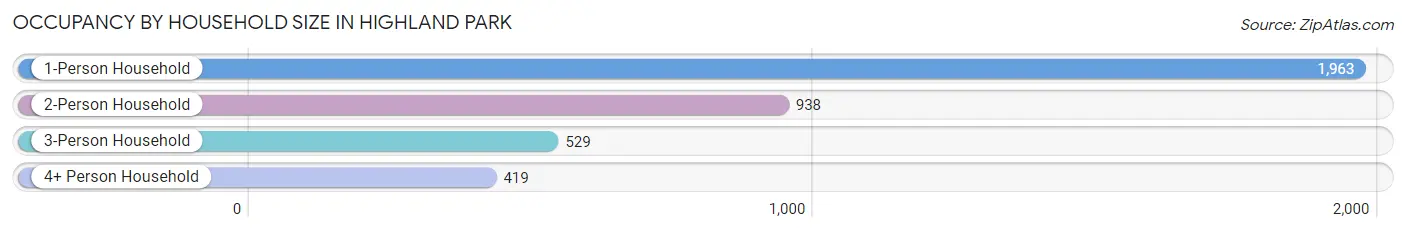
| Household Size | # Housing Units | % Housing Units |
| 1-Person Household | 1,963 | 51.0% |
| 2-Person Household | 938 | 24.4% |
| 3-Person Household | 529 | 13.7% |
| 4+ Person Household | 419 | 10.9% |
| Total Housing Units | 3,849 | 100.0% |
Occupancy by Ownership by Household Size in Highland Park
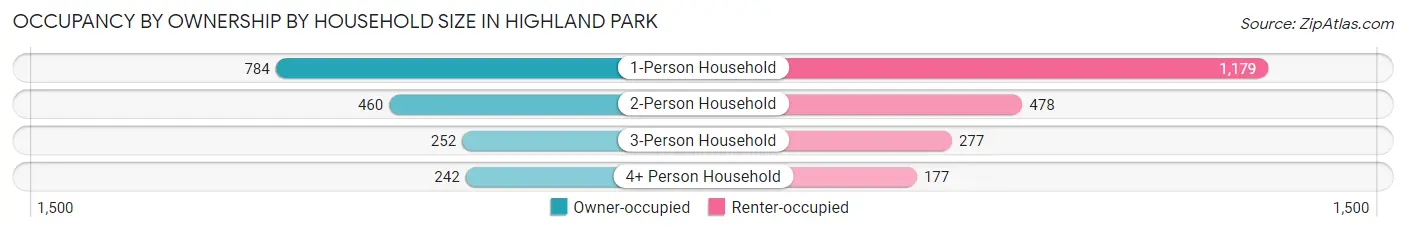
| Household Size | Owner-occupied | Renter-occupied |
| 1-Person Household | 784 (39.9%) | 1,179 (60.1%) |
| 2-Person Household | 460 (49.0%) | 478 (51.0%) |
| 3-Person Household | 252 (47.6%) | 277 (52.4%) |
| 4+ Person Household | 242 (57.8%) | 177 (42.2%) |
| Total Housing Units | 1,738 (45.2%) | 2,111 (54.8%) |
Occupancy by Educational Attainment in Highland Park
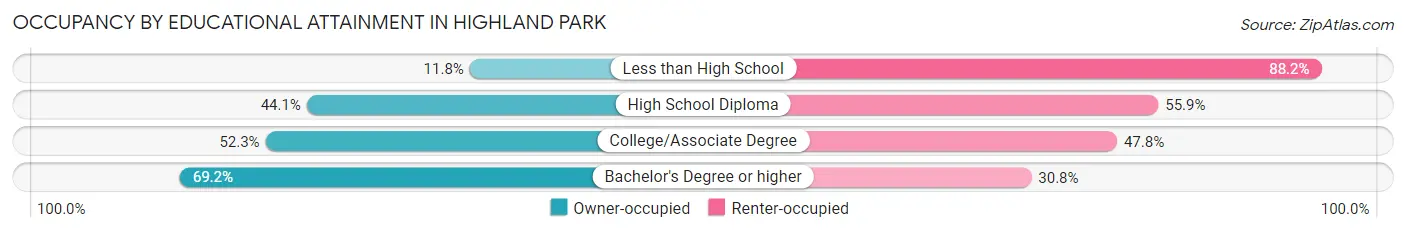
| Household Size | Owner-occupied | Renter-occupied |
| Less than High School | 86 (11.8%) | 645 (88.2%) |
| High School Diploma | 531 (44.1%) | 674 (55.9%) |
| College/Associate Degree | 626 (52.2%) | 572 (47.7%) |
| Bachelor's Degree or higher | 495 (69.2%) | 220 (30.8%) |
Occupancy by Age of Householder in Highland Park
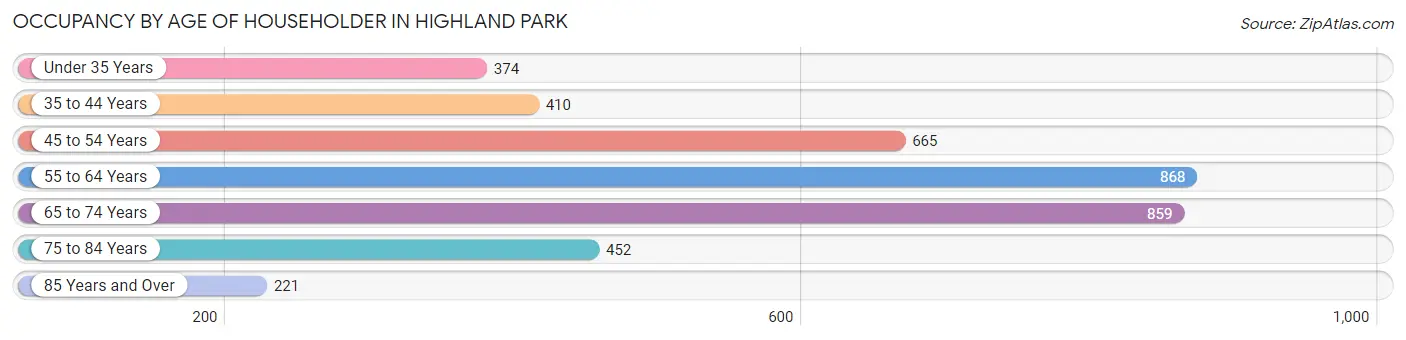
| Age Bracket | # Households | % Households |
| Under 35 Years | 374 | 9.7% |
| 35 to 44 Years | 410 | 10.6% |
| 45 to 54 Years | 665 | 17.3% |
| 55 to 64 Years | 868 | 22.6% |
| 65 to 74 Years | 859 | 22.3% |
| 75 to 84 Years | 452 | 11.7% |
| 85 Years and Over | 221 | 5.7% |
| Total | 3,849 | 100.0% |
Housing Finances in Highland Park
Median Income by Occupancy in Highland Park
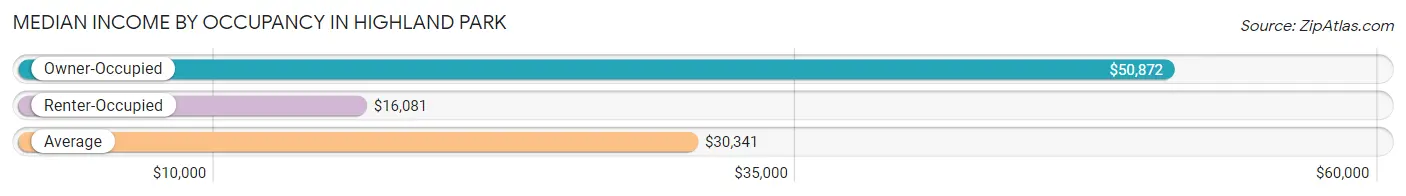
| Occupancy Type | # Households | Median Income |
| Owner-Occupied | 1,738 (45.2%) | $50,872 |
| Renter-Occupied | 2,111 (54.8%) | $16,081 |
| Average | 3,849 (100.0%) | $30,341 |
Occupancy by Householder Income Bracket in Highland Park
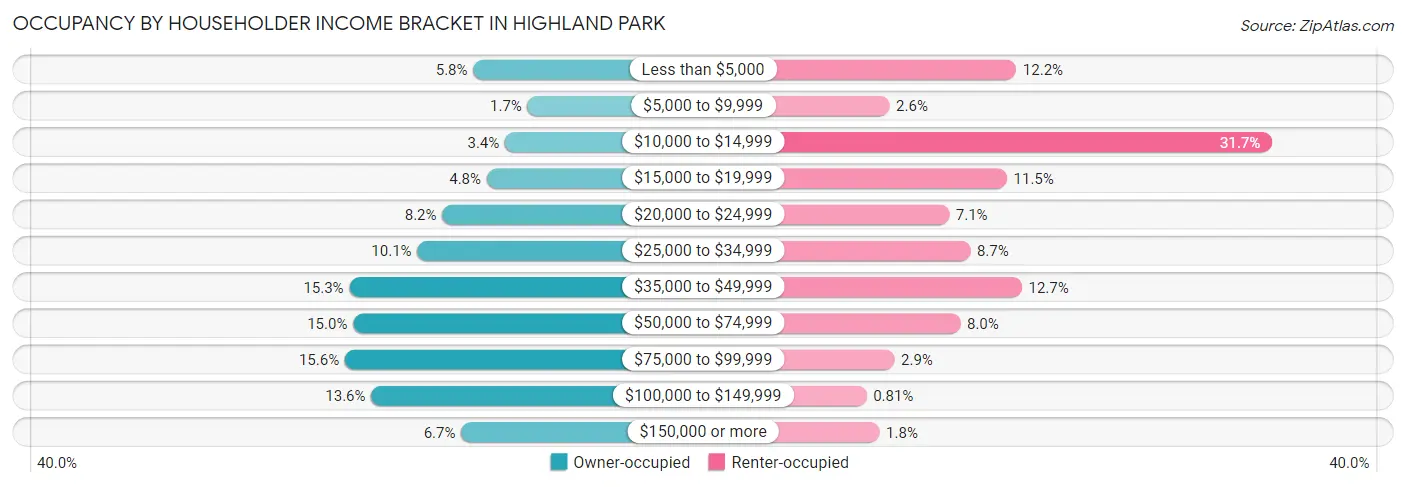
| Income Bracket | Owner-occupied | Renter-occupied |
| Less than $5,000 | 101 (5.8%) | 258 (12.2%) |
| $5,000 to $9,999 | 29 (1.7%) | 54 (2.6%) |
| $10,000 to $14,999 | 59 (3.4%) | 670 (31.7%) |
| $15,000 to $19,999 | 83 (4.8%) | 243 (11.5%) |
| $20,000 to $24,999 | 142 (8.2%) | 150 (7.1%) |
| $25,000 to $34,999 | 175 (10.1%) | 184 (8.7%) |
| $35,000 to $49,999 | 265 (15.2%) | 267 (12.7%) |
| $50,000 to $74,999 | 260 (15.0%) | 168 (8.0%) |
| $75,000 to $99,999 | 271 (15.6%) | 62 (2.9%) |
| $100,000 to $149,999 | 236 (13.6%) | 17 (0.8%) |
| $150,000 or more | 117 (6.7%) | 38 (1.8%) |
| Total | 1,738 (100.0%) | 2,111 (100.0%) |
Monthly Housing Cost Tiers in Highland Park
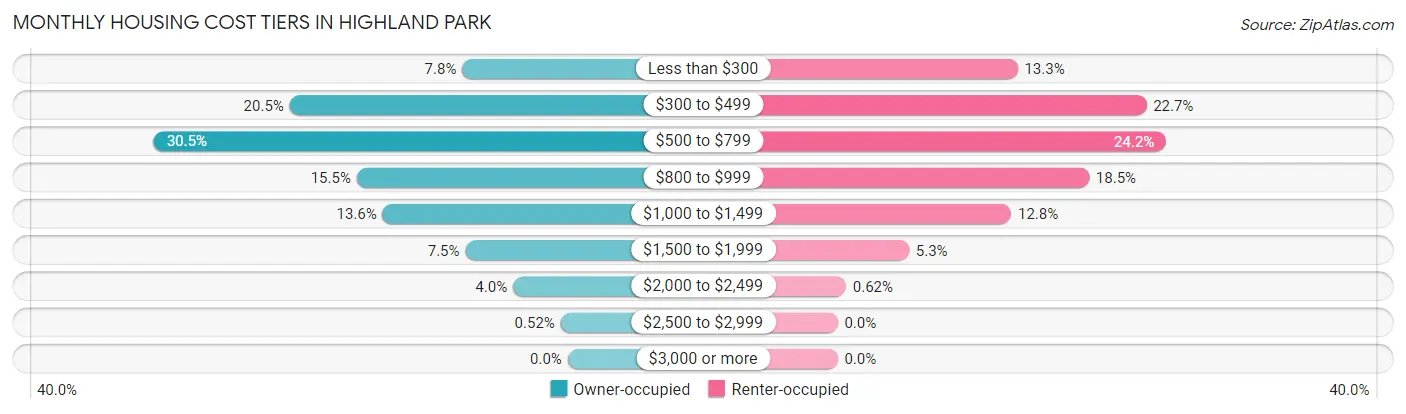
| Monthly Cost | Owner-occupied | Renter-occupied |
| Less than $300 | 135 (7.8%) | 280 (13.3%) |
| $300 to $499 | 356 (20.5%) | 480 (22.7%) |
| $500 to $799 | 530 (30.5%) | 511 (24.2%) |
| $800 to $999 | 270 (15.5%) | 391 (18.5%) |
| $1,000 to $1,499 | 237 (13.6%) | 270 (12.8%) |
| $1,500 to $1,999 | 131 (7.5%) | 111 (5.3%) |
| $2,000 to $2,499 | 70 (4.0%) | 13 (0.6%) |
| $2,500 to $2,999 | 9 (0.5%) | 0 (0.0%) |
| $3,000 or more | 0 (0.0%) | 0 (0.0%) |
| Total | 1,738 (100.0%) | 2,111 (100.0%) |
Physical Housing Characteristics in Highland Park
Housing Structures in Highland Park
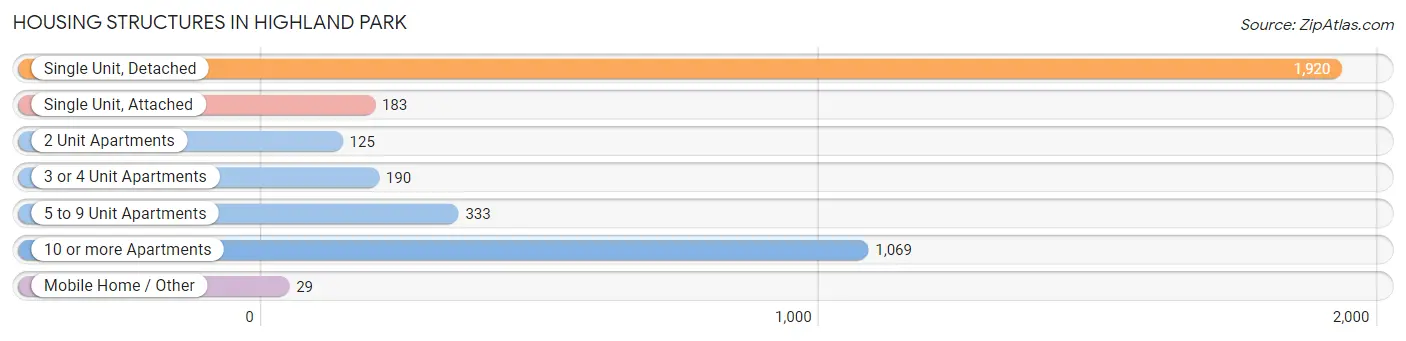
| Structure Type | # Housing Units | % Housing Units |
| Single Unit, Detached | 1,920 | 49.9% |
| Single Unit, Attached | 183 | 4.8% |
| 2 Unit Apartments | 125 | 3.3% |
| 3 or 4 Unit Apartments | 190 | 4.9% |
| 5 to 9 Unit Apartments | 333 | 8.6% |
| 10 or more Apartments | 1,069 | 27.8% |
| Mobile Home / Other | 29 | 0.7% |
| Total | 3,849 | 100.0% |
Housing Structures by Occupancy in Highland Park
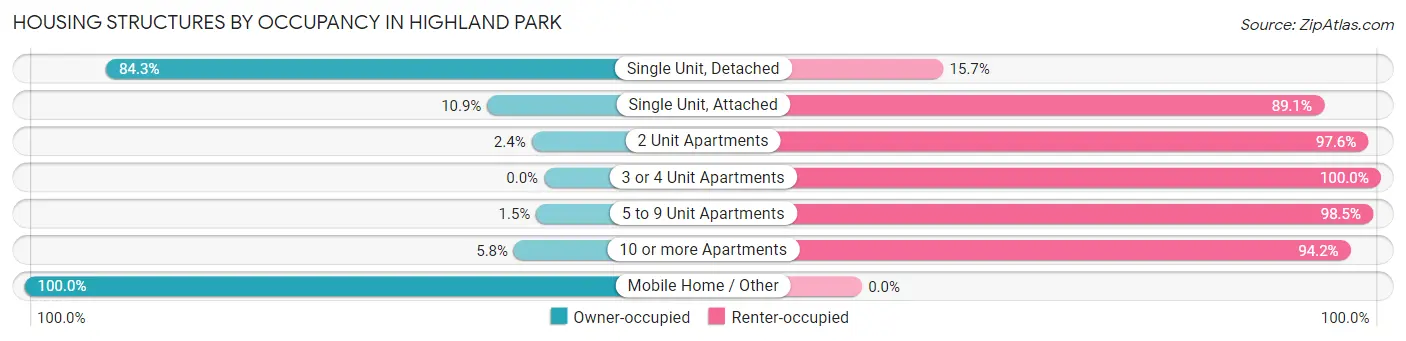
| Structure Type | Owner-occupied | Renter-occupied |
| Single Unit, Detached | 1,619 (84.3%) | 301 (15.7%) |
| Single Unit, Attached | 20 (10.9%) | 163 (89.1%) |
| 2 Unit Apartments | 3 (2.4%) | 122 (97.6%) |
| 3 or 4 Unit Apartments | 0 (0.0%) | 190 (100.0%) |
| 5 to 9 Unit Apartments | 5 (1.5%) | 328 (98.5%) |
| 10 or more Apartments | 62 (5.8%) | 1,007 (94.2%) |
| Mobile Home / Other | 29 (100.0%) | 0 (0.0%) |
| Total | 1,738 (45.2%) | 2,111 (54.8%) |
Housing Structures by Number of Rooms in Highland Park
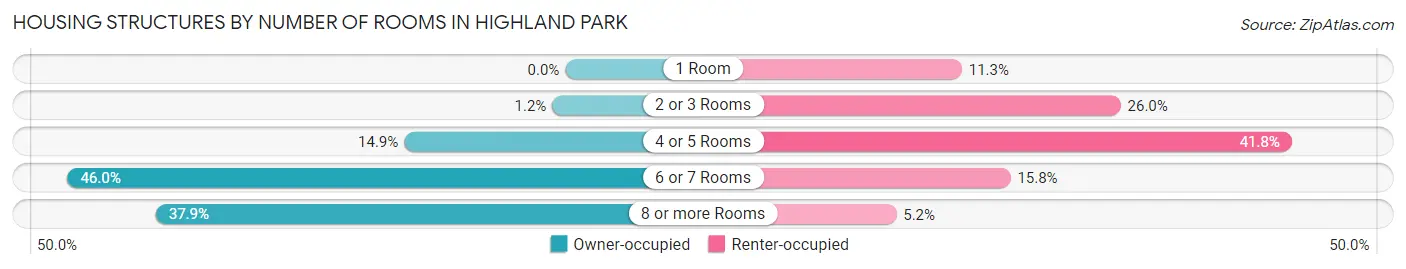
| Number of Rooms | Owner-occupied | Renter-occupied |
| 1 Room | 0 (0.0%) | 238 (11.3%) |
| 2 or 3 Rooms | 21 (1.2%) | 548 (26.0%) |
| 4 or 5 Rooms | 259 (14.9%) | 882 (41.8%) |
| 6 or 7 Rooms | 800 (46.0%) | 333 (15.8%) |
| 8 or more Rooms | 658 (37.9%) | 110 (5.2%) |
| Total | 1,738 (100.0%) | 2,111 (100.0%) |
Housing Structure by Heating Type in Highland Park
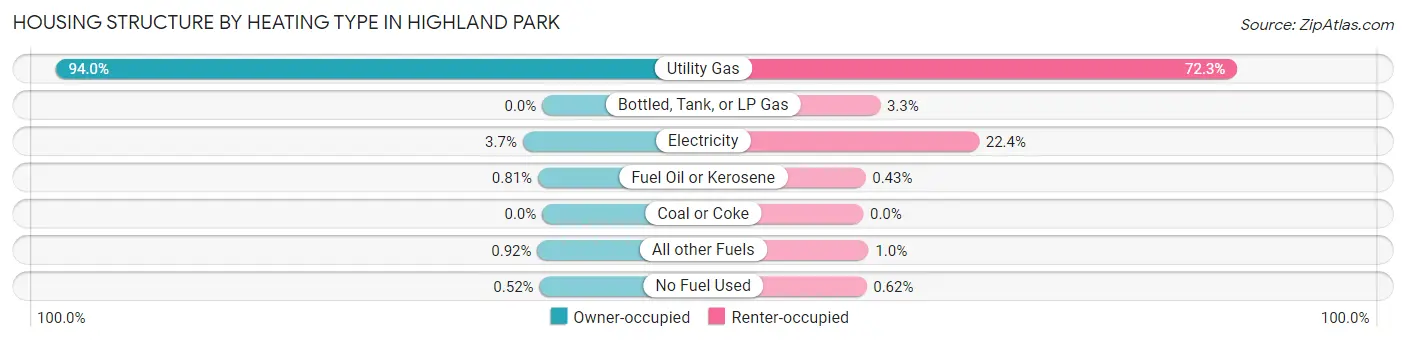
| Heating Type | Owner-occupied | Renter-occupied |
| Utility Gas | 1,634 (94.0%) | 1,526 (72.3%) |
| Bottled, Tank, or LP Gas | 0 (0.0%) | 69 (3.3%) |
| Electricity | 65 (3.7%) | 472 (22.4%) |
| Fuel Oil or Kerosene | 14 (0.8%) | 9 (0.4%) |
| Coal or Coke | 0 (0.0%) | 0 (0.0%) |
| All other Fuels | 16 (0.9%) | 22 (1.0%) |
| No Fuel Used | 9 (0.5%) | 13 (0.6%) |
| Total | 1,738 (100.0%) | 2,111 (100.0%) |
Household Vehicle Usage in Highland Park
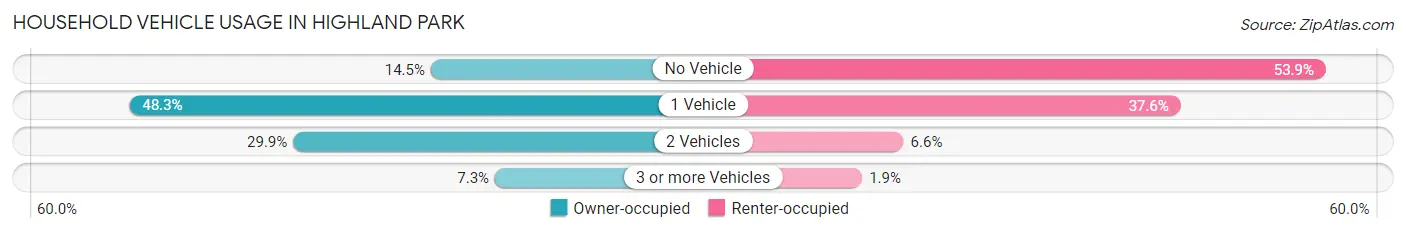
| Vehicles per Household | Owner-occupied | Renter-occupied |
| No Vehicle | 252 (14.5%) | 1,137 (53.9%) |
| 1 Vehicle | 839 (48.3%) | 794 (37.6%) |
| 2 Vehicles | 520 (29.9%) | 139 (6.6%) |
| 3 or more Vehicles | 127 (7.3%) | 41 (1.9%) |
| Total | 1,738 (100.0%) | 2,111 (100.0%) |
Real Estate & Mortgages in Highland Park
Real Estate and Mortgage Overview in Highland Park
| Characteristic | Without Mortgage | With Mortgage |
| Housing Units | 1,185 | 553 |
| Median Property Value | $55,900 | $89,600 |
| Median Household Income | $48,428 | $112 |
| Monthly Housing Costs | $548 | $0 |
| Real Estate Taxes | $1,297 | $115 |
Property Value by Mortgage Status in Highland Park
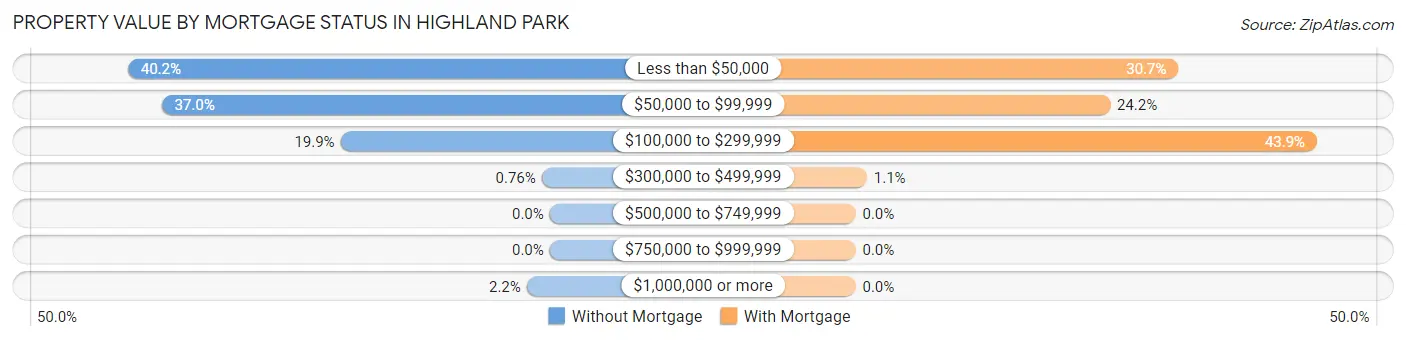
| Property Value | Without Mortgage | With Mortgage |
| Less than $50,000 | 476 (40.2%) | 170 (30.7%) |
| $50,000 to $99,999 | 438 (37.0%) | 134 (24.2%) |
| $100,000 to $299,999 | 236 (19.9%) | 243 (43.9%) |
| $300,000 to $499,999 | 9 (0.8%) | 6 (1.1%) |
| $500,000 to $749,999 | 0 (0.0%) | 0 (0.0%) |
| $750,000 to $999,999 | 0 (0.0%) | 0 (0.0%) |
| $1,000,000 or more | 26 (2.2%) | 0 (0.0%) |
| Total | 1,185 (100.0%) | 553 (100.0%) |
Household Income by Mortgage Status in Highland Park
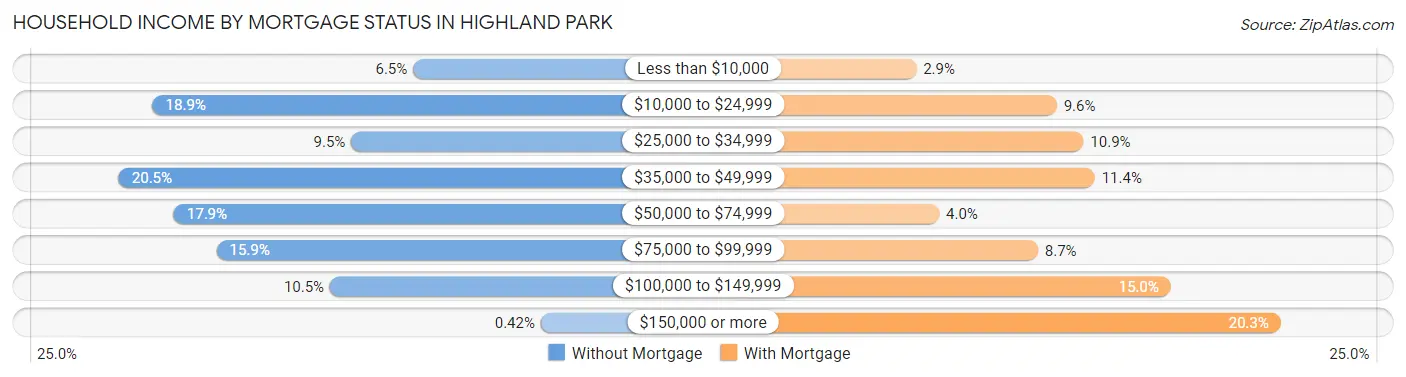
| Household Income | Without Mortgage | With Mortgage |
| Less than $10,000 | 77 (6.5%) | 16 (2.9%) |
| $10,000 to $24,999 | 224 (18.9%) | 53 (9.6%) |
| $25,000 to $34,999 | 112 (9.5%) | 60 (10.8%) |
| $35,000 to $49,999 | 243 (20.5%) | 63 (11.4%) |
| $50,000 to $74,999 | 212 (17.9%) | 22 (4.0%) |
| $75,000 to $99,999 | 188 (15.9%) | 48 (8.7%) |
| $100,000 to $149,999 | 124 (10.5%) | 83 (15.0%) |
| $150,000 or more | 5 (0.4%) | 112 (20.3%) |
| Total | 1,185 (100.0%) | 553 (100.0%) |
Property Value to Household Income Ratio in Highland Park
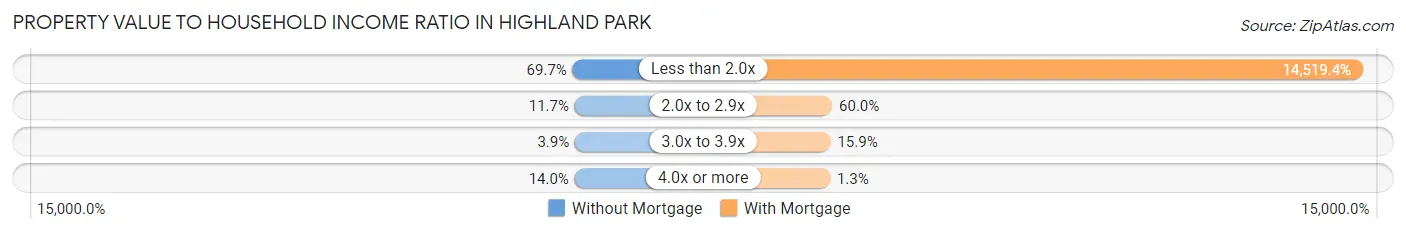
| Value-to-Income Ratio | Without Mortgage | With Mortgage |
| Less than 2.0x | 826 (69.7%) | 80,292 (14,519.4%) |
| 2.0x to 2.9x | 139 (11.7%) | 332 (60.0%) |
| 3.0x to 3.9x | 46 (3.9%) | 88 (15.9%) |
| 4.0x or more | 166 (14.0%) | 7 (1.3%) |
| Total | 1,185 (100.0%) | 553 (100.0%) |
Real Estate Taxes by Mortgage Status in Highland Park
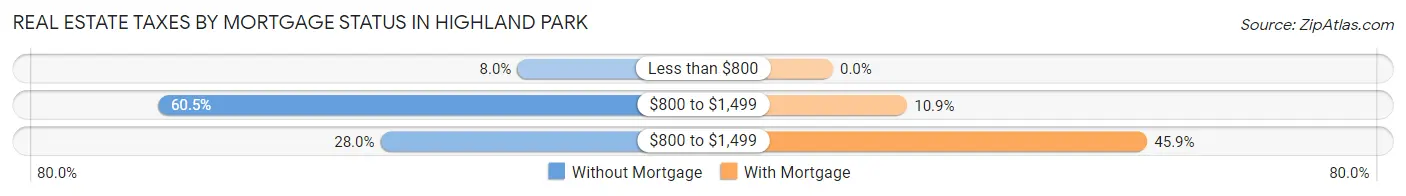
| Property Taxes | Without Mortgage | With Mortgage |
| Less than $800 | 95 (8.0%) | 0 (0.0%) |
| $800 to $1,499 | 717 (60.5%) | 60 (10.8%) |
| $800 to $1,499 | 332 (28.0%) | 254 (45.9%) |
| Total | 1,185 (100.0%) | 553 (100.0%) |
Health & Disability in Highland Park
Health Insurance Coverage by Age in Highland Park
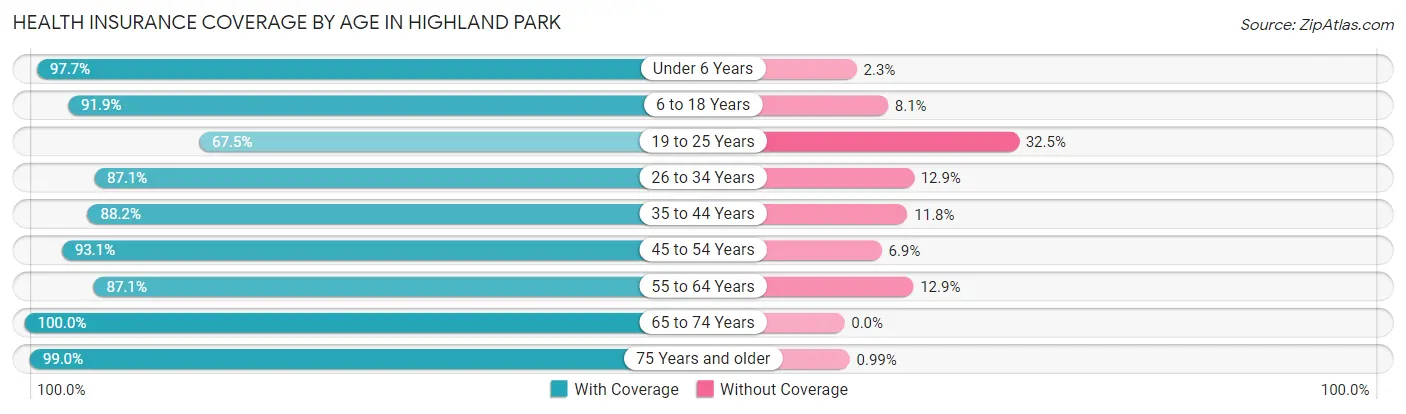
| Age Bracket | With Coverage | Without Coverage |
| Under 6 Years | 470 (97.7%) | 11 (2.3%) |
| 6 to 18 Years | 1,120 (91.9%) | 99 (8.1%) |
| 19 to 25 Years | 560 (67.5%) | 270 (32.5%) |
| 26 to 34 Years | 693 (87.1%) | 103 (12.9%) |
| 35 to 44 Years | 848 (88.2%) | 113 (11.8%) |
| 45 to 54 Years | 952 (93.1%) | 71 (6.9%) |
| 55 to 64 Years | 1,240 (87.1%) | 183 (12.9%) |
| 65 to 74 Years | 1,176 (100.0%) | 0 (0.0%) |
| 75 Years and older | 899 (99.0%) | 9 (1.0%) |
| Total | 7,958 (90.3%) | 859 (9.7%) |
Health Insurance Coverage by Citizenship Status in Highland Park
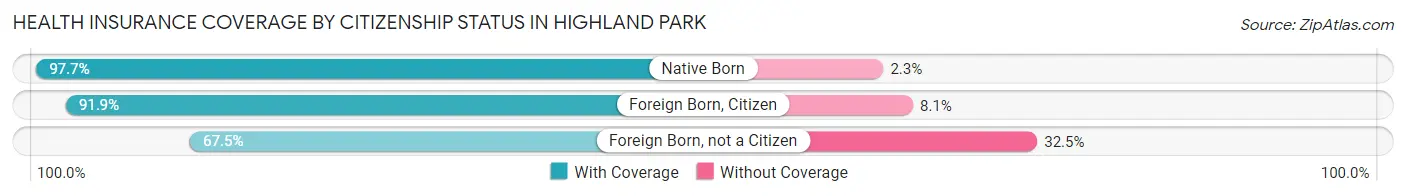
| Citizenship Status | With Coverage | Without Coverage |
| Native Born | 470 (97.7%) | 11 (2.3%) |
| Foreign Born, Citizen | 1,120 (91.9%) | 99 (8.1%) |
| Foreign Born, not a Citizen | 560 (67.5%) | 270 (32.5%) |
Health Insurance Coverage by Household Income in Highland Park
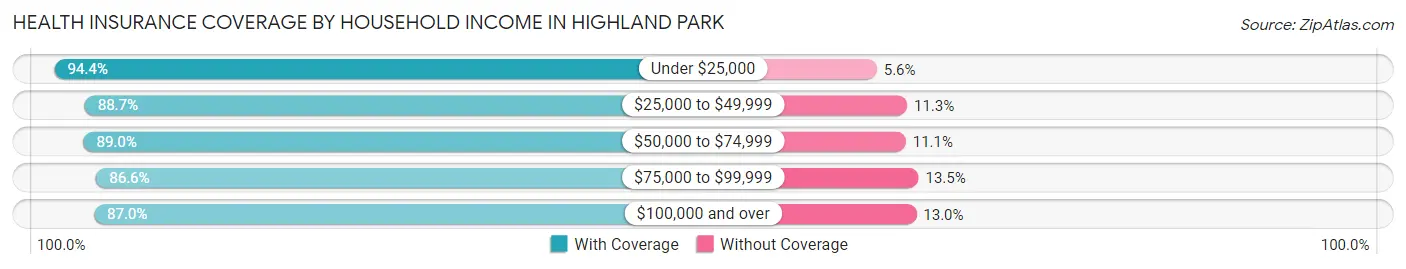
| Household Income | With Coverage | Without Coverage |
| Under $25,000 | 2,669 (94.4%) | 159 (5.6%) |
| $25,000 to $49,999 | 1,783 (88.7%) | 227 (11.3%) |
| $50,000 to $74,999 | 902 (88.9%) | 112 (11.1%) |
| $75,000 to $99,999 | 1,139 (86.6%) | 177 (13.5%) |
| $100,000 and over | 1,141 (87.0%) | 171 (13.0%) |
Public vs Private Health Insurance Coverage by Age in Highland Park
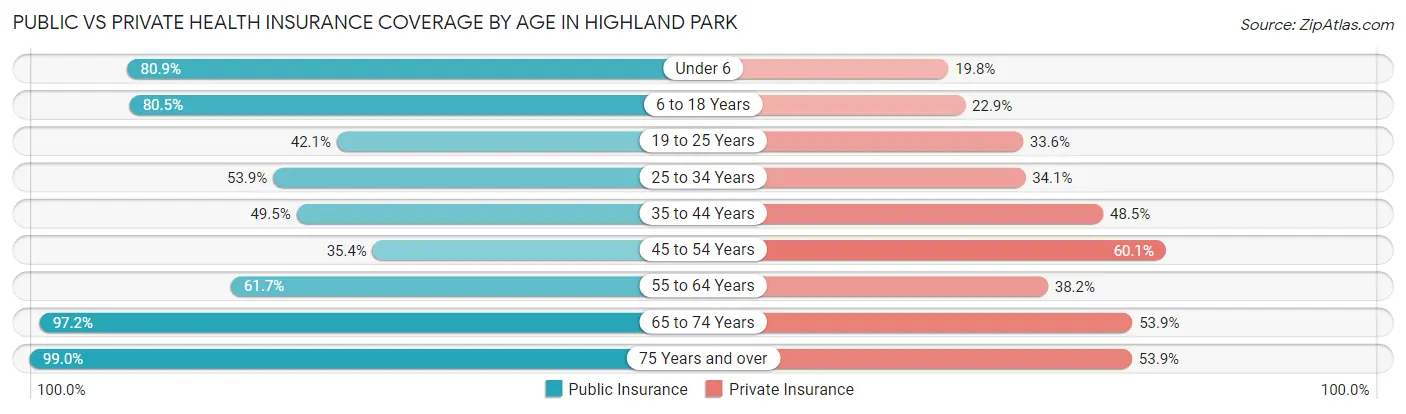
| Age Bracket | Public Insurance | Private Insurance |
| Under 6 | 389 (80.9%) | 95 (19.8%) |
| 6 to 18 Years | 981 (80.5%) | 279 (22.9%) |
| 19 to 25 Years | 349 (42.0%) | 279 (33.6%) |
| 25 to 34 Years | 429 (53.9%) | 271 (34.1%) |
| 35 to 44 Years | 476 (49.5%) | 466 (48.5%) |
| 45 to 54 Years | 362 (35.4%) | 615 (60.1%) |
| 55 to 64 Years | 878 (61.7%) | 544 (38.2%) |
| 65 to 74 Years | 1,143 (97.2%) | 634 (53.9%) |
| 75 Years and over | 899 (99.0%) | 489 (53.8%) |
| Total | 5,906 (67.0%) | 3,672 (41.6%) |
Disability Status by Sex by Age in Highland Park
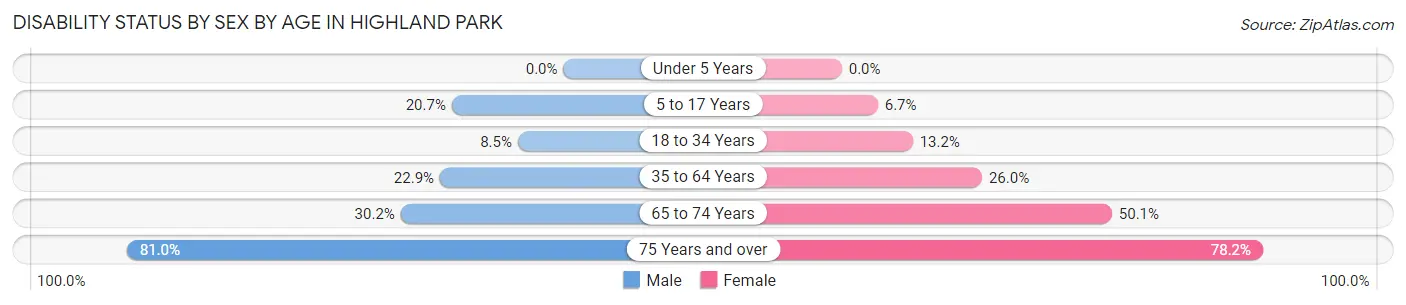
| Age Bracket | Male | Female |
| Under 5 Years | 0 (0.0%) | 0 (0.0%) |
| 5 to 17 Years | 144 (20.7%) | 34 (6.7%) |
| 18 to 34 Years | 63 (8.5%) | 122 (13.2%) |
| 35 to 64 Years | 365 (22.9%) | 472 (26.0%) |
| 65 to 74 Years | 119 (30.2%) | 392 (50.1%) |
| 75 Years and over | 376 (81.0%) | 347 (78.1%) |
Disability Class by Sex by Age in Highland Park
Disability Class: Hearing Difficulty
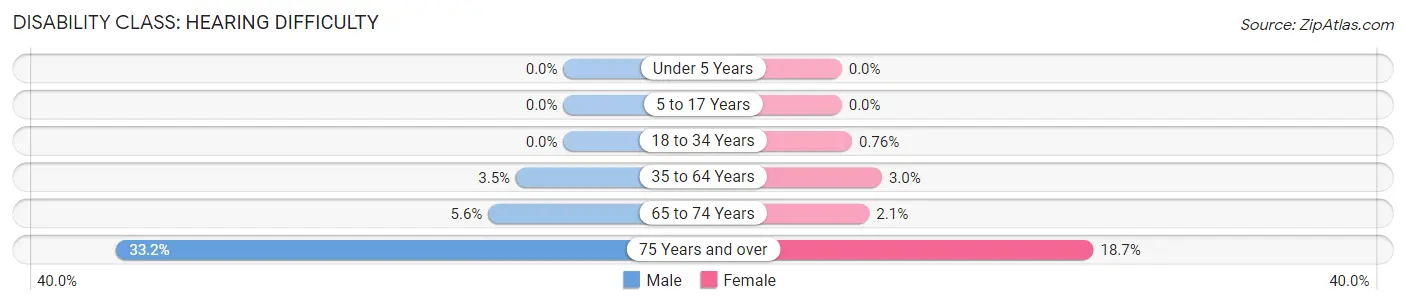
| Age Bracket | Male | Female |
| Under 5 Years | 0 (0.0%) | 0 (0.0%) |
| 5 to 17 Years | 0 (0.0%) | 0 (0.0%) |
| 18 to 34 Years | 0 (0.0%) | 7 (0.8%) |
| 35 to 64 Years | 56 (3.5%) | 54 (3.0%) |
| 65 to 74 Years | 22 (5.6%) | 16 (2.1%) |
| 75 Years and over | 154 (33.2%) | 83 (18.7%) |
Disability Class: Vision Difficulty
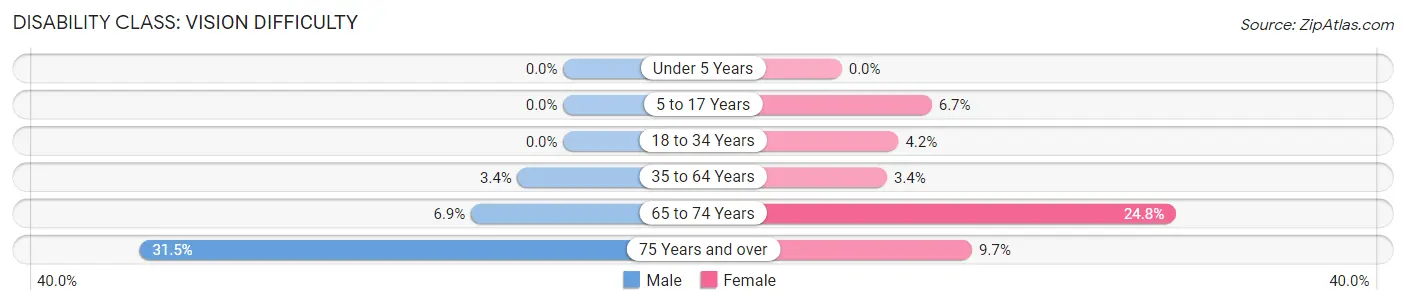
| Age Bracket | Male | Female |
| Under 5 Years | 0 (0.0%) | 0 (0.0%) |
| 5 to 17 Years | 0 (0.0%) | 34 (6.7%) |
| 18 to 34 Years | 0 (0.0%) | 39 (4.2%) |
| 35 to 64 Years | 54 (3.4%) | 61 (3.4%) |
| 65 to 74 Years | 27 (6.9%) | 194 (24.8%) |
| 75 Years and over | 146 (31.5%) | 43 (9.7%) |
Disability Class: Cognitive Difficulty
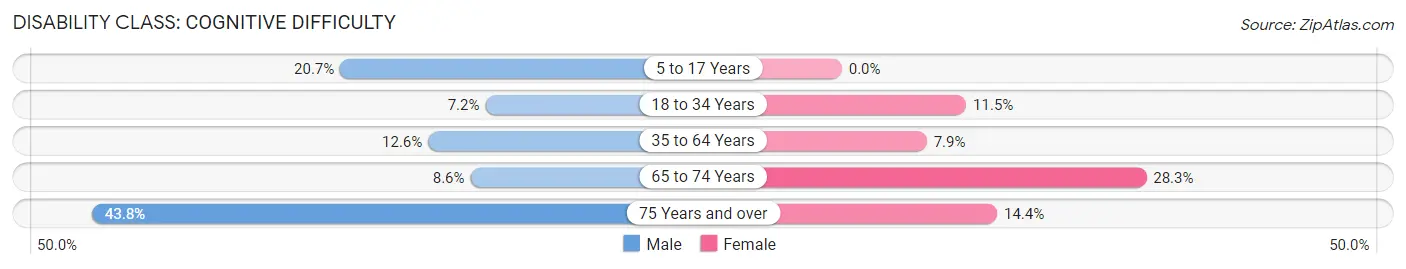
| Age Bracket | Male | Female |
| 5 to 17 Years | 144 (20.7%) | 0 (0.0%) |
| 18 to 34 Years | 54 (7.2%) | 107 (11.5%) |
| 35 to 64 Years | 200 (12.6%) | 143 (7.9%) |
| 65 to 74 Years | 34 (8.6%) | 221 (28.3%) |
| 75 Years and over | 203 (43.8%) | 64 (14.4%) |
Disability Class: Ambulatory Difficulty
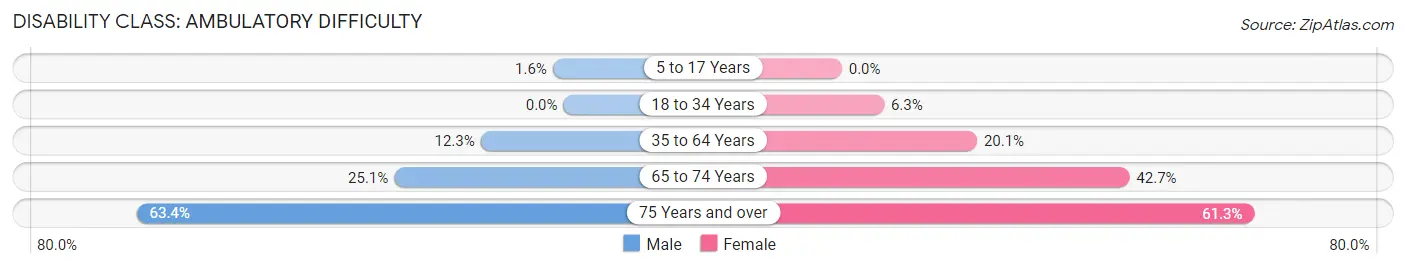
| Age Bracket | Male | Female |
| 5 to 17 Years | 11 (1.6%) | 0 (0.0%) |
| 18 to 34 Years | 0 (0.0%) | 58 (6.3%) |
| 35 to 64 Years | 196 (12.3%) | 364 (20.1%) |
| 65 to 74 Years | 99 (25.1%) | 334 (42.7%) |
| 75 Years and over | 294 (63.4%) | 272 (61.3%) |
Disability Class: Self-Care Difficulty
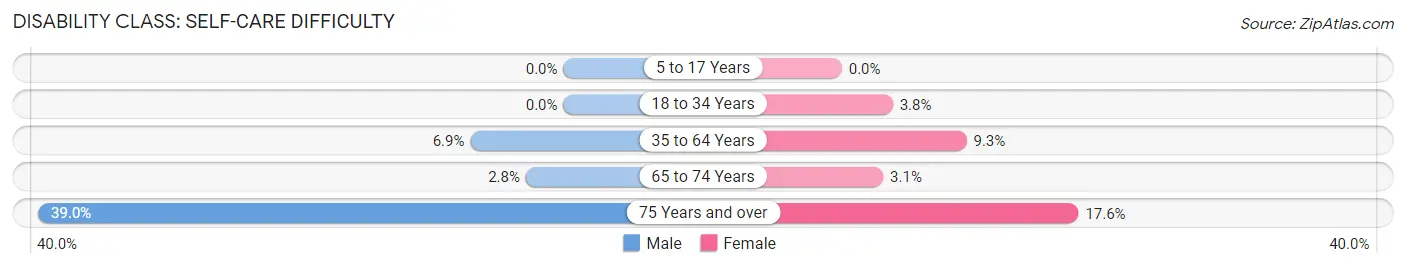
| Age Bracket | Male | Female |
| 5 to 17 Years | 0 (0.0%) | 0 (0.0%) |
| 18 to 34 Years | 0 (0.0%) | 35 (3.8%) |
| 35 to 64 Years | 110 (6.9%) | 168 (9.3%) |
| 65 to 74 Years | 11 (2.8%) | 24 (3.1%) |
| 75 Years and over | 181 (39.0%) | 78 (17.6%) |
Technology Access in Highland Park
Computing Device Access in Highland Park
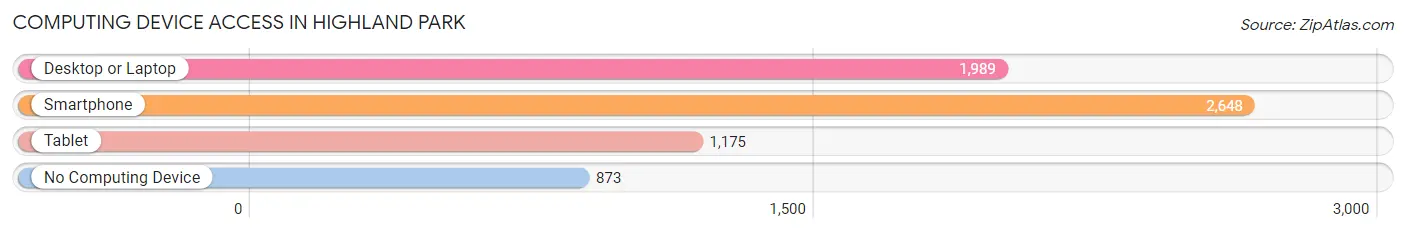
| Device Type | # Households | % Households |
| Desktop or Laptop | 1,989 | 51.7% |
| Smartphone | 2,648 | 68.8% |
| Tablet | 1,175 | 30.5% |
| No Computing Device | 873 | 22.7% |
| Total | 3,849 | 100.0% |
Internet Access in Highland Park
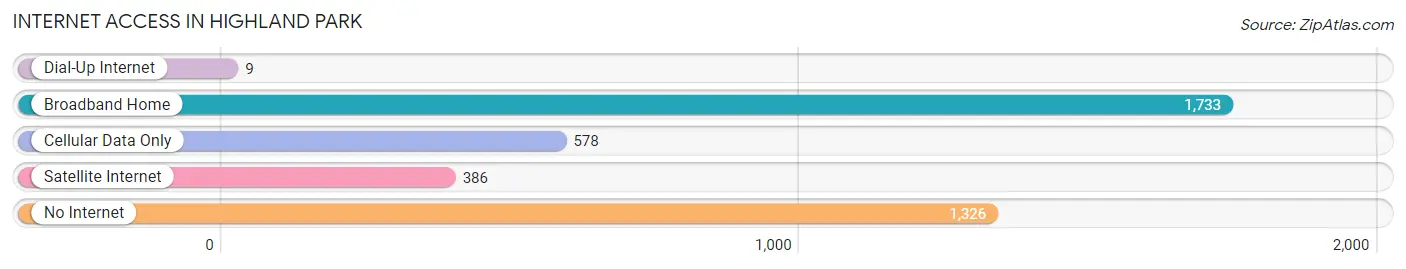
| Internet Type | # Households | % Households |
| Dial-Up Internet | 9 | 0.2% |
| Broadband Home | 1,733 | 45.0% |
| Cellular Data Only | 578 | 15.0% |
| Satellite Internet | 386 | 10.0% |
| No Internet | 1,326 | 34.4% |
| Total | 3,849 | 100.0% |
Highland Park Summary
Highland Park, Michigan is a small city located in Wayne County, Michigan. It is situated just north of Detroit and is part of the Detroit metropolitan area. The city has a population of 11,776 according to the 2010 census.
Geography
Highland Park is located at 42°25′N 83°7′W (42.4133, -83.1167). It is situated on the east side of the Detroit River, just north of Detroit. The city has a total area of 2.2 square miles, all of which is land.
History
Highland Park was founded in 1918 by Henry Ford. He wanted to create a model industrial city that would be a showcase for his automobile manufacturing. Ford purchased the land and built a factory, which he named the Highland Park Ford Plant. The city was incorporated in 1918 and was named after the nearby Highland Park neighborhood in Detroit.
The city grew rapidly in the 1920s and 1930s, becoming a major industrial center. The city was home to several major auto manufacturers, including Chrysler, Packard, and Studebaker. The city also had a large number of factories that produced parts for the auto industry.
The city experienced a decline in the 1950s and 1960s as the auto industry moved out of the city. The city's population declined from a peak of over 50,000 in 1950 to just over 11,000 in 2010.
Economy
Highland Park's economy is largely based on the auto industry. The city is home to several auto parts manufacturers, including American Axle & Manufacturing, Detroit Diesel, and Lear Corporation. The city also has a number of small businesses, including restaurants, retail stores, and service providers.
Demographics
According to the 2010 census, the population of Highland Park was 11,776. The racial makeup of the city was 79.3% African American, 15.2% White, 0.7% Asian, 0.3% Native American, and 4.5% from other races. The median household income was $20,945, and the median family income was $25,945.
Highland Park has a high poverty rate, with 37.2% of the population living below the poverty line. The city also has a high crime rate, with a violent crime rate of 1,845 per 100,000 people.
Conclusion
Highland Park, Michigan is a small city located in Wayne County, Michigan. It is situated just north of Detroit and is part of the Detroit metropolitan area. The city has a population of 11,776 according to the 2010 census. The city's economy is largely based on the auto industry, and it has a high poverty rate and a high crime rate.
Common Questions
What is Per Capita Income in Highland Park?
Per Capita income in Highland Park is $23,710.
What is the Median Family Income in Highland Park?
Median Family Income in Highland Park is $45,938.
What is the Median Household income in Highland Park?
Median Household Income in Highland Park is $30,341.
What is Income or Wage Gap in Highland Park?
Income or Wage Gap in Highland Park is 32.8%.
Women in Highland Park earn 67.2 cents for every dollar earned by a man.
What is Family Income Deficit in Highland Park?
Family Income Deficit in Highland Park is $8,261.
Families that are below poverty line in Highland Park earn $8,261 less on average than the poverty threshold level.
What is Inequality or Gini Index in Highland Park?
Inequality or Gini Index in Highland Park is 0.57.
What is the Total Population of Highland Park?
Total Population of Highland Park is 9,032.
What is the Total Male Population of Highland Park?
Total Male Population of Highland Park is 4,266.
What is the Total Female Population of Highland Park?
Total Female Population of Highland Park is 4,766.
What is the Ratio of Males per 100 Females in Highland Park?
There are 89.51 Males per 100 Females in Highland Park.
What is the Ratio of Females per 100 Males in Highland Park?
There are 111.72 Females per 100 Males in Highland Park.
What is the Median Population Age in Highland Park?
Median Population Age in Highland Park is 45.9 Years.
What is the Average Family Size in Highland Park
Average Family Size in Highland Park is 3.6 People.
What is the Average Household Size in Highland Park
Average Household Size in Highland Park is 2.2 People.
How Large is the Labor Force in Highland Park?
There are 3,701 People in the Labor Forcein in Highland Park.
What is the Percentage of People in the Labor Force in Highland Park?
49.8% of People are in the Labor Force in Highland Park.
What is the Unemployment Rate in Highland Park?
Unemployment Rate in Highland Park is 18.2%.