Willards, MD Map & Demographics
Willards Map
Willards Overview
$26,661
PER CAPITA INCOME
$74,000
AVG FAMILY INCOME
$71,184
AVG HOUSEHOLD INCOME
46.4%
WAGE / INCOME GAP [ % ]
53.6¢/ $1
WAGE / INCOME GAP [ $ ]
0.31
INEQUALITY / GINI INDEX
1,161
TOTAL POPULATION
590
MALE POPULATION
571
FEMALE POPULATION
103.33
MALES / 100 FEMALES
96.78
FEMALES / 100 MALES
40.6
MEDIAN AGE
2.9
AVG FAMILY SIZE
2.6
AVG HOUSEHOLD SIZE
661
LABOR FORCE [ PEOPLE ]
74.5%
PERCENT IN LABOR FORCE
12.6%
UNEMPLOYMENT RATE
Willards Zip Codes
Income in Willards
Income Overview in Willards
Per Capita Income in Willards is $26,661, while median incomes of families and households are $74,000 and $71,184 respectively.
| Characteristic | Number | Measure |
| Per Capita Income | 1,161 | $26,661 |
| Median Family Income | 322 | $74,000 |
| Mean Family Income | 322 | $69,174 |
| Median Household Income | 452 | $71,184 |
| Mean Household Income | 452 | $68,435 |
| Income Deficit | 322 | $0 |
| Wage / Income Gap (%) | 1,161 | 46.42% |
| Wage / Income Gap ($) | 1,161 | 53.58¢ per $1 |
| Gini / Inequality Index | 1,161 | 0.31 |
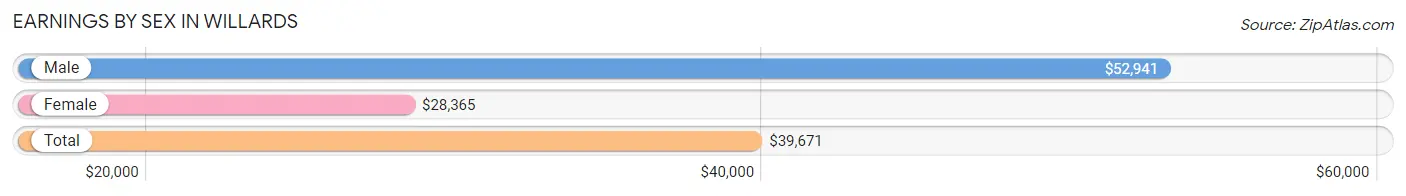
Earnings by Sex in Willards
Average Earnings in Willards are $39,671, $52,941 for men and $28,365 for women, a difference of 46.4%.
| Sex | Number | Average Earnings |
| Male | 324 (50.9%) | $52,941 |
| Female | 313 (49.1%) | $28,365 |
| Total | 637 (100.0%) | $39,671 |
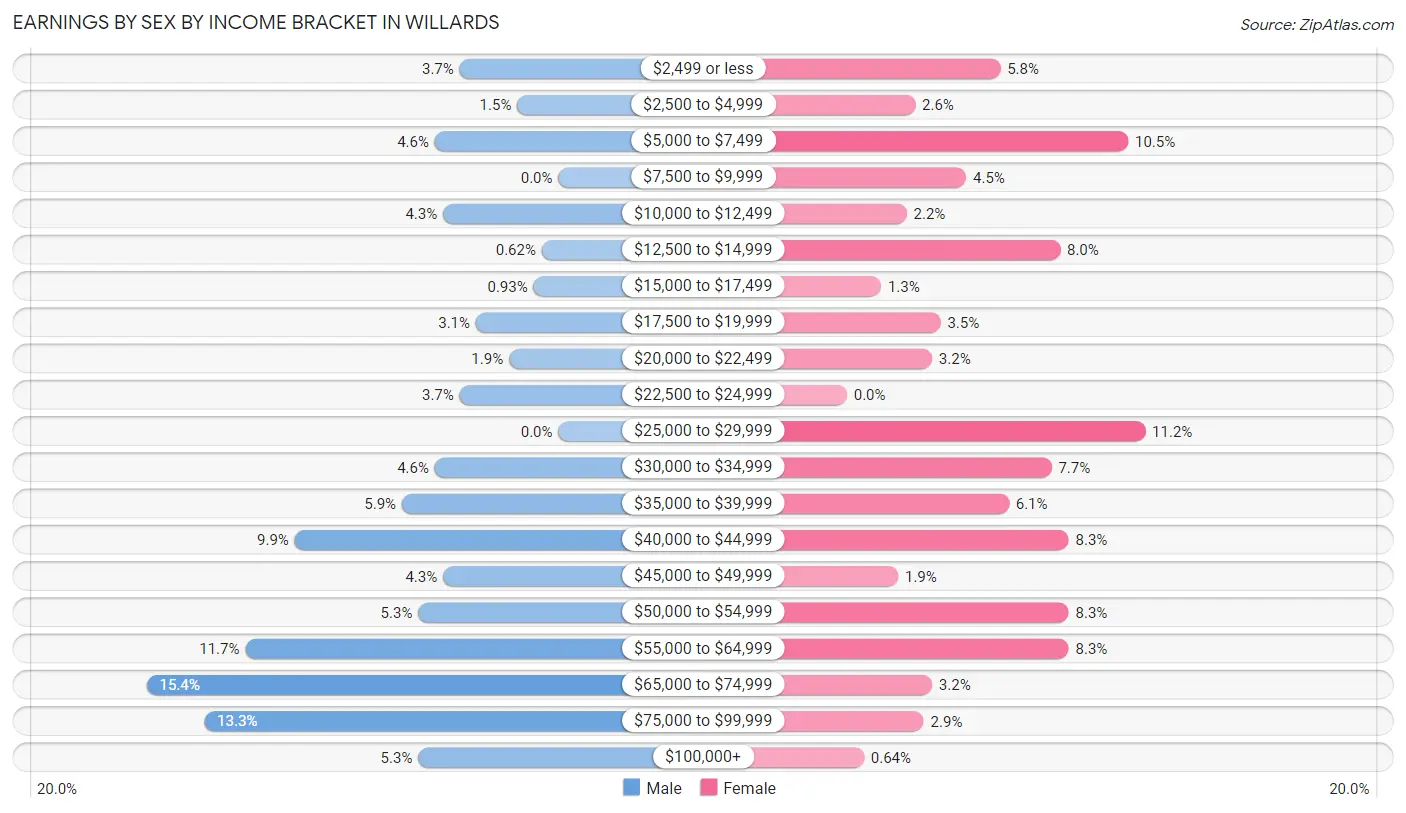
Earnings by Sex by Income Bracket in Willards
The most common earnings brackets in Willards are $65,000 to $74,999 for men (50 | 15.4%) and $25,000 to $29,999 for women (35 | 11.2%).
| Income | Male | Female |
| $2,499 or less | 12 (3.7%) | 18 (5.8%) |
| $2,500 to $4,999 | 5 (1.5%) | 8 (2.6%) |
| $5,000 to $7,499 | 15 (4.6%) | 33 (10.5%) |
| $7,500 to $9,999 | 0 (0.0%) | 14 (4.5%) |
| $10,000 to $12,499 | 14 (4.3%) | 7 (2.2%) |
| $12,500 to $14,999 | 2 (0.6%) | 25 (8.0%) |
| $15,000 to $17,499 | 3 (0.9%) | 4 (1.3%) |
| $17,500 to $19,999 | 10 (3.1%) | 11 (3.5%) |
| $20,000 to $22,499 | 6 (1.8%) | 10 (3.2%) |
| $22,500 to $24,999 | 12 (3.7%) | 0 (0.0%) |
| $25,000 to $29,999 | 0 (0.0%) | 35 (11.2%) |
| $30,000 to $34,999 | 15 (4.6%) | 24 (7.7%) |
| $35,000 to $39,999 | 19 (5.9%) | 19 (6.1%) |
| $40,000 to $44,999 | 32 (9.9%) | 26 (8.3%) |
| $45,000 to $49,999 | 14 (4.3%) | 6 (1.9%) |
| $50,000 to $54,999 | 17 (5.2%) | 26 (8.3%) |
| $55,000 to $64,999 | 38 (11.7%) | 26 (8.3%) |
| $65,000 to $74,999 | 50 (15.4%) | 10 (3.2%) |
| $75,000 to $99,999 | 43 (13.3%) | 9 (2.9%) |
| $100,000+ | 17 (5.2%) | 2 (0.6%) |
| Total | 324 (100.0%) | 313 (100.0%) |
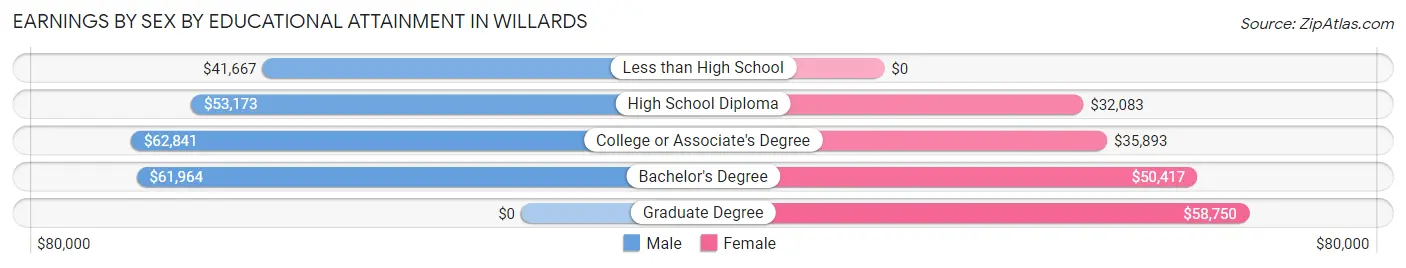
Earnings by Sex by Educational Attainment in Willards
Average earnings in Willards are $56,250 for men and $34,405 for women, a difference of 38.8%. Men with an educational attainment of college or associate's degree enjoy the highest average annual earnings of $62,841, while those with less than high school education earn the least with $41,667. Women with an educational attainment of graduate degree earn the most with the average annual earnings of $58,750, while those with high school diploma education have the smallest earnings of $32,083.
| Educational Attainment | Male Income | Female Income |
| Less than High School | $41,667 | $0 |
| High School Diploma | $53,173 | $32,083 |
| College or Associate's Degree | $62,841 | $35,893 |
| Bachelor's Degree | $61,964 | $50,417 |
| Graduate Degree | - | - |
| Total | $56,250 | $34,405 |
Family Income in Willards
Family Income Brackets in Willards
According to the Willards family income data, there are 84 families falling into the $75,000 to $99,999 income range, which is the most common income bracket and makes up 26.1% of all families.
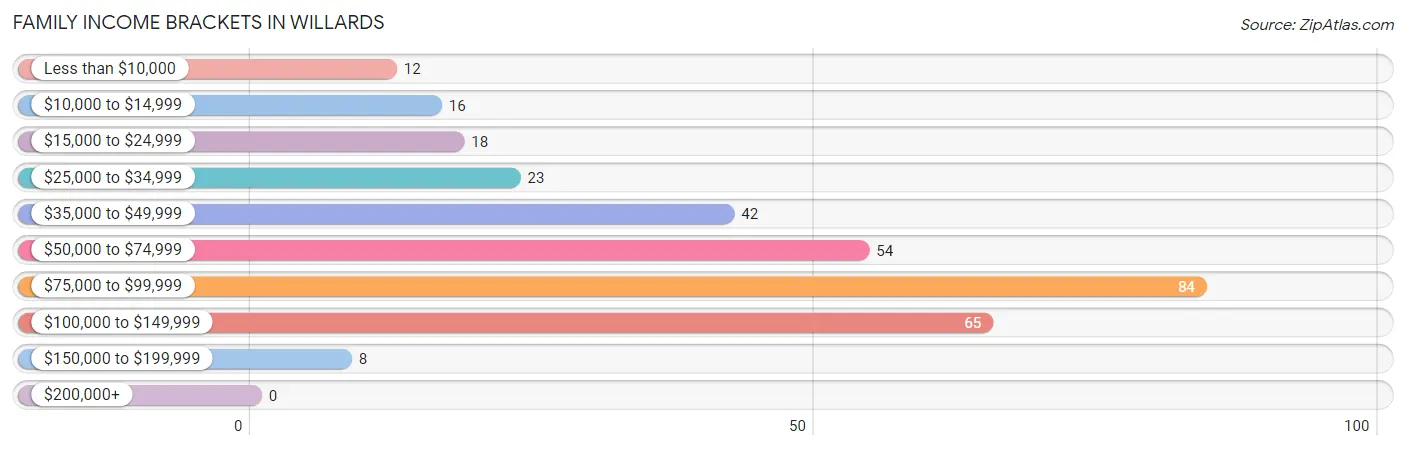
| Income Bracket | # Families | % Families |
| Less than $10,000 | 12 | 3.7% |
| $10,000 to $14,999 | 16 | 5.0% |
| $15,000 to $24,999 | 18 | 5.6% |
| $25,000 to $34,999 | 23 | 7.1% |
| $35,000 to $49,999 | 42 | 13.0% |
| $50,000 to $74,999 | 54 | 16.8% |
| $75,000 to $99,999 | 84 | 26.1% |
| $100,000 to $149,999 | 65 | 20.2% |
| $150,000 to $199,999 | 8 | 2.5% |
| $200,000+ | 0 | 0.0% |
Family Income by Famaliy Size in Willards
4-person families (65 | 20.2%) account for the highest median family income in Willards with $81,023 per family, while 2-person families (152 | 47.2%) have the highest median income of $26,818 per family member.
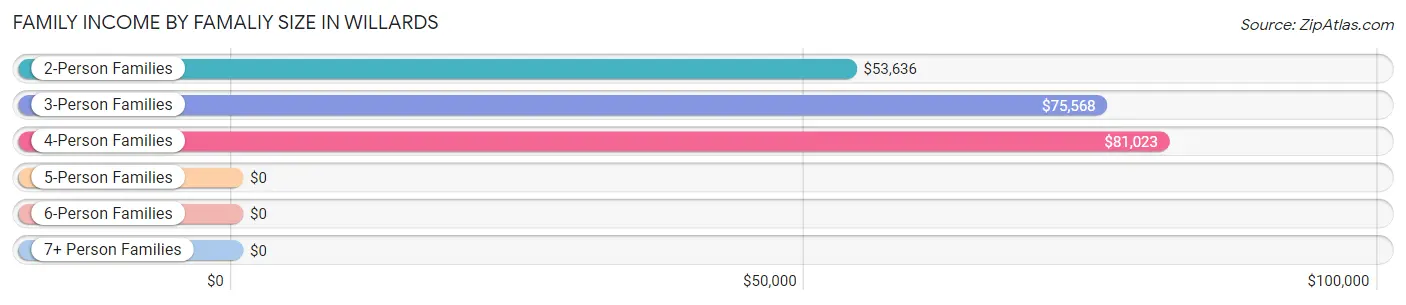
| Income Bracket | # Families | Median Income |
| 2-Person Families | 152 (47.2%) | $53,636 |
| 3-Person Families | 91 (28.3%) | $75,568 |
| 4-Person Families | 65 (20.2%) | $81,023 |
| 5-Person Families | 8 (2.5%) | $0 |
| 6-Person Families | 0 (0.0%) | $0 |
| 7+ Person Families | 6 (1.9%) | $0 |
| Total | 322 (100.0%) | $74,000 |
Family Income by Number of Earners in Willards
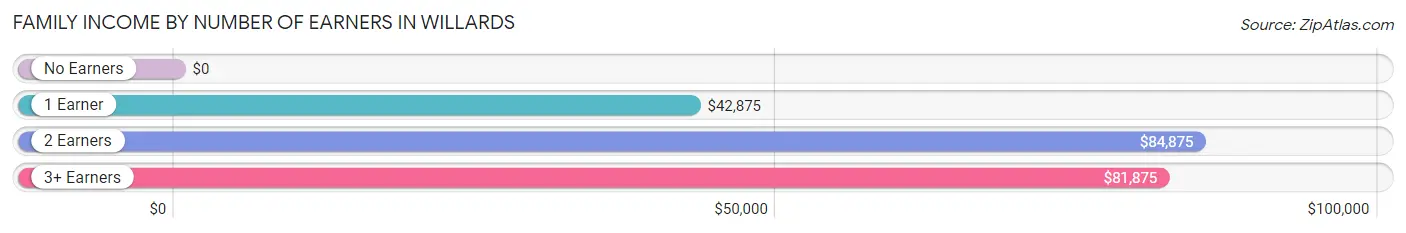
| Number of Earners | # Families | Median Income |
| No Earners | 23 (7.1%) | $0 |
| 1 Earner | 149 (46.3%) | $42,875 |
| 2 Earners | 111 (34.5%) | $84,875 |
| 3+ Earners | 39 (12.1%) | $81,875 |
| Total | 322 (100.0%) | $74,000 |
Household Income in Willards
Household Income Brackets in Willards
With 102 households falling in the category, the $50,000 to $74,999 income range is the most frequent in Willards, accounting for 22.6% of all households.
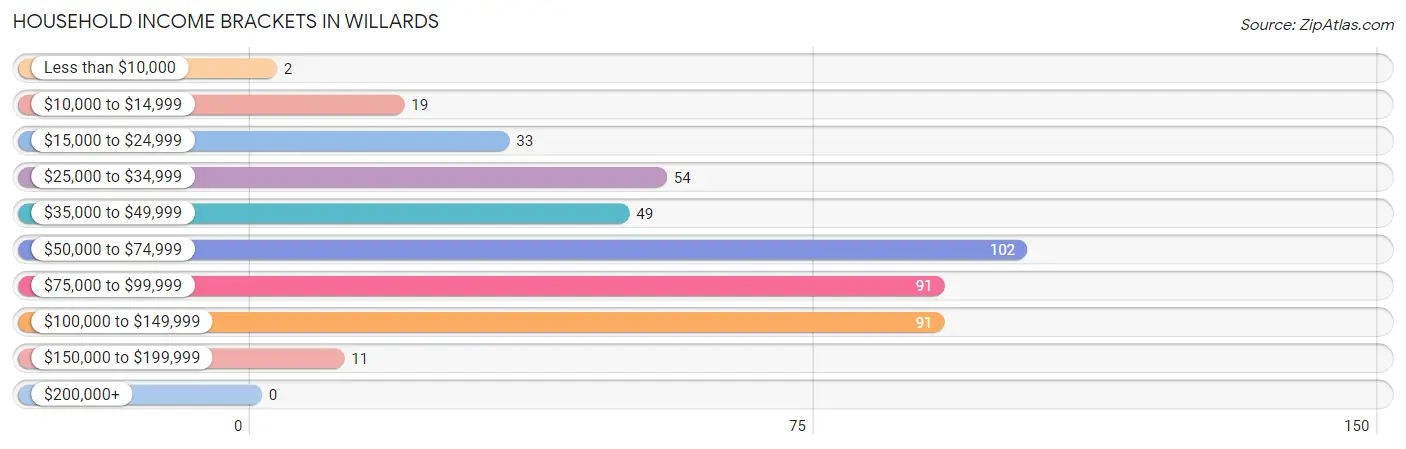
| Income Bracket | # Households | % Households |
| Less than $10,000 | 2 | 0.4% |
| $10,000 to $14,999 | 19 | 4.2% |
| $15,000 to $24,999 | 33 | 7.3% |
| $25,000 to $34,999 | 54 | 11.9% |
| $35,000 to $49,999 | 49 | 10.8% |
| $50,000 to $74,999 | 102 | 22.6% |
| $75,000 to $99,999 | 91 | 20.1% |
| $100,000 to $149,999 | 91 | 20.1% |
| $150,000 to $199,999 | 11 | 2.4% |
| $200,000+ | 0 | 0.0% |
Household Income by Householder Age in Willards
The median household income in Willards is $71,184, with the highest median household income of $80,962 found in the 45 to 64 years age bracket for the primary householder. A total of 202 households (44.7%) fall into this category. Meanwhile, the 15 to 24 years age bracket for the primary householder has the lowest median household income of $0, with 14 households (3.1%) in this group.
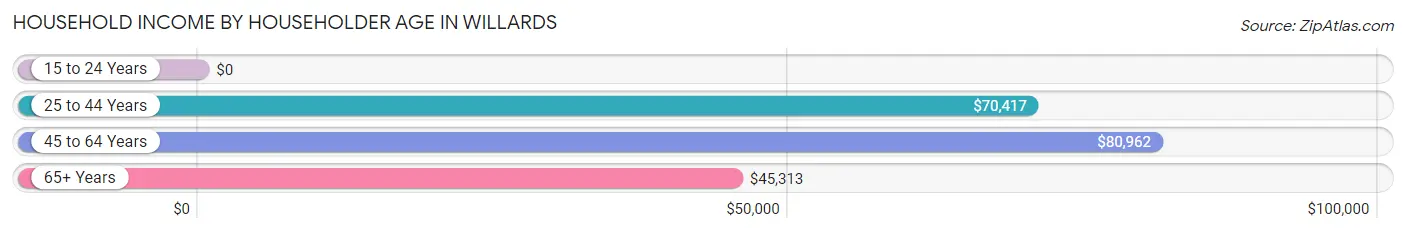
| Income Bracket | # Households | Median Income |
| 15 to 24 Years | 14 (3.1%) | $0 |
| 25 to 44 Years | 163 (36.1%) | $70,417 |
| 45 to 64 Years | 202 (44.7%) | $80,962 |
| 65+ Years | 73 (16.2%) | $45,313 |
| Total | 452 (100.0%) | $71,184 |
Poverty in Willards
Income Below Poverty by Sex and Age in Willards
With 20.7% poverty level for males and 17.2% for females among the residents of Willards, 15 year old males and 15 year old females are the most vulnerable to poverty, with 28 males (68.3%) and 9 females (100.0%) in their respective age groups living below the poverty level.
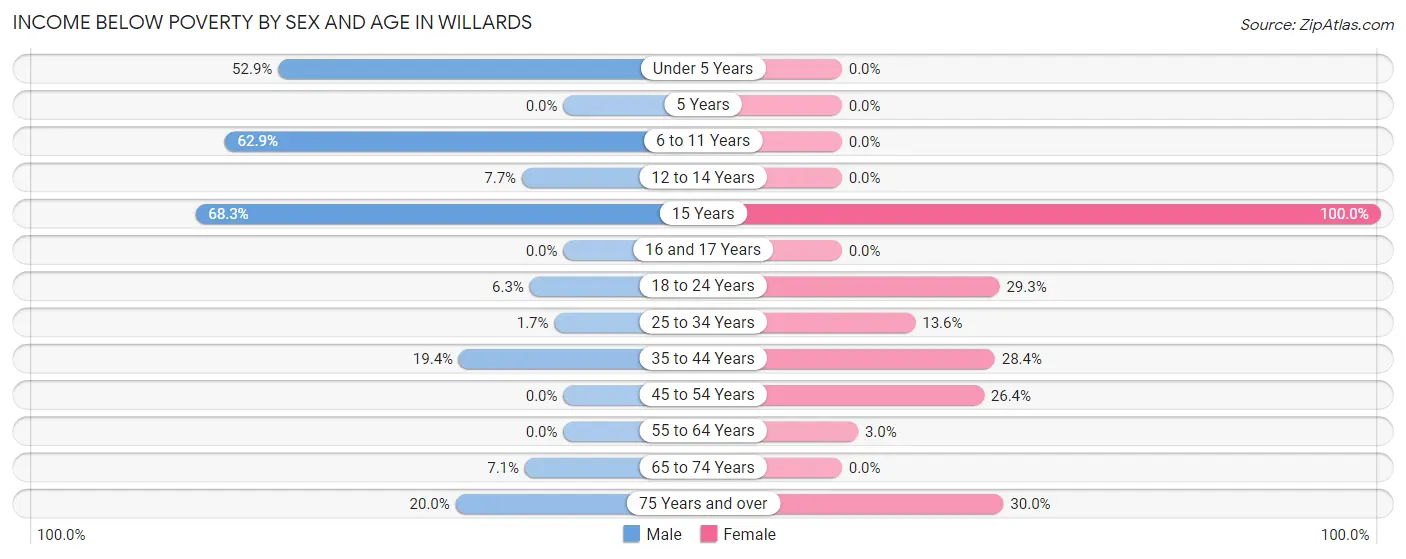
| Age Bracket | Male | Female |
| Under 5 Years | 45 (52.9%) | 0 (0.0%) |
| 5 Years | 0 (0.0%) | 0 (0.0%) |
| 6 to 11 Years | 22 (62.9%) | 0 (0.0%) |
| 12 to 14 Years | 1 (7.7%) | 0 (0.0%) |
| 15 Years | 28 (68.3%) | 9 (100.0%) |
| 16 and 17 Years | 0 (0.0%) | 0 (0.0%) |
| 18 to 24 Years | 2 (6.2%) | 24 (29.3%) |
| 25 to 34 Years | 1 (1.7%) | 6 (13.6%) |
| 35 to 44 Years | 19 (19.4%) | 23 (28.4%) |
| 45 to 54 Years | 0 (0.0%) | 24 (26.4%) |
| 55 to 64 Years | 0 (0.0%) | 3 (3.0%) |
| 65 to 74 Years | 2 (7.1%) | 0 (0.0%) |
| 75 Years and over | 2 (20.0%) | 9 (30.0%) |
| Total | 122 (20.7%) | 98 (17.2%) |
Income Above Poverty by Sex and Age in Willards
According to the poverty statistics in Willards, males aged 16 and 17 years and females aged under 5 years are the age groups that are most secure financially, with 100.0% of males and 100.0% of females in these age groups living above the poverty line.
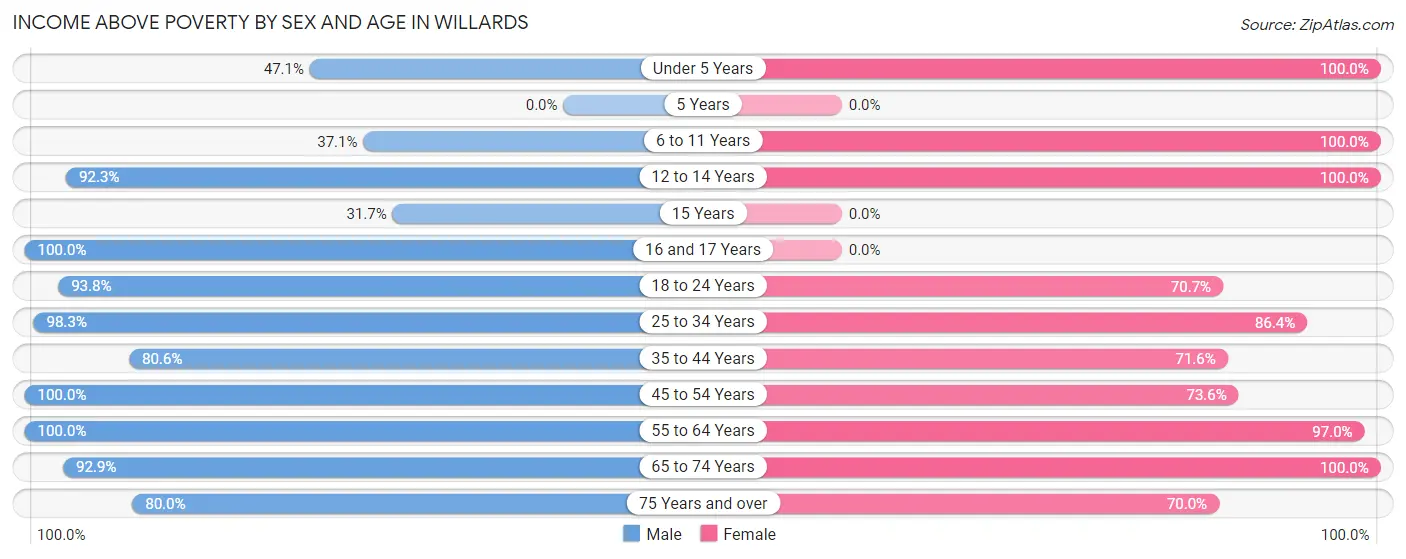
| Age Bracket | Male | Female |
| Under 5 Years | 40 (47.1%) | 27 (100.0%) |
| 5 Years | 0 (0.0%) | 0 (0.0%) |
| 6 to 11 Years | 13 (37.1%) | 39 (100.0%) |
| 12 to 14 Years | 12 (92.3%) | 25 (100.0%) |
| 15 Years | 13 (31.7%) | 0 (0.0%) |
| 16 and 17 Years | 16 (100.0%) | 0 (0.0%) |
| 18 to 24 Years | 30 (93.8%) | 58 (70.7%) |
| 25 to 34 Years | 59 (98.3%) | 38 (86.4%) |
| 35 to 44 Years | 79 (80.6%) | 58 (71.6%) |
| 45 to 54 Years | 102 (100.0%) | 67 (73.6%) |
| 55 to 64 Years | 70 (100.0%) | 97 (97.0%) |
| 65 to 74 Years | 26 (92.9%) | 43 (100.0%) |
| 75 Years and over | 8 (80.0%) | 21 (70.0%) |
| Total | 468 (79.3%) | 473 (82.8%) |
Income Below Poverty Among Married-Couple Families in Willards
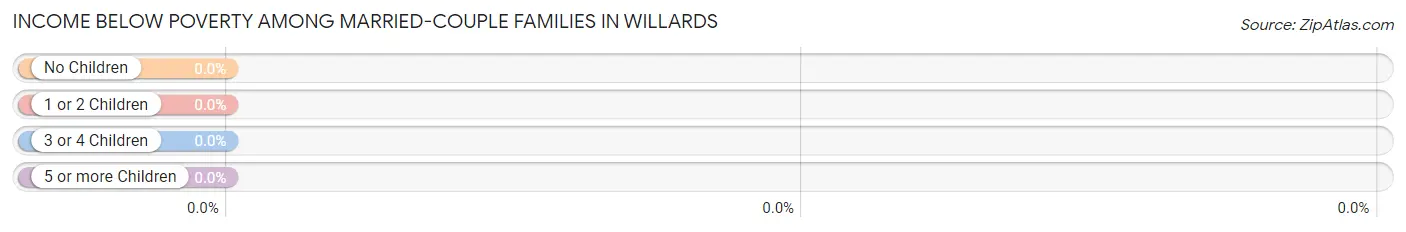
| Children | Above Poverty | Below Poverty |
| No Children | 107 (100.0%) | 0 (0.0%) |
| 1 or 2 Children | 69 (100.0%) | 0 (0.0%) |
| 3 or 4 Children | 0 (0.0%) | 0 (0.0%) |
| 5 or more Children | 0 (0.0%) | 0 (0.0%) |
| Total | 176 (100.0%) | 0 (0.0%) |
Income Below Poverty Among Single-Parent Households in Willards
According to the poverty data in Willards, 25.0% or 14 single-father households and 44.4% or 40 single-mother households are living below the poverty line. Among single-father households, those with 1 or 2 children have the highest poverty rate, with 14 households (37.8%) experiencing poverty. Likewise, among single-mother households, those with 1 or 2 children have the highest poverty rate, with 40 households (66.7%) falling below the poverty line.
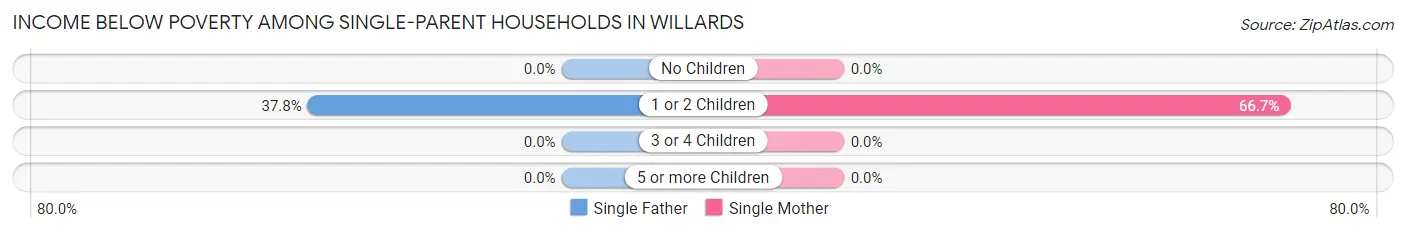
| Children | Single Father | Single Mother |
| No Children | 0 (0.0%) | 0 (0.0%) |
| 1 or 2 Children | 14 (37.8%) | 40 (66.7%) |
| 3 or 4 Children | 0 (0.0%) | 0 (0.0%) |
| 5 or more Children | 0 (0.0%) | 0 (0.0%) |
| Total | 14 (25.0%) | 40 (44.4%) |
Income Below Poverty Among Married-Couple vs Single-Parent Households in Willards
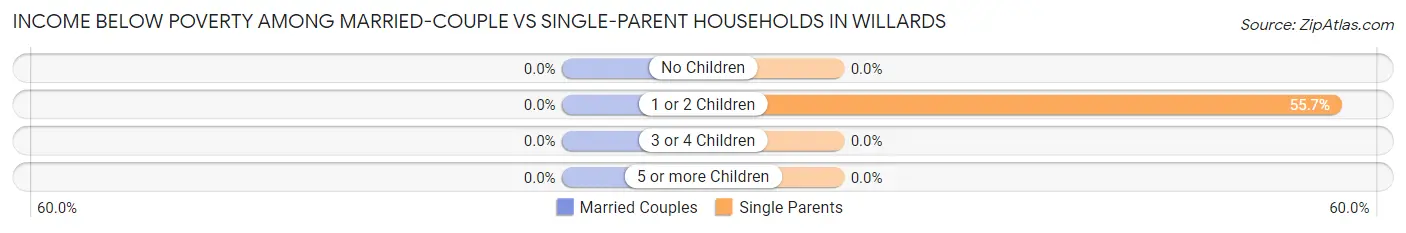
| Children | Married-Couple Families | Single-Parent Households |
| No Children | 0 (0.0%) | 0 (0.0%) |
| 1 or 2 Children | 0 (0.0%) | 54 (55.7%) |
| 3 or 4 Children | 0 (0.0%) | 0 (0.0%) |
| 5 or more Children | 0 (0.0%) | 0 (0.0%) |
| Total | 0 (0.0%) | 54 (37.0%) |
Race in Willards
The most populous races in Willards are White / Caucasian (1,007 | 86.7%), Hispanic or Latino (101 | 8.7%), and Two or more Races (73 | 6.3%).
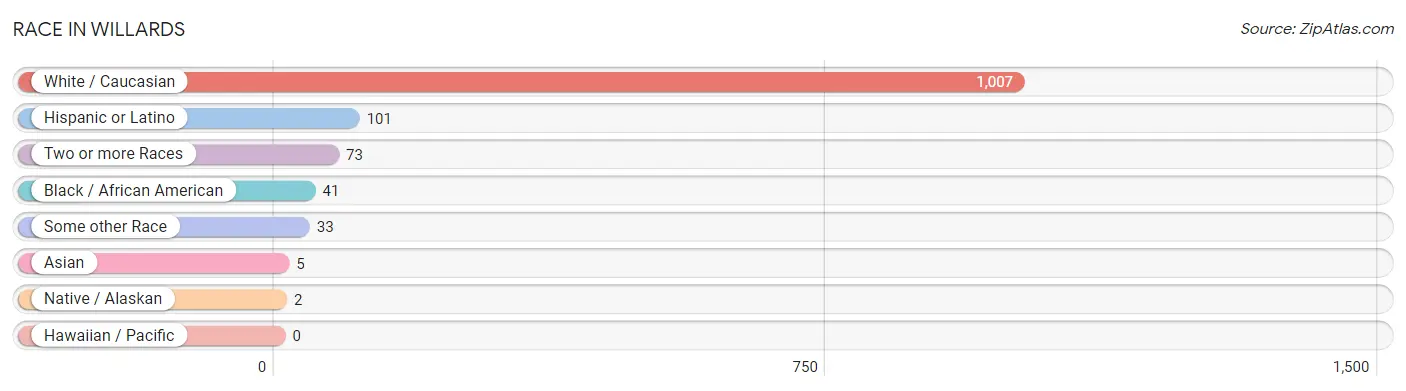
| Race | # Population | % Population |
| Asian | 5 | 0.4% |
| Black / African American | 41 | 3.5% |
| Hawaiian / Pacific | 0 | 0.0% |
| Hispanic or Latino | 101 | 8.7% |
| Native / Alaskan | 2 | 0.2% |
| White / Caucasian | 1,007 | 86.7% |
| Two or more Races | 73 | 6.3% |
| Some other Race | 33 | 2.8% |
| Total | 1,161 | 100.0% |
Ancestry in Willards
The most populous ancestries reported in Willards are Irish (220 | 19.0%), English (179 | 15.4%), German (122 | 10.5%), American (80 | 6.9%), and Arab (72 | 6.2%), together accounting for 58.0% of all Willards residents.
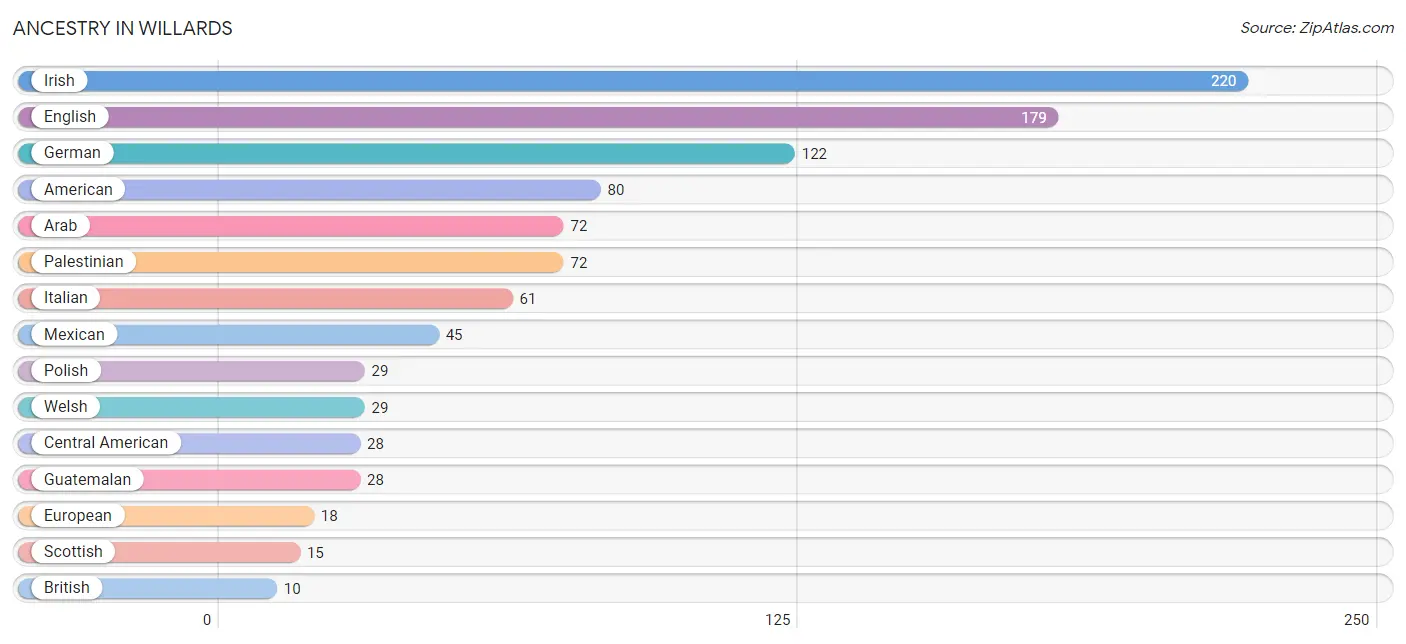
| Ancestry | # Population | % Population |
| African | 4 | 0.3% |
| American | 80 | 6.9% |
| Arab | 72 | 6.2% |
| Bhutanese | 2 | 0.2% |
| British | 10 | 0.9% |
| Central American | 28 | 2.4% |
| Cherokee | 5 | 0.4% |
| Dominican | 4 | 0.3% |
| Dutch | 5 | 0.4% |
| English | 179 | 15.4% |
| European | 18 | 1.5% |
| French | 6 | 0.5% |
| German | 122 | 10.5% |
| Greek | 9 | 0.8% |
| Guatemalan | 28 | 2.4% |
| Irish | 220 | 19.0% |
| Italian | 61 | 5.2% |
| Lithuanian | 3 | 0.3% |
| Malaysian | 7 | 0.6% |
| Mexican | 45 | 3.9% |
| Norwegian | 4 | 0.3% |
| Palestinian | 72 | 6.2% |
| Polish | 29 | 2.5% |
| Portuguese | 6 | 0.5% |
| Romanian | 9 | 0.8% |
| Russian | 5 | 0.4% |
| Scotch-Irish | 3 | 0.3% |
| Scottish | 15 | 1.3% |
| Slavic | 6 | 0.5% |
| Slovak | 5 | 0.4% |
| Subsaharan African | 4 | 0.3% |
| Ukrainian | 2 | 0.2% |
| Welsh | 29 | 2.5% | View All 33 Rows |
Immigrants in Willards
The most numerous immigrant groups reported in Willards came from Asia (48 | 4.1%), Latin America (33 | 2.8%), Central America (29 | 2.5%), Guatemala (16 | 1.4%), and Mexico (13 | 1.1%), together accounting for 12.0% of all Willards residents.
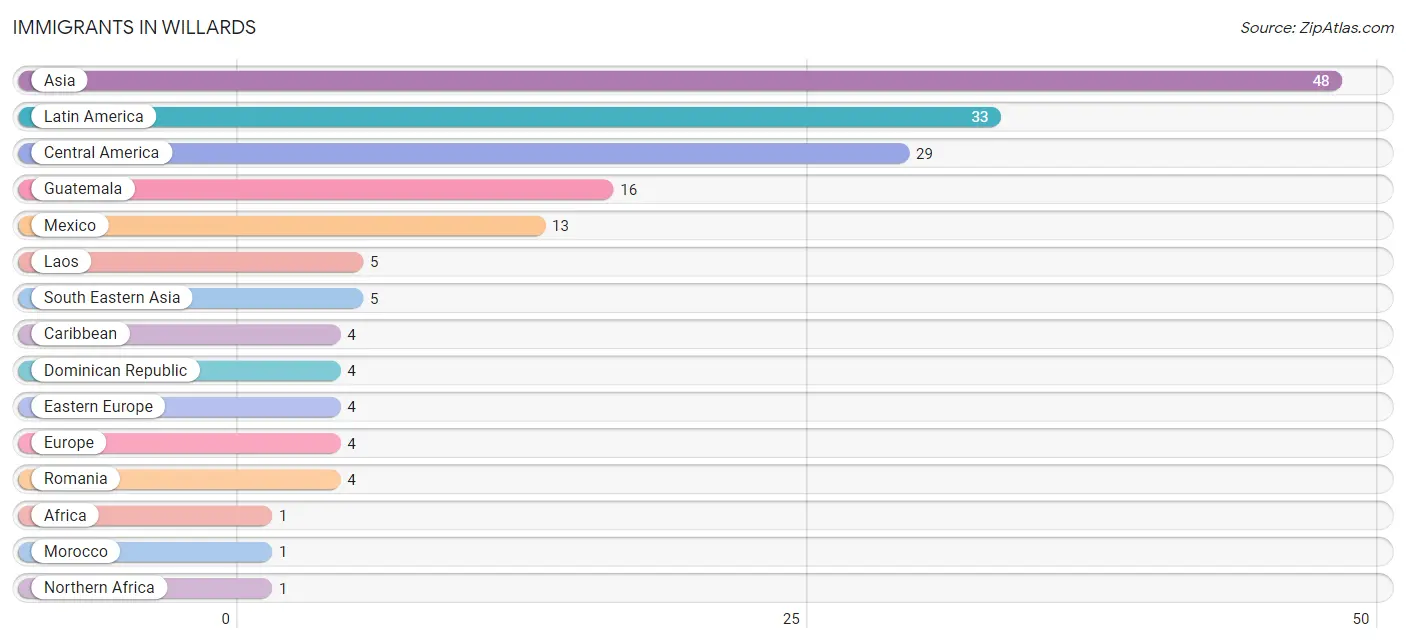
| Immigration Origin | # Population | % Population |
| Africa | 1 | 0.1% |
| Asia | 48 | 4.1% |
| Caribbean | 4 | 0.3% |
| Central America | 29 | 2.5% |
| Dominican Republic | 4 | 0.3% |
| Eastern Europe | 4 | 0.3% |
| Europe | 4 | 0.3% |
| Guatemala | 16 | 1.4% |
| Laos | 5 | 0.4% |
| Latin America | 33 | 2.8% |
| Mexico | 13 | 1.1% |
| Morocco | 1 | 0.1% |
| Northern Africa | 1 | 0.1% |
| Romania | 4 | 0.3% |
| South Eastern Asia | 5 | 0.4% | View All 15 Rows |
Sex and Age in Willards
Sex and Age in Willards
The most populous age groups in Willards are Under 5 Years (85 | 14.4%) for men and 50 to 54 Years (57 | 10.0%) for women.
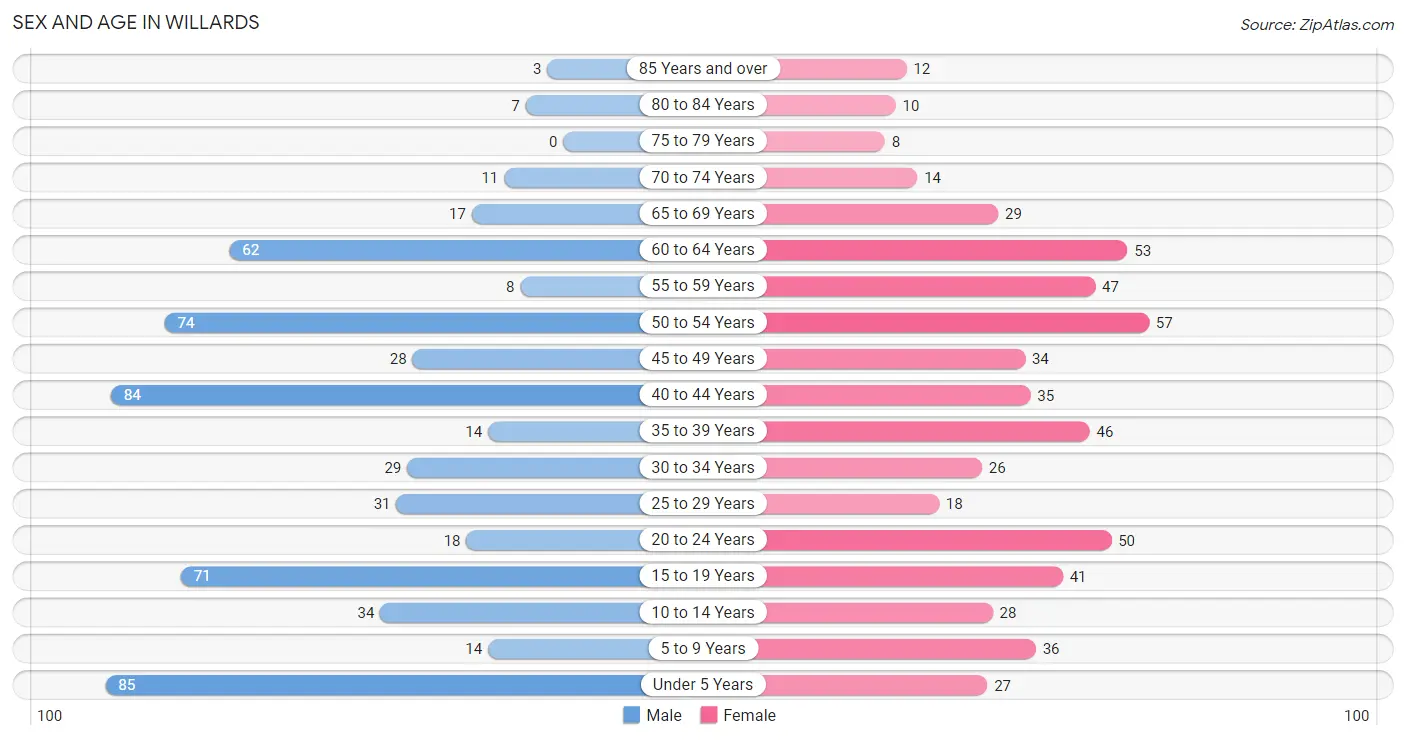
| Age Bracket | Male | Female |
| Under 5 Years | 85 (14.4%) | 27 (4.7%) |
| 5 to 9 Years | 14 (2.4%) | 36 (6.3%) |
| 10 to 14 Years | 34 (5.8%) | 28 (4.9%) |
| 15 to 19 Years | 71 (12.0%) | 41 (7.2%) |
| 20 to 24 Years | 18 (3.0%) | 50 (8.8%) |
| 25 to 29 Years | 31 (5.2%) | 18 (3.2%) |
| 30 to 34 Years | 29 (4.9%) | 26 (4.5%) |
| 35 to 39 Years | 14 (2.4%) | 46 (8.1%) |
| 40 to 44 Years | 84 (14.2%) | 35 (6.1%) |
| 45 to 49 Years | 28 (4.8%) | 34 (5.9%) |
| 50 to 54 Years | 74 (12.5%) | 57 (10.0%) |
| 55 to 59 Years | 8 (1.4%) | 47 (8.2%) |
| 60 to 64 Years | 62 (10.5%) | 53 (9.3%) |
| 65 to 69 Years | 17 (2.9%) | 29 (5.1%) |
| 70 to 74 Years | 11 (1.9%) | 14 (2.5%) |
| 75 to 79 Years | 0 (0.0%) | 8 (1.4%) |
| 80 to 84 Years | 7 (1.2%) | 10 (1.8%) |
| 85 Years and over | 3 (0.5%) | 12 (2.1%) |
| Total | 590 (100.0%) | 571 (100.0%) |
Families and Households in Willards
Median Family Size in Willards
The median family size in Willards is 2.90 persons per family, with married-couple families (176 | 54.7%) accounting for the largest median family size of 3.06 persons per family. On the other hand, single male/father families (56 | 17.4%) represent the smallest median family size with 2.16 persons per family.
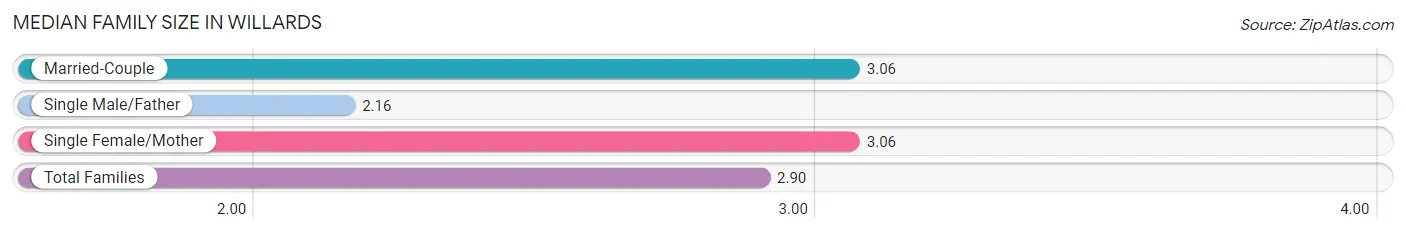
| Family Type | # Families | Family Size |
| Married-Couple | 176 (54.7%) | 3.06 |
| Single Male/Father | 56 (17.4%) | 2.16 |
| Single Female/Mother | 90 (28.0%) | 3.06 |
| Total Families | 322 (100.0%) | 2.90 |
Median Household Size in Willards
The median household size in Willards is 2.57 persons per household, with single female/mother households (90 | 19.9%) accounting for the largest median household size of 3.46 persons per household. non-family households (130 | 28.8%) represent the smallest median household size with 1.22 persons per household.
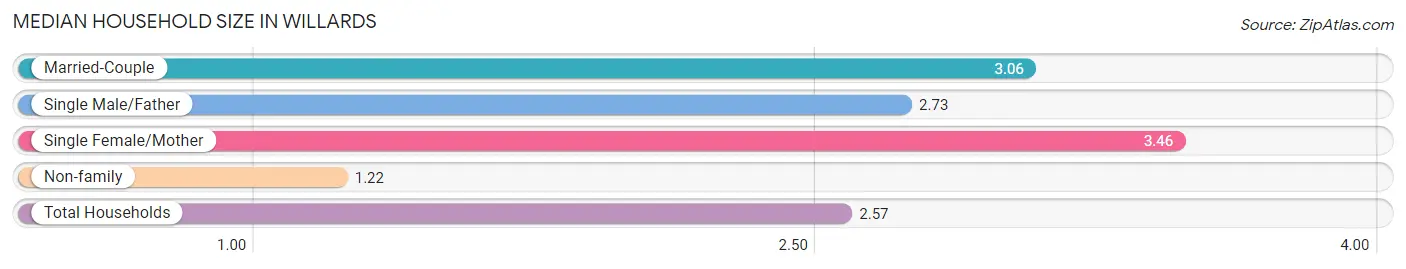
| Household Type | # Households | Household Size |
| Married-Couple | 176 (38.9%) | 3.06 |
| Single Male/Father | 56 (12.4%) | 2.73 |
| Single Female/Mother | 90 (19.9%) | 3.46 |
| Non-family | 130 (28.8%) | 1.22 |
| Total Households | 452 (100.0%) | 2.57 |
Household Size by Marriage Status in Willards
Out of a total of 452 households in Willards, 322 (71.2%) are family households, while 130 (28.8%) are nonfamily households. The most numerous type of family households are 2-person households, comprising 115, and the most common type of nonfamily households are 1-person households, comprising 105.
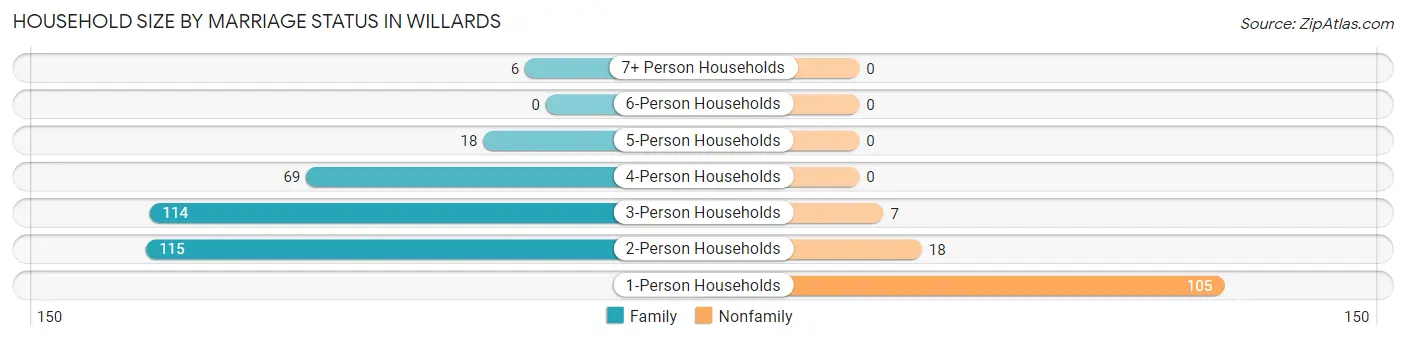
| Household Size | Family Households | Nonfamily Households |
| 1-Person Households | - | 105 (23.2%) |
| 2-Person Households | 115 (25.4%) | 18 (4.0%) |
| 3-Person Households | 114 (25.2%) | 7 (1.5%) |
| 4-Person Households | 69 (15.3%) | 0 (0.0%) |
| 5-Person Households | 18 (4.0%) | 0 (0.0%) |
| 6-Person Households | 0 (0.0%) | 0 (0.0%) |
| 7+ Person Households | 6 (1.3%) | 0 (0.0%) |
| Total | 322 (71.2%) | 130 (28.8%) |
Female Fertility in Willards
Fertility by Age in Willards
Average fertility rate in Willards is 30.0 births per 1,000 women. Women in the age bracket of 20 to 34 years have the highest fertility rate with 53.0 births per 1,000 women. Women in the age bracket of 20 to 34 years acount for 62.5% of all women with births.
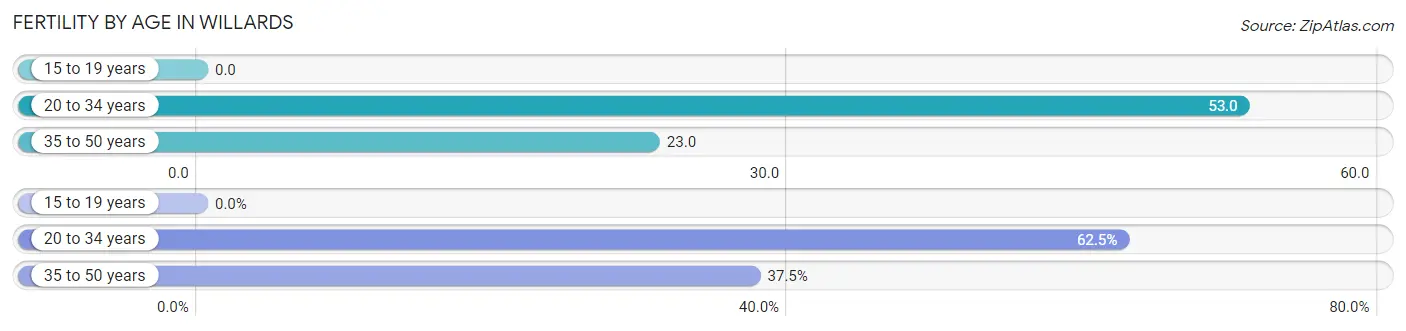
| Age Bracket | Women with Births | Births / 1,000 Women |
| 15 to 19 years | 0 (0.0%) | 0.0 |
| 20 to 34 years | 5 (62.5%) | 53.0 |
| 35 to 50 years | 3 (37.5%) | 23.0 |
| Total | 8 (100.0%) | 30.0 |
Fertility by Age by Marriage Status in Willards
62.5% of women with births (8) in Willards are married. The highest percentage of unmarried women with births falls into 20 to 34 years age bracket with 60.0% of them unmarried at the time of birth, while the lowest percentage of unmarried women with births belong to 35 to 50 years age bracket with 0.0% of them unmarried.
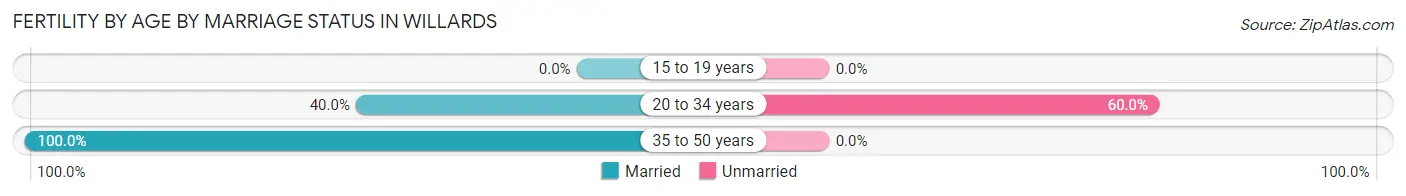
| Age Bracket | Married | Unmarried |
| 15 to 19 years | 0 (0.0%) | 0 (0.0%) |
| 20 to 34 years | 2 (40.0%) | 3 (60.0%) |
| 35 to 50 years | 3 (100.0%) | 0 (0.0%) |
| Total | 5 (62.5%) | 3 (37.5%) |
Fertility by Education in Willards
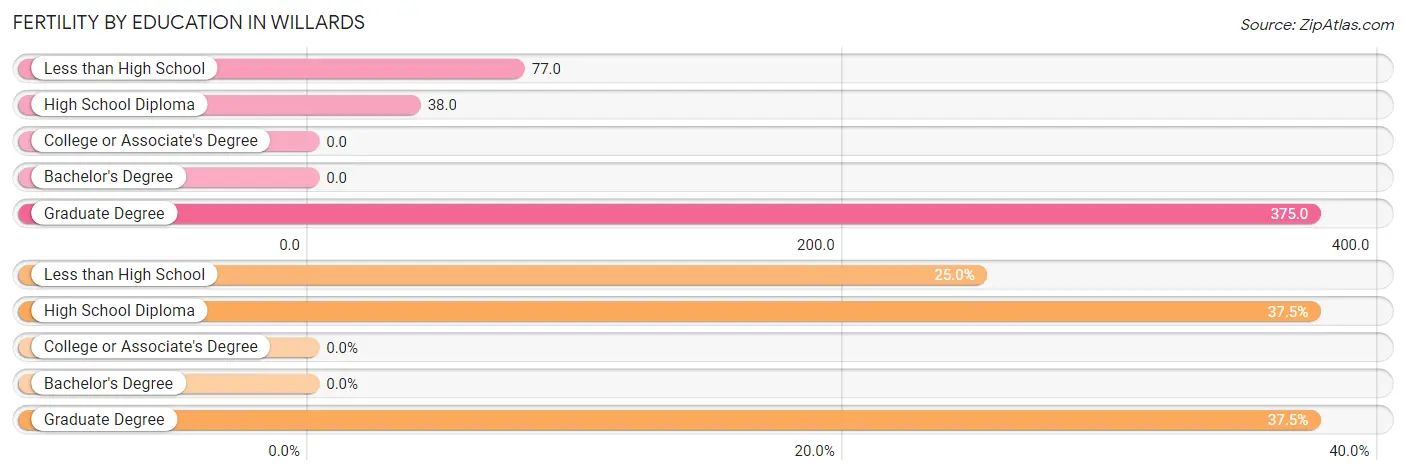
| Educational Attainment | Women with Births | Births / 1,000 Women |
| Less than High School | 2 (25.0%) | 77.0 |
| High School Diploma | 3 (37.5%) | 38.0 |
| College or Associate's Degree | 0 (0.0%) | 0.0 |
| Bachelor's Degree | 0 (0.0%) | 0.0 |
| Graduate Degree | 3 (37.5%) | 375.0 |
| Total | 8 (100.0%) | 30.0 |
Fertility by Education by Marriage Status in Willards
37.5% of women with births in Willards are unmarried. Women with the educational attainment of less than high school are most likely to be married with 100.0% of them married at childbirth, while women with the educational attainment of high school diploma are least likely to be married with 100.0% of them unmarried at childbirth.
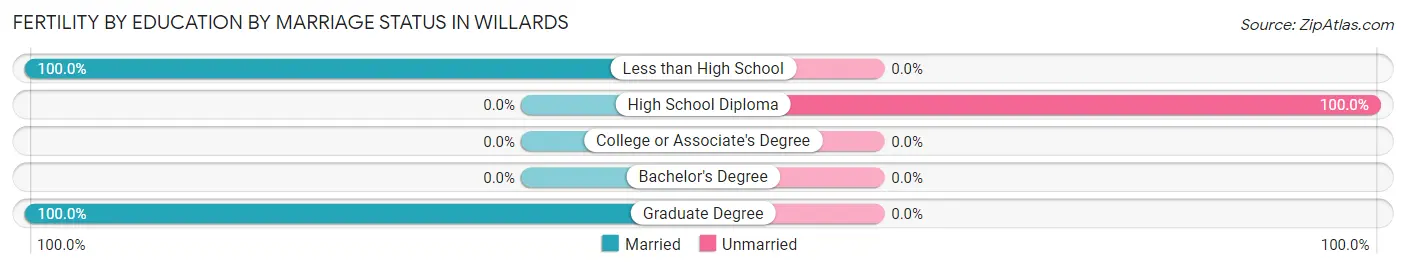
| Educational Attainment | Married | Unmarried |
| Less than High School | 2 (100.0%) | 0 (0.0%) |
| High School Diploma | 0 (0.0%) | 3 (100.0%) |
| College or Associate's Degree | 0 (0.0%) | 0 (0.0%) |
| Bachelor's Degree | 0 (0.0%) | 0 (0.0%) |
| Graduate Degree | 3 (100.0%) | 0 (0.0%) |
| Total | 5 (62.5%) | 3 (37.5%) |
Employment Characteristics in Willards
Employment by Class of Employer in Willards
Among the 565 employed individuals in Willards, private company employees (397 | 70.3%), local government employees (57 | 10.1%), and not-for-profit organizations (35 | 6.2%) make up the most common classes of employment.
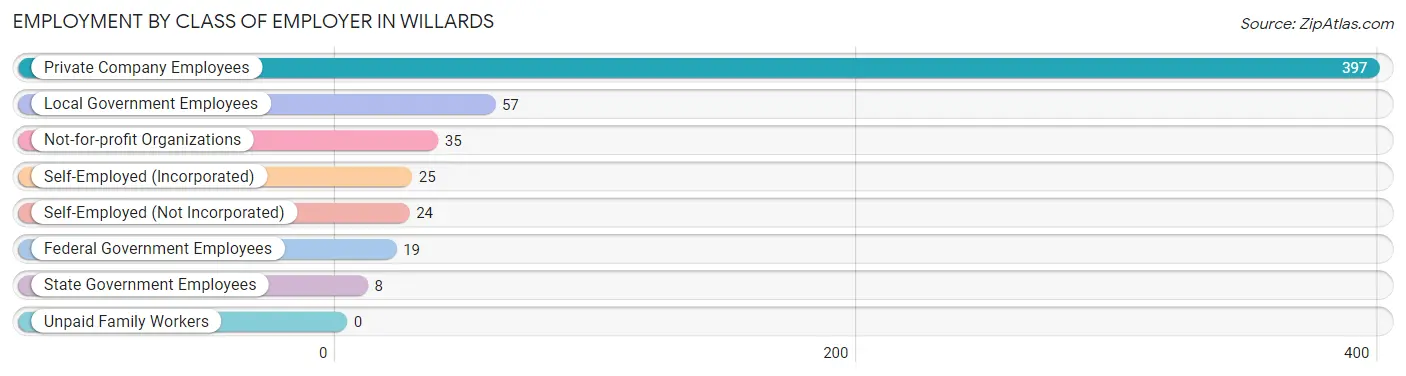
| Employer Class | # Employees | % Employees |
| Private Company Employees | 397 | 70.3% |
| Self-Employed (Incorporated) | 25 | 4.4% |
| Self-Employed (Not Incorporated) | 24 | 4.3% |
| Not-for-profit Organizations | 35 | 6.2% |
| Local Government Employees | 57 | 10.1% |
| State Government Employees | 8 | 1.4% |
| Federal Government Employees | 19 | 3.4% |
| Unpaid Family Workers | 0 | 0.0% |
| Total | 565 | 100.0% |
Employment Status by Age in Willards
According to the labor force statistics for Willards, out of the total population over 16 years of age (887), 74.5% or 661 individuals are in the labor force, with 12.6% or 83 of them unemployed. The age group with the highest labor force participation rate is 25 to 29 years, with 100.0% or 49 individuals in the labor force. Within the labor force, the 20 to 24 years age range has the highest percentage of unemployed individuals, with 35.1% or 20 of them being unemployed.
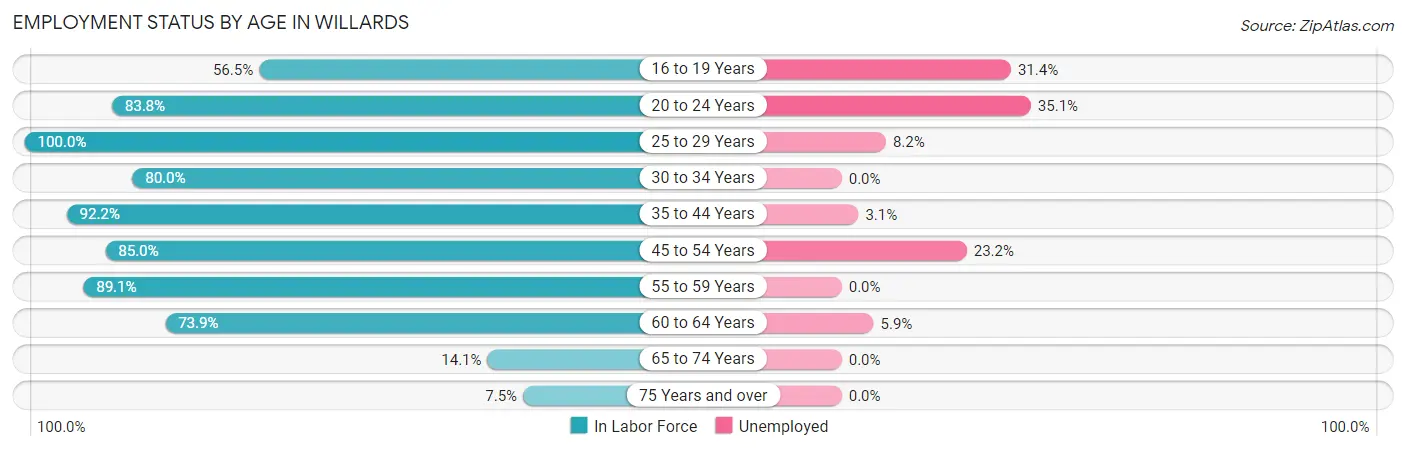
| Age Bracket | In Labor Force | Unemployed |
| 16 to 19 Years | 35 (56.5%) | 11 (31.4%) |
| 20 to 24 Years | 57 (83.8%) | 20 (35.1%) |
| 25 to 29 Years | 49 (100.0%) | 4 (8.2%) |
| 30 to 34 Years | 44 (80.0%) | 0 (0.0%) |
| 35 to 44 Years | 165 (92.2%) | 5 (3.1%) |
| 45 to 54 Years | 164 (85.0%) | 38 (23.2%) |
| 55 to 59 Years | 49 (89.1%) | 0 (0.0%) |
| 60 to 64 Years | 85 (73.9%) | 5 (5.9%) |
| 65 to 74 Years | 10 (14.1%) | 0 (0.0%) |
| 75 Years and over | 3 (7.5%) | 0 (0.0%) |
| Total | 661 (74.5%) | 83 (12.6%) |
Employment Status by Educational Attainment in Willards
According to labor force statistics for Willards, 86.1% of individuals (556) out of the total population between 25 and 64 years of age (646) are in the labor force, with 9.4% or 52 of them being unemployed. The group with the highest labor force participation rate are those with the educational attainment of college / associate degree, with 90.4% or 208 individuals in the labor force. Within the labor force, individuals with bachelor's degree or higher education have the highest percentage of unemployment, with 27.4% or 26 of them being unemployed.
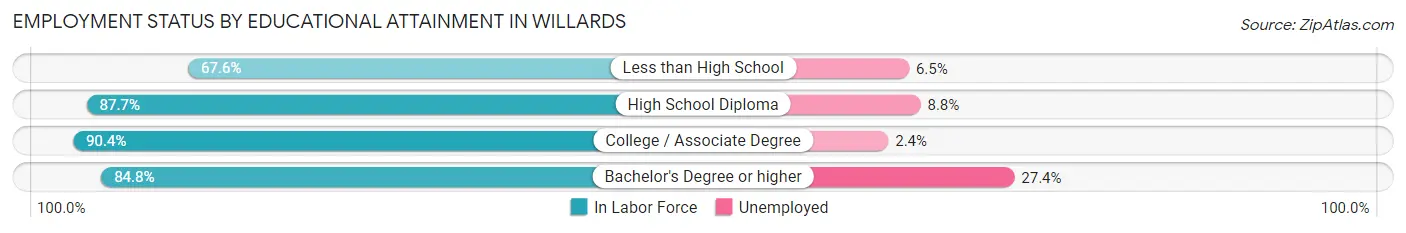
| Educational Attainment | In Labor Force | Unemployed |
| Less than High School | 46 (67.6%) | 4 (6.5%) |
| High School Diploma | 207 (87.7%) | 21 (8.8%) |
| College / Associate Degree | 208 (90.4%) | 6 (2.4%) |
| Bachelor's Degree or higher | 95 (84.8%) | 31 (27.4%) |
| Total | 556 (86.1%) | 61 (9.4%) |
Employment Occupations by Sex in Willards
Management, Business, Science and Arts Occupations
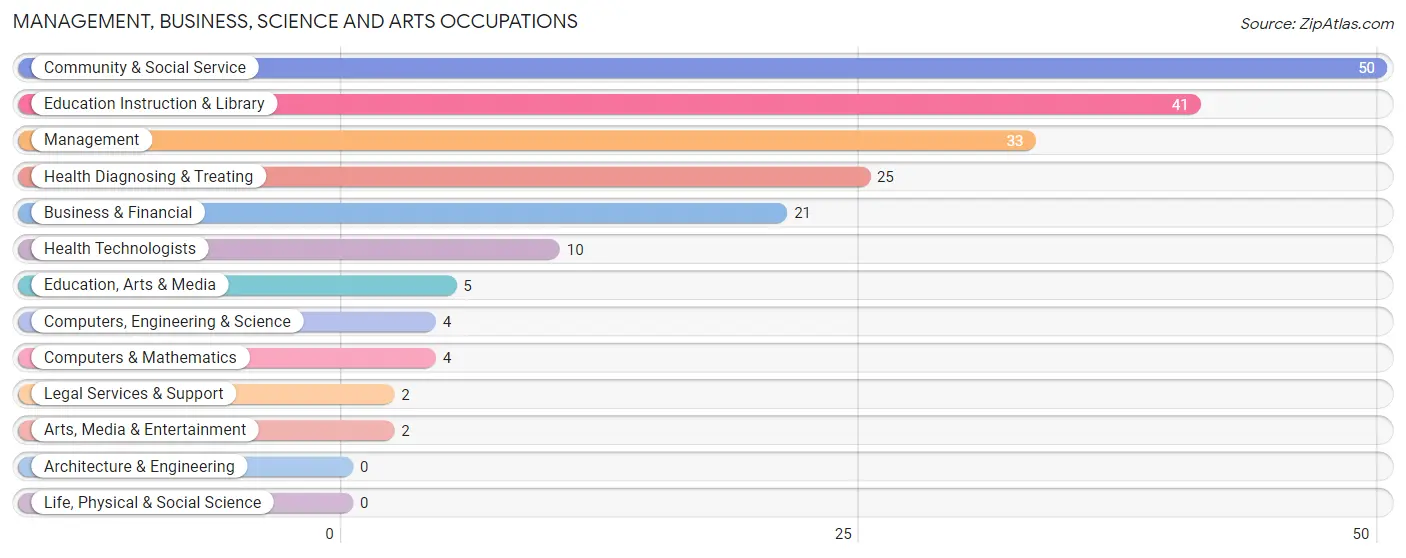
The most common Management, Business, Science and Arts occupations in Willards are Community & Social Service (50 | 8.7%), Education Instruction & Library (41 | 7.1%), Management (33 | 5.7%), Health Diagnosing & Treating (25 | 4.3%), and Business & Financial (21 | 3.6%).
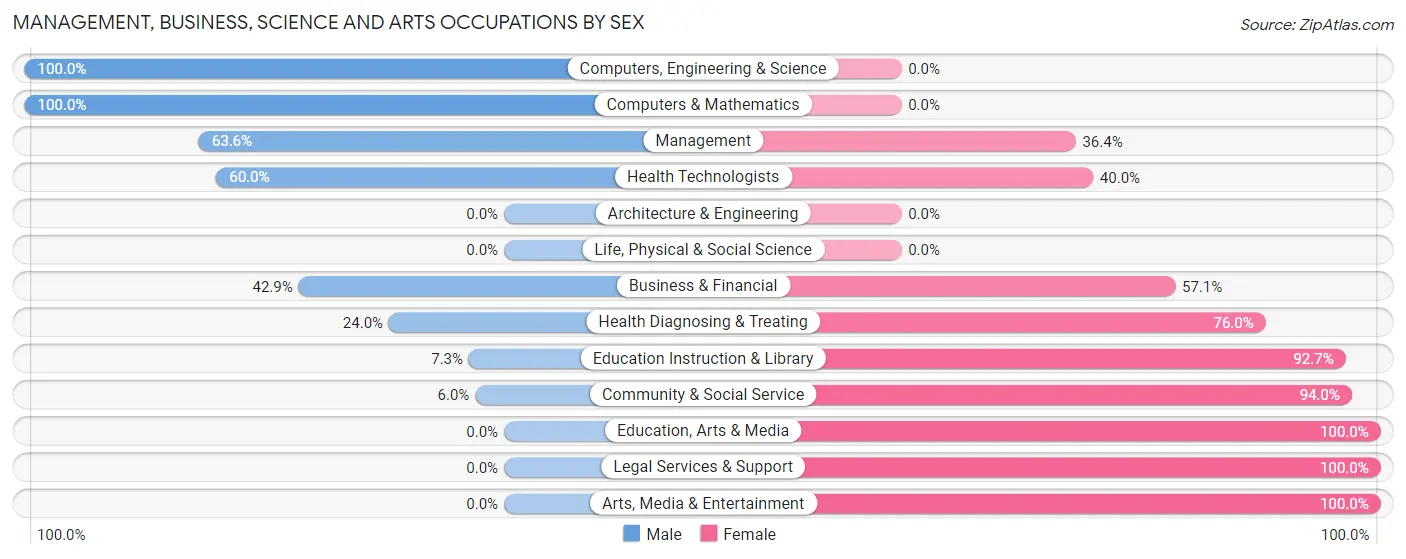
Management, Business, Science and Arts Occupations by Sex
Within the Management, Business, Science and Arts occupations in Willards, the most male-oriented occupations are Computers, Engineering & Science (100.0%), Computers & Mathematics (100.0%), and Management (63.6%), while the most female-oriented occupations are Education, Arts & Media (100.0%), Legal Services & Support (100.0%), and Arts, Media & Entertainment (100.0%).
| Occupation | Male | Female |
| Management | 21 (63.6%) | 12 (36.4%) |
| Business & Financial | 9 (42.9%) | 12 (57.1%) |
| Computers, Engineering & Science | 4 (100.0%) | 0 (0.0%) |
| Computers & Mathematics | 4 (100.0%) | 0 (0.0%) |
| Architecture & Engineering | 0 (0.0%) | 0 (0.0%) |
| Life, Physical & Social Science | 0 (0.0%) | 0 (0.0%) |
| Community & Social Service | 3 (6.0%) | 47 (94.0%) |
| Education, Arts & Media | 0 (0.0%) | 5 (100.0%) |
| Legal Services & Support | 0 (0.0%) | 2 (100.0%) |
| Education Instruction & Library | 3 (7.3%) | 38 (92.7%) |
| Arts, Media & Entertainment | 0 (0.0%) | 2 (100.0%) |
| Health Diagnosing & Treating | 6 (24.0%) | 19 (76.0%) |
| Health Technologists | 6 (60.0%) | 4 (40.0%) |
| Total (Category) | 43 (32.3%) | 90 (67.7%) |
| Total (Overall) | 292 (50.7%) | 284 (49.3%) |
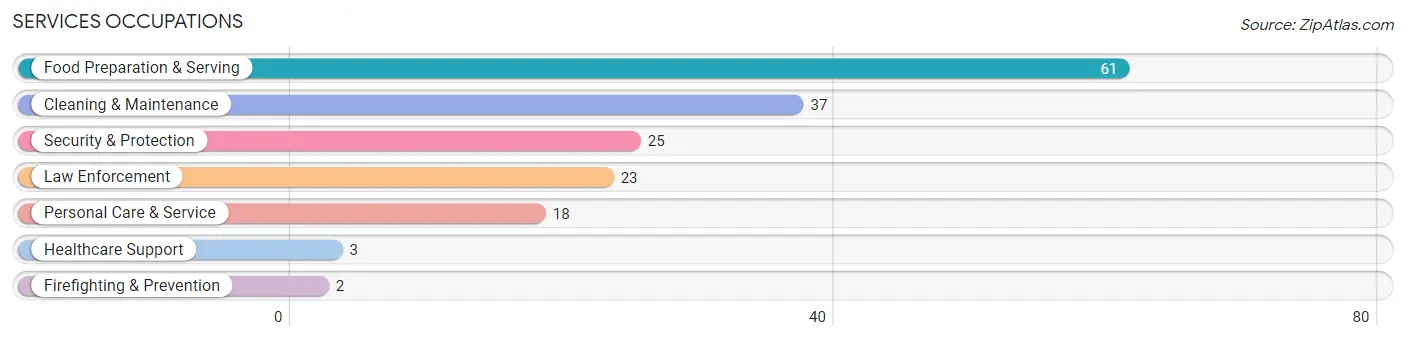
Services Occupations
The most common Services occupations in Willards are Food Preparation & Serving (61 | 10.6%), Cleaning & Maintenance (37 | 6.4%), Security & Protection (25 | 4.3%), Law Enforcement (23 | 4.0%), and Personal Care & Service (18 | 3.1%).
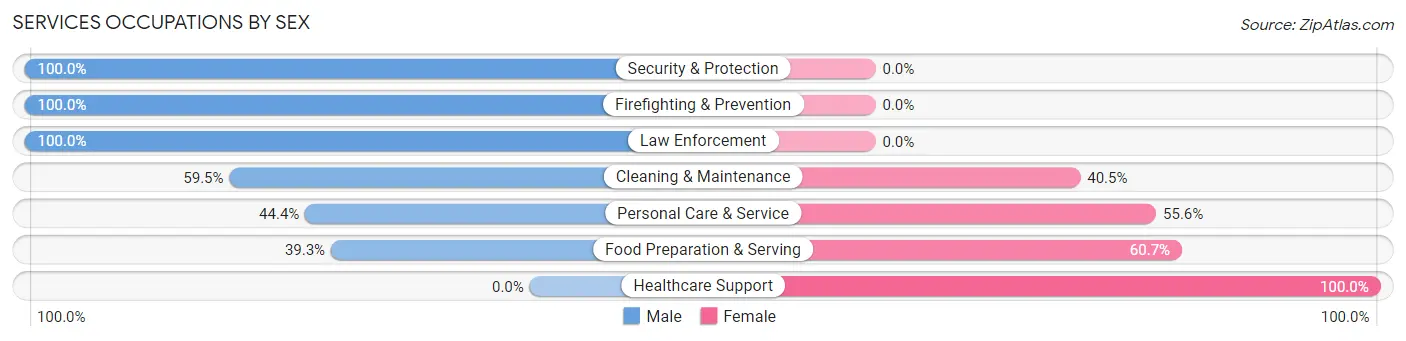
Services Occupations by Sex
Within the Services occupations in Willards, the most male-oriented occupations are Security & Protection (100.0%), Firefighting & Prevention (100.0%), and Law Enforcement (100.0%), while the most female-oriented occupations are Healthcare Support (100.0%), Food Preparation & Serving (60.7%), and Personal Care & Service (55.6%).
| Occupation | Male | Female |
| Healthcare Support | 0 (0.0%) | 3 (100.0%) |
| Security & Protection | 25 (100.0%) | 0 (0.0%) |
| Firefighting & Prevention | 2 (100.0%) | 0 (0.0%) |
| Law Enforcement | 23 (100.0%) | 0 (0.0%) |
| Food Preparation & Serving | 24 (39.3%) | 37 (60.7%) |
| Cleaning & Maintenance | 22 (59.5%) | 15 (40.5%) |
| Personal Care & Service | 8 (44.4%) | 10 (55.6%) |
| Total (Category) | 79 (54.9%) | 65 (45.1%) |
| Total (Overall) | 292 (50.7%) | 284 (49.3%) |
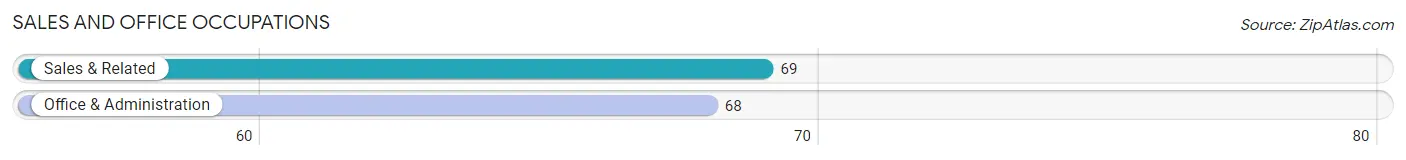
Sales and Office Occupations
The most common Sales and Office occupations in Willards are Sales & Related (69 | 12.0%), and Office & Administration (68 | 11.8%).
Sales and Office Occupations by Sex
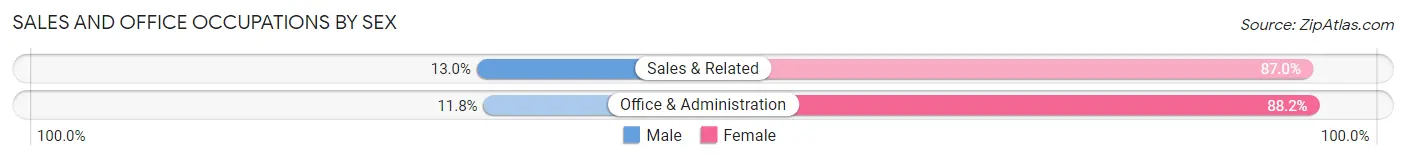
| Occupation | Male | Female |
| Sales & Related | 9 (13.0%) | 60 (87.0%) |
| Office & Administration | 8 (11.8%) | 60 (88.2%) |
| Total (Category) | 17 (12.4%) | 120 (87.6%) |
| Total (Overall) | 292 (50.7%) | 284 (49.3%) |
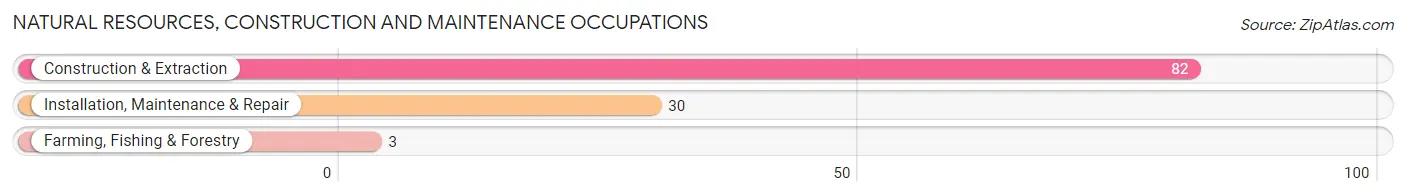
Natural Resources, Construction and Maintenance Occupations
The most common Natural Resources, Construction and Maintenance occupations in Willards are Construction & Extraction (82 | 14.2%), Installation, Maintenance & Repair (30 | 5.2%), and Farming, Fishing & Forestry (3 | 0.5%).
Natural Resources, Construction and Maintenance Occupations by Sex
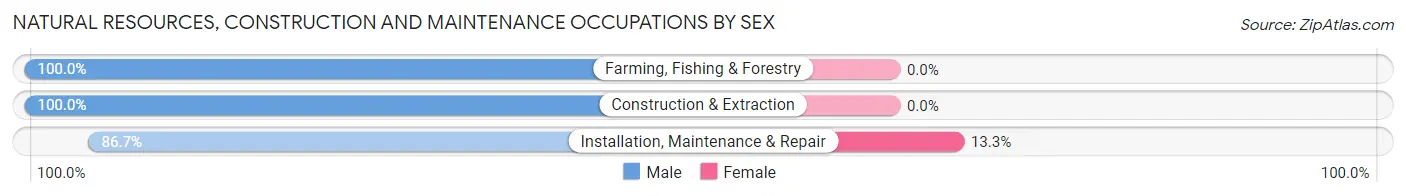
| Occupation | Male | Female |
| Farming, Fishing & Forestry | 3 (100.0%) | 0 (0.0%) |
| Construction & Extraction | 82 (100.0%) | 0 (0.0%) |
| Installation, Maintenance & Repair | 26 (86.7%) | 4 (13.3%) |
| Total (Category) | 111 (96.5%) | 4 (3.5%) |
| Total (Overall) | 292 (50.7%) | 284 (49.3%) |
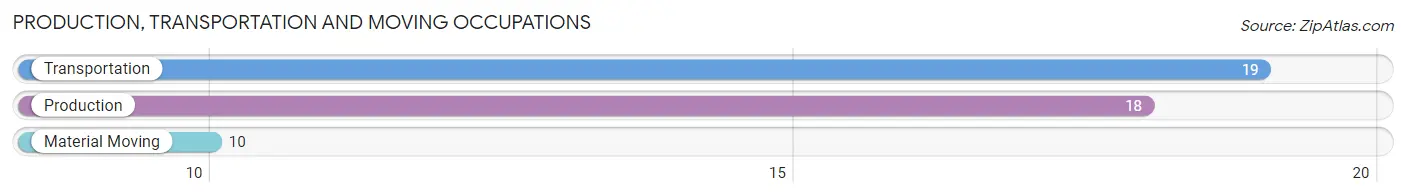
Production, Transportation and Moving Occupations
The most common Production, Transportation and Moving occupations in Willards are Transportation (19 | 3.3%), Production (18 | 3.1%), and Material Moving (10 | 1.7%).
Production, Transportation and Moving Occupations by Sex
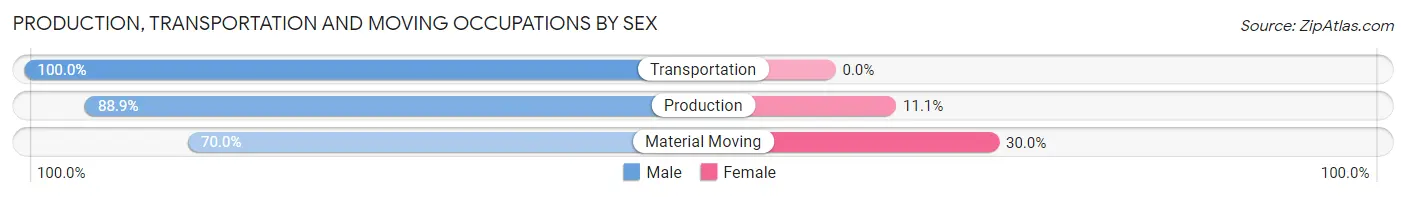
| Occupation | Male | Female |
| Production | 16 (88.9%) | 2 (11.1%) |
| Transportation | 19 (100.0%) | 0 (0.0%) |
| Material Moving | 7 (70.0%) | 3 (30.0%) |
| Total (Category) | 42 (89.4%) | 5 (10.6%) |
| Total (Overall) | 292 (50.7%) | 284 (49.3%) |
Employment Industries by Sex in Willards
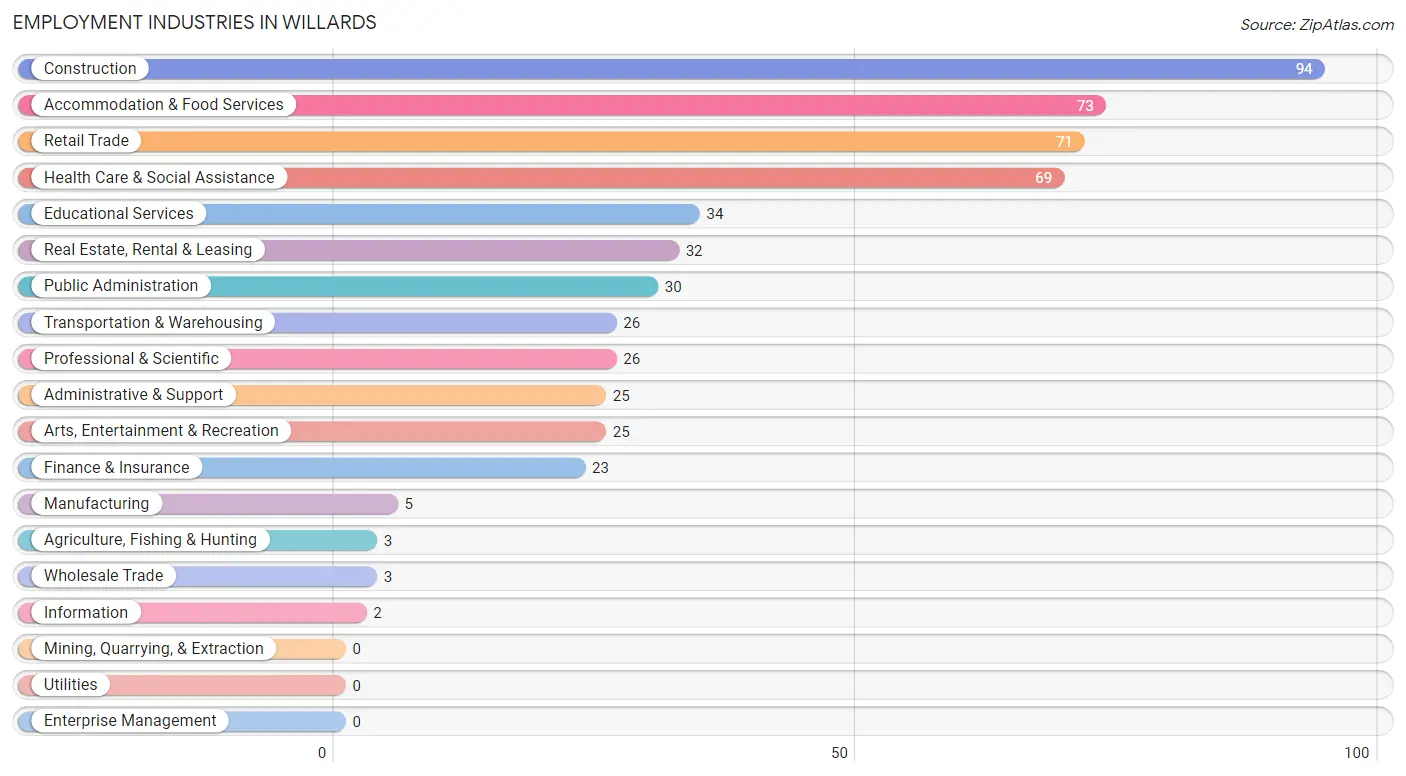
Employment Industries in Willards
The major employment industries in Willards include Construction (94 | 16.3%), Accommodation & Food Services (73 | 12.7%), Retail Trade (71 | 12.3%), Health Care & Social Assistance (69 | 12.0%), and Educational Services (34 | 5.9%).
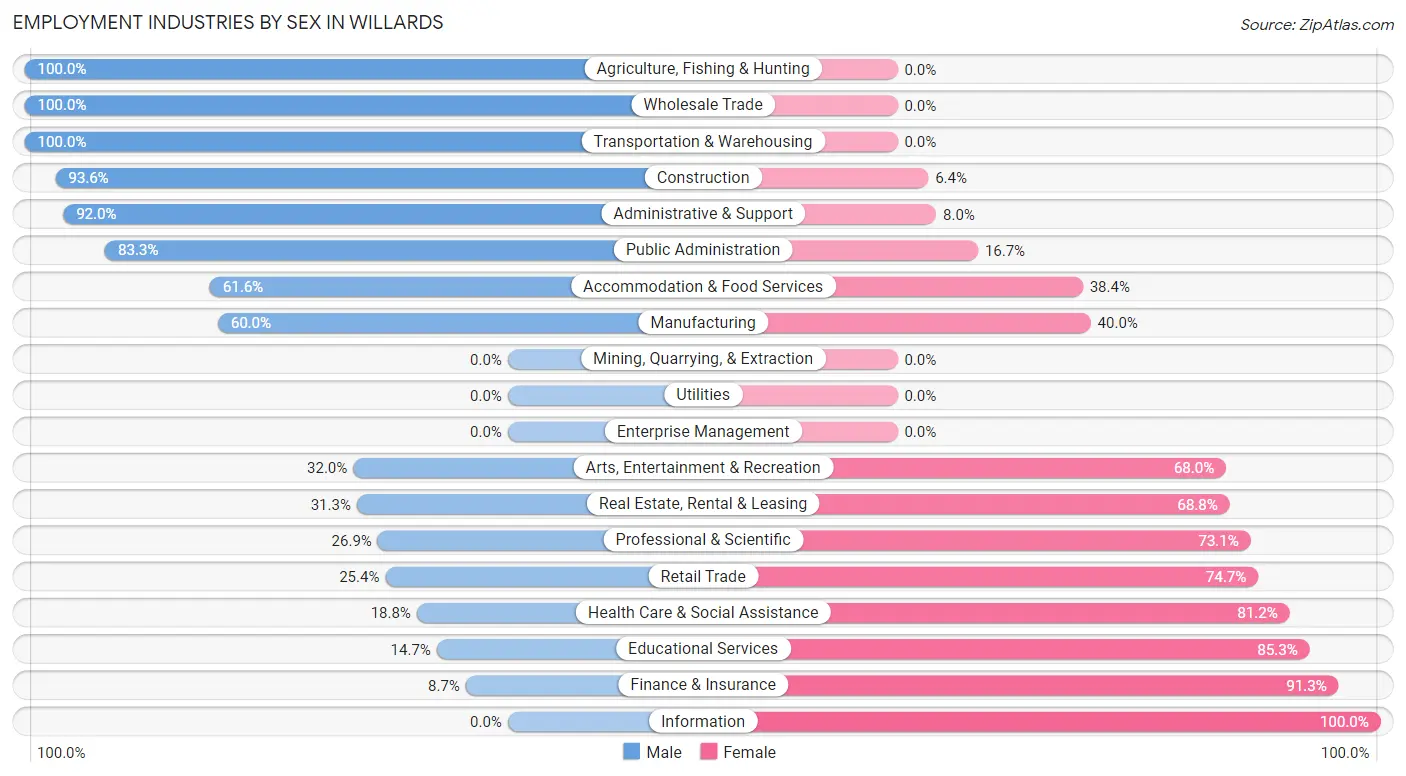
Employment Industries by Sex in Willards
The Willards industries that see more men than women are Agriculture, Fishing & Hunting (100.0%), Wholesale Trade (100.0%), and Transportation & Warehousing (100.0%), whereas the industries that tend to have a higher number of women are Information (100.0%), Finance & Insurance (91.3%), and Educational Services (85.3%).
| Industry | Male | Female |
| Agriculture, Fishing & Hunting | 3 (100.0%) | 0 (0.0%) |
| Mining, Quarrying, & Extraction | 0 (0.0%) | 0 (0.0%) |
| Construction | 88 (93.6%) | 6 (6.4%) |
| Manufacturing | 3 (60.0%) | 2 (40.0%) |
| Wholesale Trade | 3 (100.0%) | 0 (0.0%) |
| Retail Trade | 18 (25.4%) | 53 (74.7%) |
| Transportation & Warehousing | 26 (100.0%) | 0 (0.0%) |
| Utilities | 0 (0.0%) | 0 (0.0%) |
| Information | 0 (0.0%) | 2 (100.0%) |
| Finance & Insurance | 2 (8.7%) | 21 (91.3%) |
| Real Estate, Rental & Leasing | 10 (31.2%) | 22 (68.8%) |
| Professional & Scientific | 7 (26.9%) | 19 (73.1%) |
| Enterprise Management | 0 (0.0%) | 0 (0.0%) |
| Administrative & Support | 23 (92.0%) | 2 (8.0%) |
| Educational Services | 5 (14.7%) | 29 (85.3%) |
| Health Care & Social Assistance | 13 (18.8%) | 56 (81.2%) |
| Arts, Entertainment & Recreation | 8 (32.0%) | 17 (68.0%) |
| Accommodation & Food Services | 45 (61.6%) | 28 (38.4%) |
| Public Administration | 25 (83.3%) | 5 (16.7%) |
| Total | 292 (50.7%) | 284 (49.3%) |
Education in Willards
School Enrollment in Willards
The most common levels of schooling among the 266 students in Willards are high school (76 | 28.6%), college / undergraduate (73 | 27.4%), and middle school (52 | 19.6%).
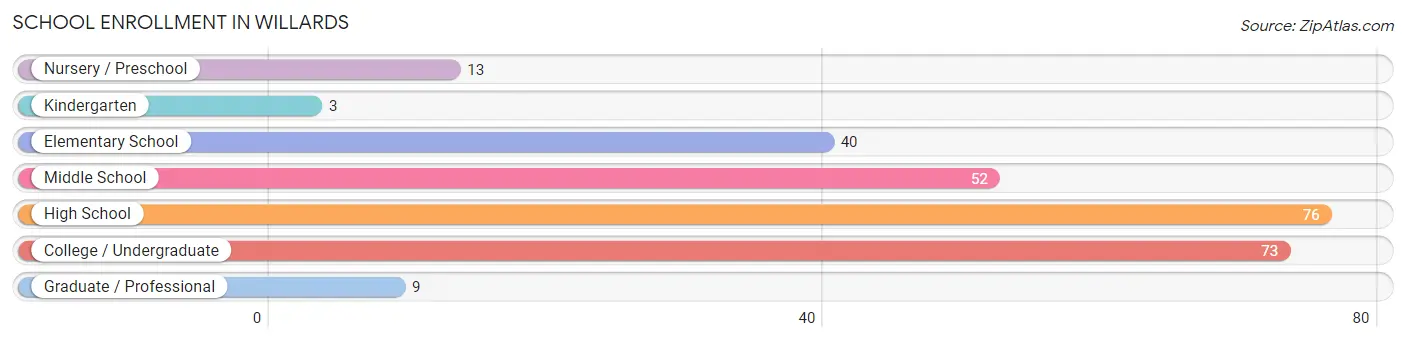
| School Level | # Students | % Students |
| Nursery / Preschool | 13 | 4.9% |
| Kindergarten | 3 | 1.1% |
| Elementary School | 40 | 15.0% |
| Middle School | 52 | 19.6% |
| High School | 76 | 28.6% |
| College / Undergraduate | 73 | 27.4% |
| Graduate / Professional | 9 | 3.4% |
| Total | 266 | 100.0% |
School Enrollment by Age by Funding Source in Willards
Out of a total of 266 students who are enrolled in schools in Willards, 26 (9.8%) attend a private institution, while the remaining 240 (90.2%) are enrolled in public schools. The age group of 10 to 14 year olds has the highest likelihood of being enrolled in private schools, with 18 (29.0% in the age bracket) enrolled. Conversely, the age group of 3 to 4 year olds has the lowest likelihood of being enrolled in a private school, with 13 (100.0% in the age bracket) attending a public institution.
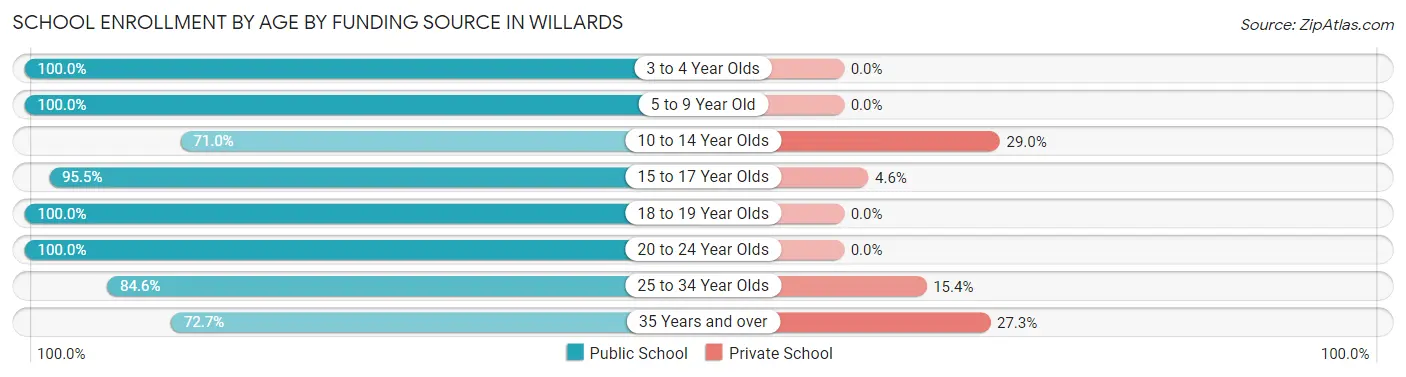
| Age Bracket | Public School | Private School |
| 3 to 4 Year Olds | 13 (100.0%) | 0 (0.0%) |
| 5 to 9 Year Old | 43 (100.0%) | 0 (0.0%) |
| 10 to 14 Year Olds | 44 (71.0%) | 18 (29.0%) |
| 15 to 17 Year Olds | 63 (95.5%) | 3 (4.5%) |
| 18 to 19 Year Olds | 31 (100.0%) | 0 (0.0%) |
| 20 to 24 Year Olds | 27 (100.0%) | 0 (0.0%) |
| 25 to 34 Year Olds | 11 (84.6%) | 2 (15.4%) |
| 35 Years and over | 8 (72.7%) | 3 (27.3%) |
| Total | 240 (90.2%) | 26 (9.8%) |
Educational Attainment by Field of Study in Willards
Education (39 | 31.7%), business (17 | 13.8%), bio, nature & agricultural (15 | 12.2%), arts & humanities (15 | 12.2%), and science & technology (8 | 6.5%) are the most common fields of study among 123 individuals in Willards who have obtained a bachelor's degree or higher.
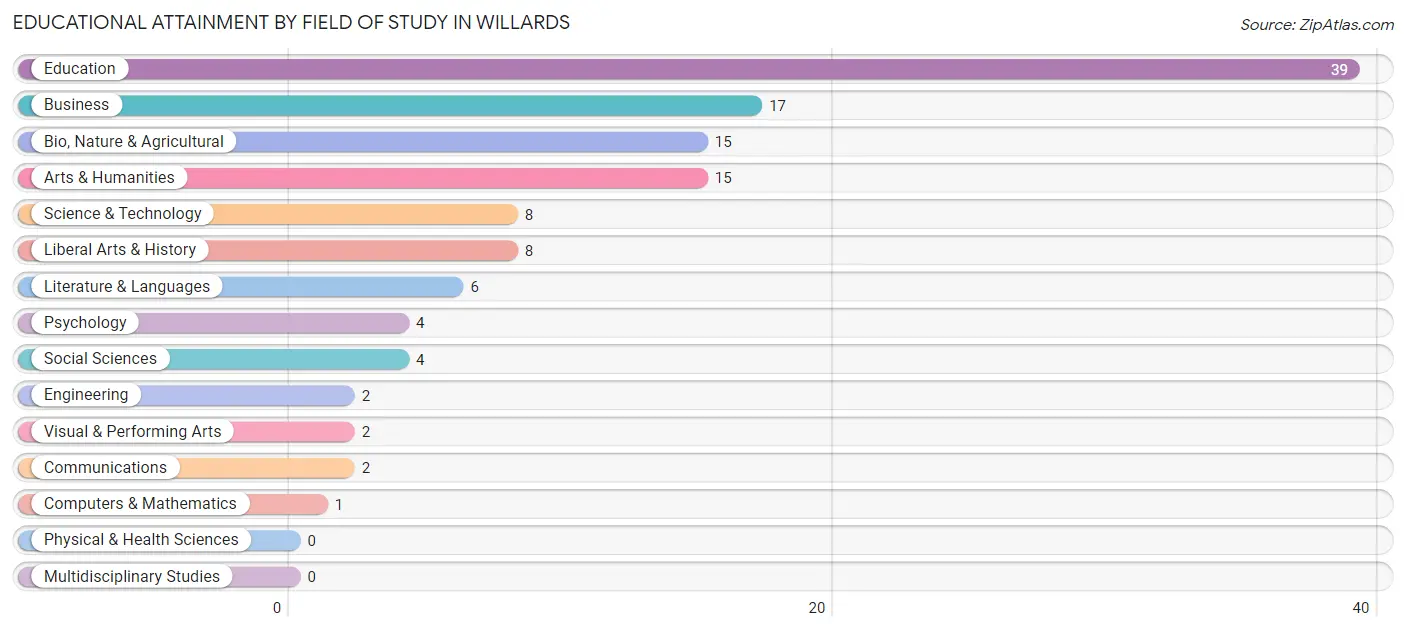
| Field of Study | # Graduates | % Graduates |
| Computers & Mathematics | 1 | 0.8% |
| Bio, Nature & Agricultural | 15 | 12.2% |
| Physical & Health Sciences | 0 | 0.0% |
| Psychology | 4 | 3.3% |
| Social Sciences | 4 | 3.3% |
| Engineering | 2 | 1.6% |
| Multidisciplinary Studies | 0 | 0.0% |
| Science & Technology | 8 | 6.5% |
| Business | 17 | 13.8% |
| Education | 39 | 31.7% |
| Literature & Languages | 6 | 4.9% |
| Liberal Arts & History | 8 | 6.5% |
| Visual & Performing Arts | 2 | 1.6% |
| Communications | 2 | 1.6% |
| Arts & Humanities | 15 | 12.2% |
| Total | 123 | 100.0% |
Transportation & Commute in Willards
Vehicle Availability by Sex in Willards
The most prevalent vehicle ownership categories in Willards are males with 2 vehicles (106, accounting for 36.5%) and females with 2 vehicles (87, making up 38.6%).
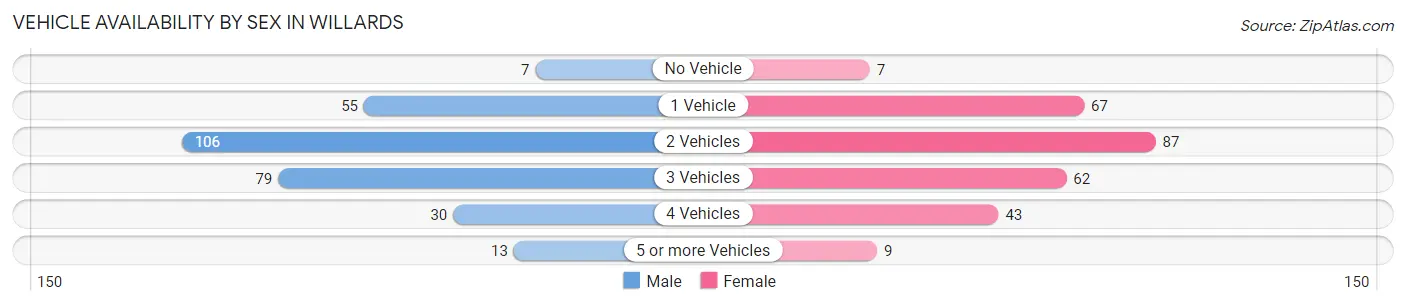
| Vehicles Available | Male | Female |
| No Vehicle | 7 (2.4%) | 7 (2.5%) |
| 1 Vehicle | 55 (19.0%) | 67 (24.4%) |
| 2 Vehicles | 106 (36.5%) | 87 (31.6%) |
| 3 Vehicles | 79 (27.2%) | 62 (22.6%) |
| 4 Vehicles | 30 (10.3%) | 43 (15.6%) |
| 5 or more Vehicles | 13 (4.5%) | 9 (3.3%) |
| Total | 290 (100.0%) | 275 (100.0%) |
Commute Time in Willards
The most frequently occuring commute durations in Willards are 25 to 29 minutes (116 commuters, 21.4%), 30 to 34 minutes (112 commuters, 20.7%), and 20 to 24 minutes (73 commuters, 13.5%).
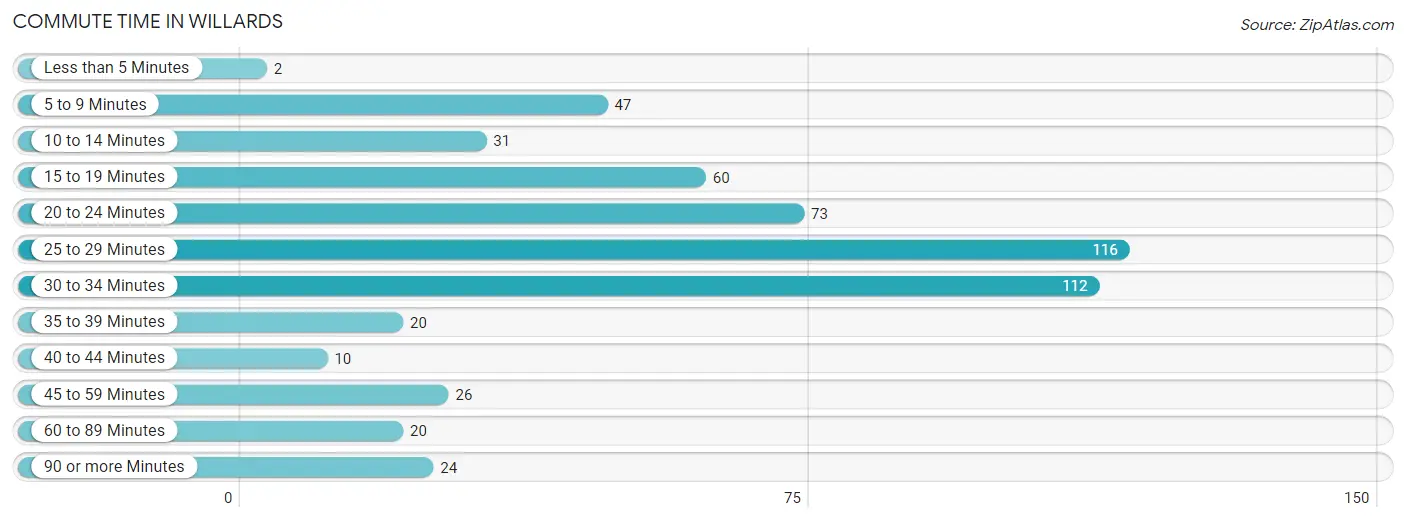
| Commute Time | # Commuters | % Commuters |
| Less than 5 Minutes | 2 | 0.4% |
| 5 to 9 Minutes | 47 | 8.7% |
| 10 to 14 Minutes | 31 | 5.7% |
| 15 to 19 Minutes | 60 | 11.1% |
| 20 to 24 Minutes | 73 | 13.5% |
| 25 to 29 Minutes | 116 | 21.4% |
| 30 to 34 Minutes | 112 | 20.7% |
| 35 to 39 Minutes | 20 | 3.7% |
| 40 to 44 Minutes | 10 | 1.8% |
| 45 to 59 Minutes | 26 | 4.8% |
| 60 to 89 Minutes | 20 | 3.7% |
| 90 or more Minutes | 24 | 4.4% |
Commute Time by Sex in Willards
The most common commute times in Willards are 30 to 34 minutes (62 commuters, 21.9%) for males and 25 to 29 minutes (72 commuters, 27.9%) for females.
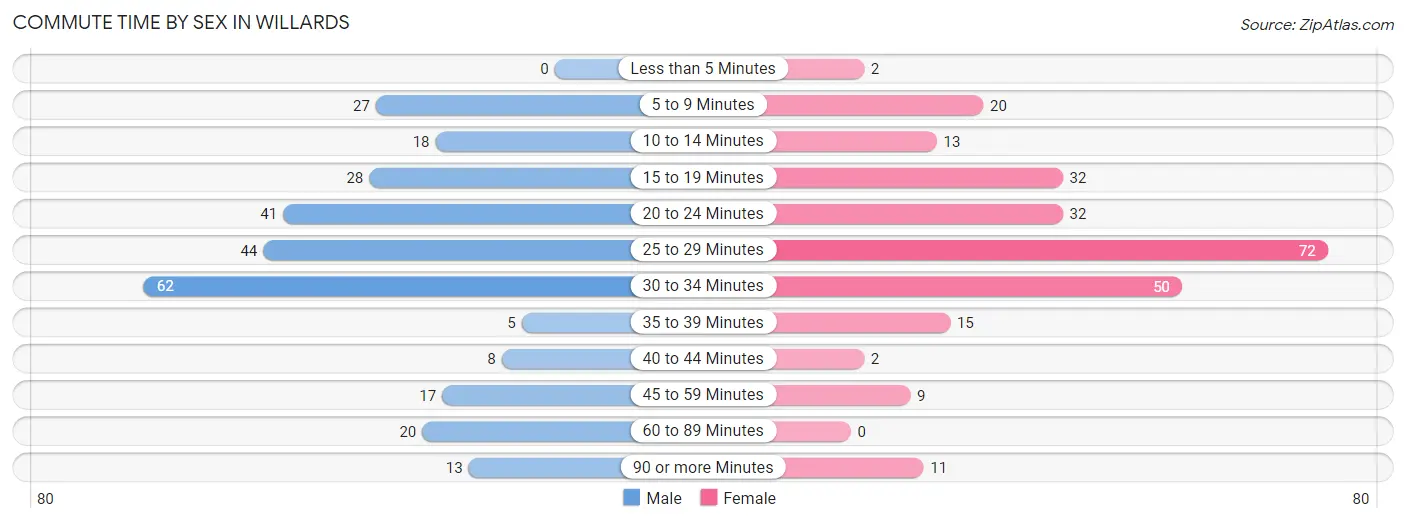
| Commute Time | Male | Female |
| Less than 5 Minutes | 0 (0.0%) | 2 (0.8%) |
| 5 to 9 Minutes | 27 (9.5%) | 20 (7.7%) |
| 10 to 14 Minutes | 18 (6.4%) | 13 (5.0%) |
| 15 to 19 Minutes | 28 (9.9%) | 32 (12.4%) |
| 20 to 24 Minutes | 41 (14.5%) | 32 (12.4%) |
| 25 to 29 Minutes | 44 (15.5%) | 72 (27.9%) |
| 30 to 34 Minutes | 62 (21.9%) | 50 (19.4%) |
| 35 to 39 Minutes | 5 (1.8%) | 15 (5.8%) |
| 40 to 44 Minutes | 8 (2.8%) | 2 (0.8%) |
| 45 to 59 Minutes | 17 (6.0%) | 9 (3.5%) |
| 60 to 89 Minutes | 20 (7.1%) | 0 (0.0%) |
| 90 or more Minutes | 13 (4.6%) | 11 (4.3%) |
Time of Departure to Work by Sex in Willards
The most frequent times of departure to work in Willards are 7:00 AM to 7:29 AM (76, 26.9%) for males and 7:00 AM to 7:29 AM (55, 21.3%) for females.
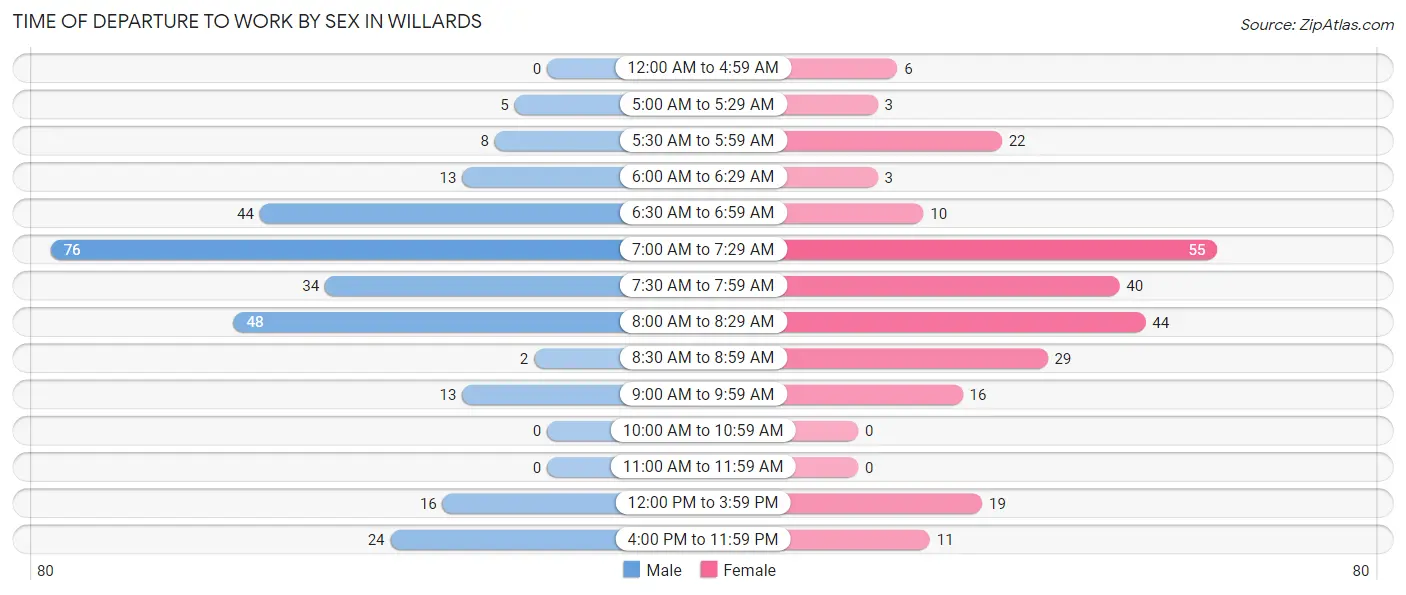
| Time of Departure | Male | Female |
| 12:00 AM to 4:59 AM | 0 (0.0%) | 6 (2.3%) |
| 5:00 AM to 5:29 AM | 5 (1.8%) | 3 (1.2%) |
| 5:30 AM to 5:59 AM | 8 (2.8%) | 22 (8.5%) |
| 6:00 AM to 6:29 AM | 13 (4.6%) | 3 (1.2%) |
| 6:30 AM to 6:59 AM | 44 (15.5%) | 10 (3.9%) |
| 7:00 AM to 7:29 AM | 76 (26.9%) | 55 (21.3%) |
| 7:30 AM to 7:59 AM | 34 (12.0%) | 40 (15.5%) |
| 8:00 AM to 8:29 AM | 48 (17.0%) | 44 (17.1%) |
| 8:30 AM to 8:59 AM | 2 (0.7%) | 29 (11.2%) |
| 9:00 AM to 9:59 AM | 13 (4.6%) | 16 (6.2%) |
| 10:00 AM to 10:59 AM | 0 (0.0%) | 0 (0.0%) |
| 11:00 AM to 11:59 AM | 0 (0.0%) | 0 (0.0%) |
| 12:00 PM to 3:59 PM | 16 (5.7%) | 19 (7.4%) |
| 4:00 PM to 11:59 PM | 24 (8.5%) | 11 (4.3%) |
| Total | 283 (100.0%) | 258 (100.0%) |
Housing Occupancy in Willards
Occupancy by Ownership in Willards
Of the total 452 dwellings in Willards, owner-occupied units account for 351 (77.6%), while renter-occupied units make up 101 (22.4%).
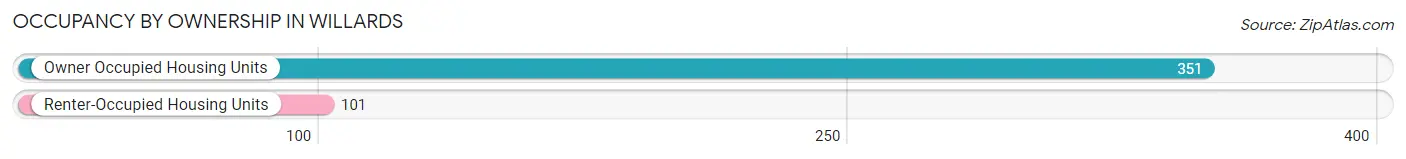
| Occupancy | # Housing Units | % Housing Units |
| Owner Occupied Housing Units | 351 | 77.6% |
| Renter-Occupied Housing Units | 101 | 22.4% |
| Total Occupied Housing Units | 452 | 100.0% |
Occupancy by Household Size in Willards
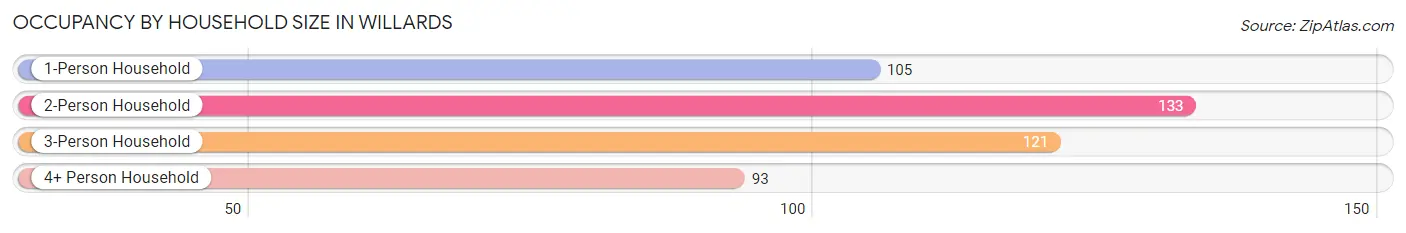
| Household Size | # Housing Units | % Housing Units |
| 1-Person Household | 105 | 23.2% |
| 2-Person Household | 133 | 29.4% |
| 3-Person Household | 121 | 26.8% |
| 4+ Person Household | 93 | 20.6% |
| Total Housing Units | 452 | 100.0% |
Occupancy by Ownership by Household Size in Willards
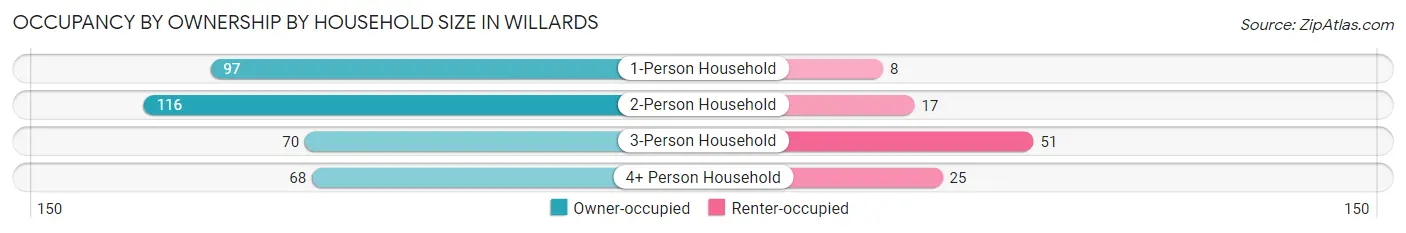
| Household Size | Owner-occupied | Renter-occupied |
| 1-Person Household | 97 (92.4%) | 8 (7.6%) |
| 2-Person Household | 116 (87.2%) | 17 (12.8%) |
| 3-Person Household | 70 (57.9%) | 51 (42.1%) |
| 4+ Person Household | 68 (73.1%) | 25 (26.9%) |
| Total Housing Units | 351 (77.6%) | 101 (22.4%) |
Occupancy by Educational Attainment in Willards
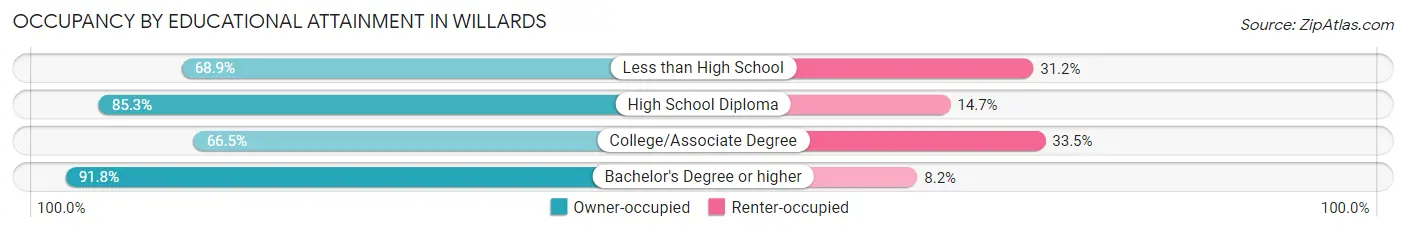
| Household Size | Owner-occupied | Renter-occupied |
| Less than High School | 42 (68.9%) | 19 (31.1%) |
| High School Diploma | 110 (85.3%) | 19 (14.7%) |
| College/Associate Degree | 109 (66.5%) | 55 (33.5%) |
| Bachelor's Degree or higher | 90 (91.8%) | 8 (8.2%) |
Occupancy by Age of Householder in Willards
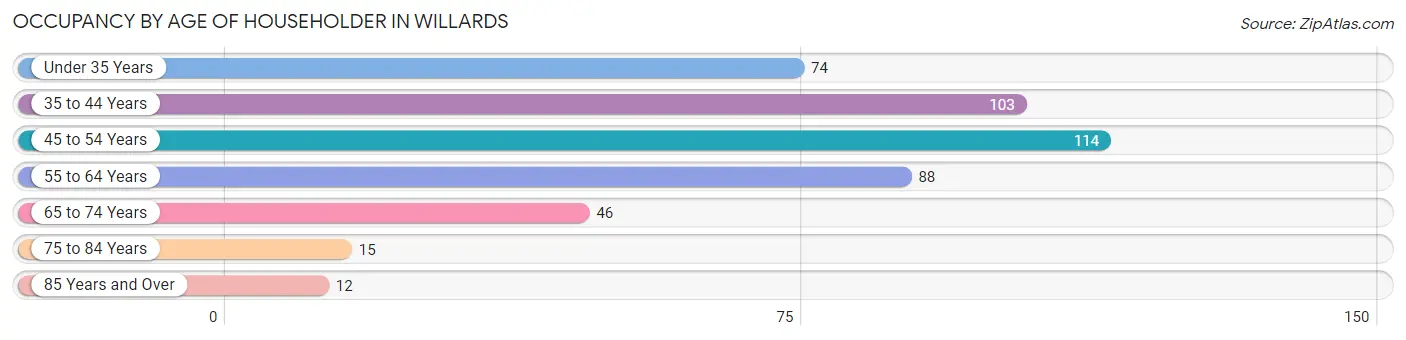
| Age Bracket | # Households | % Households |
| Under 35 Years | 74 | 16.4% |
| 35 to 44 Years | 103 | 22.8% |
| 45 to 54 Years | 114 | 25.2% |
| 55 to 64 Years | 88 | 19.5% |
| 65 to 74 Years | 46 | 10.2% |
| 75 to 84 Years | 15 | 3.3% |
| 85 Years and Over | 12 | 2.6% |
| Total | 452 | 100.0% |
Housing Finances in Willards
Median Income by Occupancy in Willards
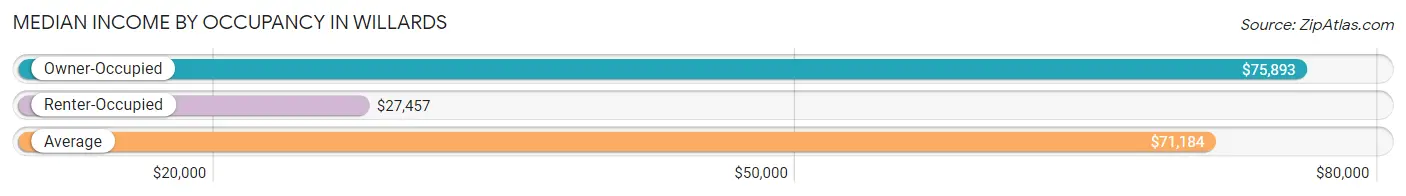
| Occupancy Type | # Households | Median Income |
| Owner-Occupied | 351 (77.6%) | $75,893 |
| Renter-Occupied | 101 (22.4%) | $27,457 |
| Average | 452 (100.0%) | $71,184 |
Occupancy by Householder Income Bracket in Willards
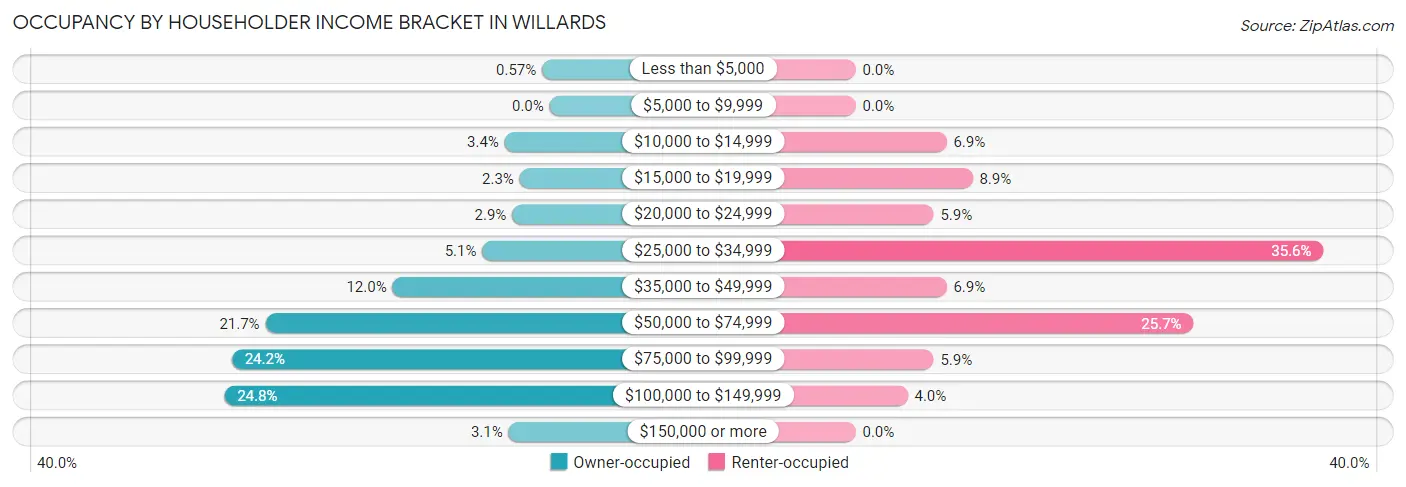
| Income Bracket | Owner-occupied | Renter-occupied |
| Less than $5,000 | 2 (0.6%) | 0 (0.0%) |
| $5,000 to $9,999 | 0 (0.0%) | 0 (0.0%) |
| $10,000 to $14,999 | 12 (3.4%) | 7 (6.9%) |
| $15,000 to $19,999 | 8 (2.3%) | 9 (8.9%) |
| $20,000 to $24,999 | 10 (2.9%) | 6 (5.9%) |
| $25,000 to $34,999 | 18 (5.1%) | 36 (35.6%) |
| $35,000 to $49,999 | 42 (12.0%) | 7 (6.9%) |
| $50,000 to $74,999 | 76 (21.6%) | 26 (25.7%) |
| $75,000 to $99,999 | 85 (24.2%) | 6 (5.9%) |
| $100,000 to $149,999 | 87 (24.8%) | 4 (4.0%) |
| $150,000 or more | 11 (3.1%) | 0 (0.0%) |
| Total | 351 (100.0%) | 101 (100.0%) |
Monthly Housing Cost Tiers in Willards
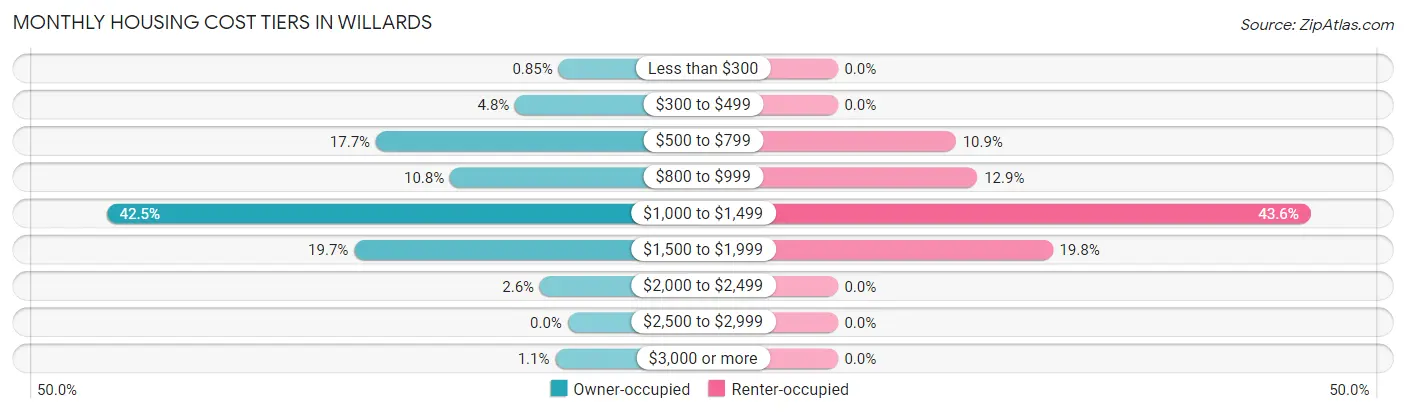
| Monthly Cost | Owner-occupied | Renter-occupied |
| Less than $300 | 3 (0.9%) | 0 (0.0%) |
| $300 to $499 | 17 (4.8%) | 0 (0.0%) |
| $500 to $799 | 62 (17.7%) | 11 (10.9%) |
| $800 to $999 | 38 (10.8%) | 13 (12.9%) |
| $1,000 to $1,499 | 149 (42.4%) | 44 (43.6%) |
| $1,500 to $1,999 | 69 (19.7%) | 20 (19.8%) |
| $2,000 to $2,499 | 9 (2.6%) | 0 (0.0%) |
| $2,500 to $2,999 | 0 (0.0%) | 0 (0.0%) |
| $3,000 or more | 4 (1.1%) | 0 (0.0%) |
| Total | 351 (100.0%) | 101 (100.0%) |
Physical Housing Characteristics in Willards
Housing Structures in Willards
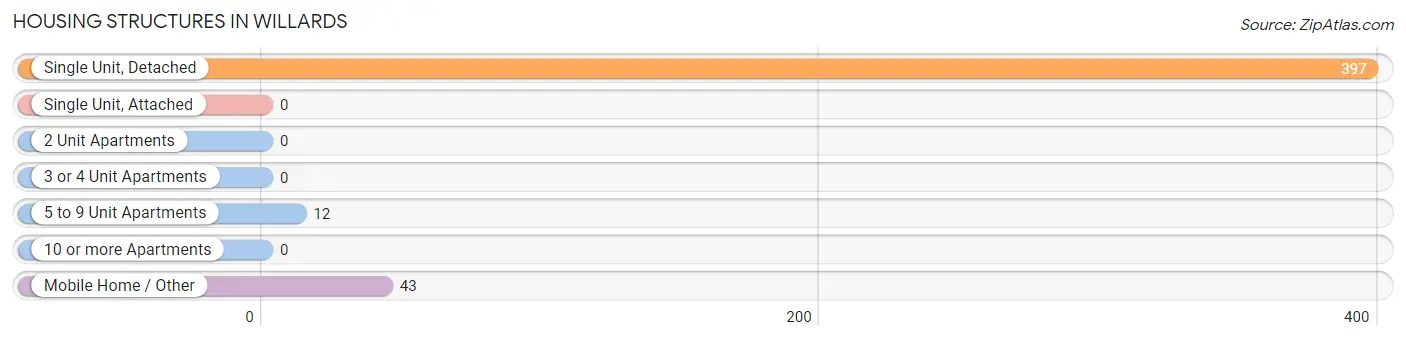
| Structure Type | # Housing Units | % Housing Units |
| Single Unit, Detached | 397 | 87.8% |
| Single Unit, Attached | 0 | 0.0% |
| 2 Unit Apartments | 0 | 0.0% |
| 3 or 4 Unit Apartments | 0 | 0.0% |
| 5 to 9 Unit Apartments | 12 | 2.6% |
| 10 or more Apartments | 0 | 0.0% |
| Mobile Home / Other | 43 | 9.5% |
| Total | 452 | 100.0% |
Housing Structures by Occupancy in Willards
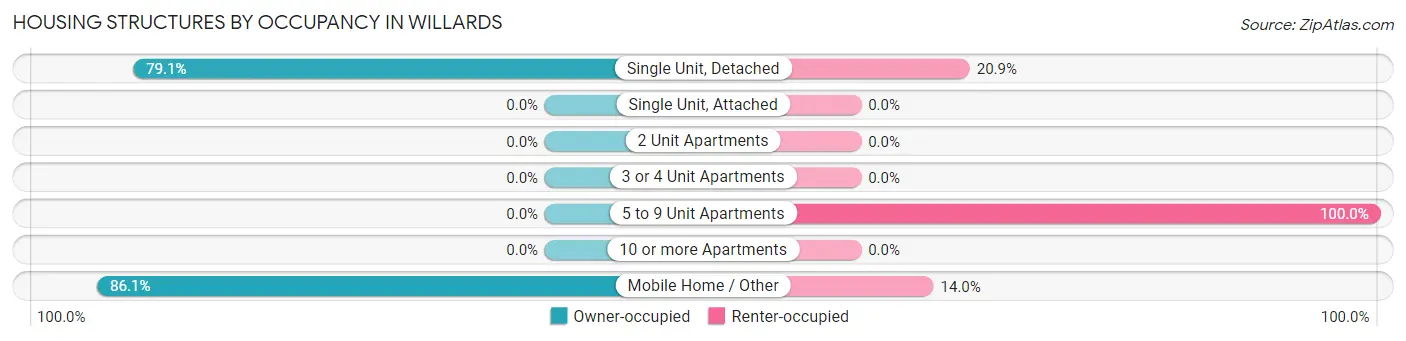
| Structure Type | Owner-occupied | Renter-occupied |
| Single Unit, Detached | 314 (79.1%) | 83 (20.9%) |
| Single Unit, Attached | 0 (0.0%) | 0 (0.0%) |
| 2 Unit Apartments | 0 (0.0%) | 0 (0.0%) |
| 3 or 4 Unit Apartments | 0 (0.0%) | 0 (0.0%) |
| 5 to 9 Unit Apartments | 0 (0.0%) | 12 (100.0%) |
| 10 or more Apartments | 0 (0.0%) | 0 (0.0%) |
| Mobile Home / Other | 37 (86.1%) | 6 (14.0%) |
| Total | 351 (77.6%) | 101 (22.4%) |
Housing Structures by Number of Rooms in Willards
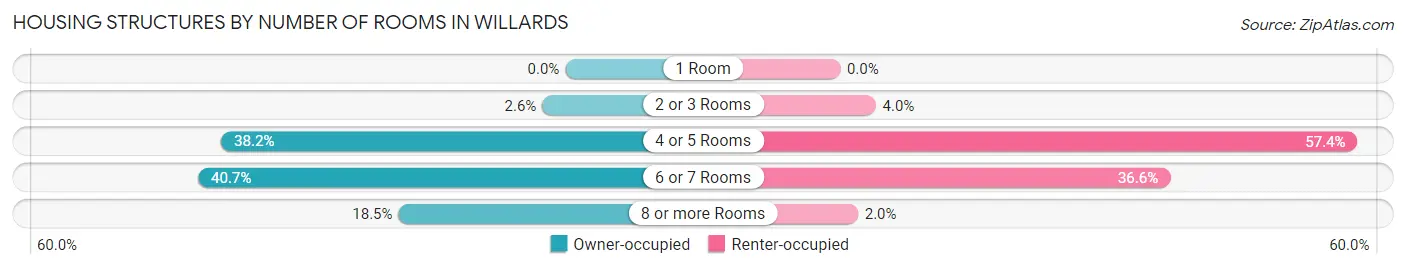
| Number of Rooms | Owner-occupied | Renter-occupied |
| 1 Room | 0 (0.0%) | 0 (0.0%) |
| 2 or 3 Rooms | 9 (2.6%) | 4 (4.0%) |
| 4 or 5 Rooms | 134 (38.2%) | 58 (57.4%) |
| 6 or 7 Rooms | 143 (40.7%) | 37 (36.6%) |
| 8 or more Rooms | 65 (18.5%) | 2 (2.0%) |
| Total | 351 (100.0%) | 101 (100.0%) |
Housing Structure by Heating Type in Willards
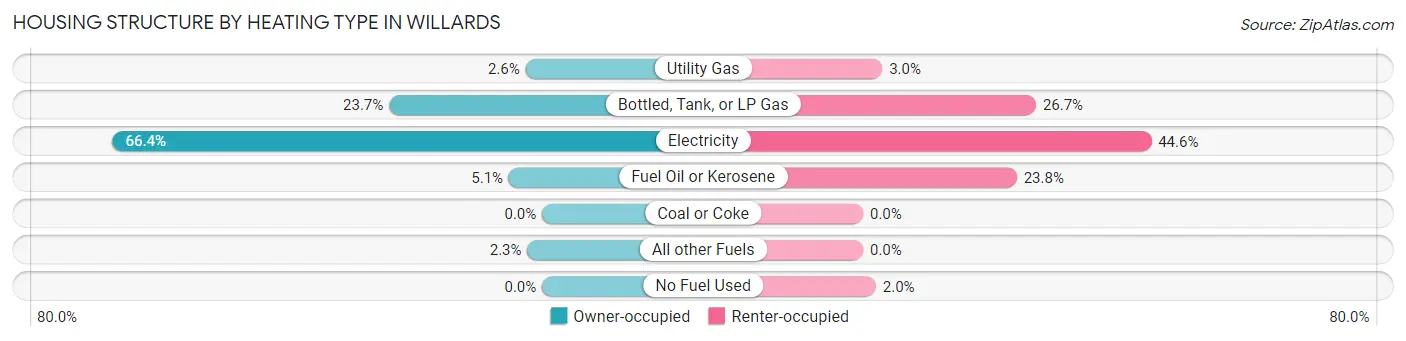
| Heating Type | Owner-occupied | Renter-occupied |
| Utility Gas | 9 (2.6%) | 3 (3.0%) |
| Bottled, Tank, or LP Gas | 83 (23.6%) | 27 (26.7%) |
| Electricity | 233 (66.4%) | 45 (44.6%) |
| Fuel Oil or Kerosene | 18 (5.1%) | 24 (23.8%) |
| Coal or Coke | 0 (0.0%) | 0 (0.0%) |
| All other Fuels | 8 (2.3%) | 0 (0.0%) |
| No Fuel Used | 0 (0.0%) | 2 (2.0%) |
| Total | 351 (100.0%) | 101 (100.0%) |
Household Vehicle Usage in Willards
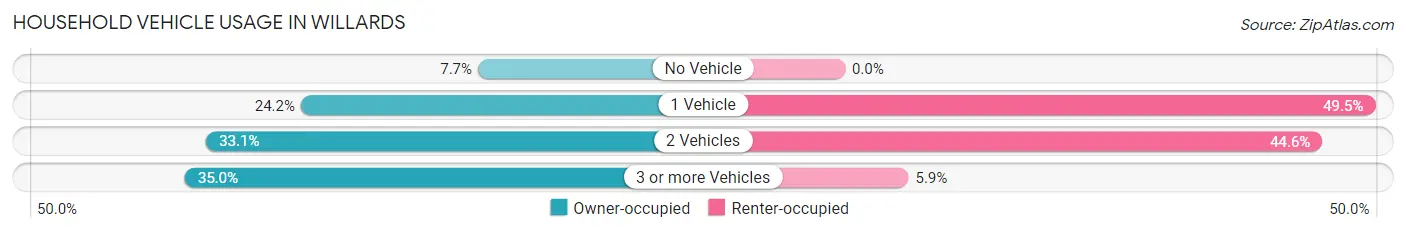
| Vehicles per Household | Owner-occupied | Renter-occupied |
| No Vehicle | 27 (7.7%) | 0 (0.0%) |
| 1 Vehicle | 85 (24.2%) | 50 (49.5%) |
| 2 Vehicles | 116 (33.1%) | 45 (44.6%) |
| 3 or more Vehicles | 123 (35.0%) | 6 (5.9%) |
| Total | 351 (100.0%) | 101 (100.0%) |
Real Estate & Mortgages in Willards
Real Estate and Mortgage Overview in Willards
| Characteristic | Without Mortgage | With Mortgage |
| Housing Units | 101 | 250 |
| Median Property Value | $176,000 | $169,300 |
| Median Household Income | $80,766 | $7 |
| Monthly Housing Costs | $679 | $4 |
| Real Estate Taxes | $2,372 | $21 |
Property Value by Mortgage Status in Willards
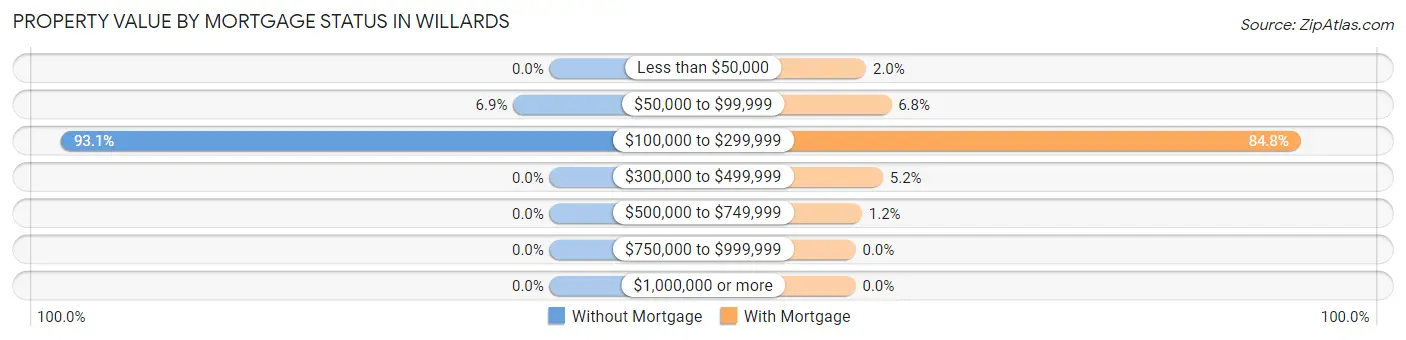
| Property Value | Without Mortgage | With Mortgage |
| Less than $50,000 | 0 (0.0%) | 5 (2.0%) |
| $50,000 to $99,999 | 7 (6.9%) | 17 (6.8%) |
| $100,000 to $299,999 | 94 (93.1%) | 212 (84.8%) |
| $300,000 to $499,999 | 0 (0.0%) | 13 (5.2%) |
| $500,000 to $749,999 | 0 (0.0%) | 3 (1.2%) |
| $750,000 to $999,999 | 0 (0.0%) | 0 (0.0%) |
| $1,000,000 or more | 0 (0.0%) | 0 (0.0%) |
| Total | 101 (100.0%) | 250 (100.0%) |
Household Income by Mortgage Status in Willards
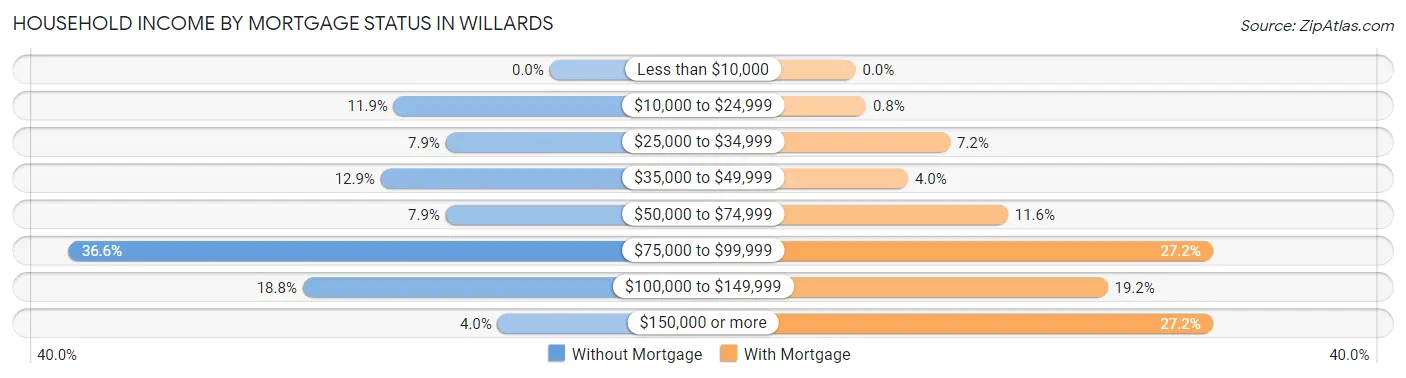
| Household Income | Without Mortgage | With Mortgage |
| Less than $10,000 | 0 (0.0%) | 0 (0.0%) |
| $10,000 to $24,999 | 12 (11.9%) | 2 (0.8%) |
| $25,000 to $34,999 | 8 (7.9%) | 18 (7.2%) |
| $35,000 to $49,999 | 13 (12.9%) | 10 (4.0%) |
| $50,000 to $74,999 | 8 (7.9%) | 29 (11.6%) |
| $75,000 to $99,999 | 37 (36.6%) | 68 (27.2%) |
| $100,000 to $149,999 | 19 (18.8%) | 48 (19.2%) |
| $150,000 or more | 4 (4.0%) | 68 (27.2%) |
| Total | 101 (100.0%) | 250 (100.0%) |
Property Value to Household Income Ratio in Willards
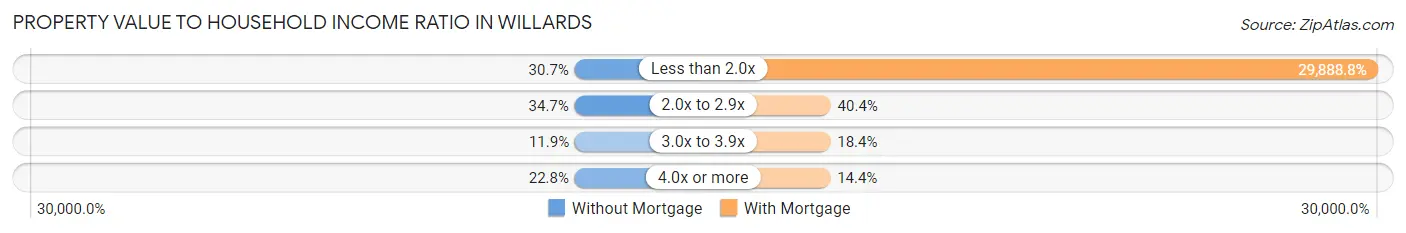
| Value-to-Income Ratio | Without Mortgage | With Mortgage |
| Less than 2.0x | 31 (30.7%) | 74,722 (29,888.8%) |
| 2.0x to 2.9x | 35 (34.6%) | 101 (40.4%) |
| 3.0x to 3.9x | 12 (11.9%) | 46 (18.4%) |
| 4.0x or more | 23 (22.8%) | 36 (14.4%) |
| Total | 101 (100.0%) | 250 (100.0%) |
Real Estate Taxes by Mortgage Status in Willards
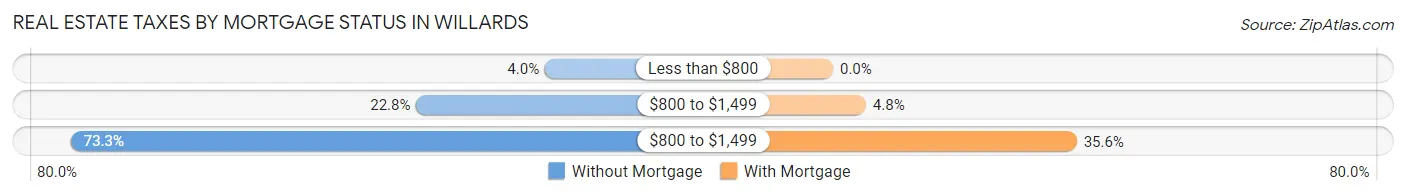
| Property Taxes | Without Mortgage | With Mortgage |
| Less than $800 | 4 (4.0%) | 0 (0.0%) |
| $800 to $1,499 | 23 (22.8%) | 12 (4.8%) |
| $800 to $1,499 | 74 (73.3%) | 89 (35.6%) |
| Total | 101 (100.0%) | 250 (100.0%) |
Health & Disability in Willards
Health Insurance Coverage by Age in Willards
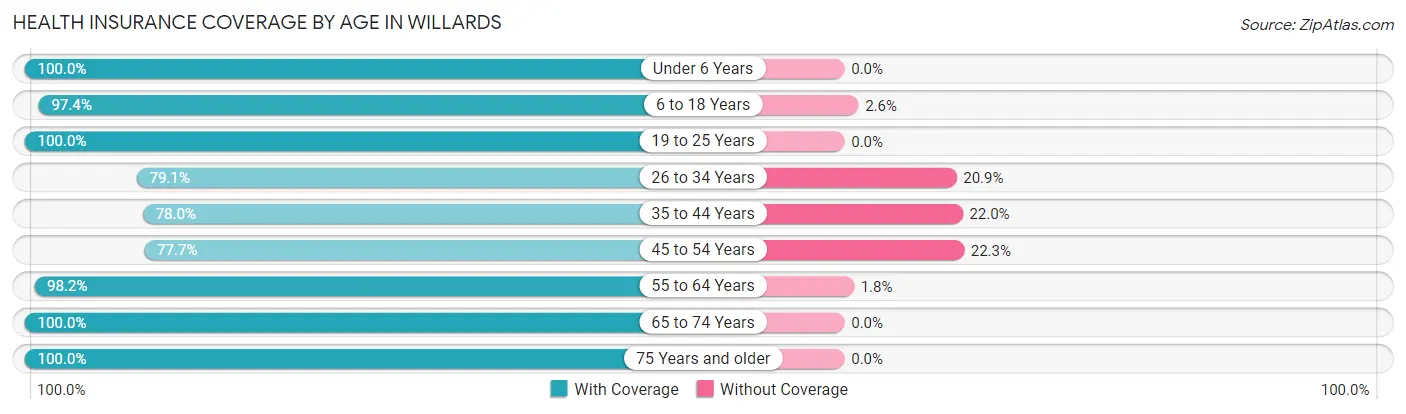
| Age Bracket | With Coverage | Without Coverage |
| Under 6 Years | 112 (100.0%) | 0 (0.0%) |
| 6 to 18 Years | 187 (97.4%) | 5 (2.6%) |
| 19 to 25 Years | 113 (100.0%) | 0 (0.0%) |
| 26 to 34 Years | 72 (79.1%) | 19 (20.9%) |
| 35 to 44 Years | 138 (78.0%) | 39 (22.0%) |
| 45 to 54 Years | 150 (77.7%) | 43 (22.3%) |
| 55 to 64 Years | 167 (98.2%) | 3 (1.8%) |
| 65 to 74 Years | 71 (100.0%) | 0 (0.0%) |
| 75 Years and older | 40 (100.0%) | 0 (0.0%) |
| Total | 1,050 (90.6%) | 109 (9.4%) |
Health Insurance Coverage by Citizenship Status in Willards
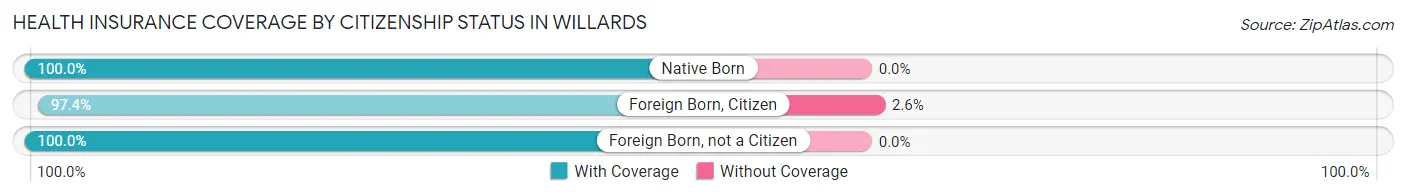
| Citizenship Status | With Coverage | Without Coverage |
| Native Born | 112 (100.0%) | 0 (0.0%) |
| Foreign Born, Citizen | 187 (97.4%) | 5 (2.6%) |
| Foreign Born, not a Citizen | 113 (100.0%) | 0 (0.0%) |
Health Insurance Coverage by Household Income in Willards
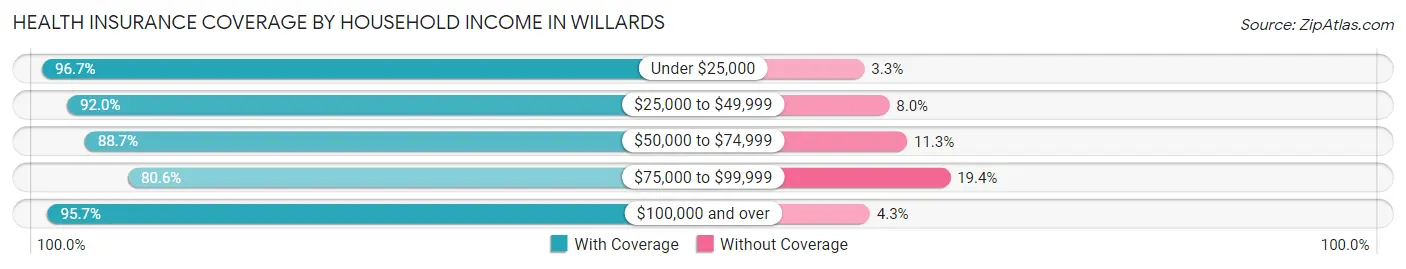
| Household Income | With Coverage | Without Coverage |
| Under $25,000 | 88 (96.7%) | 3 (3.3%) |
| $25,000 to $49,999 | 231 (92.0%) | 20 (8.0%) |
| $50,000 to $74,999 | 220 (88.7%) | 28 (11.3%) |
| $75,000 to $99,999 | 179 (80.6%) | 43 (19.4%) |
| $100,000 and over | 332 (95.7%) | 15 (4.3%) |
Public vs Private Health Insurance Coverage by Age in Willards
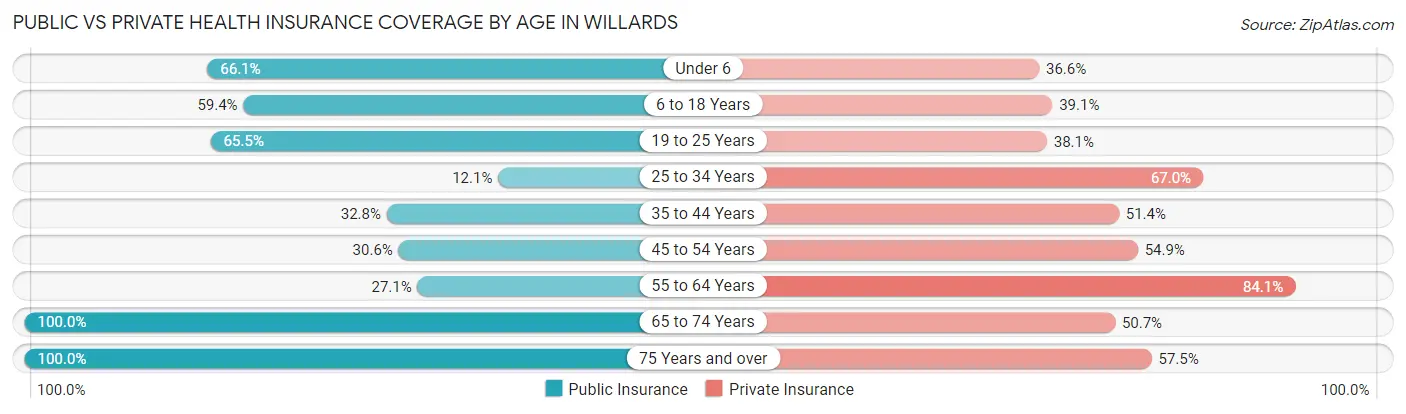
| Age Bracket | Public Insurance | Private Insurance |
| Under 6 | 74 (66.1%) | 41 (36.6%) |
| 6 to 18 Years | 114 (59.4%) | 75 (39.1%) |
| 19 to 25 Years | 74 (65.5%) | 43 (38.1%) |
| 25 to 34 Years | 11 (12.1%) | 61 (67.0%) |
| 35 to 44 Years | 58 (32.8%) | 91 (51.4%) |
| 45 to 54 Years | 59 (30.6%) | 106 (54.9%) |
| 55 to 64 Years | 46 (27.1%) | 143 (84.1%) |
| 65 to 74 Years | 71 (100.0%) | 36 (50.7%) |
| 75 Years and over | 40 (100.0%) | 23 (57.5%) |
| Total | 547 (47.2%) | 619 (53.4%) |
Disability Status by Sex by Age in Willards
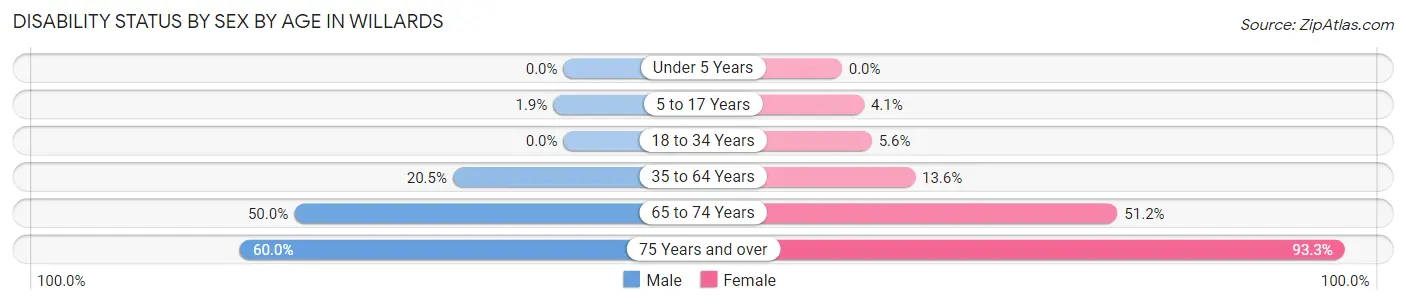
| Age Bracket | Male | Female |
| Under 5 Years | 0 (0.0%) | 0 (0.0%) |
| 5 to 17 Years | 2 (1.9%) | 3 (4.1%) |
| 18 to 34 Years | 0 (0.0%) | 7 (5.6%) |
| 35 to 64 Years | 55 (20.5%) | 37 (13.6%) |
| 65 to 74 Years | 14 (50.0%) | 22 (51.2%) |
| 75 Years and over | 6 (60.0%) | 28 (93.3%) |
Disability Class by Sex by Age in Willards
Disability Class: Hearing Difficulty
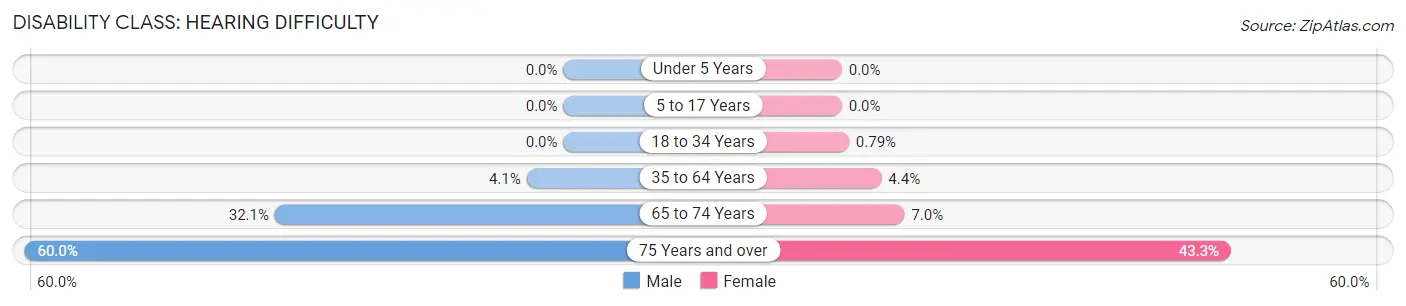
| Age Bracket | Male | Female |
| Under 5 Years | 0 (0.0%) | 0 (0.0%) |
| 5 to 17 Years | 0 (0.0%) | 0 (0.0%) |
| 18 to 34 Years | 0 (0.0%) | 1 (0.8%) |
| 35 to 64 Years | 11 (4.1%) | 12 (4.4%) |
| 65 to 74 Years | 9 (32.1%) | 3 (7.0%) |
| 75 Years and over | 6 (60.0%) | 13 (43.3%) |
Disability Class: Vision Difficulty
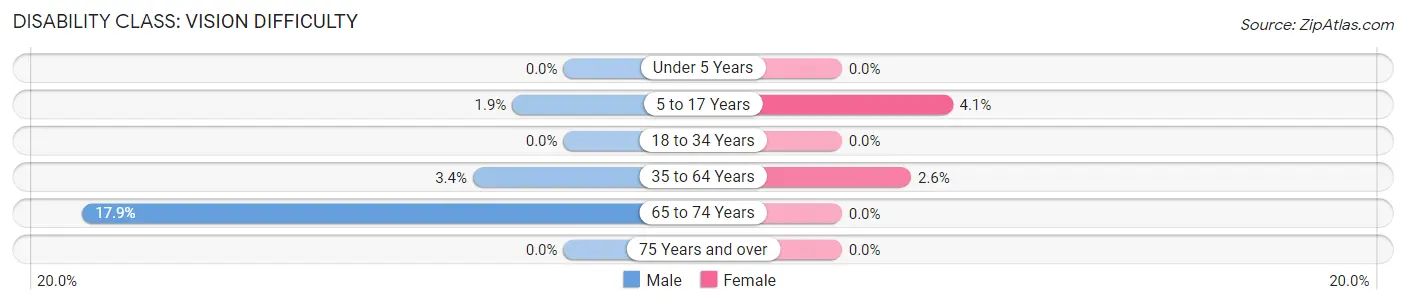
| Age Bracket | Male | Female |
| Under 5 Years | 0 (0.0%) | 0 (0.0%) |
| 5 to 17 Years | 2 (1.9%) | 3 (4.1%) |
| 18 to 34 Years | 0 (0.0%) | 0 (0.0%) |
| 35 to 64 Years | 9 (3.4%) | 7 (2.6%) |
| 65 to 74 Years | 5 (17.9%) | 0 (0.0%) |
| 75 Years and over | 0 (0.0%) | 0 (0.0%) |
Disability Class: Cognitive Difficulty
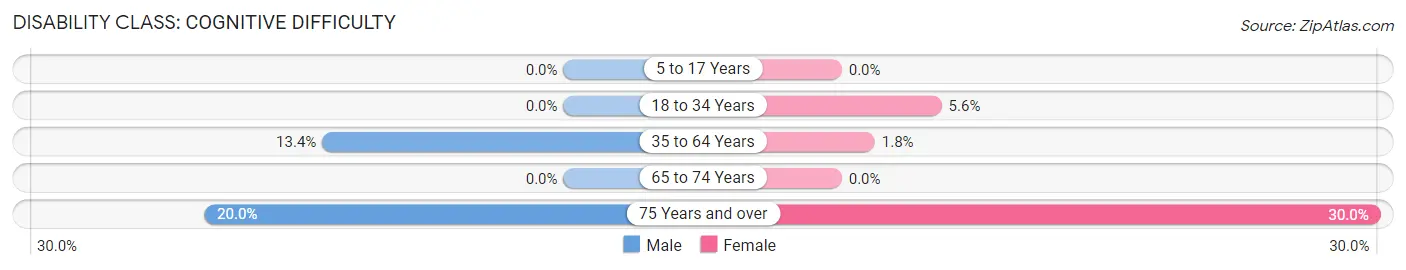
| Age Bracket | Male | Female |
| 5 to 17 Years | 0 (0.0%) | 0 (0.0%) |
| 18 to 34 Years | 0 (0.0%) | 7 (5.6%) |
| 35 to 64 Years | 36 (13.4%) | 5 (1.8%) |
| 65 to 74 Years | 0 (0.0%) | 0 (0.0%) |
| 75 Years and over | 2 (20.0%) | 9 (30.0%) |
Disability Class: Ambulatory Difficulty
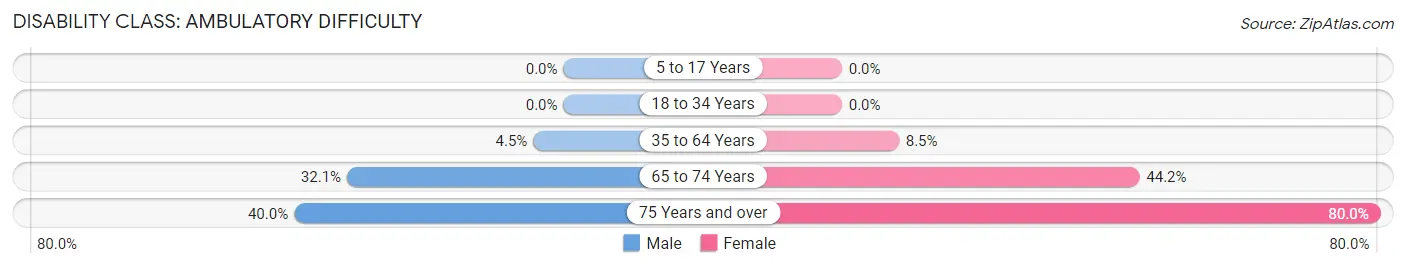
| Age Bracket | Male | Female |
| 5 to 17 Years | 0 (0.0%) | 0 (0.0%) |
| 18 to 34 Years | 0 (0.0%) | 0 (0.0%) |
| 35 to 64 Years | 12 (4.5%) | 23 (8.5%) |
| 65 to 74 Years | 9 (32.1%) | 19 (44.2%) |
| 75 Years and over | 4 (40.0%) | 24 (80.0%) |
Disability Class: Self-Care Difficulty
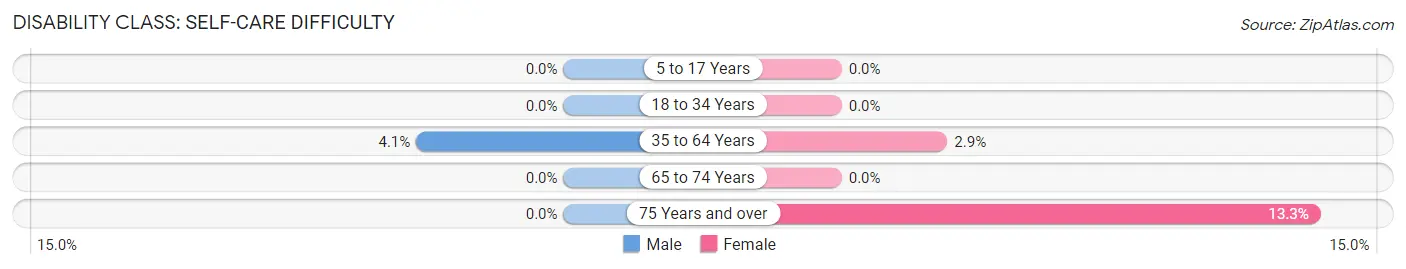
| Age Bracket | Male | Female |
| 5 to 17 Years | 0 (0.0%) | 0 (0.0%) |
| 18 to 34 Years | 0 (0.0%) | 0 (0.0%) |
| 35 to 64 Years | 11 (4.1%) | 8 (2.9%) |
| 65 to 74 Years | 0 (0.0%) | 0 (0.0%) |
| 75 Years and over | 0 (0.0%) | 4 (13.3%) |
Technology Access in Willards
Computing Device Access in Willards
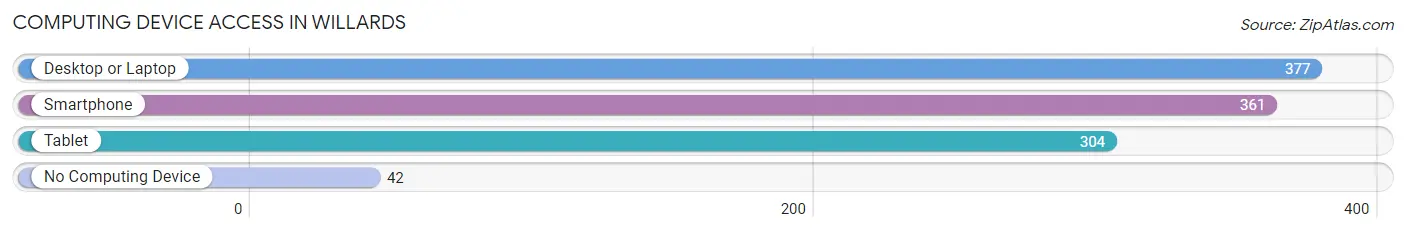
| Device Type | # Households | % Households |
| Desktop or Laptop | 377 | 83.4% |
| Smartphone | 361 | 79.9% |
| Tablet | 304 | 67.3% |
| No Computing Device | 42 | 9.3% |
| Total | 452 | 100.0% |
Internet Access in Willards
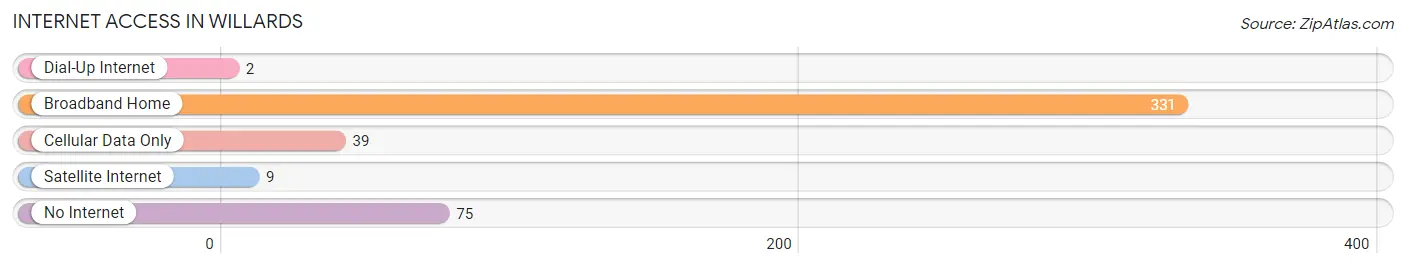
| Internet Type | # Households | % Households |
| Dial-Up Internet | 2 | 0.4% |
| Broadband Home | 331 | 73.2% |
| Cellular Data Only | 39 | 8.6% |
| Satellite Internet | 9 | 2.0% |
| No Internet | 75 | 16.6% |
| Total | 452 | 100.0% |
Willards Summary
Willards is a small town located in Wicomico County, Maryland. It is situated on the eastern shore of the Chesapeake Bay, approximately 10 miles south of Salisbury. The town has a population of 1,845 people, according to the 2010 census.
Geography
Willards is located in the Delmarva Peninsula, which is a region of the eastern United States that includes parts of Delaware, Maryland, and Virginia. The town is situated on the eastern shore of the Chesapeake Bay, approximately 10 miles south of Salisbury. The town is bordered by the towns of Hebron and Pittsville to the north, and the towns of Fruitland and Delmar to the south. The town is located in a rural area, with the nearest major city being Baltimore, which is approximately 90 miles away.
The town is situated on a flat plain, with the highest elevation being approximately 30 feet above sea level. The town is located in a humid subtropical climate zone, with hot, humid summers and mild winters. The average annual temperature is around 60 degrees Fahrenheit, with the average high temperature in the summer months reaching around 90 degrees Fahrenheit.
Economy
The economy of Willards is largely based on agriculture and tourism. The town is home to several farms, which produce a variety of crops, including corn, soybeans, wheat, and hay. The town is also home to several seafood processing plants, which process and package seafood for local and regional markets.
The town is also home to several tourist attractions, including the Willards Wildlife Management Area, which is a popular destination for bird watching and hunting. The town is also home to several restaurants, which serve a variety of local and regional cuisine.
Demographics
As of the 2010 census, the population of Willards was 1,845 people. The racial makeup of the town was 94.3% White, 2.2% African American, 0.7% Native American, 0.3% Asian, 0.1% Pacific Islander, 0.7% from other races, and 1.7% from two or more races. Hispanic or Latino of any race were 2.2% of the population.
The median household income in Willards was $45,938, and the median family income was $51,250. The per capita income for the town was $20,945. About 11.2% of families and 13.2% of the population were below the poverty line, including 17.2% of those under age 18 and 8.3% of those age 65 or over.
Conclusion
Willards is a small town located in Wicomico County, Maryland. It is situated on the eastern shore of the Chesapeake Bay, approximately 10 miles south of Salisbury. The town has a population of 1,845 people, according to the 2010 census. The economy of Willards is largely based on agriculture and tourism, and the town is home to several farms, seafood processing plants, and tourist attractions. The racial makeup of the town is 94.3% White, 2.2% African American, 0.7% Native American, 0.3% Asian, 0.1% Pacific Islander, 0.7% from other races, and 1.7% from two or more races. The median household income in Willards was $45,938, and the median family income was $51,250.
Common Questions
What is Per Capita Income in Willards?
Per Capita income in Willards is $26,661.
What is the Median Family Income in Willards?
Median Family Income in Willards is $74,000.
What is the Median Household income in Willards?
Median Household Income in Willards is $71,184.
What is Income or Wage Gap in Willards?
Income or Wage Gap in Willards is 46.4%.
Women in Willards earn 53.6 cents for every dollar earned by a man.
What is Inequality or Gini Index in Willards?
Inequality or Gini Index in Willards is 0.31.
What is the Total Population of Willards?
Total Population of Willards is 1,161.
What is the Total Male Population of Willards?
Total Male Population of Willards is 590.
What is the Total Female Population of Willards?
Total Female Population of Willards is 571.
What is the Ratio of Males per 100 Females in Willards?
There are 103.33 Males per 100 Females in Willards.
What is the Ratio of Females per 100 Males in Willards?
There are 96.78 Females per 100 Males in Willards.
What is the Median Population Age in Willards?
Median Population Age in Willards is 40.6 Years.
What is the Average Family Size in Willards
Average Family Size in Willards is 2.9 People.
What is the Average Household Size in Willards
Average Household Size in Willards is 2.6 People.
How Large is the Labor Force in Willards?
There are 661 People in the Labor Forcein in Willards.
What is the Percentage of People in the Labor Force in Willards?
74.5% of People are in the Labor Force in Willards.
What is the Unemployment Rate in Willards?
Unemployment Rate in Willards is 12.6%.