Lexington Park, MD Map & Demographics
Lexington Park Map
Lexington Park Overview
$41,168
PER CAPITA INCOME
$88,871
AVG FAMILY INCOME
$86,944
AVG HOUSEHOLD INCOME
40.5%
WAGE / INCOME GAP [ % ]
59.5¢/ $1
WAGE / INCOME GAP [ $ ]
0.40
INEQUALITY / GINI INDEX
13,537
TOTAL POPULATION
6,814
MALE POPULATION
6,723
FEMALE POPULATION
101.35
MALES / 100 FEMALES
98.66
FEMALES / 100 MALES
31.6
MEDIAN AGE
3.0
AVG FAMILY SIZE
2.4
AVG HOUSEHOLD SIZE
8,075
LABOR FORCE [ PEOPLE ]
74.1%
PERCENT IN LABOR FORCE
4.1%
UNEMPLOYMENT RATE
Lexington Park Zip Codes
Income in Lexington Park
Income Overview in Lexington Park
Per Capita Income in Lexington Park is $41,168, while median incomes of families and households are $88,871 and $86,944 respectively.
| Characteristic | Number | Measure |
| Per Capita Income | 13,537 | $41,168 |
| Median Family Income | 3,499 | $88,871 |
| Mean Family Income | 3,499 | $99,316 |
| Median Household Income | 5,732 | $86,944 |
| Mean Household Income | 5,732 | $94,499 |
| Income Deficit | 3,499 | $0 |
| Wage / Income Gap (%) | 13,537 | 40.51% |
| Wage / Income Gap ($) | 13,537 | 59.49¢ per $1 |
| Gini / Inequality Index | 13,537 | 0.40 |
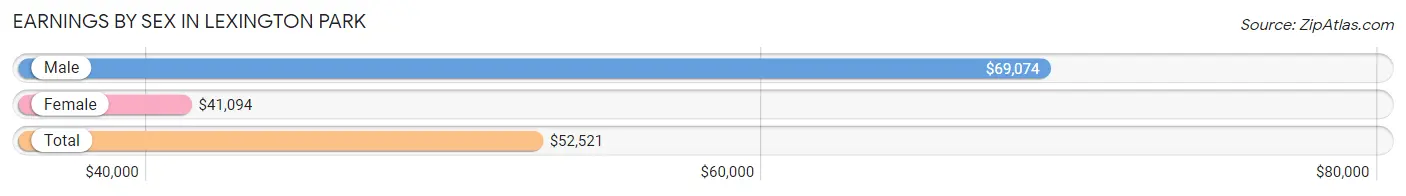
Earnings by Sex in Lexington Park
Average Earnings in Lexington Park are $52,521, $69,074 for men and $41,094 for women, a difference of 40.5%.
| Sex | Number | Average Earnings |
| Male | 4,321 (53.2%) | $69,074 |
| Female | 3,808 (46.8%) | $41,094 |
| Total | 8,129 (100.0%) | $52,521 |
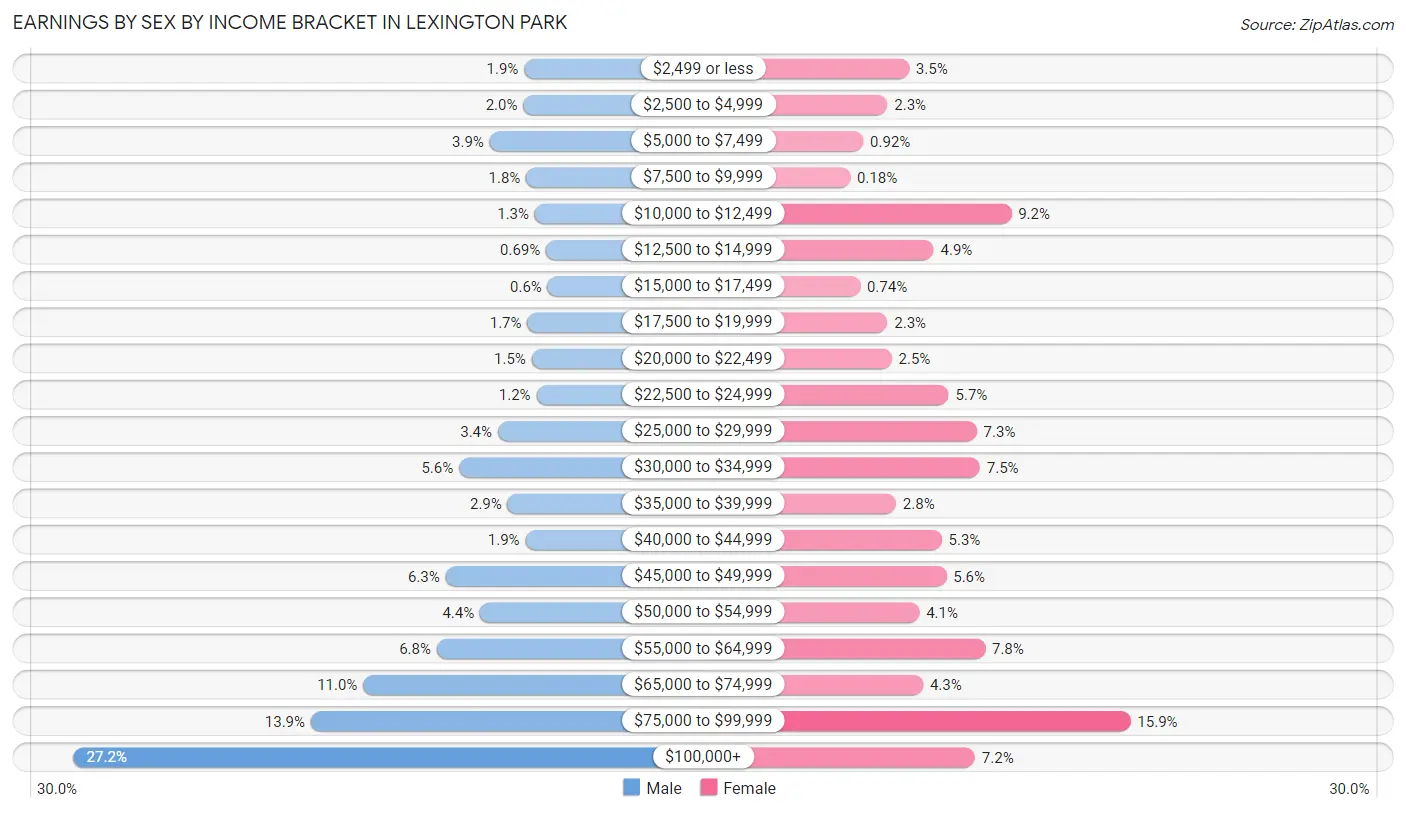
Earnings by Sex by Income Bracket in Lexington Park
The most common earnings brackets in Lexington Park are $100,000+ for men (1,177 | 27.2%) and $75,000 to $99,999 for women (607 | 15.9%).
| Income | Male | Female |
| $2,499 or less | 83 (1.9%) | 133 (3.5%) |
| $2,500 to $4,999 | 85 (2.0%) | 87 (2.3%) |
| $5,000 to $7,499 | 167 (3.9%) | 35 (0.9%) |
| $7,500 to $9,999 | 78 (1.8%) | 7 (0.2%) |
| $10,000 to $12,499 | 57 (1.3%) | 352 (9.2%) |
| $12,500 to $14,999 | 30 (0.7%) | 186 (4.9%) |
| $15,000 to $17,499 | 26 (0.6%) | 28 (0.7%) |
| $17,500 to $19,999 | 75 (1.7%) | 87 (2.3%) |
| $20,000 to $22,499 | 65 (1.5%) | 96 (2.5%) |
| $22,500 to $24,999 | 53 (1.2%) | 218 (5.7%) |
| $25,000 to $29,999 | 147 (3.4%) | 278 (7.3%) |
| $30,000 to $34,999 | 241 (5.6%) | 285 (7.5%) |
| $35,000 to $39,999 | 123 (2.9%) | 105 (2.8%) |
| $40,000 to $44,999 | 80 (1.8%) | 203 (5.3%) |
| $45,000 to $49,999 | 274 (6.3%) | 213 (5.6%) |
| $50,000 to $54,999 | 190 (4.4%) | 155 (4.1%) |
| $55,000 to $64,999 | 295 (6.8%) | 296 (7.8%) |
| $65,000 to $74,999 | 474 (11.0%) | 163 (4.3%) |
| $75,000 to $99,999 | 601 (13.9%) | 607 (15.9%) |
| $100,000+ | 1,177 (27.2%) | 274 (7.2%) |
| Total | 4,321 (100.0%) | 3,808 (100.0%) |
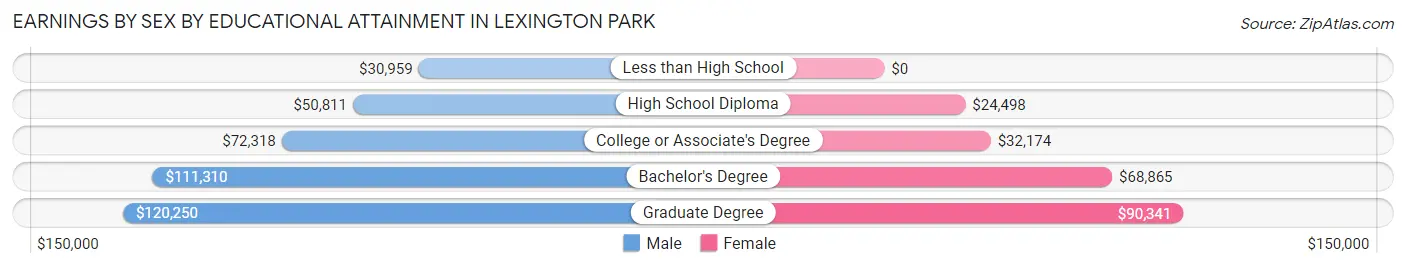
Earnings by Sex by Educational Attainment in Lexington Park
Average earnings in Lexington Park are $75,072 for men and $43,757 for women, a difference of 41.7%. Men with an educational attainment of graduate degree enjoy the highest average annual earnings of $120,250, while those with less than high school education earn the least with $30,959. Women with an educational attainment of graduate degree earn the most with the average annual earnings of $90,341, while those with high school diploma education have the smallest earnings of $24,498.
| Educational Attainment | Male Income | Female Income |
| Less than High School | $30,959 | $0 |
| High School Diploma | $50,811 | $24,498 |
| College or Associate's Degree | $72,318 | $32,174 |
| Bachelor's Degree | $111,310 | $68,865 |
| Graduate Degree | $120,250 | $90,341 |
| Total | $75,072 | $43,757 |
Family Income in Lexington Park
Family Income Brackets in Lexington Park
According to the Lexington Park family income data, there are 822 families falling into the $100,000 to $149,999 income range, which is the most common income bracket and makes up 23.5% of all families. Conversely, the $15,000 to $24,999 income bracket is the least frequent group with only 56 families (1.6%) belonging to this category.
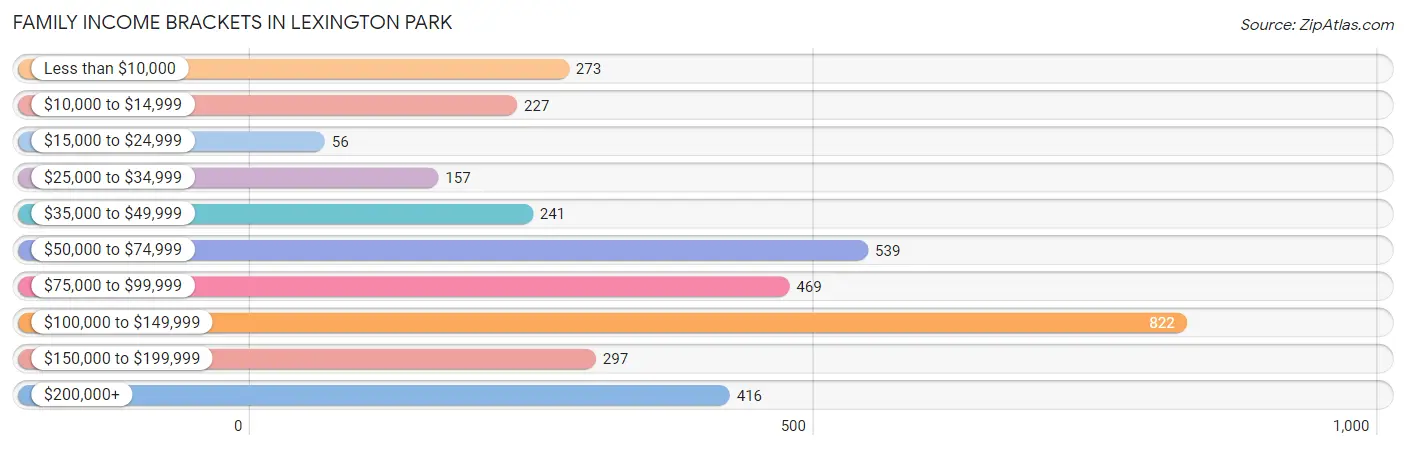
| Income Bracket | # Families | % Families |
| Less than $10,000 | 273 | 7.8% |
| $10,000 to $14,999 | 227 | 6.5% |
| $15,000 to $24,999 | 56 | 1.6% |
| $25,000 to $34,999 | 157 | 4.5% |
| $35,000 to $49,999 | 241 | 6.9% |
| $50,000 to $74,999 | 539 | 15.4% |
| $75,000 to $99,999 | 469 | 13.4% |
| $100,000 to $149,999 | 822 | 23.5% |
| $150,000 to $199,999 | 297 | 8.5% |
| $200,000+ | 416 | 11.9% |
Family Income by Famaliy Size in Lexington Park
4-person families (675 | 19.3%) account for the highest median family income in Lexington Park with $102,926 per family, while 2-person families (1,405 | 40.2%) have the highest median income of $49,182 per family member.
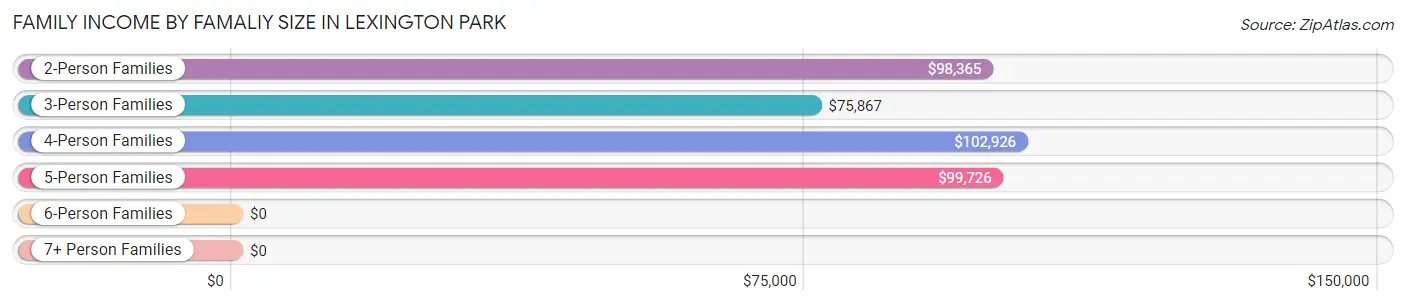
| Income Bracket | # Families | Median Income |
| 2-Person Families | 1,405 (40.2%) | $98,365 |
| 3-Person Families | 1,040 (29.7%) | $75,867 |
| 4-Person Families | 675 (19.3%) | $102,926 |
| 5-Person Families | 301 (8.6%) | $99,726 |
| 6-Person Families | 57 (1.6%) | $0 |
| 7+ Person Families | 21 (0.6%) | $0 |
| Total | 3,499 (100.0%) | $88,871 |
Family Income by Number of Earners in Lexington Park
The median family income in Lexington Park is $88,871, with families comprising 2 earners (1,292) having the highest median family income of $129,688, while families with no earners (278) have the lowest median family income of $2,499, accounting for 36.9% and 8.0% of families, respectively.
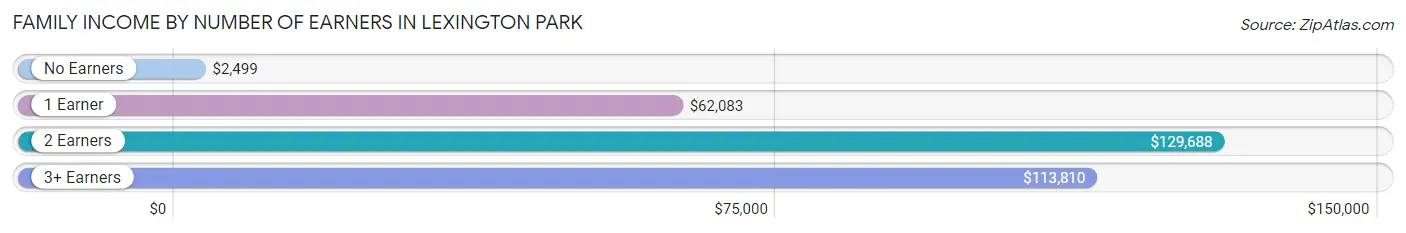
| Number of Earners | # Families | Median Income |
| No Earners | 278 (8.0%) | $2,499 |
| 1 Earner | 1,543 (44.1%) | $62,083 |
| 2 Earners | 1,292 (36.9%) | $129,688 |
| 3+ Earners | 386 (11.0%) | $113,810 |
| Total | 3,499 (100.0%) | $88,871 |
Household Income in Lexington Park
Household Income Brackets in Lexington Park
With 1,473 households falling in the category, the $100,000 to $149,999 income range is the most frequent in Lexington Park, accounting for 25.7% of all households. In contrast, only 235 households (4.1%) fall into the $25,000 to $34,999 income bracket, making it the least populous group.
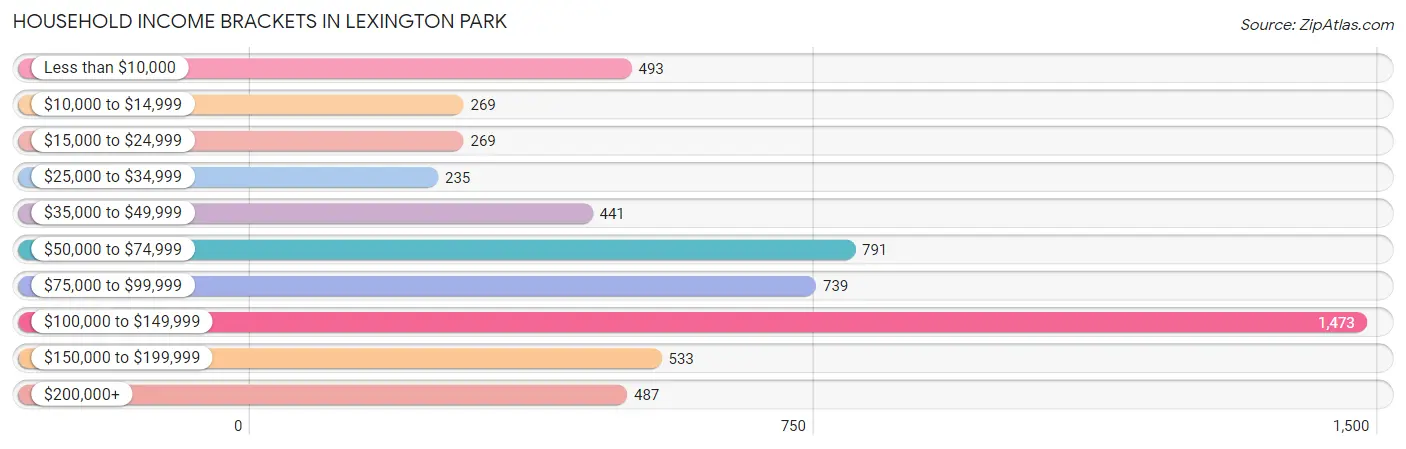
| Income Bracket | # Households | % Households |
| Less than $10,000 | 493 | 8.6% |
| $10,000 to $14,999 | 269 | 4.7% |
| $15,000 to $24,999 | 269 | 4.7% |
| $25,000 to $34,999 | 235 | 4.1% |
| $35,000 to $49,999 | 441 | 7.7% |
| $50,000 to $74,999 | 791 | 13.8% |
| $75,000 to $99,999 | 739 | 12.9% |
| $100,000 to $149,999 | 1,473 | 25.7% |
| $150,000 to $199,999 | 533 | 9.3% |
| $200,000+ | 487 | 8.5% |
Household Income by Householder Age in Lexington Park
The median household income in Lexington Park is $86,944, with the highest median household income of $95,395 found in the 65+ years age bracket for the primary householder. A total of 660 households (11.5%) fall into this category. Meanwhile, the 15 to 24 years age bracket for the primary householder has the lowest median household income of $39,476, with 517 households (9.0%) in this group.
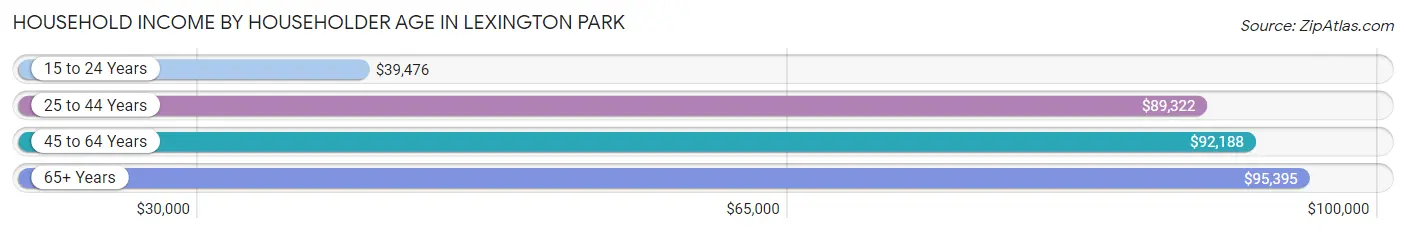
| Income Bracket | # Households | Median Income |
| 15 to 24 Years | 517 (9.0%) | $39,476 |
| 25 to 44 Years | 2,576 (44.9%) | $89,322 |
| 45 to 64 Years | 1,979 (34.5%) | $92,188 |
| 65+ Years | 660 (11.5%) | $95,395 |
| Total | 5,732 (100.0%) | $86,944 |
Poverty in Lexington Park
Income Below Poverty by Sex and Age in Lexington Park
With 12.9% poverty level for males and 16.9% for females among the residents of Lexington Park, 16 and 17 year old males and 15 year old females are the most vulnerable to poverty, with 54 males (26.1%) and 35 females (40.2%) in their respective age groups living below the poverty level.
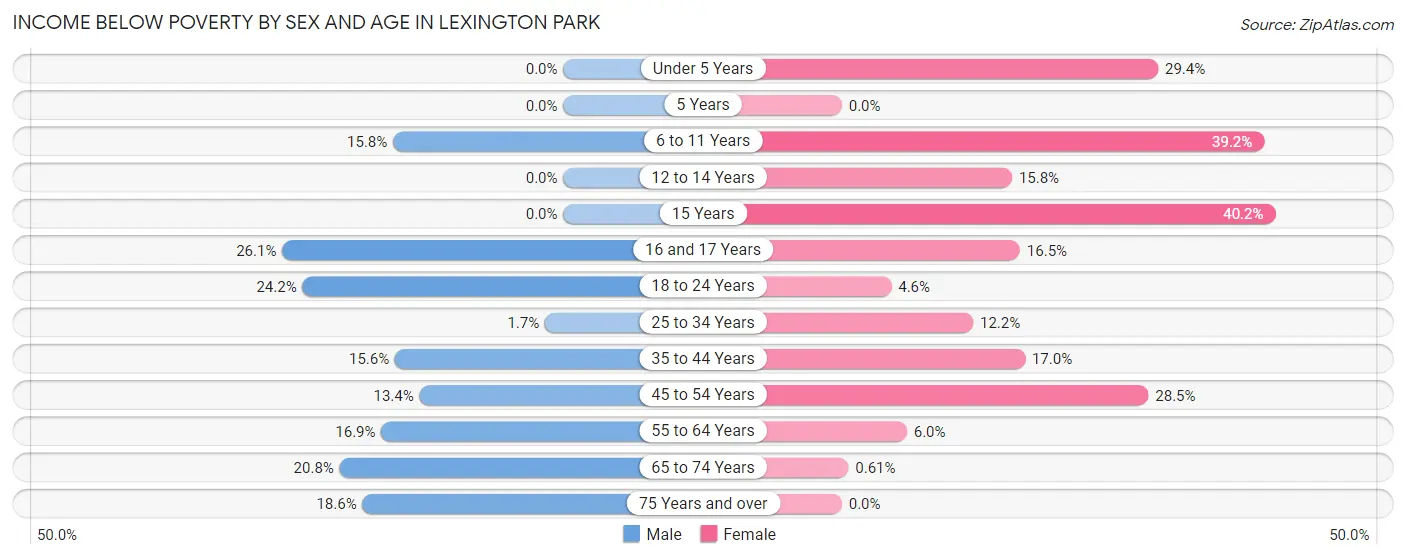
| Age Bracket | Male | Female |
| Under 5 Years | 0 (0.0%) | 162 (29.3%) |
| 5 Years | 0 (0.0%) | 0 (0.0%) |
| 6 to 11 Years | 88 (15.8%) | 194 (39.2%) |
| 12 to 14 Years | 0 (0.0%) | 9 (15.8%) |
| 15 Years | 0 (0.0%) | 35 (40.2%) |
| 16 and 17 Years | 54 (26.1%) | 39 (16.5%) |
| 18 to 24 Years | 229 (24.2%) | 31 (4.6%) |
| 25 to 34 Years | 24 (1.7%) | 177 (12.2%) |
| 35 to 44 Years | 129 (15.6%) | 162 (17.0%) |
| 45 to 54 Years | 98 (13.4%) | 276 (28.4%) |
| 55 to 64 Years | 139 (16.9%) | 45 (6.0%) |
| 65 to 74 Years | 93 (20.8%) | 1 (0.6%) |
| 75 Years and over | 22 (18.6%) | 0 (0.0%) |
| Total | 876 (12.9%) | 1,131 (16.9%) |
Income Above Poverty by Sex and Age in Lexington Park
According to the poverty statistics in Lexington Park, males aged under 5 years and females aged 5 years are the age groups that are most secure financially, with 100.0% of males and 100.0% of females in these age groups living above the poverty line.
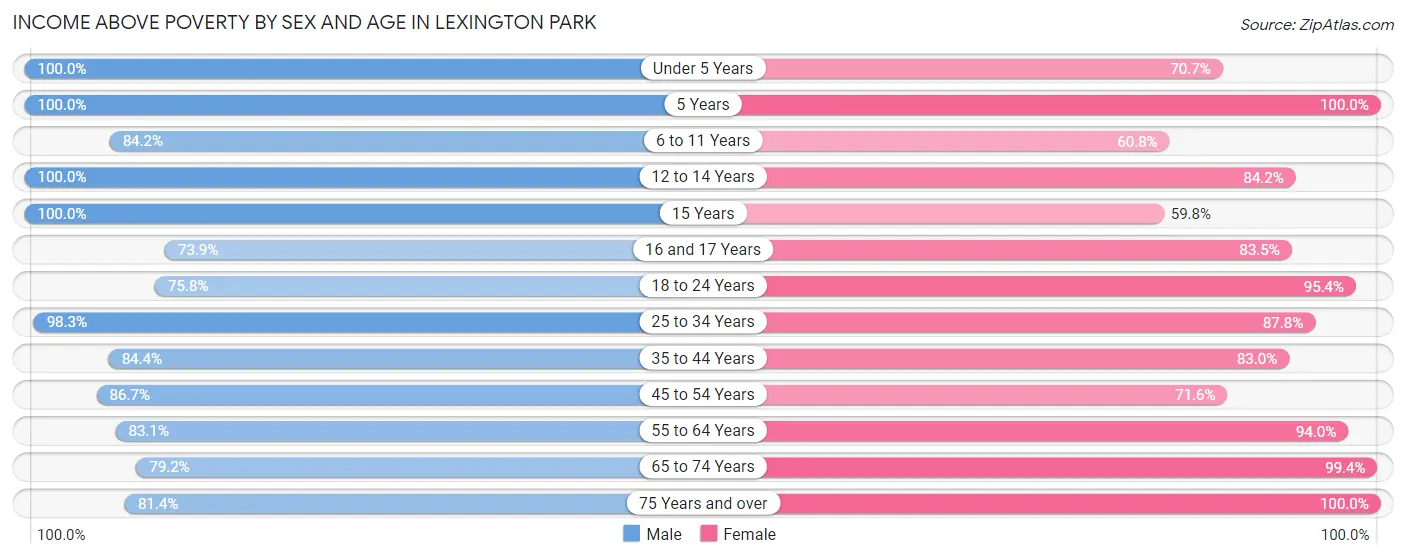
| Age Bracket | Male | Female |
| Under 5 Years | 533 (100.0%) | 390 (70.7%) |
| 5 Years | 47 (100.0%) | 123 (100.0%) |
| 6 to 11 Years | 469 (84.2%) | 301 (60.8%) |
| 12 to 14 Years | 113 (100.0%) | 48 (84.2%) |
| 15 Years | 47 (100.0%) | 52 (59.8%) |
| 16 and 17 Years | 153 (73.9%) | 197 (83.5%) |
| 18 to 24 Years | 717 (75.8%) | 645 (95.4%) |
| 25 to 34 Years | 1,391 (98.3%) | 1,276 (87.8%) |
| 35 to 44 Years | 697 (84.4%) | 791 (83.0%) |
| 45 to 54 Years | 636 (86.7%) | 694 (71.6%) |
| 55 to 64 Years | 684 (83.1%) | 701 (94.0%) |
| 65 to 74 Years | 355 (79.2%) | 162 (99.4%) |
| 75 Years and over | 96 (81.4%) | 184 (100.0%) |
| Total | 5,938 (87.1%) | 5,564 (83.1%) |
Income Below Poverty Among Married-Couple Families in Lexington Park
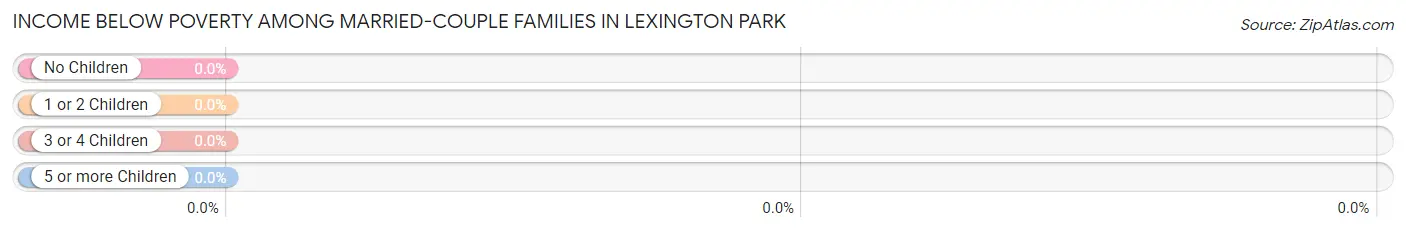
| Children | Above Poverty | Below Poverty |
| No Children | 790 (100.0%) | 0 (0.0%) |
| 1 or 2 Children | 912 (100.0%) | 0 (0.0%) |
| 3 or 4 Children | 194 (100.0%) | 0 (0.0%) |
| 5 or more Children | 0 (0.0%) | 0 (0.0%) |
| Total | 1,896 (100.0%) | 0 (0.0%) |
Income Below Poverty Among Single-Parent Households in Lexington Park
According to the poverty data in Lexington Park, 15.5% or 43 single-father households and 40.6% or 538 single-mother households are living below the poverty line. Among single-father households, those with 1 or 2 children have the highest poverty rate, with 43 households (35.2%) experiencing poverty. Likewise, among single-mother households, those with 1 or 2 children have the highest poverty rate, with 521 households (55.0%) falling below the poverty line.
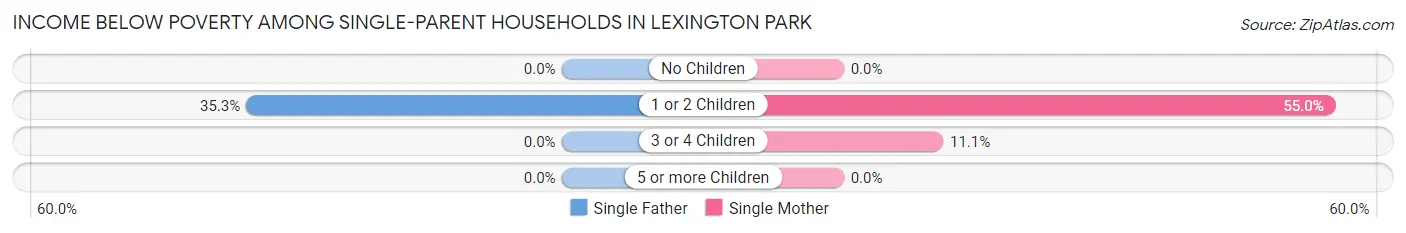
| Children | Single Father | Single Mother |
| No Children | 0 (0.0%) | 0 (0.0%) |
| 1 or 2 Children | 43 (35.2%) | 521 (55.0%) |
| 3 or 4 Children | 0 (0.0%) | 17 (11.1%) |
| 5 or more Children | 0 (0.0%) | 0 (0.0%) |
| Total | 43 (15.5%) | 538 (40.6%) |
Income Below Poverty Among Married-Couple vs Single-Parent Households in Lexington Park
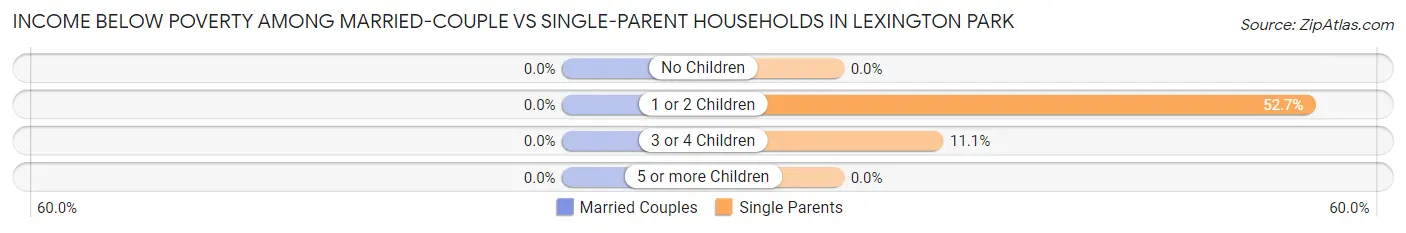
| Children | Married-Couple Families | Single-Parent Households |
| No Children | 0 (0.0%) | 0 (0.0%) |
| 1 or 2 Children | 0 (0.0%) | 564 (52.7%) |
| 3 or 4 Children | 0 (0.0%) | 17 (11.1%) |
| 5 or more Children | 0 (0.0%) | 0 (0.0%) |
| Total | 0 (0.0%) | 581 (36.2%) |
Race in Lexington Park
The most populous races in Lexington Park are White / Caucasian (7,381 | 54.5%), Black / African American (3,957 | 29.2%), and Two or more Races (1,209 | 8.9%).
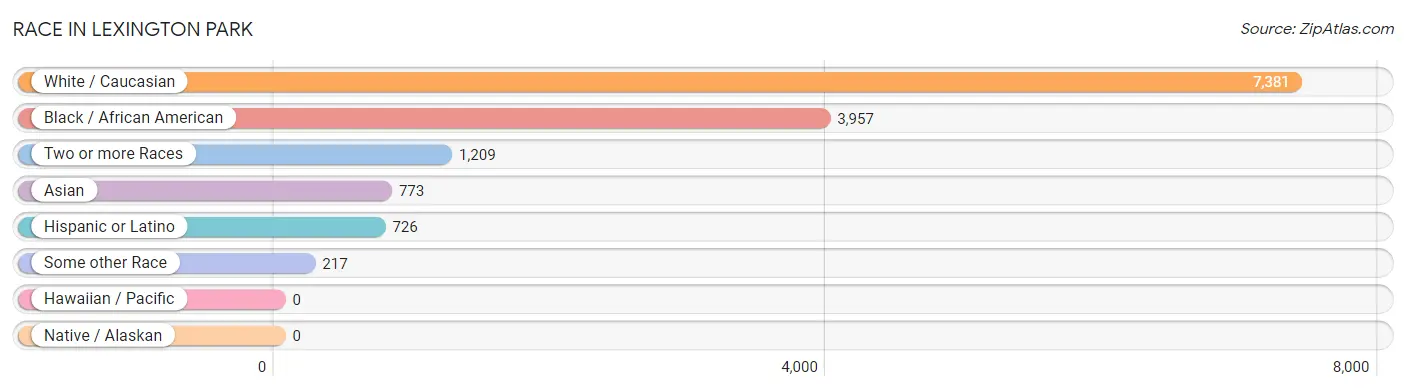
| Race | # Population | % Population |
| Asian | 773 | 5.7% |
| Black / African American | 3,957 | 29.2% |
| Hawaiian / Pacific | 0 | 0.0% |
| Hispanic or Latino | 726 | 5.4% |
| Native / Alaskan | 0 | 0.0% |
| White / Caucasian | 7,381 | 54.5% |
| Two or more Races | 1,209 | 8.9% |
| Some other Race | 217 | 1.6% |
| Total | 13,537 | 100.0% |
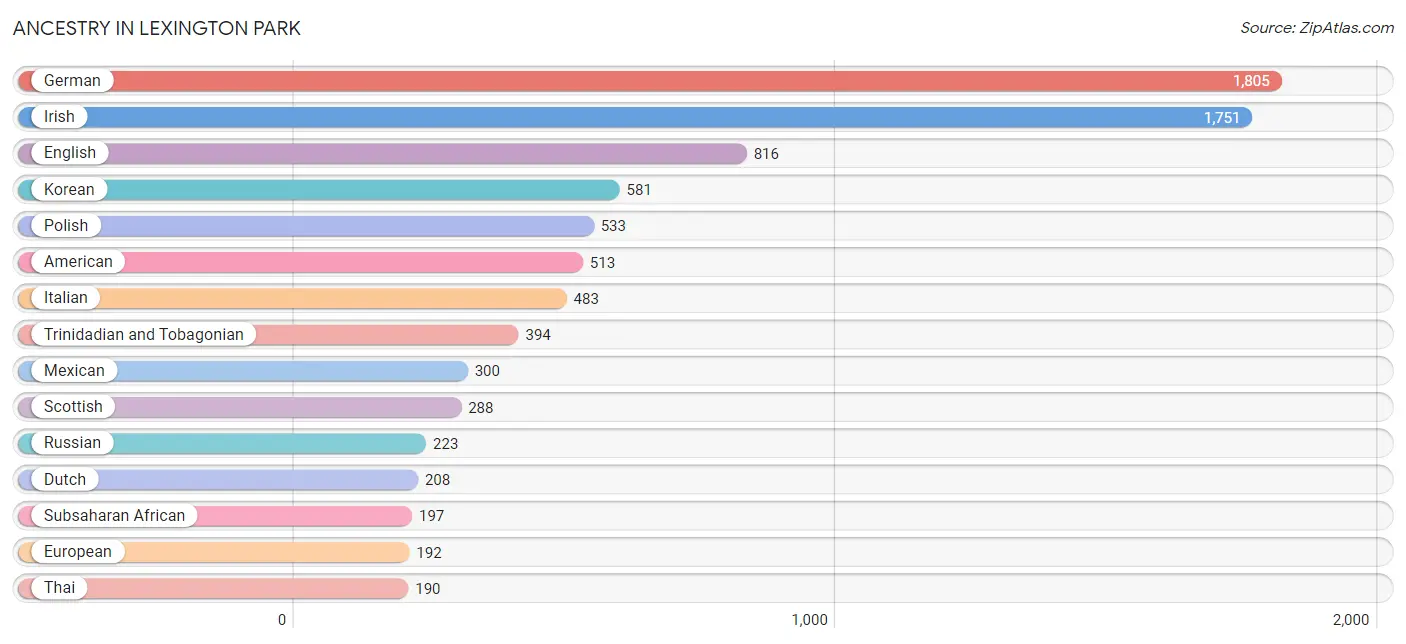
Ancestry in Lexington Park
The most populous ancestries reported in Lexington Park are German (1,805 | 13.3%), Irish (1,751 | 12.9%), English (816 | 6.0%), Korean (581 | 4.3%), and Polish (533 | 3.9%), together accounting for 40.5% of all Lexington Park residents.
| Ancestry | # Population | % Population |
| African | 171 | 1.3% |
| American | 513 | 3.8% |
| Armenian | 13 | 0.1% |
| Austrian | 6 | 0.0% |
| Belgian | 14 | 0.1% |
| Bhutanese | 157 | 1.2% |
| Bolivian | 32 | 0.2% |
| British | 92 | 0.7% |
| Central American | 128 | 0.9% |
| Central American Indian | 19 | 0.1% |
| Colombian | 50 | 0.4% |
| Cuban | 14 | 0.1% |
| Czech | 137 | 1.0% |
| Dutch | 208 | 1.5% |
| Eastern European | 40 | 0.3% |
| English | 816 | 6.0% |
| European | 192 | 1.4% |
| French | 164 | 1.2% |
| French Canadian | 32 | 0.2% |
| German | 1,805 | 13.3% |
| Greek | 15 | 0.1% |
| Guyanese | 11 | 0.1% |
| Haitian | 69 | 0.5% |
| Hungarian | 138 | 1.0% |
| Indian (Asian) | 17 | 0.1% |
| Irish | 1,751 | 12.9% |
| Italian | 483 | 3.6% |
| Jamaican | 85 | 0.6% |
| Korean | 581 | 4.3% |
| Latvian | 16 | 0.1% |
| Liberian | 26 | 0.2% |
| Lithuanian | 35 | 0.3% |
| Mexican | 300 | 2.2% |
| Native Hawaiian | 17 | 0.1% |
| Northern European | 19 | 0.1% |
| Norwegian | 93 | 0.7% |
| Pakistani | 22 | 0.2% |
| Polish | 533 | 3.9% |
| Portuguese | 31 | 0.2% |
| Puerto Rican | 131 | 1.0% |
| Russian | 223 | 1.7% |
| Salvadoran | 128 | 0.9% |
| Scandinavian | 39 | 0.3% |
| Scotch-Irish | 136 | 1.0% |
| Scottish | 288 | 2.1% |
| Slavic | 41 | 0.3% |
| South American | 87 | 0.6% |
| Spaniard | 50 | 0.4% |
| Sri Lankan | 78 | 0.6% |
| Subsaharan African | 197 | 1.5% |
| Swedish | 40 | 0.3% |
| Thai | 190 | 1.4% |
| Trinidadian and Tobagonian | 394 | 2.9% |
| Ukrainian | 13 | 0.1% |
| Venezuelan | 5 | 0.0% |
| Welsh | 142 | 1.1% |
| West Indian | 11 | 0.1% | View All 57 Rows |
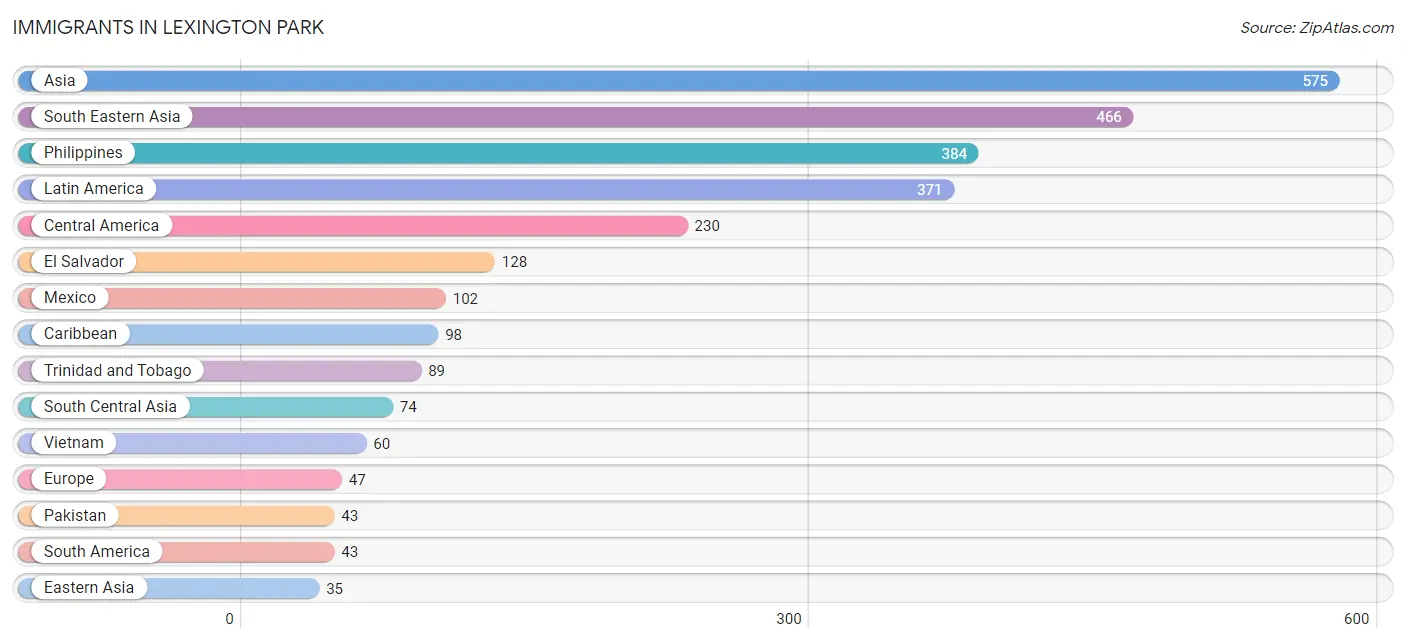
Immigrants in Lexington Park
The most numerous immigrant groups reported in Lexington Park came from Asia (575 | 4.3%), South Eastern Asia (466 | 3.4%), Philippines (384 | 2.8%), Latin America (371 | 2.7%), and Central America (230 | 1.7%), together accounting for 15.0% of all Lexington Park residents.
| Immigration Origin | # Population | % Population |
| Africa | 14 | 0.1% |
| Asia | 575 | 4.3% |
| Bolivia | 11 | 0.1% |
| Caribbean | 98 | 0.7% |
| Central America | 230 | 1.7% |
| Colombia | 27 | 0.2% |
| Eastern Asia | 35 | 0.3% |
| El Salvador | 128 | 0.9% |
| Europe | 47 | 0.4% |
| Germany | 20 | 0.2% |
| India | 10 | 0.1% |
| Jamaica | 9 | 0.1% |
| Japan | 35 | 0.3% |
| Latin America | 371 | 2.7% |
| Liberia | 14 | 0.1% |
| Mexico | 102 | 0.7% |
| Nepal | 21 | 0.2% |
| Netherlands | 12 | 0.1% |
| Northern Europe | 15 | 0.1% |
| Pakistan | 43 | 0.3% |
| Philippines | 384 | 2.8% |
| South America | 43 | 0.3% |
| South Central Asia | 74 | 0.5% |
| South Eastern Asia | 466 | 3.4% |
| Thailand | 22 | 0.2% |
| Trinidad and Tobago | 89 | 0.7% |
| Venezuela | 5 | 0.0% |
| Vietnam | 60 | 0.4% |
| Western Africa | 14 | 0.1% |
| Western Europe | 32 | 0.2% | View All 30 Rows |
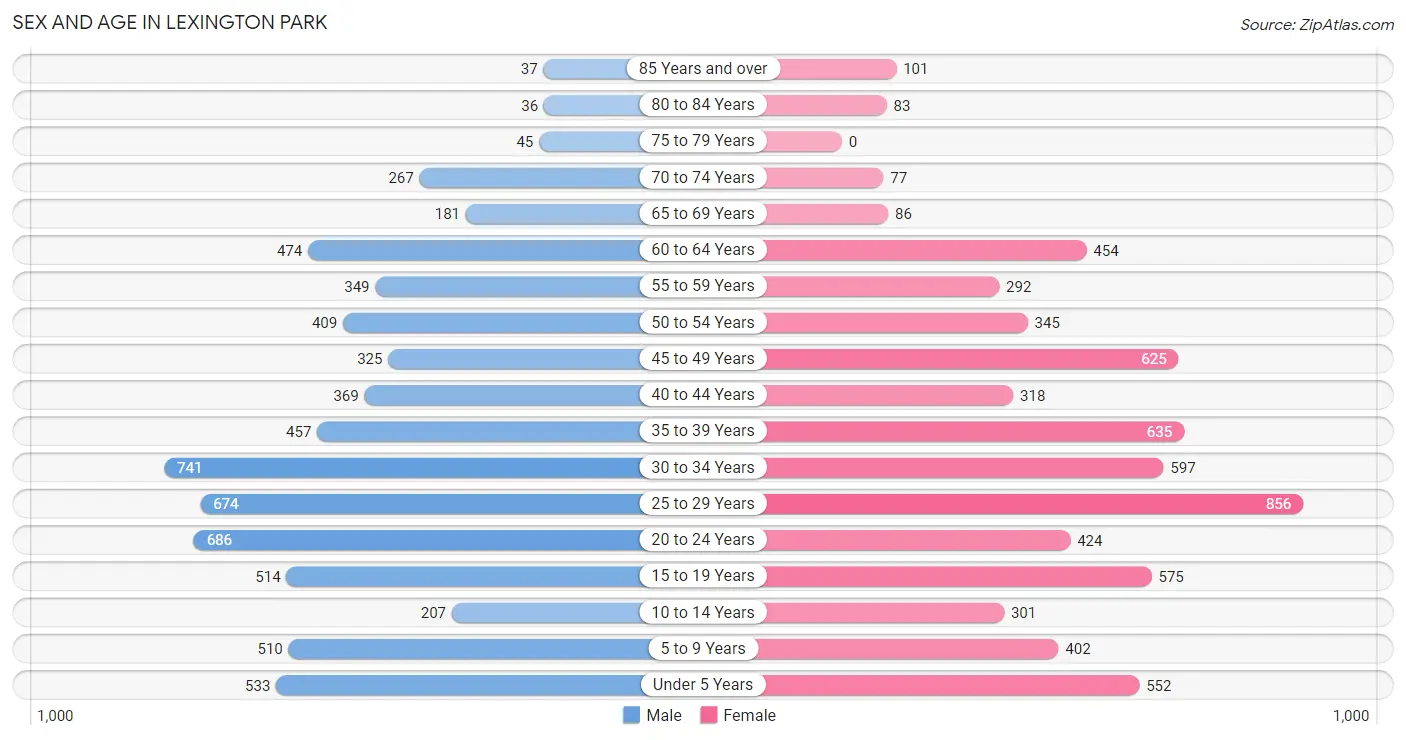
Sex and Age in Lexington Park
Sex and Age in Lexington Park
The most populous age groups in Lexington Park are 30 to 34 Years (741 | 10.9%) for men and 25 to 29 Years (856 | 12.7%) for women.
| Age Bracket | Male | Female |
| Under 5 Years | 533 (7.8%) | 552 (8.2%) |
| 5 to 9 Years | 510 (7.5%) | 402 (6.0%) |
| 10 to 14 Years | 207 (3.0%) | 301 (4.5%) |
| 15 to 19 Years | 514 (7.5%) | 575 (8.6%) |
| 20 to 24 Years | 686 (10.1%) | 424 (6.3%) |
| 25 to 29 Years | 674 (9.9%) | 856 (12.7%) |
| 30 to 34 Years | 741 (10.9%) | 597 (8.9%) |
| 35 to 39 Years | 457 (6.7%) | 635 (9.5%) |
| 40 to 44 Years | 369 (5.4%) | 318 (4.7%) |
| 45 to 49 Years | 325 (4.8%) | 625 (9.3%) |
| 50 to 54 Years | 409 (6.0%) | 345 (5.1%) |
| 55 to 59 Years | 349 (5.1%) | 292 (4.3%) |
| 60 to 64 Years | 474 (7.0%) | 454 (6.8%) |
| 65 to 69 Years | 181 (2.7%) | 86 (1.3%) |
| 70 to 74 Years | 267 (3.9%) | 77 (1.1%) |
| 75 to 79 Years | 45 (0.7%) | 0 (0.0%) |
| 80 to 84 Years | 36 (0.5%) | 83 (1.2%) |
| 85 Years and over | 37 (0.5%) | 101 (1.5%) |
| Total | 6,814 (100.0%) | 6,723 (100.0%) |
Families and Households in Lexington Park
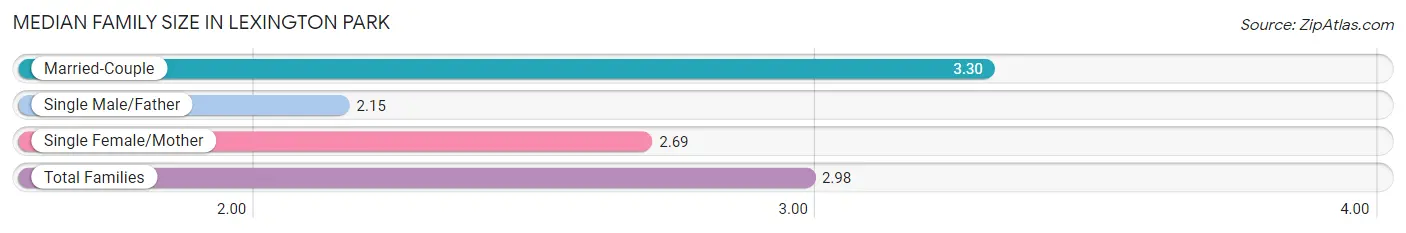
Median Family Size in Lexington Park
The median family size in Lexington Park is 2.98 persons per family, with married-couple families (1,896 | 54.2%) accounting for the largest median family size of 3.3 persons per family. On the other hand, single male/father families (278 | 8.0%) represent the smallest median family size with 2.15 persons per family.
| Family Type | # Families | Family Size |
| Married-Couple | 1,896 (54.2%) | 3.30 |
| Single Male/Father | 278 (8.0%) | 2.15 |
| Single Female/Mother | 1,325 (37.9%) | 2.69 |
| Total Families | 3,499 (100.0%) | 2.98 |
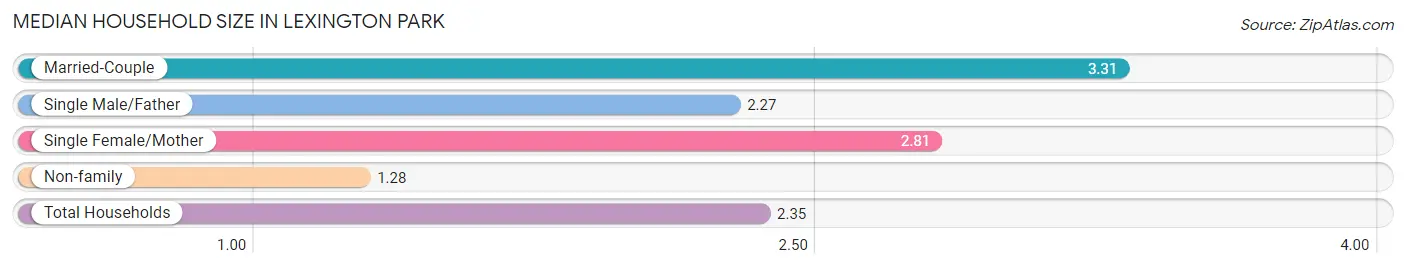
Median Household Size in Lexington Park
The median household size in Lexington Park is 2.35 persons per household, with married-couple households (1,896 | 33.1%) accounting for the largest median household size of 3.31 persons per household. non-family households (2,233 | 39.0%) represent the smallest median household size with 1.28 persons per household.
| Household Type | # Households | Household Size |
| Married-Couple | 1,896 (33.1%) | 3.31 |
| Single Male/Father | 278 (4.9%) | 2.27 |
| Single Female/Mother | 1,325 (23.1%) | 2.81 |
| Non-family | 2,233 (39.0%) | 1.28 |
| Total Households | 5,732 (100.0%) | 2.35 |
Household Size by Marriage Status in Lexington Park
Out of a total of 5,732 households in Lexington Park, 3,499 (61.0%) are family households, while 2,233 (39.0%) are nonfamily households. The most numerous type of family households are 2-person households, comprising 1,335, and the most common type of nonfamily households are 1-person households, comprising 1,749.
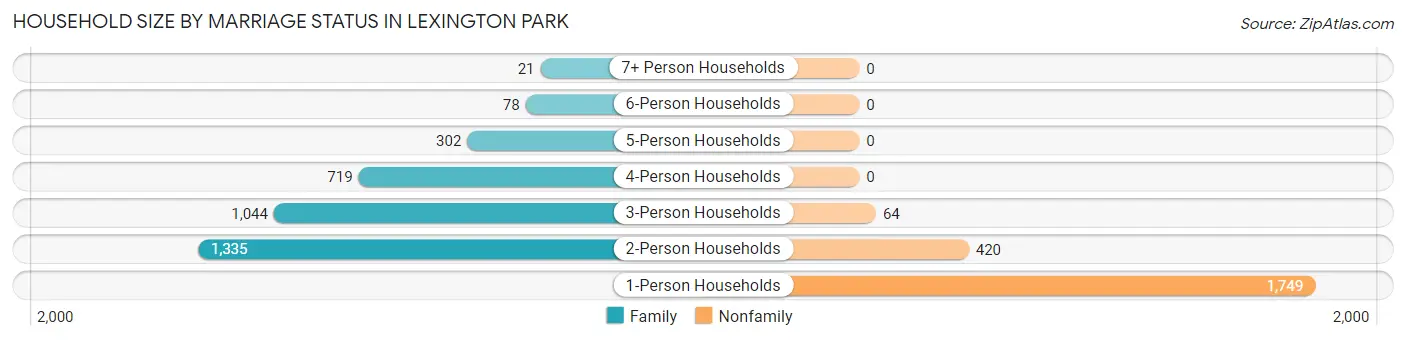
| Household Size | Family Households | Nonfamily Households |
| 1-Person Households | - | 1,749 (30.5%) |
| 2-Person Households | 1,335 (23.3%) | 420 (7.3%) |
| 3-Person Households | 1,044 (18.2%) | 64 (1.1%) |
| 4-Person Households | 719 (12.5%) | 0 (0.0%) |
| 5-Person Households | 302 (5.3%) | 0 (0.0%) |
| 6-Person Households | 78 (1.4%) | 0 (0.0%) |
| 7+ Person Households | 21 (0.4%) | 0 (0.0%) |
| Total | 3,499 (61.0%) | 2,233 (39.0%) |
Female Fertility in Lexington Park
Fertility by Age in Lexington Park
Average fertility rate in Lexington Park is 63.0 births per 1,000 women. Women in the age bracket of 20 to 34 years have the highest fertility rate with 137.0 births per 1,000 women. Women in the age bracket of 20 to 34 years acount for 97.7% of all women with births.
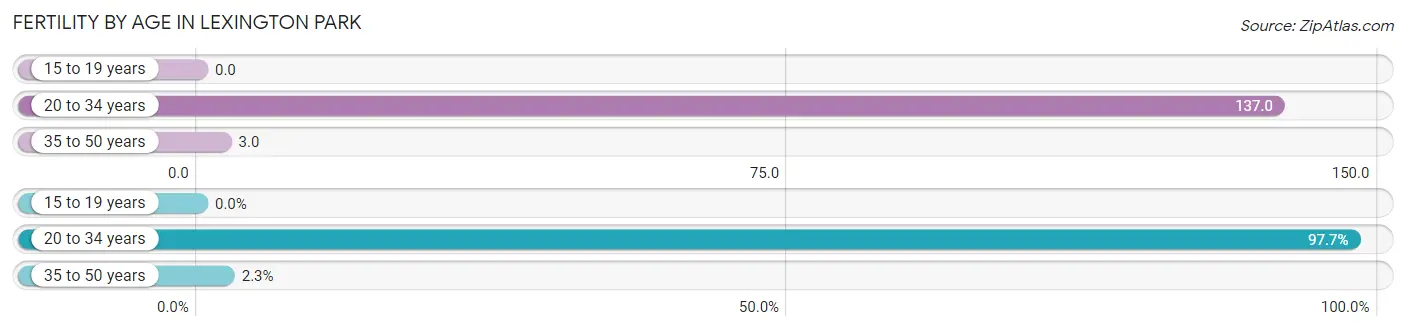
| Age Bracket | Women with Births | Births / 1,000 Women |
| 15 to 19 years | 0 (0.0%) | 0.0 |
| 20 to 34 years | 258 (97.7%) | 137.0 |
| 35 to 50 years | 6 (2.3%) | 3.0 |
| Total | 264 (100.0%) | 63.0 |
Fertility by Age by Marriage Status in Lexington Park
49.6% of women with births (264) in Lexington Park are married. The highest percentage of unmarried women with births falls into 20 to 34 years age bracket with 51.5% of them unmarried at the time of birth, while the lowest percentage of unmarried women with births belong to 35 to 50 years age bracket with 0.0% of them unmarried.
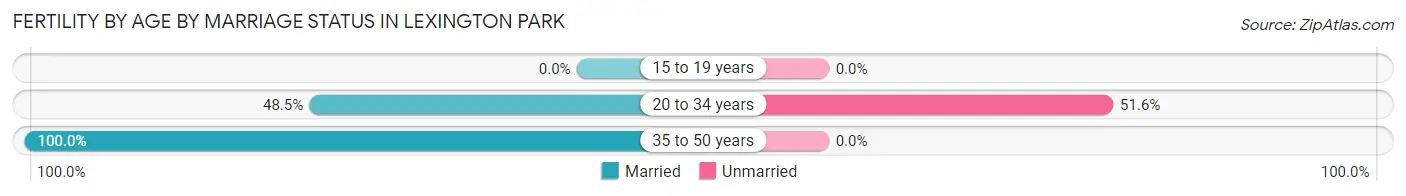
| Age Bracket | Married | Unmarried |
| 15 to 19 years | 0 (0.0%) | 0 (0.0%) |
| 20 to 34 years | 125 (48.4%) | 133 (51.5%) |
| 35 to 50 years | 6 (100.0%) | 0 (0.0%) |
| Total | 131 (49.6%) | 133 (50.4%) |
Fertility by Education in Lexington Park
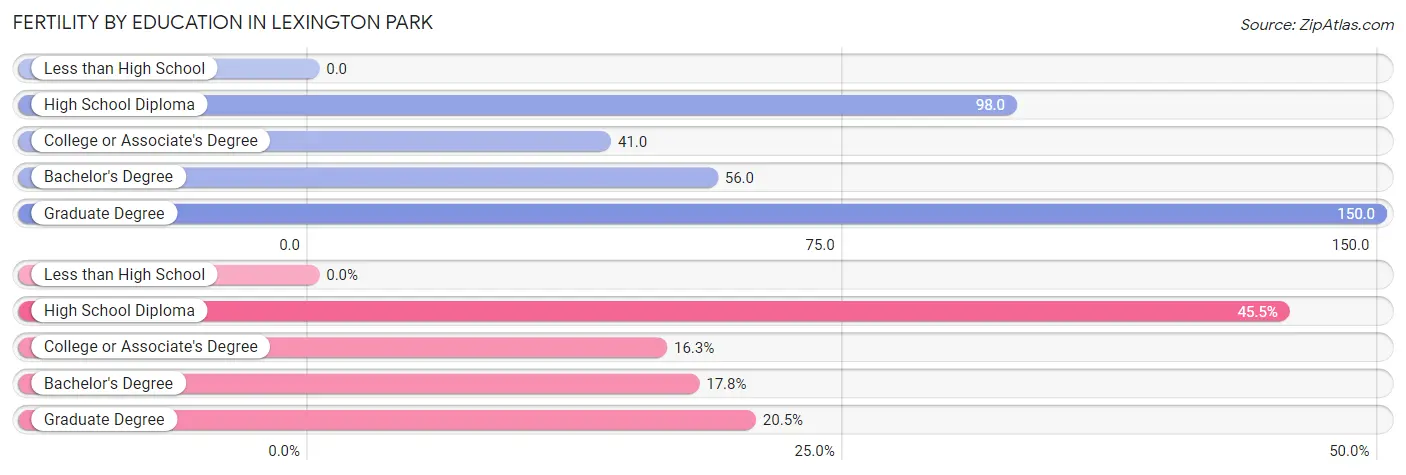
| Educational Attainment | Women with Births | Births / 1,000 Women |
| Less than High School | 0 (0.0%) | 0.0 |
| High School Diploma | 120 (45.5%) | 98.0 |
| College or Associate's Degree | 43 (16.3%) | 41.0 |
| Bachelor's Degree | 47 (17.8%) | 56.0 |
| Graduate Degree | 54 (20.4%) | 150.0 |
| Total | 264 (100.0%) | 63.0 |
Fertility by Education by Marriage Status in Lexington Park
50.4% of women with births in Lexington Park are unmarried. Women with the educational attainment of college or associate's degree are most likely to be married with 100.0% of them married at childbirth, while women with the educational attainment of high school diploma are least likely to be married with 100.0% of them unmarried at childbirth.
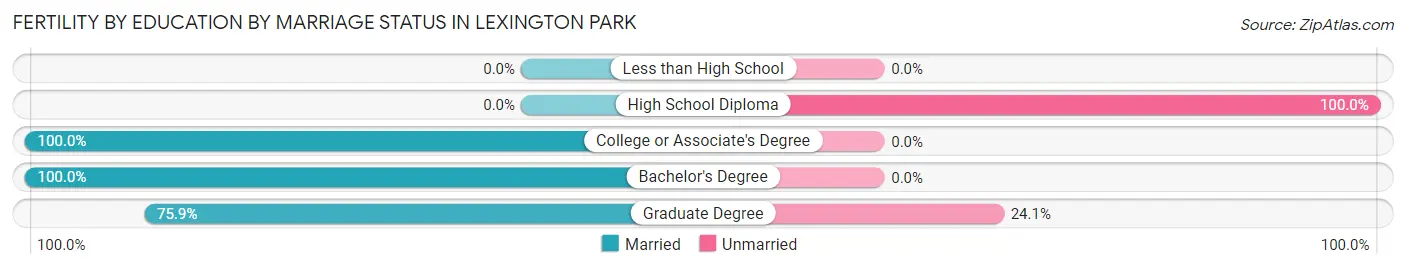
| Educational Attainment | Married | Unmarried |
| Less than High School | 0 (0.0%) | 0 (0.0%) |
| High School Diploma | 0 (0.0%) | 120 (100.0%) |
| College or Associate's Degree | 43 (100.0%) | 0 (0.0%) |
| Bachelor's Degree | 47 (100.0%) | 0 (0.0%) |
| Graduate Degree | 41 (75.9%) | 13 (24.1%) |
| Total | 131 (49.6%) | 133 (50.4%) |
Employment Characteristics in Lexington Park
Employment by Class of Employer in Lexington Park
Among the 7,678 employed individuals in Lexington Park, private company employees (4,294 | 55.9%), federal government employees (2,418 | 31.5%), and local government employees (375 | 4.9%) make up the most common classes of employment.
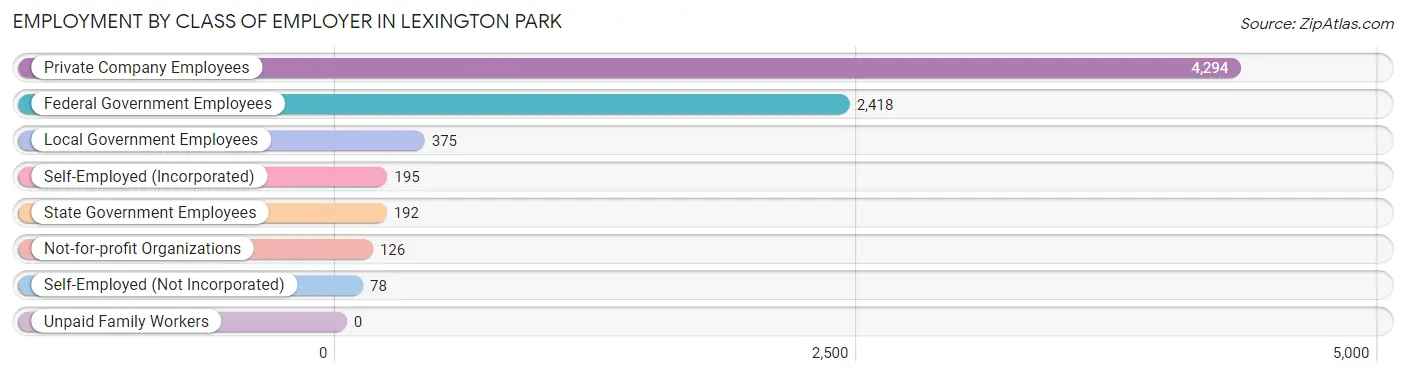
| Employer Class | # Employees | % Employees |
| Private Company Employees | 4,294 | 55.9% |
| Self-Employed (Incorporated) | 195 | 2.5% |
| Self-Employed (Not Incorporated) | 78 | 1.0% |
| Not-for-profit Organizations | 126 | 1.6% |
| Local Government Employees | 375 | 4.9% |
| State Government Employees | 192 | 2.5% |
| Federal Government Employees | 2,418 | 31.5% |
| Unpaid Family Workers | 0 | 0.0% |
| Total | 7,678 | 100.0% |
Employment Status by Age in Lexington Park
According to the labor force statistics for Lexington Park, out of the total population over 16 years of age (10,898), 74.1% or 8,075 individuals are in the labor force, with 4.1% or 331 of them unemployed. The age group with the highest labor force participation rate is 20 to 24 years, with 90.6% or 1,006 individuals in the labor force. Within the labor force, the 20 to 24 years age range has the highest percentage of unemployed individuals, with 12.2% or 123 of them being unemployed.
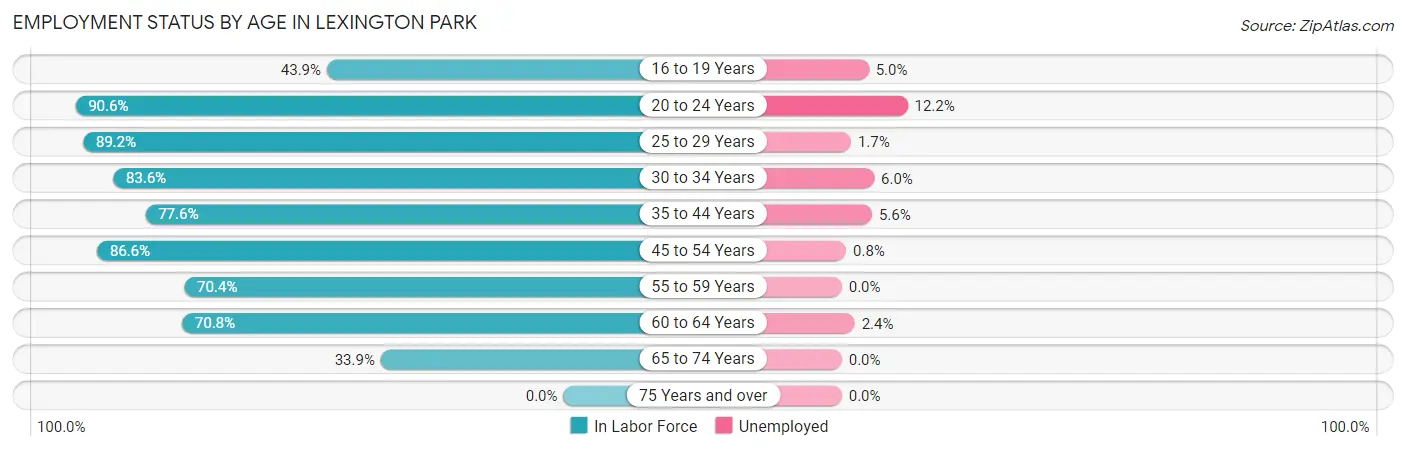
| Age Bracket | In Labor Force | Unemployed |
| 16 to 19 Years | 419 (43.9%) | 21 (5.0%) |
| 20 to 24 Years | 1,006 (90.6%) | 123 (12.2%) |
| 25 to 29 Years | 1,365 (89.2%) | 23 (1.7%) |
| 30 to 34 Years | 1,119 (83.6%) | 67 (6.0%) |
| 35 to 44 Years | 1,381 (77.6%) | 77 (5.6%) |
| 45 to 54 Years | 1,476 (86.6%) | 12 (0.8%) |
| 55 to 59 Years | 451 (70.4%) | 0 (0.0%) |
| 60 to 64 Years | 657 (70.8%) | 16 (2.4%) |
| 65 to 74 Years | 207 (33.9%) | 0 (0.0%) |
| 75 Years and over | 0 (0.0%) | 0 (0.0%) |
| Total | 8,075 (74.1%) | 331 (4.1%) |
Employment Status by Educational Attainment in Lexington Park
According to labor force statistics for Lexington Park, 81.4% of individuals (6,447) out of the total population between 25 and 64 years of age (7,920) are in the labor force, with 3.0% or 193 of them being unemployed. The group with the highest labor force participation rate are those with the educational attainment of bachelor's degree or higher, with 87.0% or 2,379 individuals in the labor force. Within the labor force, individuals with less than high school education have the highest percentage of unemployment, with 16.0% or 75 of them being unemployed.
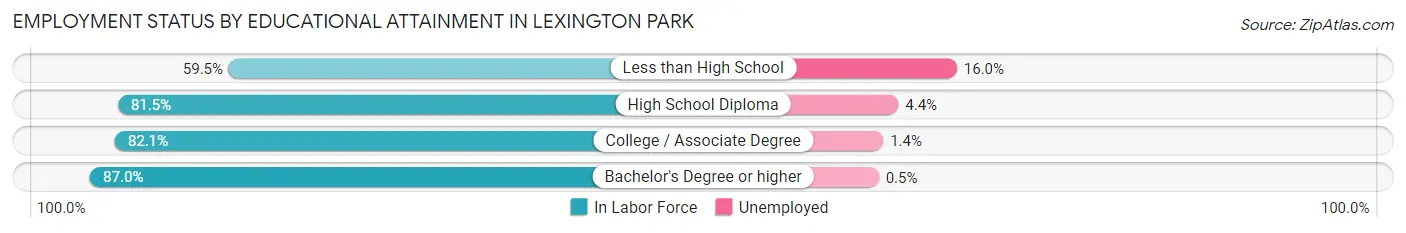
| Educational Attainment | In Labor Force | Unemployed |
| Less than High School | 468 (59.5%) | 126 (16.0%) |
| High School Diploma | 1,710 (81.5%) | 92 (4.4%) |
| College / Associate Degree | 1,889 (82.1%) | 32 (1.4%) |
| Bachelor's Degree or higher | 2,379 (87.0%) | 14 (0.5%) |
| Total | 6,447 (81.4%) | 238 (3.0%) |
Employment Occupations by Sex in Lexington Park
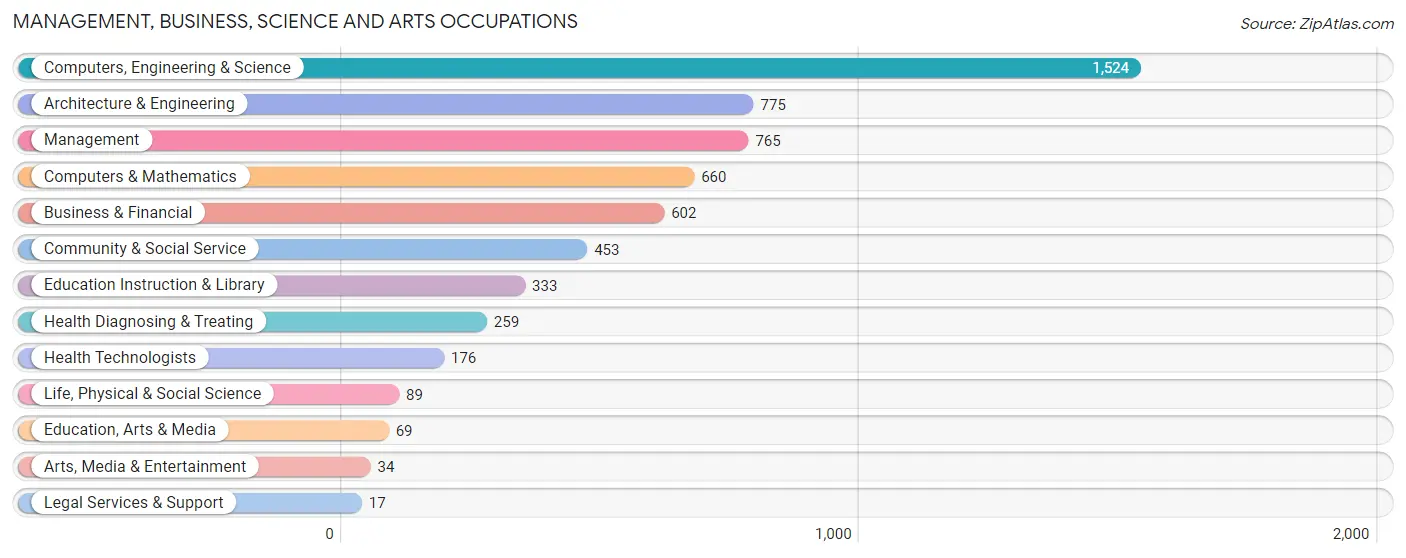
Management, Business, Science and Arts Occupations
The most common Management, Business, Science and Arts occupations in Lexington Park are Computers, Engineering & Science (1,524 | 20.5%), Architecture & Engineering (775 | 10.4%), Management (765 | 10.3%), Computers & Mathematics (660 | 8.9%), and Business & Financial (602 | 8.1%).
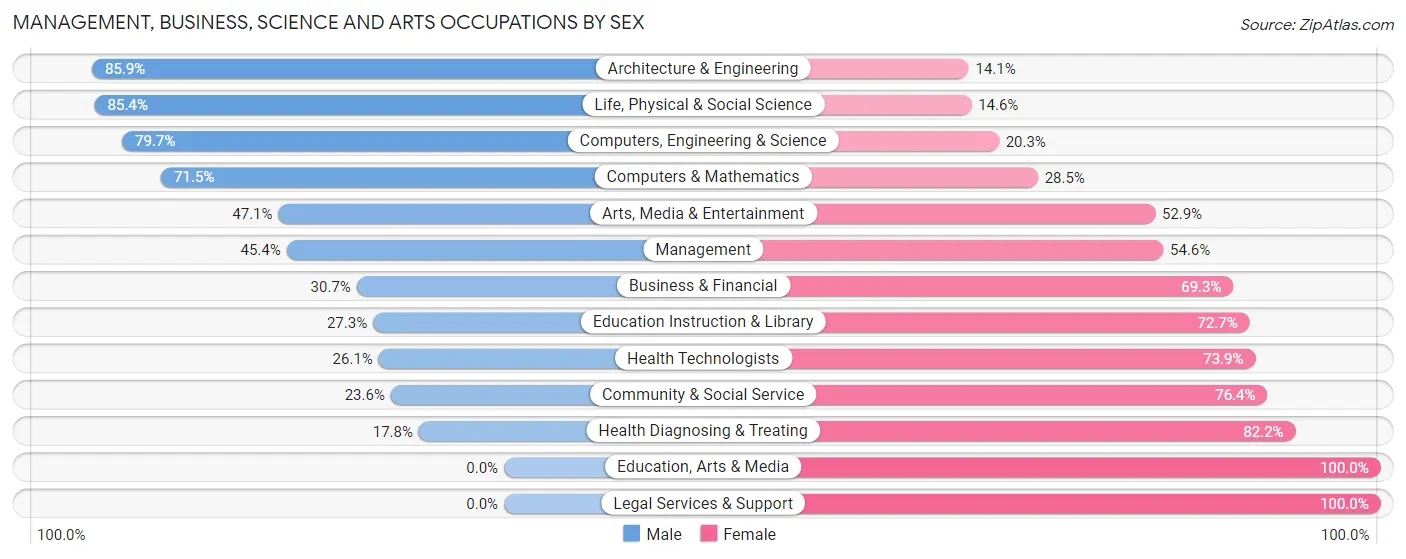
Management, Business, Science and Arts Occupations by Sex
Within the Management, Business, Science and Arts occupations in Lexington Park, the most male-oriented occupations are Architecture & Engineering (85.9%), Life, Physical & Social Science (85.4%), and Computers, Engineering & Science (79.7%), while the most female-oriented occupations are Education, Arts & Media (100.0%), Legal Services & Support (100.0%), and Health Diagnosing & Treating (82.2%).
| Occupation | Male | Female |
| Management | 347 (45.4%) | 418 (54.6%) |
| Business & Financial | 185 (30.7%) | 417 (69.3%) |
| Computers, Engineering & Science | 1,214 (79.7%) | 310 (20.3%) |
| Computers & Mathematics | 472 (71.5%) | 188 (28.5%) |
| Architecture & Engineering | 666 (85.9%) | 109 (14.1%) |
| Life, Physical & Social Science | 76 (85.4%) | 13 (14.6%) |
| Community & Social Service | 107 (23.6%) | 346 (76.4%) |
| Education, Arts & Media | 0 (0.0%) | 69 (100.0%) |
| Legal Services & Support | 0 (0.0%) | 17 (100.0%) |
| Education Instruction & Library | 91 (27.3%) | 242 (72.7%) |
| Arts, Media & Entertainment | 16 (47.1%) | 18 (52.9%) |
| Health Diagnosing & Treating | 46 (17.8%) | 213 (82.2%) |
| Health Technologists | 46 (26.1%) | 130 (73.9%) |
| Total (Category) | 1,899 (52.7%) | 1,704 (47.3%) |
| Total (Overall) | 3,915 (52.6%) | 3,527 (47.4%) |
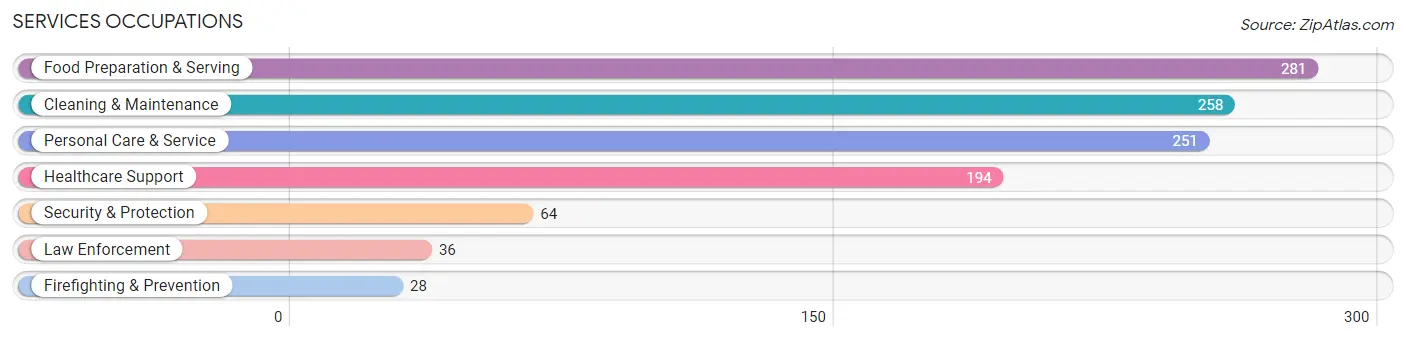
Services Occupations
The most common Services occupations in Lexington Park are Food Preparation & Serving (281 | 3.8%), Cleaning & Maintenance (258 | 3.5%), Personal Care & Service (251 | 3.4%), Healthcare Support (194 | 2.6%), and Security & Protection (64 | 0.9%).
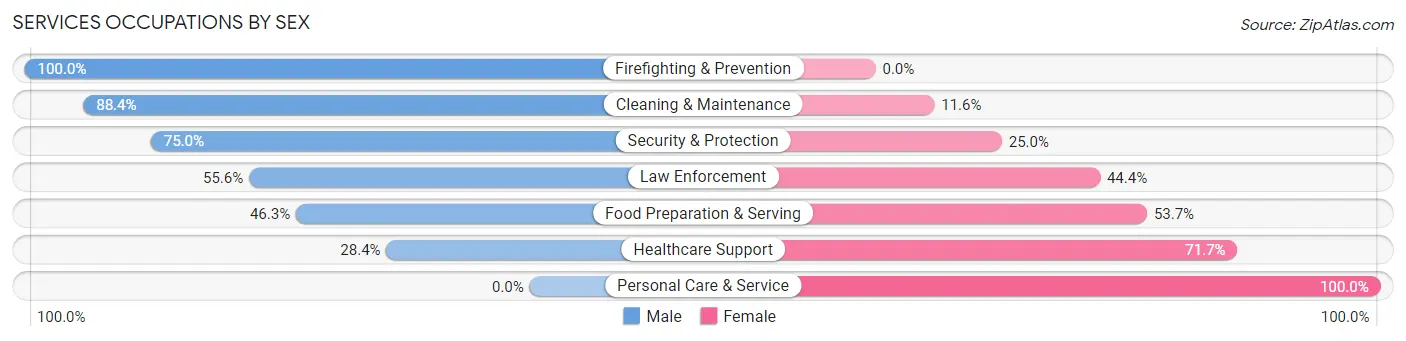
Services Occupations by Sex
Within the Services occupations in Lexington Park, the most male-oriented occupations are Firefighting & Prevention (100.0%), Cleaning & Maintenance (88.4%), and Security & Protection (75.0%), while the most female-oriented occupations are Personal Care & Service (100.0%), Healthcare Support (71.7%), and Food Preparation & Serving (53.7%).
| Occupation | Male | Female |
| Healthcare Support | 55 (28.3%) | 139 (71.7%) |
| Security & Protection | 48 (75.0%) | 16 (25.0%) |
| Firefighting & Prevention | 28 (100.0%) | 0 (0.0%) |
| Law Enforcement | 20 (55.6%) | 16 (44.4%) |
| Food Preparation & Serving | 130 (46.3%) | 151 (53.7%) |
| Cleaning & Maintenance | 228 (88.4%) | 30 (11.6%) |
| Personal Care & Service | 0 (0.0%) | 251 (100.0%) |
| Total (Category) | 461 (44.0%) | 587 (56.0%) |
| Total (Overall) | 3,915 (52.6%) | 3,527 (47.4%) |
Sales and Office Occupations
The most common Sales and Office occupations in Lexington Park are Sales & Related (905 | 12.2%), and Office & Administration (494 | 6.6%).
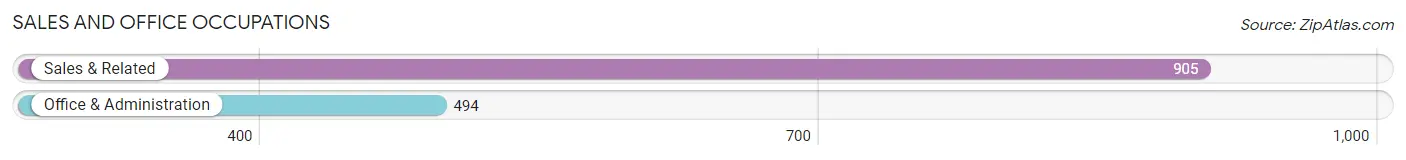
Sales and Office Occupations by Sex
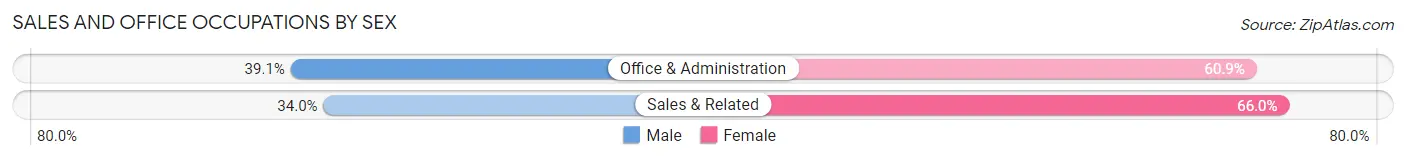
| Occupation | Male | Female |
| Sales & Related | 308 (34.0%) | 597 (66.0%) |
| Office & Administration | 193 (39.1%) | 301 (60.9%) |
| Total (Category) | 501 (35.8%) | 898 (64.2%) |
| Total (Overall) | 3,915 (52.6%) | 3,527 (47.4%) |
Natural Resources, Construction and Maintenance Occupations
The most common Natural Resources, Construction and Maintenance occupations in Lexington Park are Construction & Extraction (426 | 5.7%), and Installation, Maintenance & Repair (307 | 4.1%).
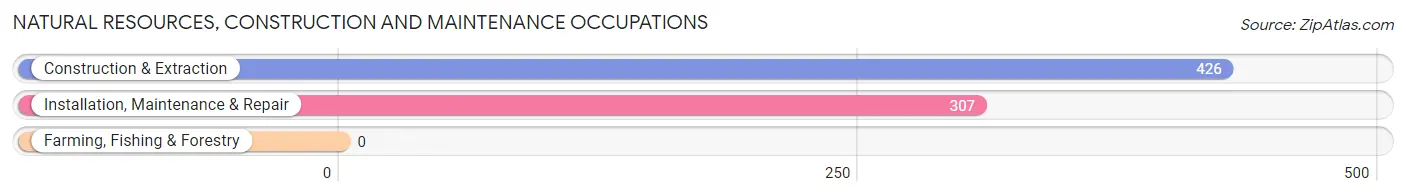
Natural Resources, Construction and Maintenance Occupations by Sex
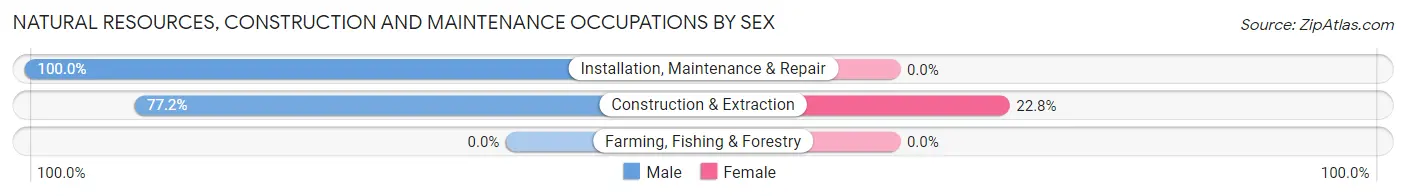
| Occupation | Male | Female |
| Farming, Fishing & Forestry | 0 (0.0%) | 0 (0.0%) |
| Construction & Extraction | 329 (77.2%) | 97 (22.8%) |
| Installation, Maintenance & Repair | 307 (100.0%) | 0 (0.0%) |
| Total (Category) | 636 (86.8%) | 97 (13.2%) |
| Total (Overall) | 3,915 (52.6%) | 3,527 (47.4%) |
Production, Transportation and Moving Occupations
The most common Production, Transportation and Moving occupations in Lexington Park are Transportation (294 | 4.0%), Material Moving (232 | 3.1%), and Production (133 | 1.8%).
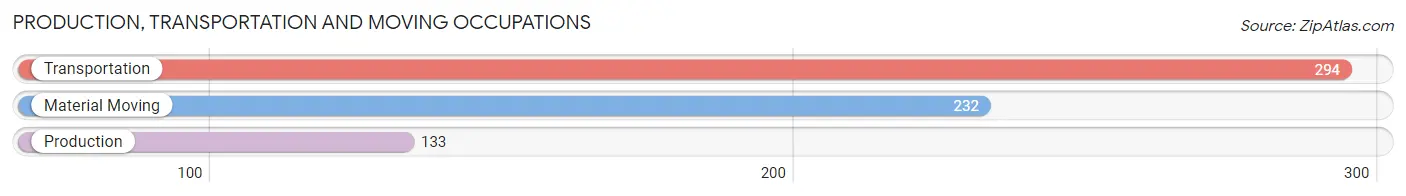
Production, Transportation and Moving Occupations by Sex
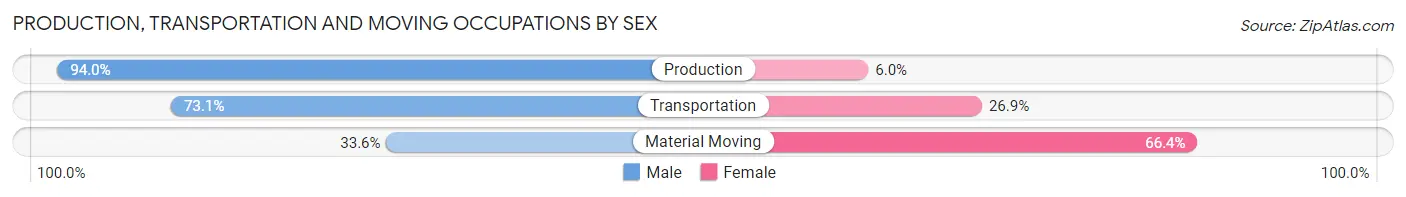
| Occupation | Male | Female |
| Production | 125 (94.0%) | 8 (6.0%) |
| Transportation | 215 (73.1%) | 79 (26.9%) |
| Material Moving | 78 (33.6%) | 154 (66.4%) |
| Total (Category) | 418 (63.4%) | 241 (36.6%) |
| Total (Overall) | 3,915 (52.6%) | 3,527 (47.4%) |
Employment Industries by Sex in Lexington Park
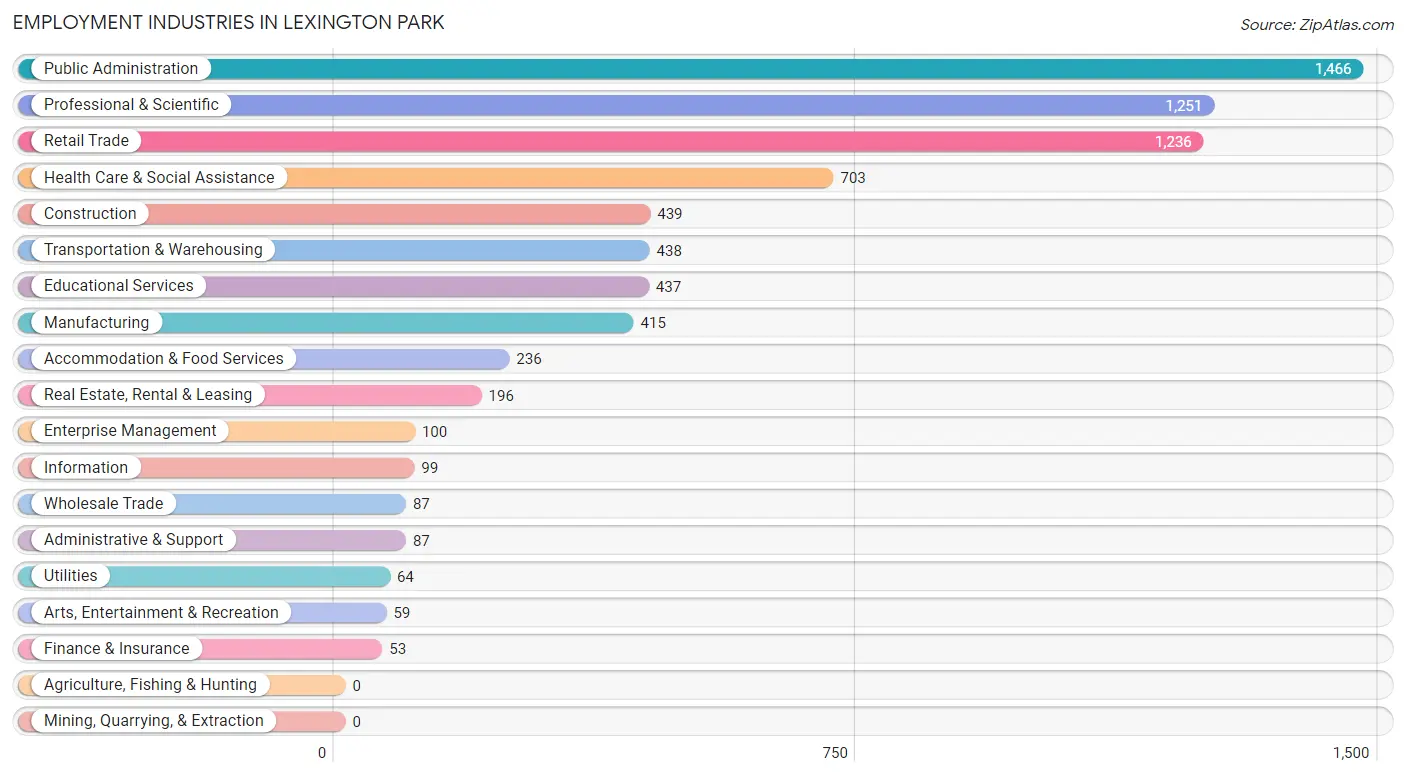
Employment Industries in Lexington Park
The major employment industries in Lexington Park include Public Administration (1,466 | 19.7%), Professional & Scientific (1,251 | 16.8%), Retail Trade (1,236 | 16.6%), Health Care & Social Assistance (703 | 9.5%), and Construction (439 | 5.9%).
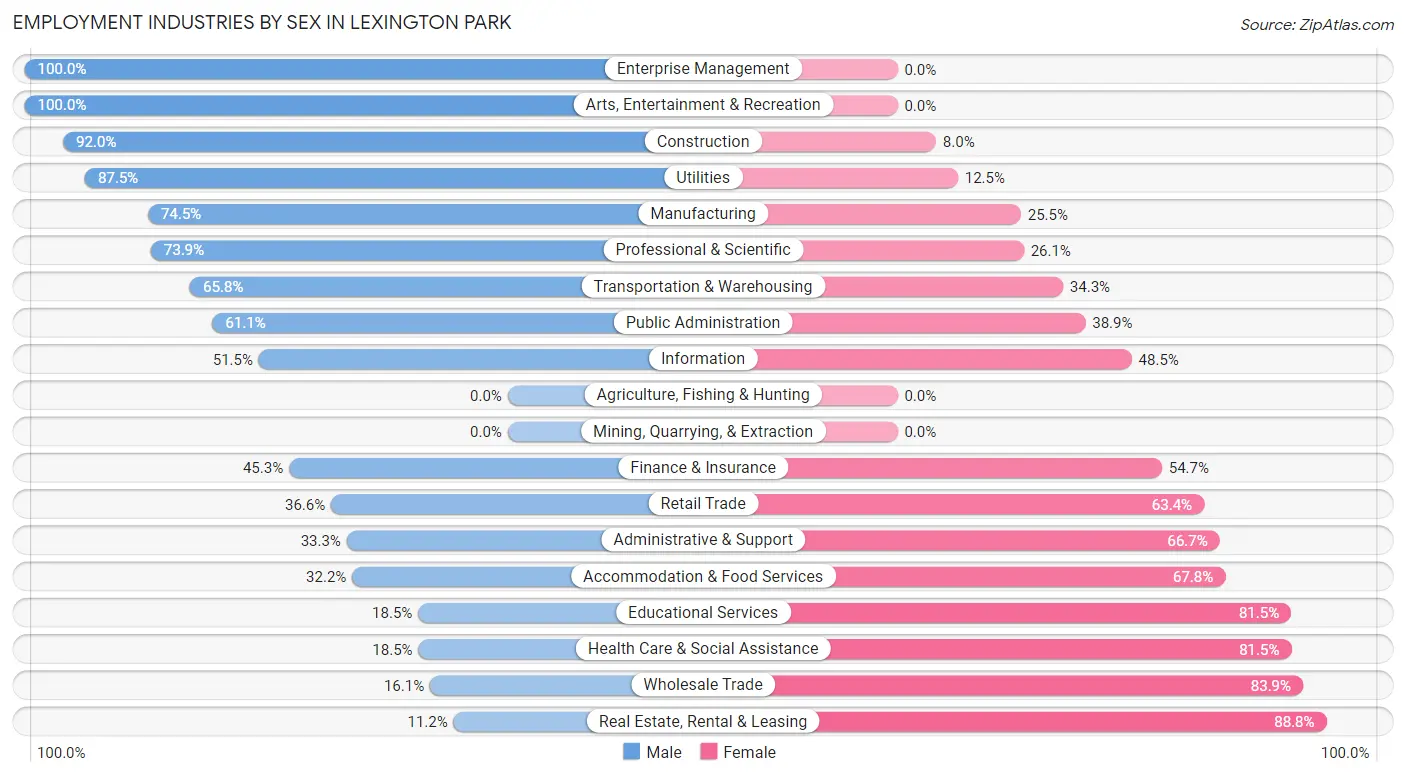
Employment Industries by Sex in Lexington Park
The Lexington Park industries that see more men than women are Enterprise Management (100.0%), Arts, Entertainment & Recreation (100.0%), and Construction (92.0%), whereas the industries that tend to have a higher number of women are Real Estate, Rental & Leasing (88.8%), Wholesale Trade (83.9%), and Health Care & Social Assistance (81.5%).
| Industry | Male | Female |
| Agriculture, Fishing & Hunting | 0 (0.0%) | 0 (0.0%) |
| Mining, Quarrying, & Extraction | 0 (0.0%) | 0 (0.0%) |
| Construction | 404 (92.0%) | 35 (8.0%) |
| Manufacturing | 309 (74.5%) | 106 (25.5%) |
| Wholesale Trade | 14 (16.1%) | 73 (83.9%) |
| Retail Trade | 452 (36.6%) | 784 (63.4%) |
| Transportation & Warehousing | 288 (65.7%) | 150 (34.3%) |
| Utilities | 56 (87.5%) | 8 (12.5%) |
| Information | 51 (51.5%) | 48 (48.5%) |
| Finance & Insurance | 24 (45.3%) | 29 (54.7%) |
| Real Estate, Rental & Leasing | 22 (11.2%) | 174 (88.8%) |
| Professional & Scientific | 924 (73.9%) | 327 (26.1%) |
| Enterprise Management | 100 (100.0%) | 0 (0.0%) |
| Administrative & Support | 29 (33.3%) | 58 (66.7%) |
| Educational Services | 81 (18.5%) | 356 (81.5%) |
| Health Care & Social Assistance | 130 (18.5%) | 573 (81.5%) |
| Arts, Entertainment & Recreation | 59 (100.0%) | 0 (0.0%) |
| Accommodation & Food Services | 76 (32.2%) | 160 (67.8%) |
| Public Administration | 896 (61.1%) | 570 (38.9%) |
| Total | 3,915 (52.6%) | 3,527 (47.4%) |
Education in Lexington Park
School Enrollment in Lexington Park
The most common levels of schooling among the 2,944 students in Lexington Park are high school (701 | 23.8%), college / undergraduate (606 | 20.6%), and elementary school (605 | 20.5%).
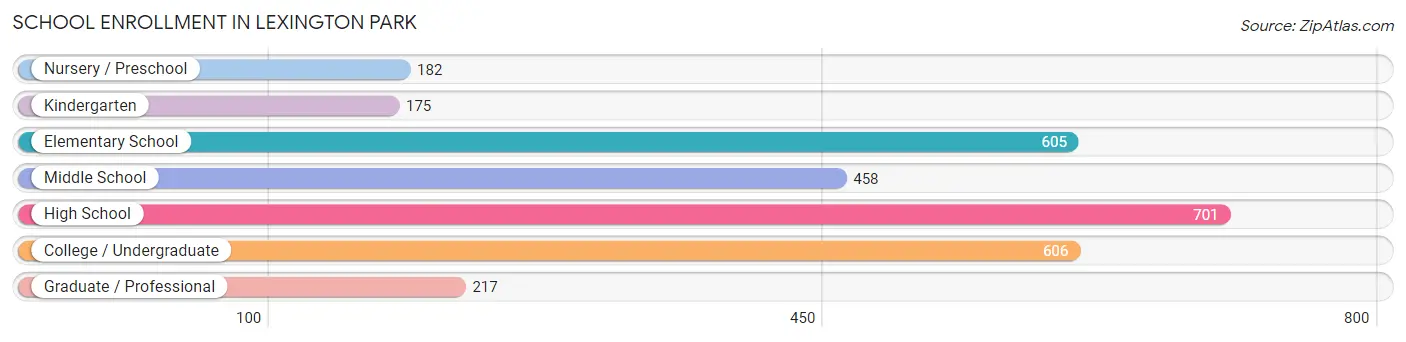
| School Level | # Students | % Students |
| Nursery / Preschool | 182 | 6.2% |
| Kindergarten | 175 | 5.9% |
| Elementary School | 605 | 20.5% |
| Middle School | 458 | 15.6% |
| High School | 701 | 23.8% |
| College / Undergraduate | 606 | 20.6% |
| Graduate / Professional | 217 | 7.4% |
| Total | 2,944 | 100.0% |
School Enrollment by Age by Funding Source in Lexington Park
Out of a total of 2,944 students who are enrolled in schools in Lexington Park, 321 (10.9%) attend a private institution, while the remaining 2,623 (89.1%) are enrolled in public schools. The age group of 35 years and over has the highest likelihood of being enrolled in private schools, with 91 (31.9% in the age bracket) enrolled. Conversely, the age group of 3 to 4 year olds has the lowest likelihood of being enrolled in a private school, with 104 (100.0% in the age bracket) attending a public institution.
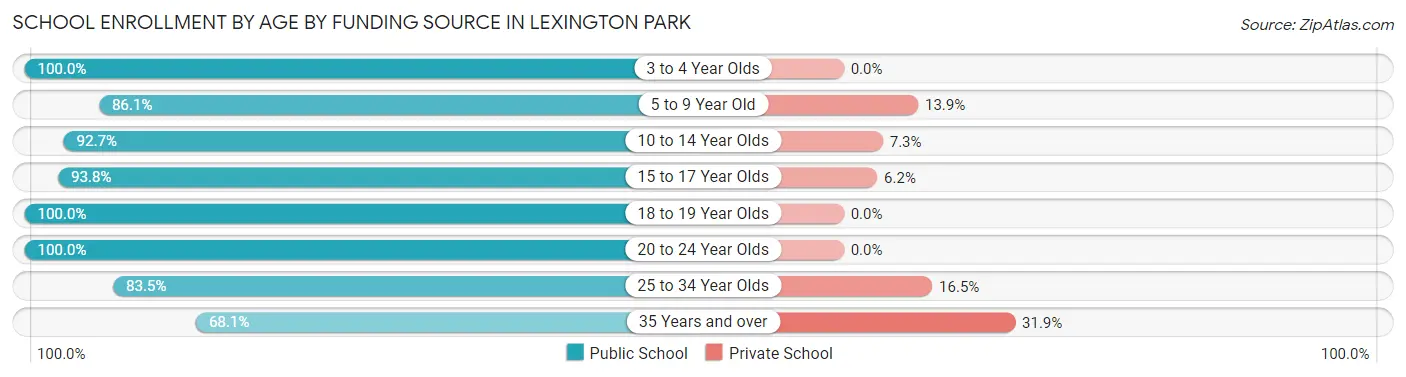
| Age Bracket | Public School | Private School |
| 3 to 4 Year Olds | 104 (100.0%) | 0 (0.0%) |
| 5 to 9 Year Old | 696 (86.1%) | 112 (13.9%) |
| 10 to 14 Year Olds | 471 (92.7%) | 37 (7.3%) |
| 15 to 17 Year Olds | 541 (93.8%) | 36 (6.2%) |
| 18 to 19 Year Olds | 291 (100.0%) | 0 (0.0%) |
| 20 to 24 Year Olds | 104 (100.0%) | 0 (0.0%) |
| 25 to 34 Year Olds | 223 (83.5%) | 44 (16.5%) |
| 35 Years and over | 194 (68.1%) | 91 (31.9%) |
| Total | 2,623 (89.1%) | 321 (10.9%) |
Educational Attainment by Field of Study in Lexington Park
Engineering (677 | 21.3%), business (396 | 12.4%), computers & mathematics (362 | 11.4%), arts & humanities (318 | 10.0%), and education (217 | 6.8%) are the most common fields of study among 3,181 individuals in Lexington Park who have obtained a bachelor's degree or higher.
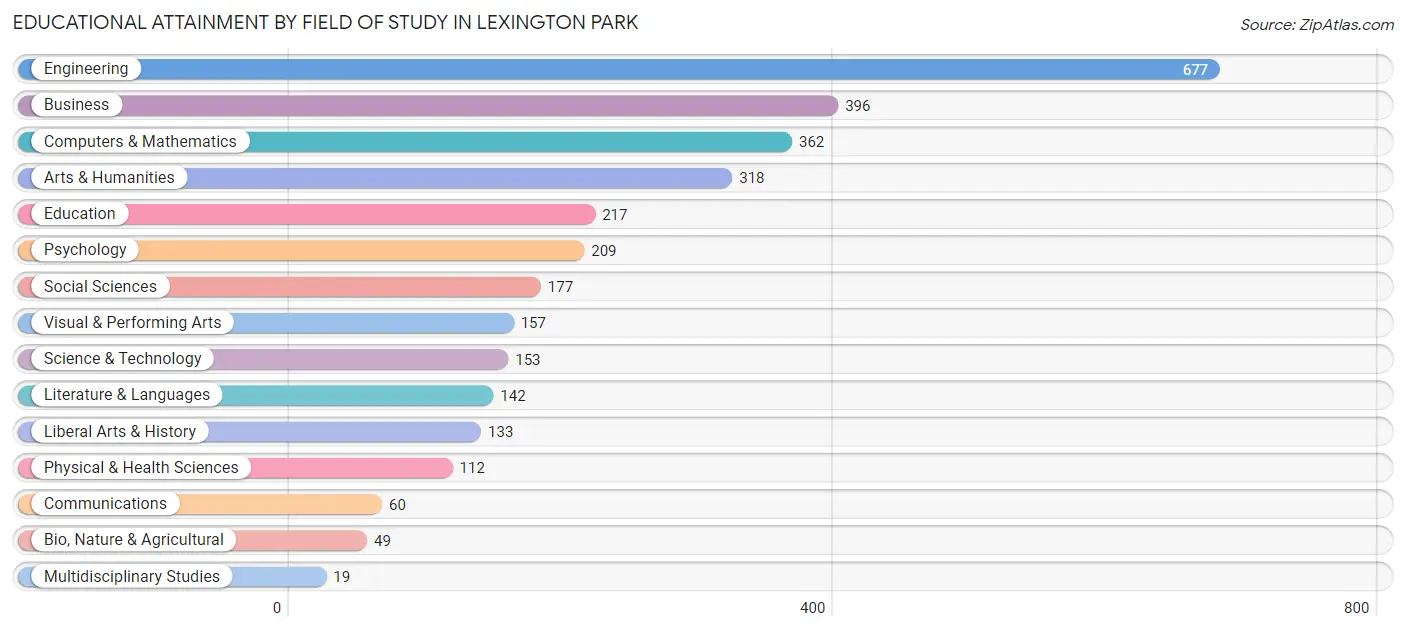
| Field of Study | # Graduates | % Graduates |
| Computers & Mathematics | 362 | 11.4% |
| Bio, Nature & Agricultural | 49 | 1.5% |
| Physical & Health Sciences | 112 | 3.5% |
| Psychology | 209 | 6.6% |
| Social Sciences | 177 | 5.6% |
| Engineering | 677 | 21.3% |
| Multidisciplinary Studies | 19 | 0.6% |
| Science & Technology | 153 | 4.8% |
| Business | 396 | 12.4% |
| Education | 217 | 6.8% |
| Literature & Languages | 142 | 4.5% |
| Liberal Arts & History | 133 | 4.2% |
| Visual & Performing Arts | 157 | 4.9% |
| Communications | 60 | 1.9% |
| Arts & Humanities | 318 | 10.0% |
| Total | 3,181 | 100.0% |
Transportation & Commute in Lexington Park
Vehicle Availability by Sex in Lexington Park
The most prevalent vehicle ownership categories in Lexington Park are males with 2 vehicles (1,857, accounting for 44.6%) and females with 2 vehicles (1,176, making up 52.9%).
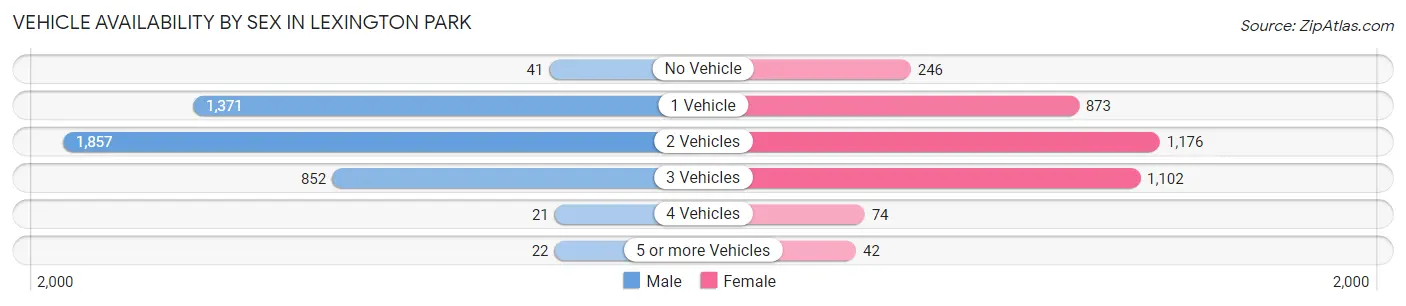
| Vehicles Available | Male | Female |
| No Vehicle | 41 (1.0%) | 246 (7.0%) |
| 1 Vehicle | 1,371 (32.9%) | 873 (24.8%) |
| 2 Vehicles | 1,857 (44.6%) | 1,176 (33.5%) |
| 3 Vehicles | 852 (20.5%) | 1,102 (31.4%) |
| 4 Vehicles | 21 (0.5%) | 74 (2.1%) |
| 5 or more Vehicles | 22 (0.5%) | 42 (1.2%) |
| Total | 4,164 (100.0%) | 3,513 (100.0%) |
Commute Time in Lexington Park
The most frequently occuring commute durations in Lexington Park are 15 to 19 minutes (2,081 commuters, 30.8%), 10 to 14 minutes (1,740 commuters, 25.8%), and 20 to 24 minutes (875 commuters, 13.0%).
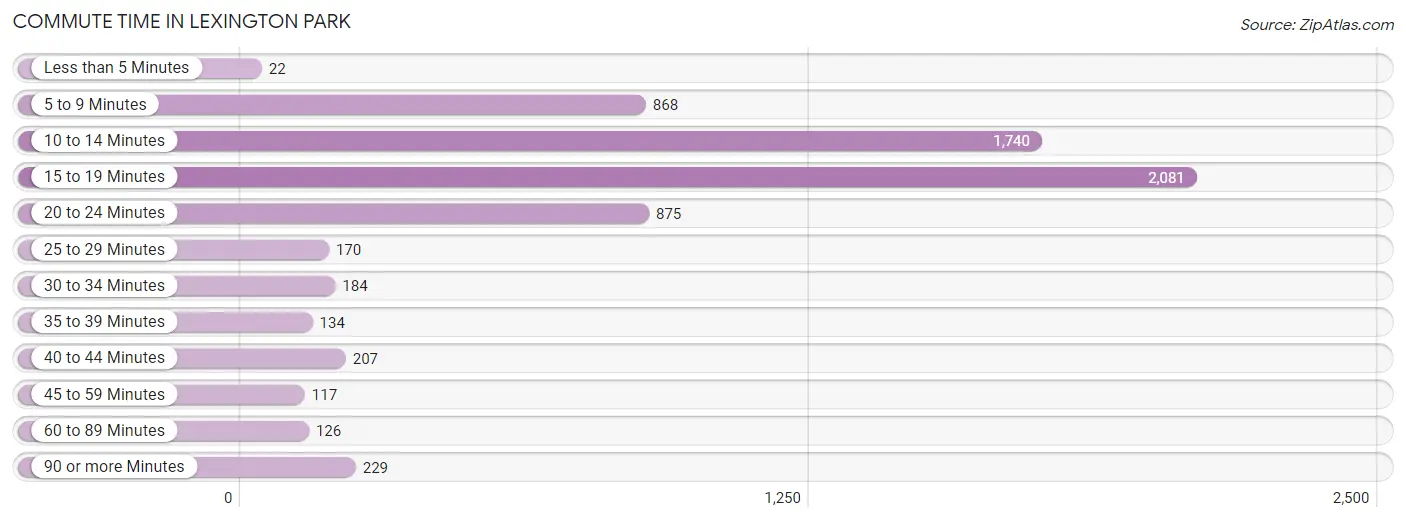
| Commute Time | # Commuters | % Commuters |
| Less than 5 Minutes | 22 | 0.3% |
| 5 to 9 Minutes | 868 | 12.9% |
| 10 to 14 Minutes | 1,740 | 25.8% |
| 15 to 19 Minutes | 2,081 | 30.8% |
| 20 to 24 Minutes | 875 | 13.0% |
| 25 to 29 Minutes | 170 | 2.5% |
| 30 to 34 Minutes | 184 | 2.7% |
| 35 to 39 Minutes | 134 | 2.0% |
| 40 to 44 Minutes | 207 | 3.1% |
| 45 to 59 Minutes | 117 | 1.7% |
| 60 to 89 Minutes | 126 | 1.9% |
| 90 or more Minutes | 229 | 3.4% |
Commute Time by Sex in Lexington Park
The most common commute times in Lexington Park are 15 to 19 minutes (1,252 commuters, 33.8%) for males and 10 to 14 minutes (874 commuters, 28.7%) for females.
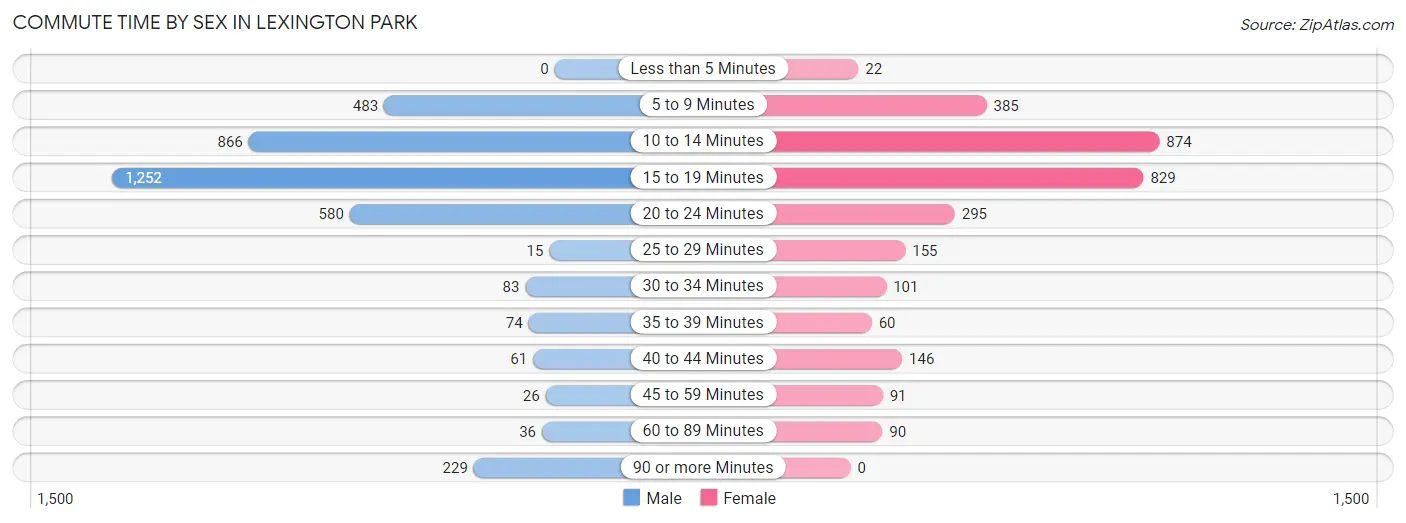
| Commute Time | Male | Female |
| Less than 5 Minutes | 0 (0.0%) | 22 (0.7%) |
| 5 to 9 Minutes | 483 (13.0%) | 385 (12.6%) |
| 10 to 14 Minutes | 866 (23.4%) | 874 (28.7%) |
| 15 to 19 Minutes | 1,252 (33.8%) | 829 (27.2%) |
| 20 to 24 Minutes | 580 (15.7%) | 295 (9.7%) |
| 25 to 29 Minutes | 15 (0.4%) | 155 (5.1%) |
| 30 to 34 Minutes | 83 (2.2%) | 101 (3.3%) |
| 35 to 39 Minutes | 74 (2.0%) | 60 (2.0%) |
| 40 to 44 Minutes | 61 (1.7%) | 146 (4.8%) |
| 45 to 59 Minutes | 26 (0.7%) | 91 (3.0%) |
| 60 to 89 Minutes | 36 (1.0%) | 90 (2.9%) |
| 90 or more Minutes | 229 (6.2%) | 0 (0.0%) |
Time of Departure to Work by Sex in Lexington Park
The most frequent times of departure to work in Lexington Park are 6:30 AM to 6:59 AM (529, 14.3%) for males and 6:00 AM to 6:29 AM (668, 21.9%) for females.
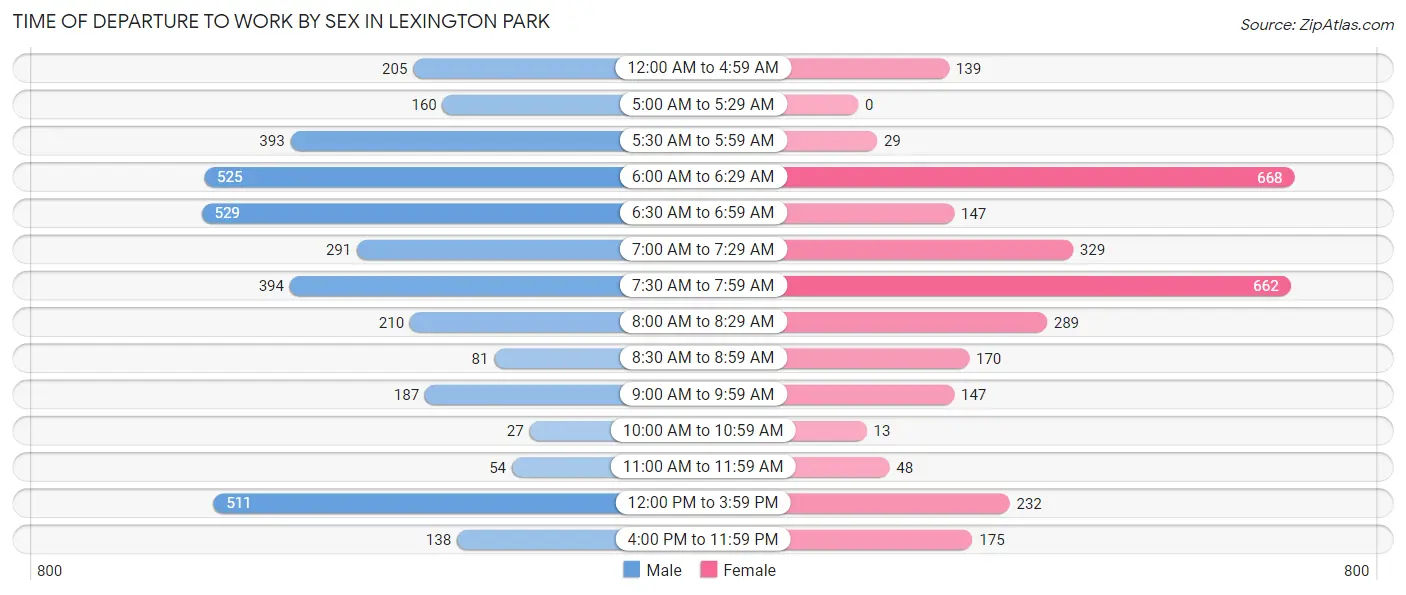
| Time of Departure | Male | Female |
| 12:00 AM to 4:59 AM | 205 (5.5%) | 139 (4.6%) |
| 5:00 AM to 5:29 AM | 160 (4.3%) | 0 (0.0%) |
| 5:30 AM to 5:59 AM | 393 (10.6%) | 29 (0.9%) |
| 6:00 AM to 6:29 AM | 525 (14.2%) | 668 (21.9%) |
| 6:30 AM to 6:59 AM | 529 (14.3%) | 147 (4.8%) |
| 7:00 AM to 7:29 AM | 291 (7.9%) | 329 (10.8%) |
| 7:30 AM to 7:59 AM | 394 (10.6%) | 662 (21.7%) |
| 8:00 AM to 8:29 AM | 210 (5.7%) | 289 (9.5%) |
| 8:30 AM to 8:59 AM | 81 (2.2%) | 170 (5.6%) |
| 9:00 AM to 9:59 AM | 187 (5.1%) | 147 (4.8%) |
| 10:00 AM to 10:59 AM | 27 (0.7%) | 13 (0.4%) |
| 11:00 AM to 11:59 AM | 54 (1.5%) | 48 (1.6%) |
| 12:00 PM to 3:59 PM | 511 (13.8%) | 232 (7.6%) |
| 4:00 PM to 11:59 PM | 138 (3.7%) | 175 (5.7%) |
| Total | 3,705 (100.0%) | 3,048 (100.0%) |
Housing Occupancy in Lexington Park
Occupancy by Ownership in Lexington Park
Of the total 5,732 dwellings in Lexington Park, owner-occupied units account for 2,589 (45.2%), while renter-occupied units make up 3,143 (54.8%).
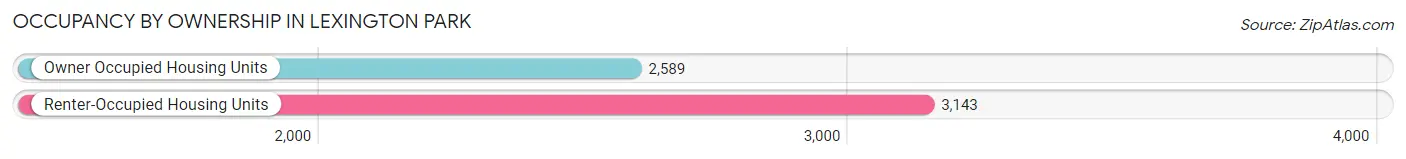
| Occupancy | # Housing Units | % Housing Units |
| Owner Occupied Housing Units | 2,589 | 45.2% |
| Renter-Occupied Housing Units | 3,143 | 54.8% |
| Total Occupied Housing Units | 5,732 | 100.0% |
Occupancy by Household Size in Lexington Park
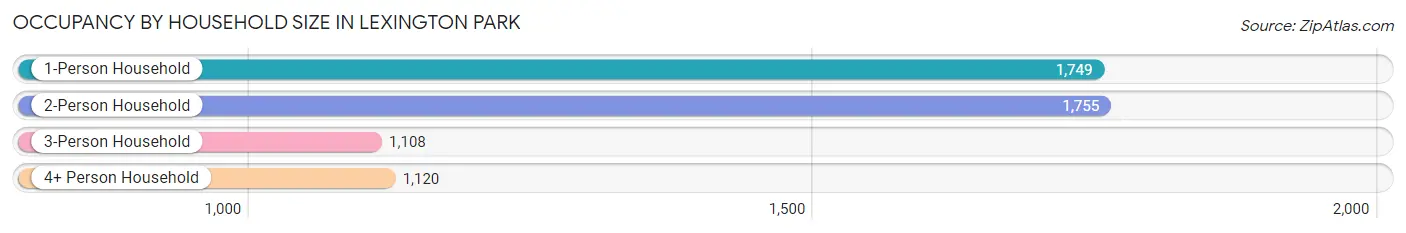
| Household Size | # Housing Units | % Housing Units |
| 1-Person Household | 1,749 | 30.5% |
| 2-Person Household | 1,755 | 30.6% |
| 3-Person Household | 1,108 | 19.3% |
| 4+ Person Household | 1,120 | 19.5% |
| Total Housing Units | 5,732 | 100.0% |
Occupancy by Ownership by Household Size in Lexington Park
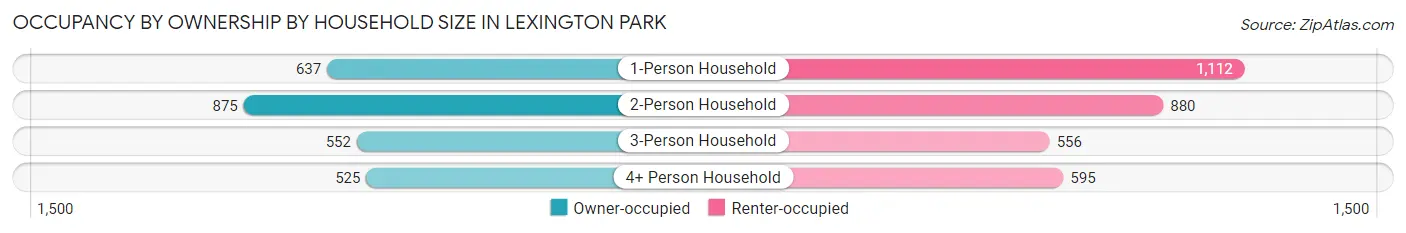
| Household Size | Owner-occupied | Renter-occupied |
| 1-Person Household | 637 (36.4%) | 1,112 (63.6%) |
| 2-Person Household | 875 (49.9%) | 880 (50.1%) |
| 3-Person Household | 552 (49.8%) | 556 (50.2%) |
| 4+ Person Household | 525 (46.9%) | 595 (53.1%) |
| Total Housing Units | 2,589 (45.2%) | 3,143 (54.8%) |
Occupancy by Educational Attainment in Lexington Park
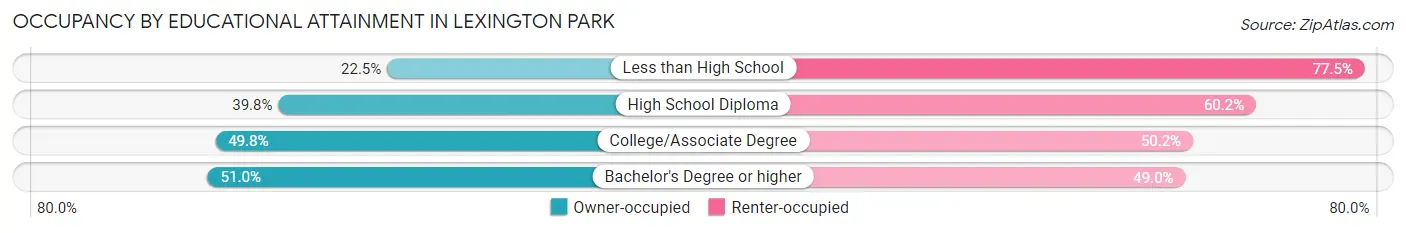
| Household Size | Owner-occupied | Renter-occupied |
| Less than High School | 108 (22.5%) | 372 (77.5%) |
| High School Diploma | 623 (39.8%) | 944 (60.2%) |
| College/Associate Degree | 825 (49.8%) | 833 (50.2%) |
| Bachelor's Degree or higher | 1,033 (51.0%) | 994 (49.0%) |
Occupancy by Age of Householder in Lexington Park
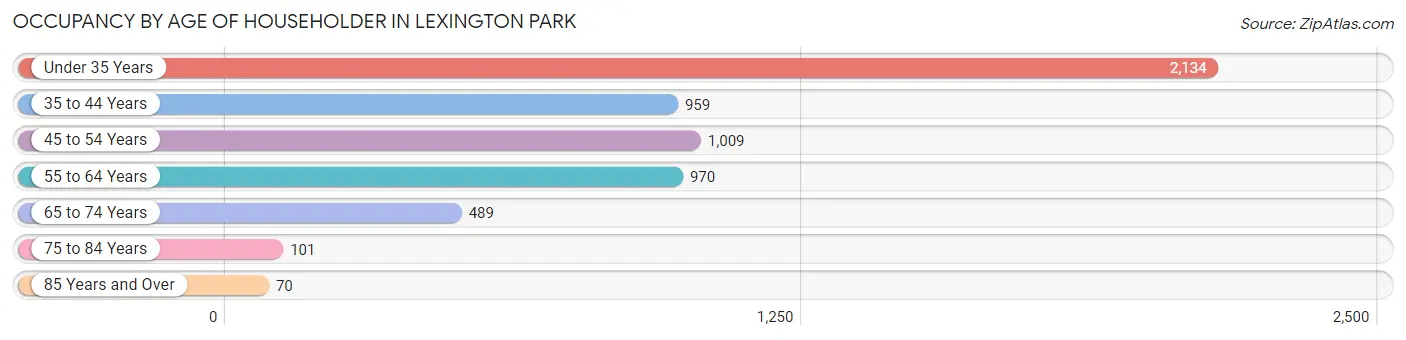
| Age Bracket | # Households | % Households |
| Under 35 Years | 2,134 | 37.2% |
| 35 to 44 Years | 959 | 16.7% |
| 45 to 54 Years | 1,009 | 17.6% |
| 55 to 64 Years | 970 | 16.9% |
| 65 to 74 Years | 489 | 8.5% |
| 75 to 84 Years | 101 | 1.8% |
| 85 Years and Over | 70 | 1.2% |
| Total | 5,732 | 100.0% |
Housing Finances in Lexington Park
Median Income by Occupancy in Lexington Park
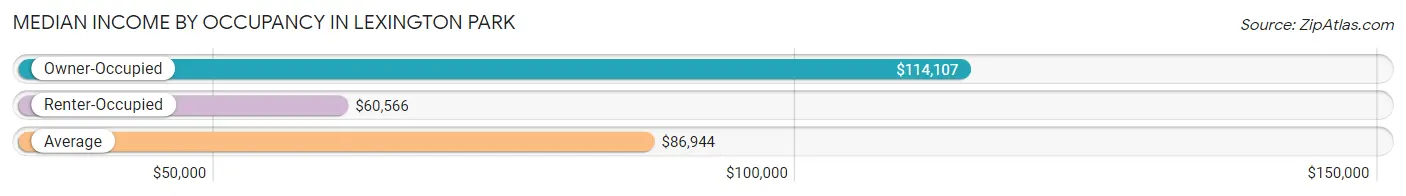
| Occupancy Type | # Households | Median Income |
| Owner-Occupied | 2,589 (45.2%) | $114,107 |
| Renter-Occupied | 3,143 (54.8%) | $60,566 |
| Average | 5,732 (100.0%) | $86,944 |
Occupancy by Householder Income Bracket in Lexington Park
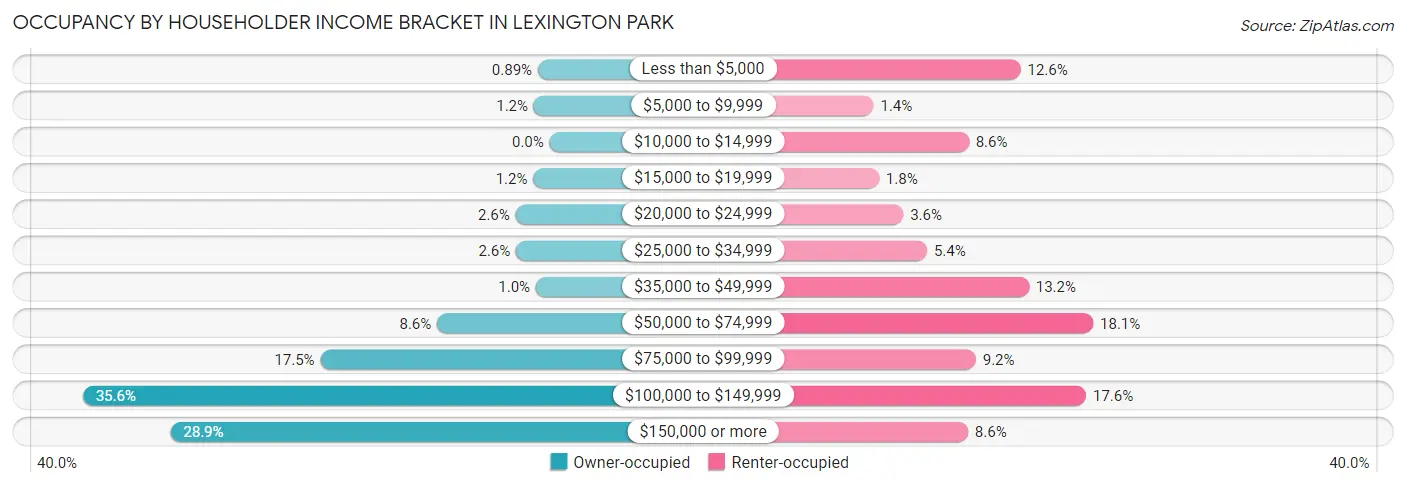
| Income Bracket | Owner-occupied | Renter-occupied |
| Less than $5,000 | 23 (0.9%) | 395 (12.6%) |
| $5,000 to $9,999 | 31 (1.2%) | 43 (1.4%) |
| $10,000 to $14,999 | 0 (0.0%) | 271 (8.6%) |
| $15,000 to $19,999 | 32 (1.2%) | 56 (1.8%) |
| $20,000 to $24,999 | 67 (2.6%) | 114 (3.6%) |
| $25,000 to $34,999 | 66 (2.5%) | 171 (5.4%) |
| $35,000 to $49,999 | 27 (1.0%) | 415 (13.2%) |
| $50,000 to $74,999 | 222 (8.6%) | 569 (18.1%) |
| $75,000 to $99,999 | 452 (17.5%) | 288 (9.2%) |
| $100,000 to $149,999 | 921 (35.6%) | 552 (17.6%) |
| $150,000 or more | 748 (28.9%) | 269 (8.6%) |
| Total | 2,589 (100.0%) | 3,143 (100.0%) |
Monthly Housing Cost Tiers in Lexington Park
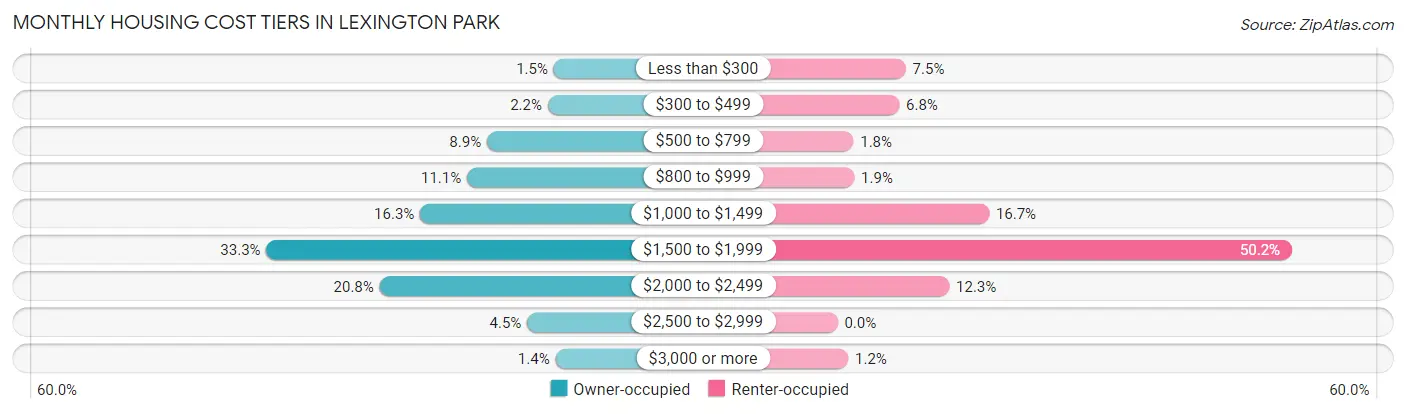
| Monthly Cost | Owner-occupied | Renter-occupied |
| Less than $300 | 40 (1.5%) | 237 (7.5%) |
| $300 to $499 | 57 (2.2%) | 214 (6.8%) |
| $500 to $799 | 231 (8.9%) | 55 (1.8%) |
| $800 to $999 | 288 (11.1%) | 58 (1.8%) |
| $1,000 to $1,499 | 422 (16.3%) | 526 (16.7%) |
| $1,500 to $1,999 | 862 (33.3%) | 1,578 (50.2%) |
| $2,000 to $2,499 | 538 (20.8%) | 388 (12.3%) |
| $2,500 to $2,999 | 116 (4.5%) | 0 (0.0%) |
| $3,000 or more | 35 (1.3%) | 37 (1.2%) |
| Total | 2,589 (100.0%) | 3,143 (100.0%) |
Physical Housing Characteristics in Lexington Park
Housing Structures in Lexington Park
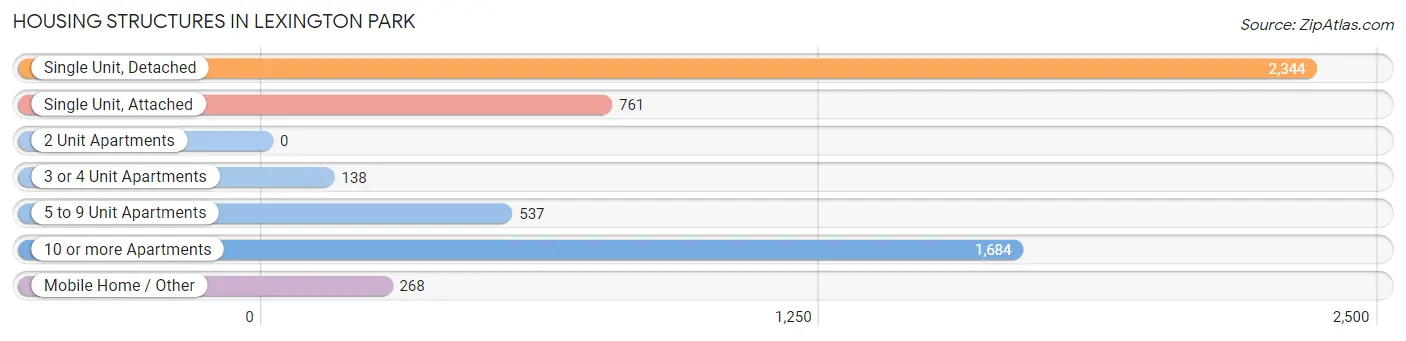
| Structure Type | # Housing Units | % Housing Units |
| Single Unit, Detached | 2,344 | 40.9% |
| Single Unit, Attached | 761 | 13.3% |
| 2 Unit Apartments | 0 | 0.0% |
| 3 or 4 Unit Apartments | 138 | 2.4% |
| 5 to 9 Unit Apartments | 537 | 9.4% |
| 10 or more Apartments | 1,684 | 29.4% |
| Mobile Home / Other | 268 | 4.7% |
| Total | 5,732 | 100.0% |
Housing Structures by Occupancy in Lexington Park
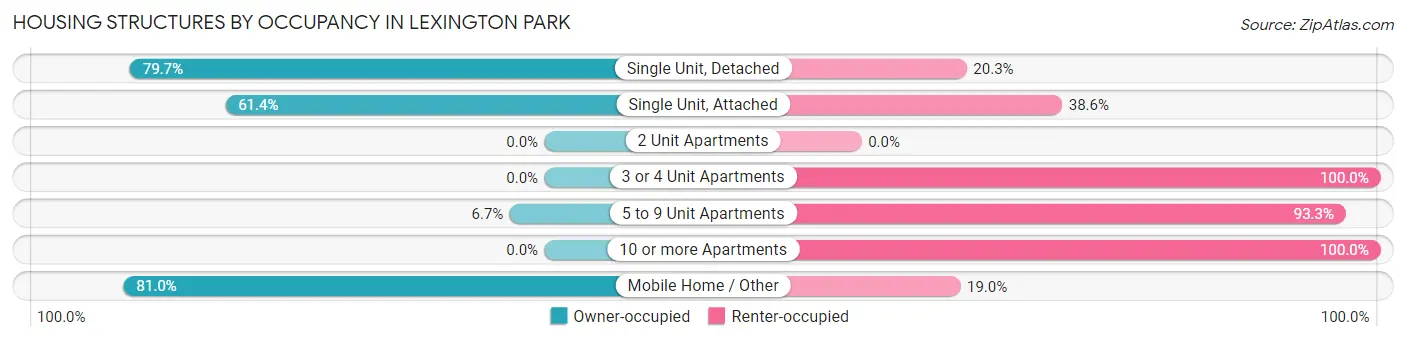
| Structure Type | Owner-occupied | Renter-occupied |
| Single Unit, Detached | 1,869 (79.7%) | 475 (20.3%) |
| Single Unit, Attached | 467 (61.4%) | 294 (38.6%) |
| 2 Unit Apartments | 0 (0.0%) | 0 (0.0%) |
| 3 or 4 Unit Apartments | 0 (0.0%) | 138 (100.0%) |
| 5 to 9 Unit Apartments | 36 (6.7%) | 501 (93.3%) |
| 10 or more Apartments | 0 (0.0%) | 1,684 (100.0%) |
| Mobile Home / Other | 217 (81.0%) | 51 (19.0%) |
| Total | 2,589 (45.2%) | 3,143 (54.8%) |
Housing Structures by Number of Rooms in Lexington Park
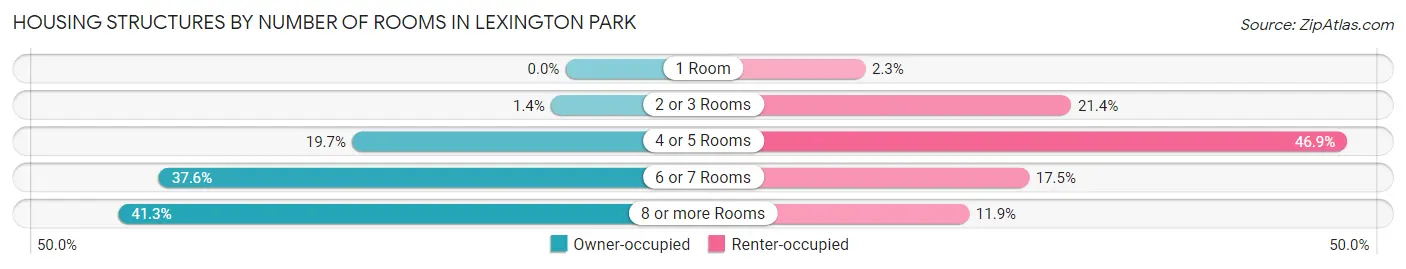
| Number of Rooms | Owner-occupied | Renter-occupied |
| 1 Room | 0 (0.0%) | 73 (2.3%) |
| 2 or 3 Rooms | 35 (1.3%) | 672 (21.4%) |
| 4 or 5 Rooms | 511 (19.7%) | 1,474 (46.9%) |
| 6 or 7 Rooms | 973 (37.6%) | 549 (17.5%) |
| 8 or more Rooms | 1,070 (41.3%) | 375 (11.9%) |
| Total | 2,589 (100.0%) | 3,143 (100.0%) |
Housing Structure by Heating Type in Lexington Park
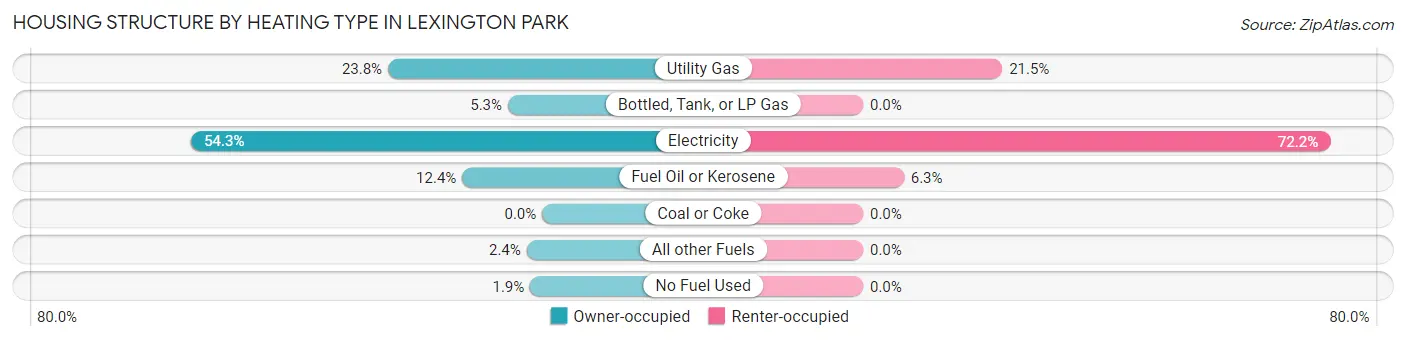
| Heating Type | Owner-occupied | Renter-occupied |
| Utility Gas | 617 (23.8%) | 676 (21.5%) |
| Bottled, Tank, or LP Gas | 137 (5.3%) | 0 (0.0%) |
| Electricity | 1,405 (54.3%) | 2,269 (72.2%) |
| Fuel Oil or Kerosene | 320 (12.4%) | 198 (6.3%) |
| Coal or Coke | 0 (0.0%) | 0 (0.0%) |
| All other Fuels | 62 (2.4%) | 0 (0.0%) |
| No Fuel Used | 48 (1.8%) | 0 (0.0%) |
| Total | 2,589 (100.0%) | 3,143 (100.0%) |
Household Vehicle Usage in Lexington Park
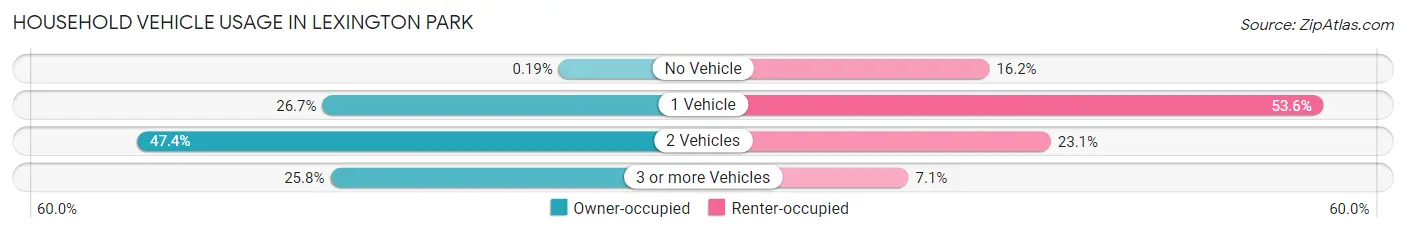
| Vehicles per Household | Owner-occupied | Renter-occupied |
| No Vehicle | 5 (0.2%) | 509 (16.2%) |
| 1 Vehicle | 690 (26.7%) | 1,685 (53.6%) |
| 2 Vehicles | 1,227 (47.4%) | 725 (23.1%) |
| 3 or more Vehicles | 667 (25.8%) | 224 (7.1%) |
| Total | 2,589 (100.0%) | 3,143 (100.0%) |
Real Estate & Mortgages in Lexington Park
Real Estate and Mortgage Overview in Lexington Park
| Characteristic | Without Mortgage | With Mortgage |
| Housing Units | 637 | 1,952 |
| Median Property Value | $172,600 | $300,500 |
| Median Household Income | $103,897 | $657 |
| Monthly Housing Costs | $802 | $35 |
| Real Estate Taxes | $2,513 | $32 |
Property Value by Mortgage Status in Lexington Park
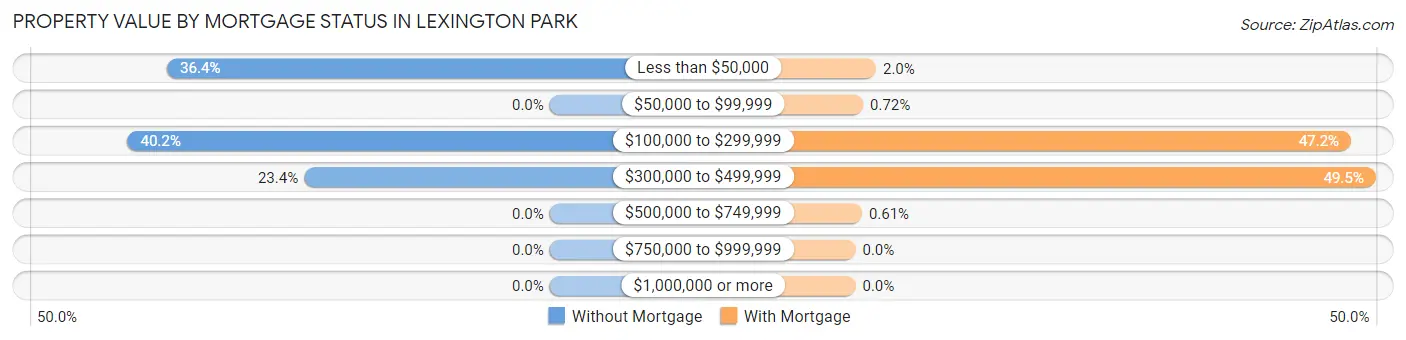
| Property Value | Without Mortgage | With Mortgage |
| Less than $50,000 | 232 (36.4%) | 38 (1.9%) |
| $50,000 to $99,999 | 0 (0.0%) | 14 (0.7%) |
| $100,000 to $299,999 | 256 (40.2%) | 921 (47.2%) |
| $300,000 to $499,999 | 149 (23.4%) | 967 (49.5%) |
| $500,000 to $749,999 | 0 (0.0%) | 12 (0.6%) |
| $750,000 to $999,999 | 0 (0.0%) | 0 (0.0%) |
| $1,000,000 or more | 0 (0.0%) | 0 (0.0%) |
| Total | 637 (100.0%) | 1,952 (100.0%) |
Household Income by Mortgage Status in Lexington Park
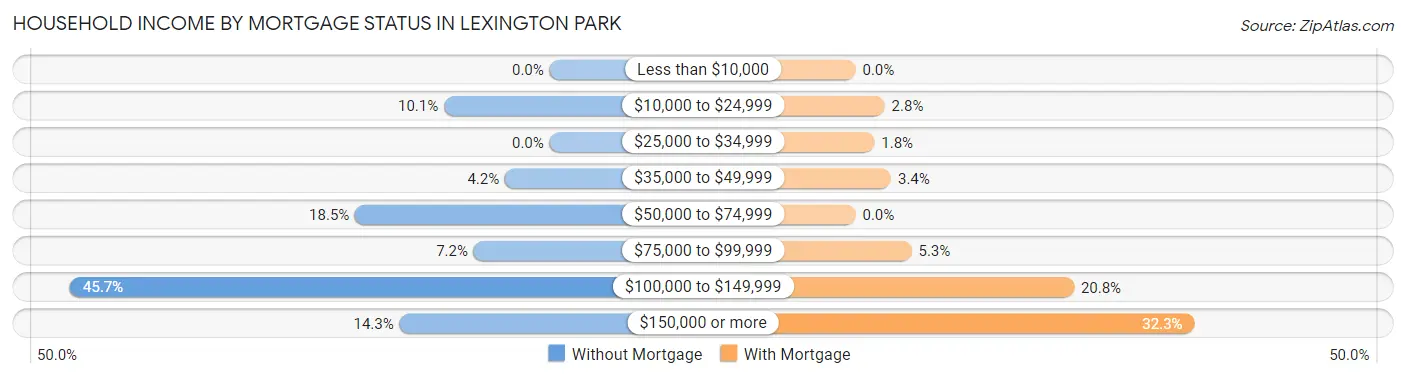
| Household Income | Without Mortgage | With Mortgage |
| Less than $10,000 | 0 (0.0%) | 0 (0.0%) |
| $10,000 to $24,999 | 64 (10.1%) | 54 (2.8%) |
| $25,000 to $34,999 | 0 (0.0%) | 35 (1.8%) |
| $35,000 to $49,999 | 27 (4.2%) | 66 (3.4%) |
| $50,000 to $74,999 | 118 (18.5%) | 0 (0.0%) |
| $75,000 to $99,999 | 46 (7.2%) | 104 (5.3%) |
| $100,000 to $149,999 | 291 (45.7%) | 406 (20.8%) |
| $150,000 or more | 91 (14.3%) | 630 (32.3%) |
| Total | 637 (100.0%) | 1,952 (100.0%) |
Property Value to Household Income Ratio in Lexington Park
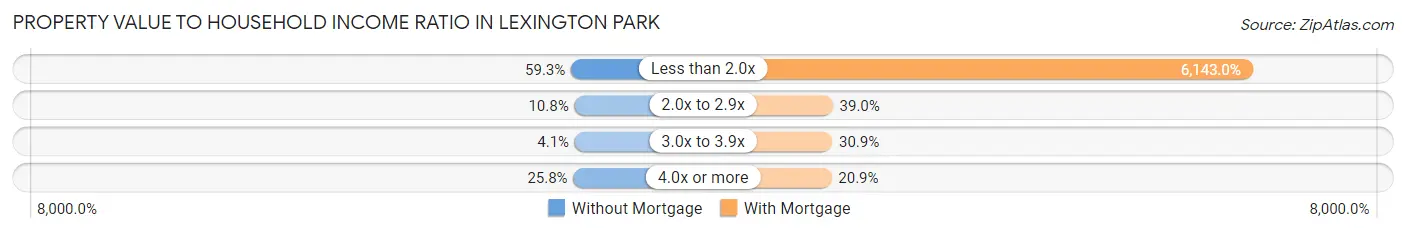
| Value-to-Income Ratio | Without Mortgage | With Mortgage |
| Less than 2.0x | 378 (59.3%) | 119,912 (6,143.0%) |
| 2.0x to 2.9x | 69 (10.8%) | 762 (39.0%) |
| 3.0x to 3.9x | 26 (4.1%) | 603 (30.9%) |
| 4.0x or more | 164 (25.8%) | 408 (20.9%) |
| Total | 637 (100.0%) | 1,952 (100.0%) |
Real Estate Taxes by Mortgage Status in Lexington Park
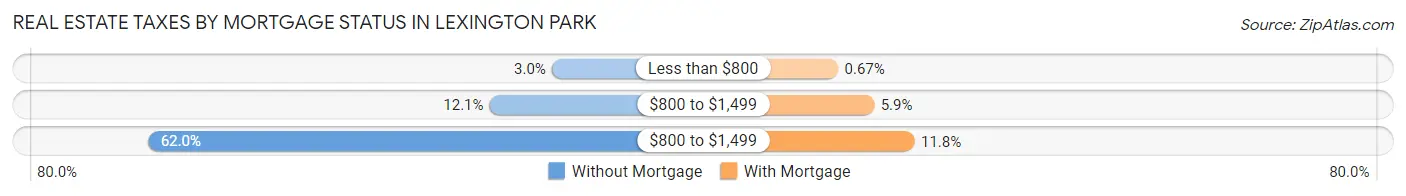
| Property Taxes | Without Mortgage | With Mortgage |
| Less than $800 | 19 (3.0%) | 13 (0.7%) |
| $800 to $1,499 | 77 (12.1%) | 116 (5.9%) |
| $800 to $1,499 | 395 (62.0%) | 231 (11.8%) |
| Total | 637 (100.0%) | 1,952 (100.0%) |
Health & Disability in Lexington Park
Health Insurance Coverage by Age in Lexington Park
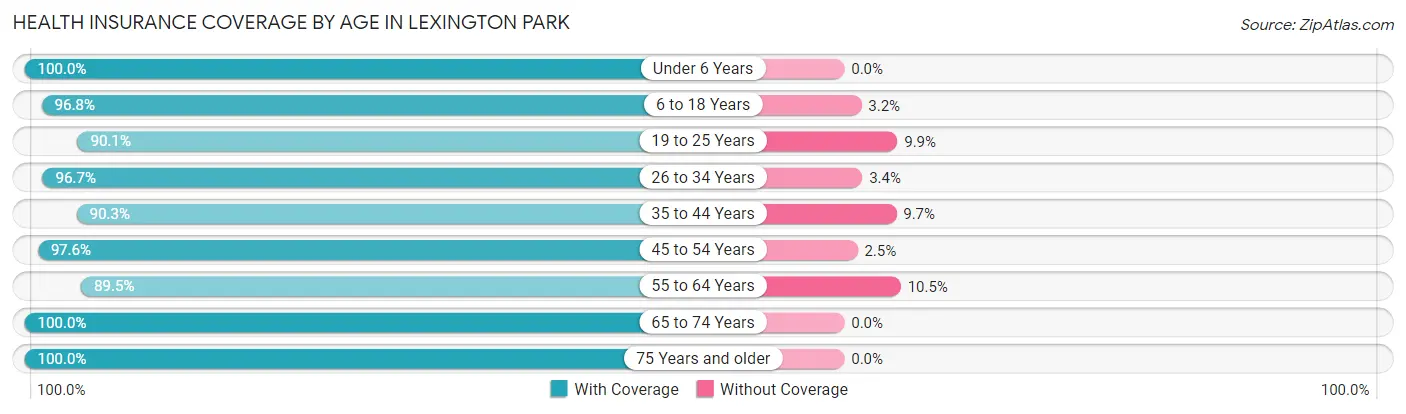
| Age Bracket | With Coverage | Without Coverage |
| Under 6 Years | 1,255 (100.0%) | 0 (0.0%) |
| 6 to 18 Years | 1,889 (96.8%) | 62 (3.2%) |
| 19 to 25 Years | 1,514 (90.1%) | 166 (9.9%) |
| 26 to 34 Years | 2,369 (96.7%) | 82 (3.4%) |
| 35 to 44 Years | 1,556 (90.3%) | 167 (9.7%) |
| 45 to 54 Years | 1,633 (97.6%) | 41 (2.5%) |
| 55 to 64 Years | 1,404 (89.5%) | 165 (10.5%) |
| 65 to 74 Years | 611 (100.0%) | 0 (0.0%) |
| 75 Years and older | 302 (100.0%) | 0 (0.0%) |
| Total | 12,533 (94.8%) | 683 (5.2%) |
Health Insurance Coverage by Citizenship Status in Lexington Park
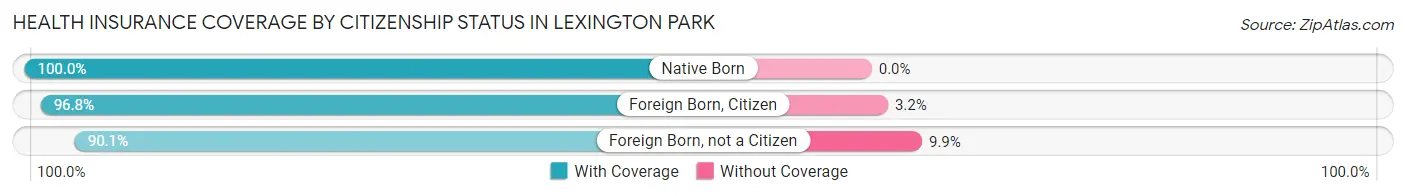
| Citizenship Status | With Coverage | Without Coverage |
| Native Born | 1,255 (100.0%) | 0 (0.0%) |
| Foreign Born, Citizen | 1,889 (96.8%) | 62 (3.2%) |
| Foreign Born, not a Citizen | 1,514 (90.1%) | 166 (9.9%) |
Health Insurance Coverage by Household Income in Lexington Park
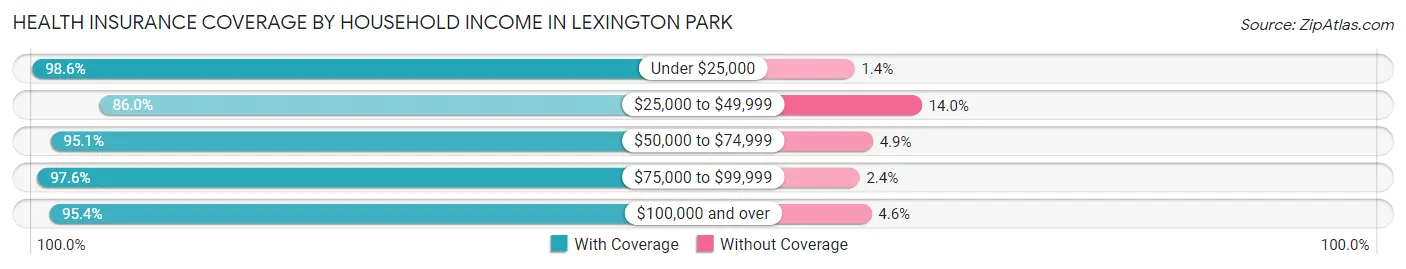
| Household Income | With Coverage | Without Coverage |
| Under $25,000 | 1,640 (98.6%) | 24 (1.4%) |
| $25,000 to $49,999 | 1,482 (86.0%) | 242 (14.0%) |
| $50,000 to $74,999 | 1,859 (95.1%) | 95 (4.9%) |
| $75,000 to $99,999 | 1,650 (97.6%) | 40 (2.4%) |
| $100,000 and over | 5,845 (95.4%) | 282 (4.6%) |
Public vs Private Health Insurance Coverage by Age in Lexington Park
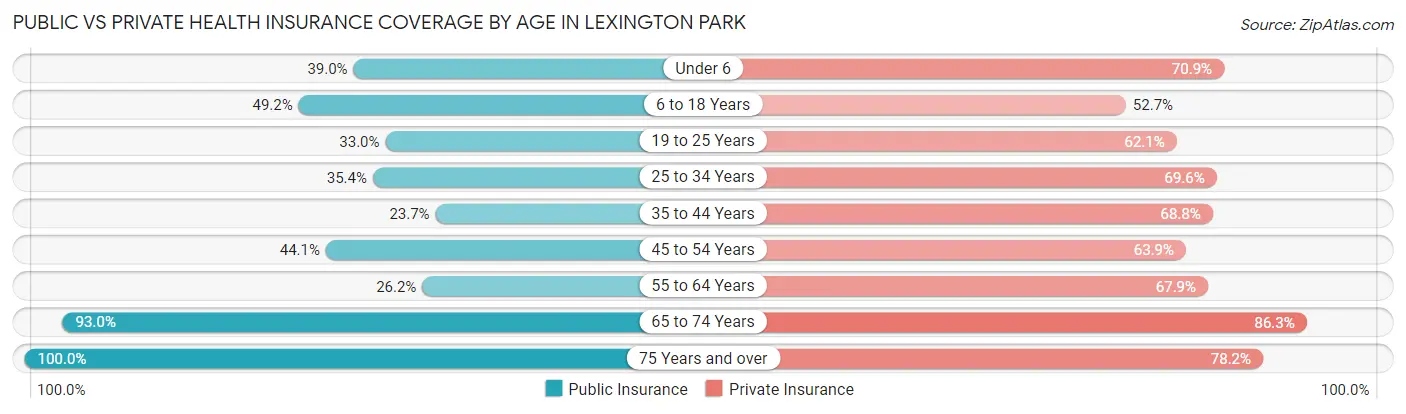
| Age Bracket | Public Insurance | Private Insurance |
| Under 6 | 489 (39.0%) | 890 (70.9%) |
| 6 to 18 Years | 959 (49.1%) | 1,029 (52.7%) |
| 19 to 25 Years | 555 (33.0%) | 1,044 (62.1%) |
| 25 to 34 Years | 867 (35.4%) | 1,705 (69.6%) |
| 35 to 44 Years | 409 (23.7%) | 1,186 (68.8%) |
| 45 to 54 Years | 738 (44.1%) | 1,069 (63.9%) |
| 55 to 64 Years | 411 (26.2%) | 1,066 (67.9%) |
| 65 to 74 Years | 568 (93.0%) | 527 (86.3%) |
| 75 Years and over | 302 (100.0%) | 236 (78.1%) |
| Total | 5,298 (40.1%) | 8,752 (66.2%) |
Disability Status by Sex by Age in Lexington Park
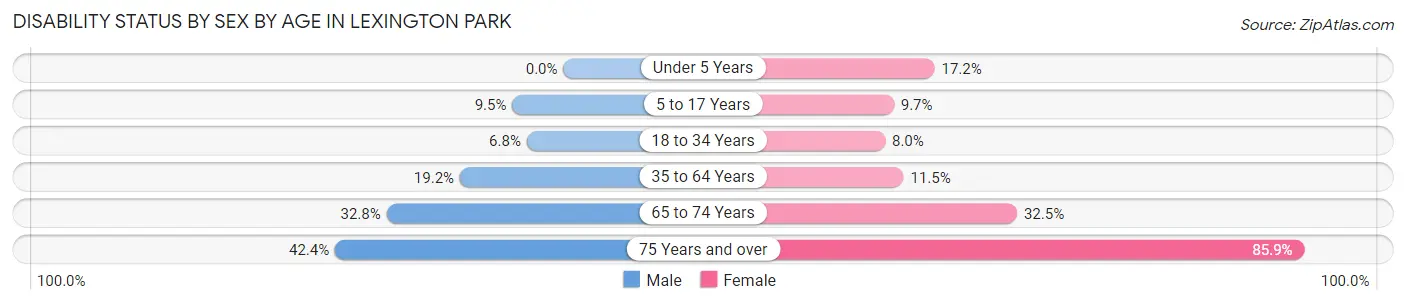
| Age Bracket | Male | Female |
| Under 5 Years | 0 (0.0%) | 95 (17.2%) |
| 5 to 17 Years | 92 (9.5%) | 99 (9.7%) |
| 18 to 34 Years | 146 (6.8%) | 169 (8.0%) |
| 35 to 64 Years | 441 (19.2%) | 306 (11.5%) |
| 65 to 74 Years | 147 (32.8%) | 53 (32.5%) |
| 75 Years and over | 50 (42.4%) | 158 (85.9%) |
Disability Class by Sex by Age in Lexington Park
Disability Class: Hearing Difficulty
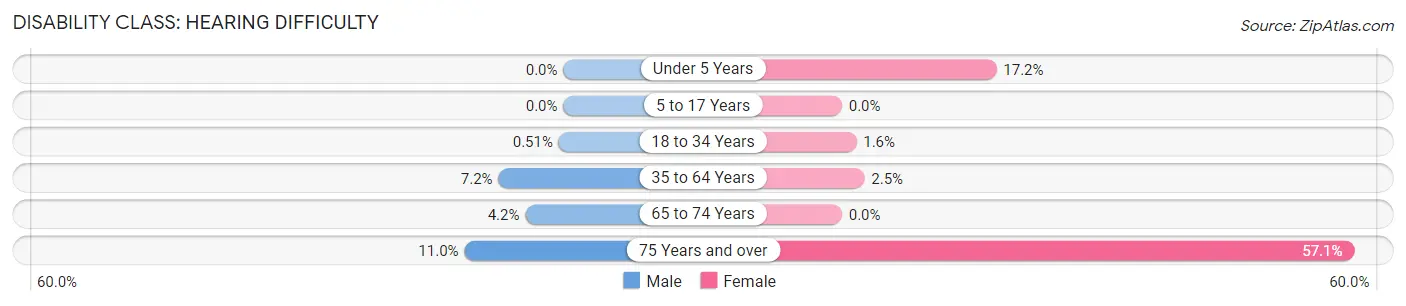
| Age Bracket | Male | Female |
| Under 5 Years | 0 (0.0%) | 95 (17.2%) |
| 5 to 17 Years | 0 (0.0%) | 0 (0.0%) |
| 18 to 34 Years | 11 (0.5%) | 34 (1.6%) |
| 35 to 64 Years | 166 (7.2%) | 67 (2.5%) |
| 65 to 74 Years | 19 (4.2%) | 0 (0.0%) |
| 75 Years and over | 13 (11.0%) | 105 (57.1%) |
Disability Class: Vision Difficulty
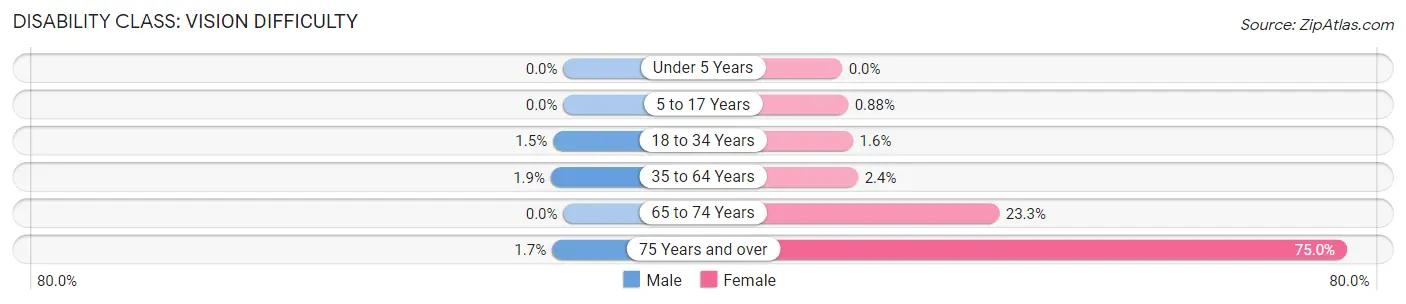
| Age Bracket | Male | Female |
| Under 5 Years | 0 (0.0%) | 0 (0.0%) |
| 5 to 17 Years | 0 (0.0%) | 9 (0.9%) |
| 18 to 34 Years | 33 (1.5%) | 34 (1.6%) |
| 35 to 64 Years | 43 (1.9%) | 63 (2.4%) |
| 65 to 74 Years | 0 (0.0%) | 38 (23.3%) |
| 75 Years and over | 2 (1.7%) | 138 (75.0%) |
Disability Class: Cognitive Difficulty
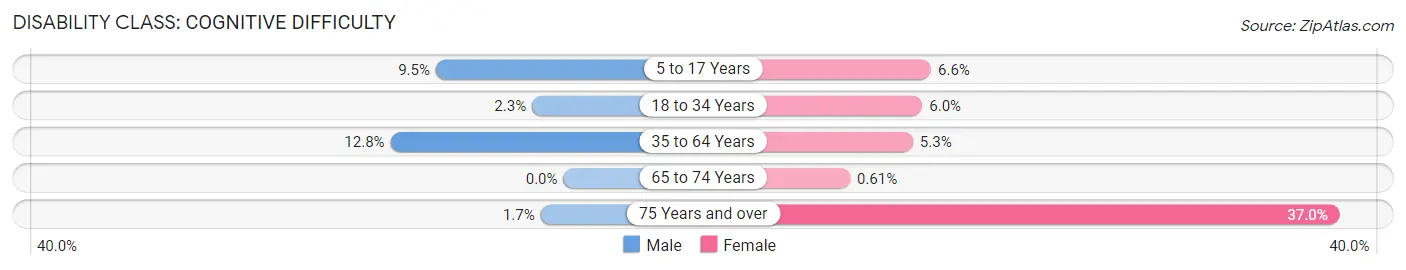
| Age Bracket | Male | Female |
| 5 to 17 Years | 92 (9.5%) | 68 (6.6%) |
| 18 to 34 Years | 50 (2.3%) | 126 (6.0%) |
| 35 to 64 Years | 295 (12.8%) | 141 (5.3%) |
| 65 to 74 Years | 0 (0.0%) | 1 (0.6%) |
| 75 Years and over | 2 (1.7%) | 68 (37.0%) |
Disability Class: Ambulatory Difficulty
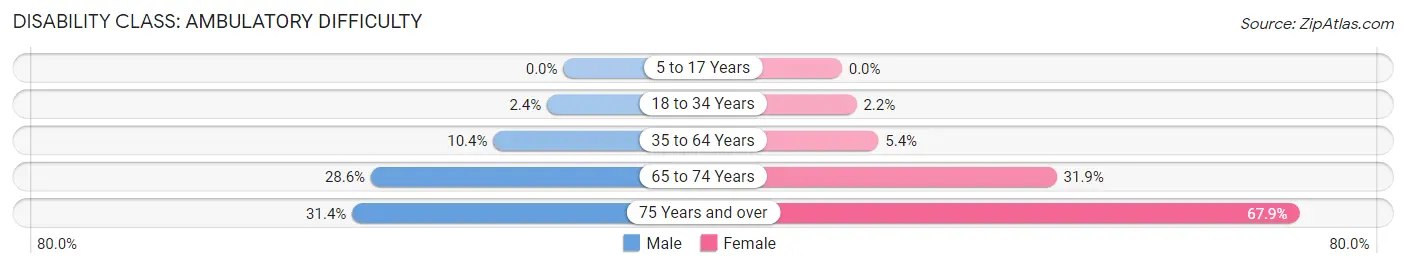
| Age Bracket | Male | Female |
| 5 to 17 Years | 0 (0.0%) | 0 (0.0%) |
| 18 to 34 Years | 52 (2.4%) | 46 (2.2%) |
| 35 to 64 Years | 239 (10.4%) | 145 (5.4%) |
| 65 to 74 Years | 128 (28.6%) | 52 (31.9%) |
| 75 Years and over | 37 (31.4%) | 125 (67.9%) |
Disability Class: Self-Care Difficulty
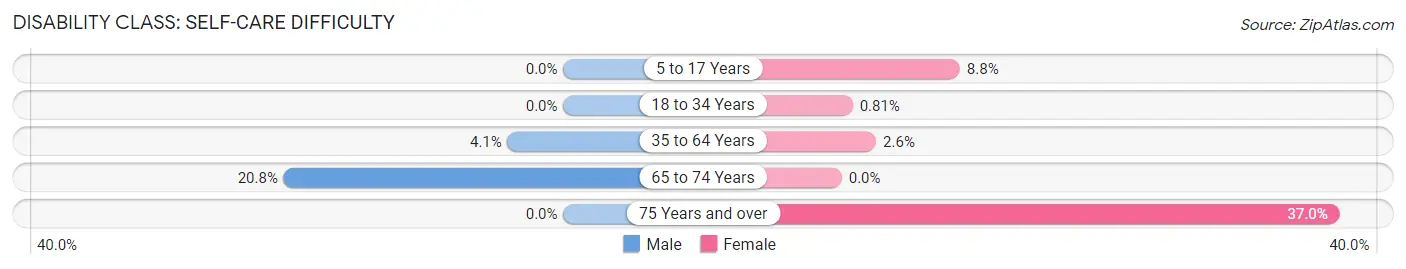
| Age Bracket | Male | Female |
| 5 to 17 Years | 0 (0.0%) | 90 (8.8%) |
| 18 to 34 Years | 0 (0.0%) | 17 (0.8%) |
| 35 to 64 Years | 95 (4.1%) | 68 (2.5%) |
| 65 to 74 Years | 93 (20.8%) | 0 (0.0%) |
| 75 Years and over | 0 (0.0%) | 68 (37.0%) |
Technology Access in Lexington Park
Computing Device Access in Lexington Park
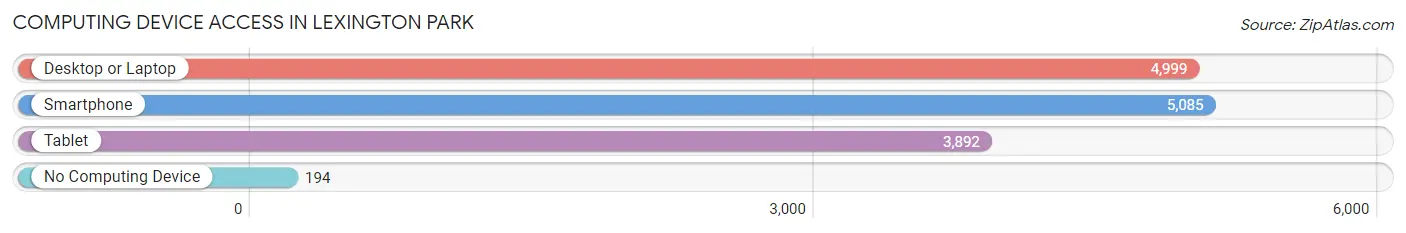
| Device Type | # Households | % Households |
| Desktop or Laptop | 4,999 | 87.2% |
| Smartphone | 5,085 | 88.7% |
| Tablet | 3,892 | 67.9% |
| No Computing Device | 194 | 3.4% |
| Total | 5,732 | 100.0% |
Internet Access in Lexington Park
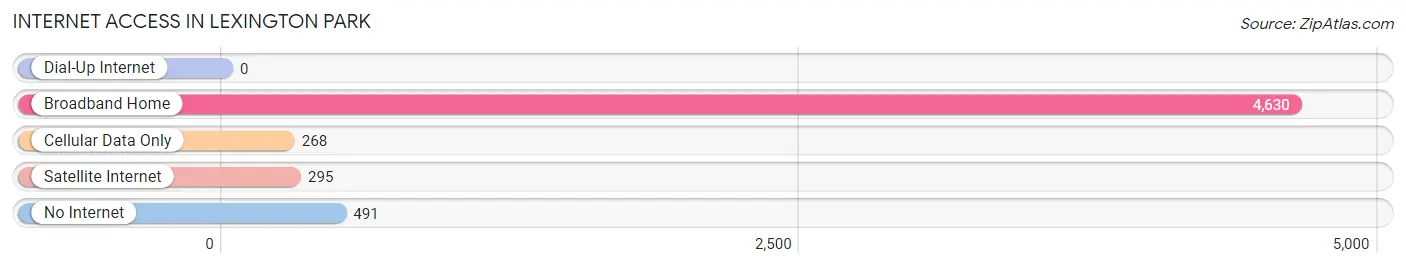
| Internet Type | # Households | % Households |
| Dial-Up Internet | 0 | 0.0% |
| Broadband Home | 4,630 | 80.8% |
| Cellular Data Only | 268 | 4.7% |
| Satellite Internet | 295 | 5.1% |
| No Internet | 491 | 8.6% |
| Total | 5,732 | 100.0% |
Lexington Park Summary
Lexington Park is a census-designated place (CDP) located in St. Mary’s County, Maryland, United States. The population was 11,626 at the 2010 census. It is the principal community of the Lexington Park, Maryland Micropolitan Statistical Area, which is included in the Washington-Baltimore-Arlington, DC-MD-VA-WV-PA Combined Statistical Area.
History
The area now known as Lexington Park was first settled in the early 1700s by English colonists. The town was originally known as “The Village” and was located near the present-day intersection of Great Mills Road and Maryland Route 235. The town was renamed “Lexington” in 1811 in honor of the Battle of Lexington, which had taken place in 1775. The town was later renamed “Lexington Park” in 1891.
The town was originally a farming community, but in the early 20th century, it began to develop into a residential community. In the 1940s, the town was chosen as the site of the Patuxent River Naval Air Station, which was established in 1943. The base was a major employer in the area and helped to spur the growth of the town.
Geography
Lexington Park is located in St. Mary’s County, Maryland, at 38°14′N 76°25′W (38.23, -76.41). It is bordered to the north by Great Mills, to the east by California, to the south by Hollywood, and to the west by Leonardtown.
According to the United States Census Bureau, the CDP has a total area of 8.3 square miles (21.5 km2), of which 8.2 square miles (21.3 km2) is land and 0.1 square miles (0.2 km2) (1.17%) is water.
Economy
The economy of Lexington Park is largely based on the Patuxent River Naval Air Station, which is the largest employer in the area. The base is home to the Naval Air Systems Command, the Naval Air Warfare Center Aircraft Division, and the Naval Air Warfare Center Weapons Division. The base also houses the Naval Air Station Patuxent River Museum, which is open to the public.
In addition to the base, Lexington Park is home to several small businesses, including restaurants, retail stores, and service providers. The town is also home to the St. Mary’s County Regional Airport, which serves the area with general aviation services.
Demographics
As of the 2010 census, there were 11,626 people, 4,072 households, and 2,845 families residing in the CDP. The population density was 1,417.3 people per square mile (546.9/km2). There were 4,521 housing units at an average density of 551.3 per square mile (212.9/km2). The racial makeup of the CDP was 68.2% White, 22.2% African American, 0.7% Native American, 3.3% Asian, 0.1% Pacific Islander, 2.2% from other races, and 3.3% from two or more races. Hispanic or Latino of any race were 6.2% of the population.
There were 4,072 households, out of which 37.2% had children under the age of 18 living with them, 48.2% were married couples living together, 14.7% had a female householder with no husband present, and 30.7% were non-families. 24.2% of all households were made up of individuals, and 8.2% had someone living alone who was 65 years of age or older. The average household size was 2.71 and the average family size was 3.20.
In the CDP, the population was spread out, with 27.2% under the age of 18, 10.2% from 18 to 24, 33.2% from 25 to 44, 19.7% from 45 to 64, and 9.7% who were 65 years of age or older. The median age was 32 years. For every 100 females, there were 97.2 males. For every 100 females age 18 and over, there were 94.2 males.
The median income for a household in the CDP was $50,945, and the median income for a family was $58,958. Males had a median income of $41,945 versus $30,917 for females. The per capita income for the CDP was $21,945. About 6.2% of families and 8.2% of the population were below the poverty line, including 10.2% of those under age 18 and 8.2% of those age 65 or over.
Common Questions
What is Per Capita Income in Lexington Park?
Per Capita income in Lexington Park is $41,168.
What is the Median Family Income in Lexington Park?
Median Family Income in Lexington Park is $88,871.
What is the Median Household income in Lexington Park?
Median Household Income in Lexington Park is $86,944.
What is Income or Wage Gap in Lexington Park?
Income or Wage Gap in Lexington Park is 40.5%.
Women in Lexington Park earn 59.5 cents for every dollar earned by a man.
What is Inequality or Gini Index in Lexington Park?
Inequality or Gini Index in Lexington Park is 0.40.
What is the Total Population of Lexington Park?
Total Population of Lexington Park is 13,537.
What is the Total Male Population of Lexington Park?
Total Male Population of Lexington Park is 6,814.
What is the Total Female Population of Lexington Park?
Total Female Population of Lexington Park is 6,723.
What is the Ratio of Males per 100 Females in Lexington Park?
There are 101.35 Males per 100 Females in Lexington Park.
What is the Ratio of Females per 100 Males in Lexington Park?
There are 98.66 Females per 100 Males in Lexington Park.
What is the Median Population Age in Lexington Park?
Median Population Age in Lexington Park is 31.6 Years.
What is the Average Family Size in Lexington Park
Average Family Size in Lexington Park is 3.0 People.
What is the Average Household Size in Lexington Park
Average Household Size in Lexington Park is 2.4 People.
How Large is the Labor Force in Lexington Park?
There are 8,075 People in the Labor Forcein in Lexington Park.
What is the Percentage of People in the Labor Force in Lexington Park?
74.1% of People are in the Labor Force in Lexington Park.
What is the Unemployment Rate in Lexington Park?
Unemployment Rate in Lexington Park is 4.1%.