Cities with the Most Immigrants from Iraq in Texas
RELATED REPORTS & OPTIONS
Iraq
Texas
Compare Cities
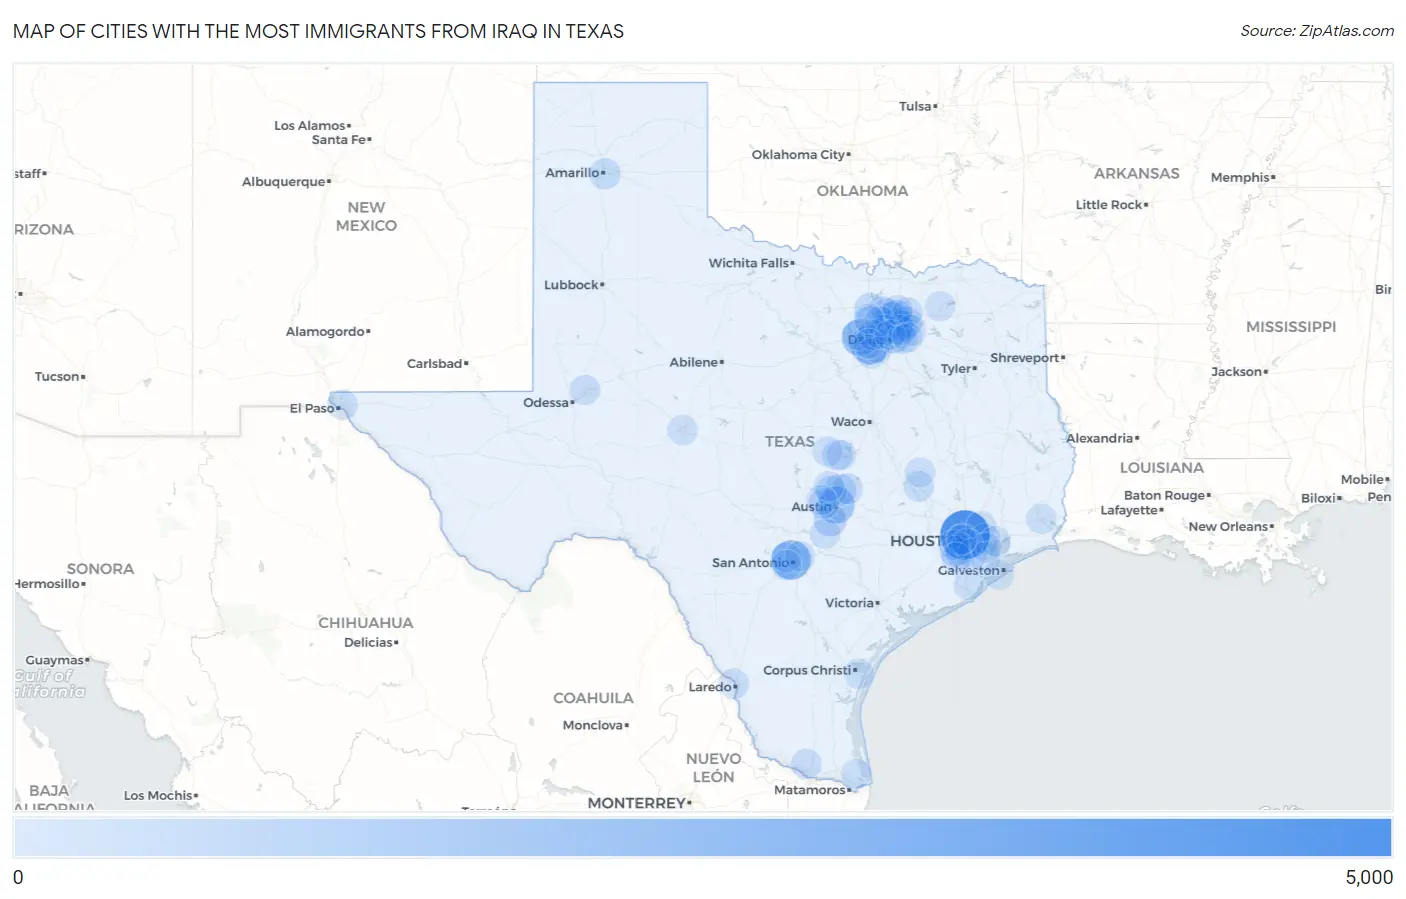
Map of Cities with the Most Immigrants from Iraq in Texas
0
5,000
Cities with the Most Immigrants from Iraq in Texas
| City | Iraq | vs State | vs National | |
| 1. | Houston | 4,039 | 26,598(15.19%)#1 | 234,088(1.73%)#5 |
| 2. | San Antonio | 1,932 | 26,598(7.26%)#2 | 234,088(0.83%)#16 |
| 3. | Arlington | 1,777 | 26,598(6.68%)#3 | 234,088(0.76%)#18 |
| 4. | Austin | 1,379 | 26,598(5.18%)#4 | 234,088(0.59%)#23 |
| 5. | Fort Worth | 1,325 | 26,598(4.98%)#5 | 234,088(0.57%)#25 |
| 6. | Richardson | 1,137 | 26,598(4.27%)#6 | 234,088(0.49%)#30 |
| 7. | Plano | 984 | 26,598(3.70%)#7 | 234,088(0.42%)#39 |
| 8. | Dallas | 719 | 26,598(2.70%)#8 | 234,088(0.31%)#48 |
| 9. | Buda | 518 | 26,598(1.95%)#9 | 234,088(0.22%)#64 |
| 10. | Allen | 430 | 26,598(1.62%)#10 | 234,088(0.18%)#75 |
| 11. | Wylie | 416 | 26,598(1.56%)#11 | 234,088(0.18%)#79 |
| 12. | Sachse | 333 | 26,598(1.25%)#12 | 234,088(0.14%)#102 |
| 13. | Round Rock | 327 | 26,598(1.23%)#13 | 234,088(0.14%)#103 |
| 14. | Denton | 255 | 26,598(0.96%)#14 | 234,088(0.11%)#136 |
| 15. | Amarillo | 202 | 26,598(0.76%)#15 | 234,088(0.09%)#169 |
| 16. | Cedar Park | 181 | 26,598(0.68%)#16 | 234,088(0.08%)#183 |
| 17. | Killeen | 166 | 26,598(0.62%)#17 | 234,088(0.07%)#201 |
| 18. | Hutto | 139 | 26,598(0.52%)#18 | 234,088(0.06%)#230 |
| 19. | Frisco | 138 | 26,598(0.52%)#19 | 234,088(0.06%)#231 |
| 20. | Grand Prairie | 125 | 26,598(0.47%)#20 | 234,088(0.05%)#246 |
| 21. | Stafford | 124 | 26,598(0.47%)#21 | 234,088(0.05%)#251 |
| 22. | College Station | 115 | 26,598(0.43%)#22 | 234,088(0.05%)#271 |
| 23. | Midland | 95 | 26,598(0.36%)#23 | 234,088(0.04%)#307 |
| 24. | Missouri City | 90 | 26,598(0.34%)#24 | 234,088(0.04%)#319 |
| 25. | Bee Cave | 88 | 26,598(0.33%)#25 | 234,088(0.04%)#327 |
| 26. | Garland | 86 | 26,598(0.32%)#26 | 234,088(0.04%)#331 |
| 27. | Saginaw | 72 | 26,598(0.27%)#27 | 234,088(0.03%)#380 |
| 28. | Channelview | 69 | 26,598(0.26%)#28 | 234,088(0.03%)#387 |
| 29. | El Paso | 63 | 26,598(0.24%)#29 | 234,088(0.03%)#416 |
| 30. | Little Elm | 57 | 26,598(0.21%)#30 | 234,088(0.02%)#449 |
| 31. | Farmers Branch | 57 | 26,598(0.21%)#31 | 234,088(0.02%)#453 |
| 32. | League City | 47 | 26,598(0.18%)#32 | 234,088(0.02%)#522 |
| 33. | Sugar Land | 47 | 26,598(0.18%)#33 | 234,088(0.02%)#523 |
| 34. | Mcallen | 46 | 26,598(0.17%)#34 | 234,088(0.02%)#529 |
| 35. | Flower Mound | 46 | 26,598(0.17%)#35 | 234,088(0.02%)#533 |
| 36. | Rockwall | 46 | 26,598(0.17%)#36 | 234,088(0.02%)#535 |
| 37. | Laredo | 44 | 26,598(0.17%)#37 | 234,088(0.02%)#555 |
| 38. | Pearland | 42 | 26,598(0.16%)#38 | 234,088(0.02%)#568 |
| 39. | Princeton | 39 | 26,598(0.15%)#39 | 234,088(0.02%)#600 |
| 40. | Euless | 34 | 26,598(0.13%)#40 | 234,088(0.01%)#638 |
| 41. | Atascocita | 33 | 26,598(0.12%)#41 | 234,088(0.01%)#651 |
| 42. | Mansfield | 33 | 26,598(0.12%)#42 | 234,088(0.01%)#652 |
| 43. | Leon Valley | 33 | 26,598(0.12%)#43 | 234,088(0.01%)#656 |
| 44. | Irving | 28 | 26,598(0.11%)#44 | 234,088(0.01%)#695 |
| 45. | Mission Bend | 27 | 26,598(0.10%)#45 | 234,088(0.01%)#714 |
| 46. | San Angelo | 24 | 26,598(0.09%)#46 | 234,088(0.01%)#750 |
| 47. | Lewisville | 23 | 26,598(0.09%)#47 | 234,088(0.01%)#766 |
| 48. | Beaumont | 23 | 26,598(0.09%)#48 | 234,088(0.01%)#767 |
| 49. | Baytown | 23 | 26,598(0.09%)#49 | 234,088(0.01%)#769 |
| 50. | Sunnyvale | 21 | 26,598(0.08%)#50 | 234,088(0.01%)#818 |
| 51. | Richwood | 21 | 26,598(0.08%)#51 | 234,088(0.01%)#819 |
| 52. | Windcrest | 20 | 26,598(0.08%)#52 | 234,088(0.01%)#834 |
| 53. | Hedwig Village | 19 | 26,598(0.07%)#53 | 234,088(0.01%)#851 |
| 54. | Corpus Christi | 18 | 26,598(0.07%)#54 | 234,088(0.01%)#853 |
| 55. | Pasadena | 18 | 26,598(0.07%)#55 | 234,088(0.01%)#856 |
| 56. | Lackland Afb | 17 | 26,598(0.06%)#56 | 234,088(0.01%)#885 |
| 57. | Mckinney | 16 | 26,598(0.06%)#57 | 234,088(0.01%)#890 |
| 58. | San Marcos | 15 | 26,598(0.06%)#58 | 234,088(0.01%)#910 |
| 59. | Copperas Cove | 15 | 26,598(0.06%)#59 | 234,088(0.01%)#914 |
| 60. | University Park | 15 | 26,598(0.06%)#60 | 234,088(0.01%)#916 |
| 61. | Leander | 13 | 26,598(0.05%)#61 | 234,088(0.01%)#949 |
| 62. | Harker Heights | 11 | 26,598(0.04%)#62 | 234,088(0.00%)#1,012 |
| 63. | West University Place | 9 | 26,598(0.03%)#63 | 234,088(0.00%)#1,072 |
| 64. | Commerce | 9 | 26,598(0.03%)#64 | 234,088(0.00%)#1,074 |
| 65. | Travis Ranch | 9 | 26,598(0.03%)#65 | 234,088(0.00%)#1,075 |
| 66. | Bunker Hill Village | 9 | 26,598(0.03%)#66 | 234,088(0.00%)#1,078 |
| 67. | Kurten | 9 | 26,598(0.03%)#67 | 234,088(0.00%)#1,083 |
| 68. | Galveston | 6 | 26,598(0.02%)#68 | 234,088(0.00%)#1,148 |
| 69. | Bartonville | 6 | 26,598(0.02%)#69 | 234,088(0.00%)#1,163 |
| 70. | Pantego | 4 | 26,598(0.02%)#70 | 234,088(0.00%)#1,200 |
| 71. | Point Venture | 4 | 26,598(0.02%)#71 | 234,088(0.00%)#1,203 |
| 72. | Bayview | 2 | 26,598(0.01%)#72 | 234,088(0.00%)#1,232 |
| 73. | Thompsons | 1 | 26,598(0.00%)#73 | 234,088(0.00%)#1,241 |
Common Questions
What are the Top 10 Cities with the Most Immigrants from Iraq in Texas?
Top 10 Cities with the Most Immigrants from Iraq in Texas are:
#1
4,039
#2
1,932
#3
1,777
#4
1,379
#5
1,325
#6
1,137
#7
984
#8
719
#9
518
#10
430
What city has the Most Immigrants from Iraq in Texas?
Houston has the Most Immigrants from Iraq in Texas with 4,039.
What is the Total Immigrants from Iraq in the State of Texas?
Total Immigrants from Iraq in Texas is 26,598.
What is the Total Immigrants from Iraq in the United States?
Total Immigrants from Iraq in the United States is 234,088.