Charleston, IL Map & Demographics
Charleston Map
Charleston Overview
$28,162
PER CAPITA INCOME
$60,308
AVG FAMILY INCOME
$47,533
AVG HOUSEHOLD INCOME
15.8%
WAGE / INCOME GAP [ % ]
84.2¢/ $1
WAGE / INCOME GAP [ $ ]
$8,570
FAMILY INCOME DEFICIT
0.47
INEQUALITY / GINI INDEX
17,795
TOTAL POPULATION
8,705
MALE POPULATION
9,090
FEMALE POPULATION
95.76
MALES / 100 FEMALES
104.42
FEMALES / 100 MALES
29.4
MEDIAN AGE
2.5
AVG FAMILY SIZE
2.0
AVG HOUSEHOLD SIZE
10,483
LABOR FORCE [ PEOPLE ]
66.4%
PERCENT IN LABOR FORCE
6.5%
UNEMPLOYMENT RATE
Charleston Zip Codes
Charleston Area Codes
Income in Charleston
Income Overview in Charleston
Per Capita Income in Charleston is $28,162, while median incomes of families and households are $60,308 and $47,533 respectively.
| Characteristic | Number | Measure |
| Per Capita Income | 17,795 | $28,162 |
| Median Family Income | 3,659 | $60,308 |
| Mean Family Income | 3,659 | $80,683 |
| Median Household Income | 7,484 | $47,533 |
| Mean Household Income | 7,484 | $65,198 |
| Income Deficit | 3,659 | $8,570 |
| Wage / Income Gap (%) | 17,795 | 15.82% |
| Wage / Income Gap ($) | 17,795 | 84.18¢ per $1 |
| Gini / Inequality Index | 17,795 | 0.47 |
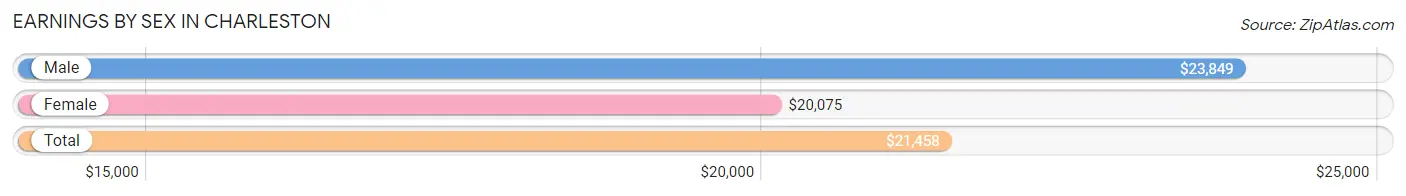
Earnings by Sex in Charleston
Average Earnings in Charleston are $21,458, $23,849 for men and $20,075 for women, a difference of 15.8%.
| Sex | Number | Average Earnings |
| Male | 5,634 (51.2%) | $23,849 |
| Female | 5,363 (48.8%) | $20,075 |
| Total | 10,997 (100.0%) | $21,458 |
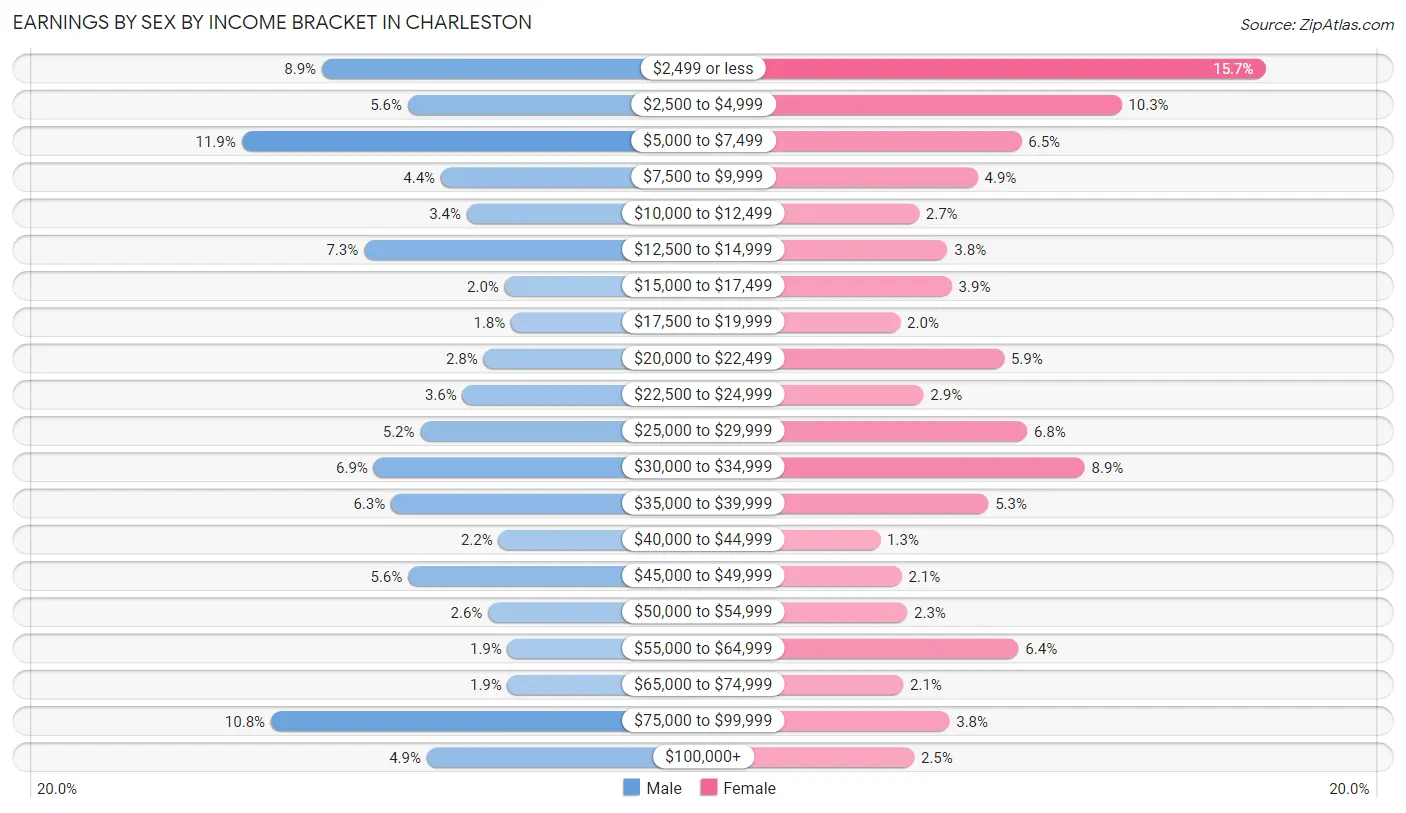
Earnings by Sex by Income Bracket in Charleston
The most common earnings brackets in Charleston are $5,000 to $7,499 for men (669 | 11.9%) and $2,499 or less for women (841 | 15.7%).
| Income | Male | Female |
| $2,499 or less | 499 (8.9%) | 841 (15.7%) |
| $2,500 to $4,999 | 318 (5.6%) | 552 (10.3%) |
| $5,000 to $7,499 | 669 (11.9%) | 351 (6.5%) |
| $7,500 to $9,999 | 248 (4.4%) | 263 (4.9%) |
| $10,000 to $12,499 | 193 (3.4%) | 145 (2.7%) |
| $12,500 to $14,999 | 410 (7.3%) | 202 (3.8%) |
| $15,000 to $17,499 | 113 (2.0%) | 211 (3.9%) |
| $17,500 to $19,999 | 100 (1.8%) | 107 (2.0%) |
| $20,000 to $22,499 | 158 (2.8%) | 316 (5.9%) |
| $22,500 to $24,999 | 202 (3.6%) | 154 (2.9%) |
| $25,000 to $29,999 | 291 (5.2%) | 362 (6.8%) |
| $30,000 to $34,999 | 390 (6.9%) | 478 (8.9%) |
| $35,000 to $39,999 | 353 (6.3%) | 284 (5.3%) |
| $40,000 to $44,999 | 126 (2.2%) | 67 (1.3%) |
| $45,000 to $49,999 | 317 (5.6%) | 110 (2.1%) |
| $50,000 to $54,999 | 148 (2.6%) | 121 (2.3%) |
| $55,000 to $64,999 | 107 (1.9%) | 345 (6.4%) |
| $65,000 to $74,999 | 107 (1.9%) | 113 (2.1%) |
| $75,000 to $99,999 | 607 (10.8%) | 206 (3.8%) |
| $100,000+ | 278 (4.9%) | 135 (2.5%) |
| Total | 5,634 (100.0%) | 5,363 (100.0%) |
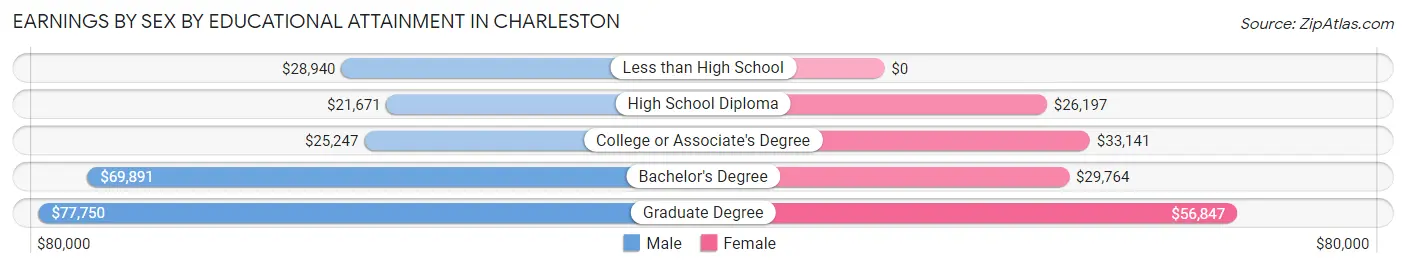
Earnings by Sex by Educational Attainment in Charleston
Average earnings in Charleston are $35,309 for men and $33,935 for women, a difference of 3.9%. Men with an educational attainment of graduate degree enjoy the highest average annual earnings of $77,750, while those with high school diploma education earn the least with $21,671. Women with an educational attainment of graduate degree earn the most with the average annual earnings of $56,847, while those with high school diploma education have the smallest earnings of $26,197.
| Educational Attainment | Male Income | Female Income |
| Less than High School | $28,940 | $0 |
| High School Diploma | $21,671 | $26,197 |
| College or Associate's Degree | $25,247 | $33,141 |
| Bachelor's Degree | $69,891 | $29,764 |
| Graduate Degree | $77,750 | $56,847 |
| Total | $35,309 | $33,935 |
Family Income in Charleston
Family Income Brackets in Charleston
According to the Charleston family income data, there are 703 families falling into the $50,000 to $74,999 income range, which is the most common income bracket and makes up 19.2% of all families. Conversely, the $200,000+ income bracket is the least frequent group with only 168 families (4.6%) belonging to this category.
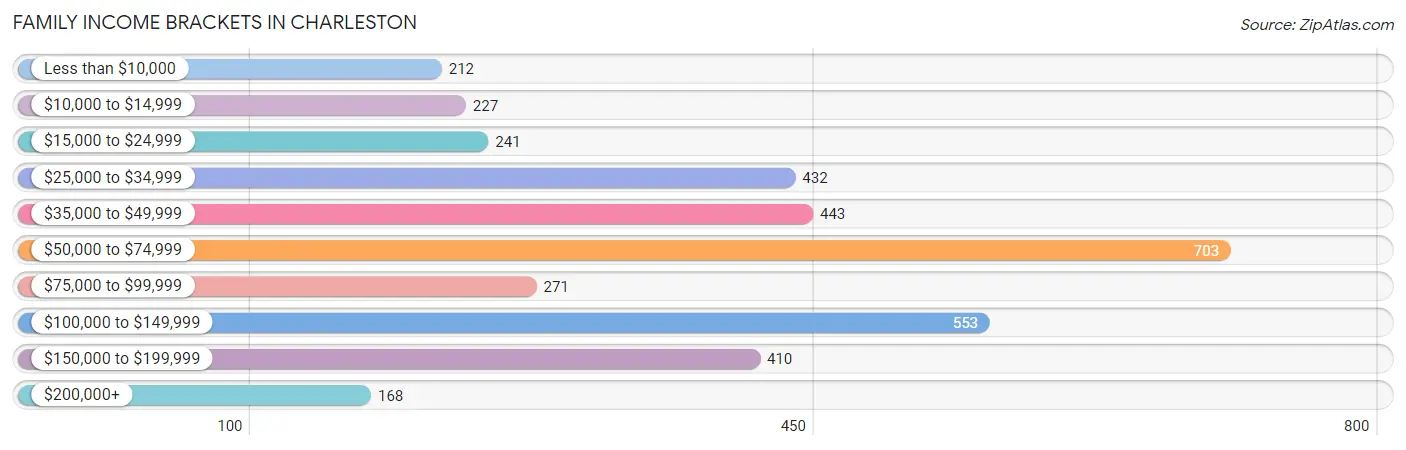
| Income Bracket | # Families | % Families |
| Less than $10,000 | 212 | 5.8% |
| $10,000 to $14,999 | 227 | 6.2% |
| $15,000 to $24,999 | 241 | 6.6% |
| $25,000 to $34,999 | 432 | 11.8% |
| $35,000 to $49,999 | 443 | 12.1% |
| $50,000 to $74,999 | 703 | 19.2% |
| $75,000 to $99,999 | 271 | 7.4% |
| $100,000 to $149,999 | 553 | 15.1% |
| $150,000 to $199,999 | 410 | 11.2% |
| $200,000+ | 168 | 4.6% |
Family Income by Famaliy Size in Charleston
5-person families (54 | 1.5%) account for the highest median family income in Charleston with $123,333 per family, while 2-person families (2,464 | 67.3%) have the highest median income of $28,394 per family member.
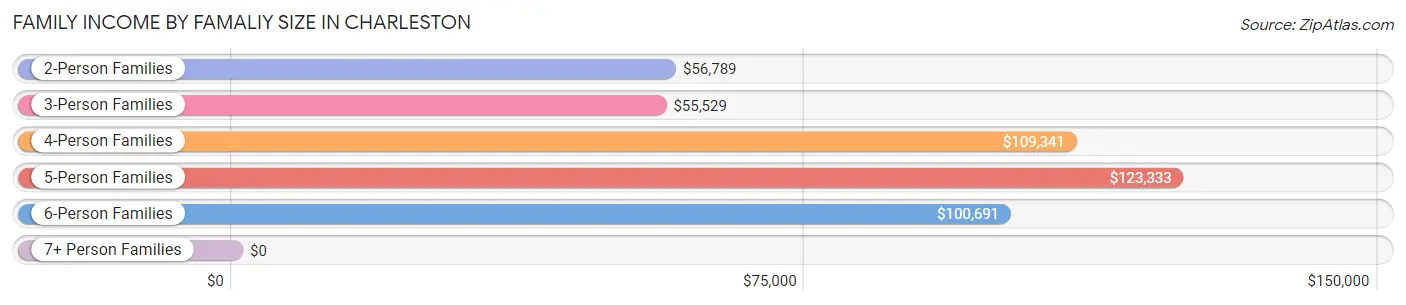
| Income Bracket | # Families | Median Income |
| 2-Person Families | 2,464 (67.3%) | $56,789 |
| 3-Person Families | 651 (17.8%) | $55,529 |
| 4-Person Families | 329 (9.0%) | $109,341 |
| 5-Person Families | 54 (1.5%) | $123,333 |
| 6-Person Families | 151 (4.1%) | $100,691 |
| 7+ Person Families | 10 (0.3%) | $0 |
| Total | 3,659 (100.0%) | $60,308 |
Family Income by Number of Earners in Charleston
The median family income in Charleston is $60,308, with families comprising 3+ earners (232) having the highest median family income of $109,662, while families with no earners (623) have the lowest median family income of $37,072, accounting for 6.3% and 17.0% of families, respectively.
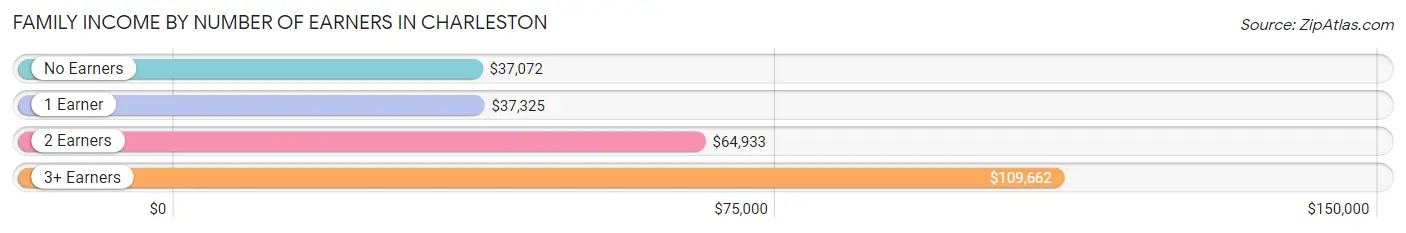
| Number of Earners | # Families | Median Income |
| No Earners | 623 (17.0%) | $37,072 |
| 1 Earner | 1,397 (38.2%) | $37,325 |
| 2 Earners | 1,407 (38.5%) | $64,933 |
| 3+ Earners | 232 (6.3%) | $109,662 |
| Total | 3,659 (100.0%) | $60,308 |
Household Income in Charleston
Household Income Brackets in Charleston
With 1,227 households falling in the category, the $50,000 to $74,999 income range is the most frequent in Charleston, accounting for 16.4% of all households. In contrast, only 195 households (2.6%) fall into the $200,000+ income bracket, making it the least populous group.
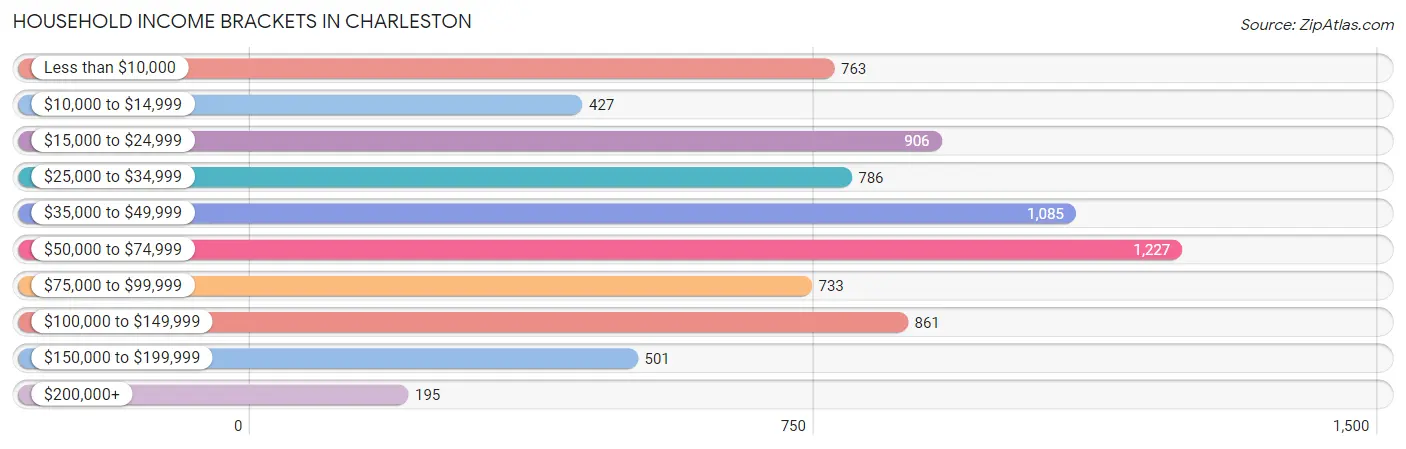
| Income Bracket | # Households | % Households |
| Less than $10,000 | 763 | 10.2% |
| $10,000 to $14,999 | 427 | 5.7% |
| $15,000 to $24,999 | 906 | 12.1% |
| $25,000 to $34,999 | 786 | 10.5% |
| $35,000 to $49,999 | 1,085 | 14.5% |
| $50,000 to $74,999 | 1,227 | 16.4% |
| $75,000 to $99,999 | 733 | 9.8% |
| $100,000 to $149,999 | 861 | 11.5% |
| $150,000 to $199,999 | 501 | 6.7% |
| $200,000+ | 195 | 2.6% |
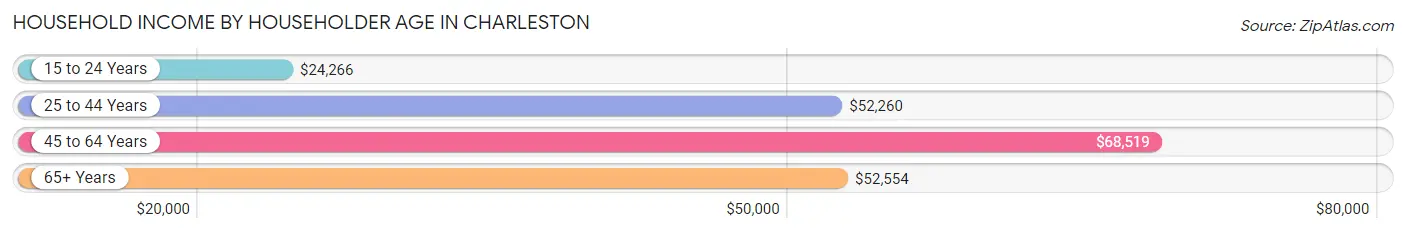
Household Income by Householder Age in Charleston
The median household income in Charleston is $47,533, with the highest median household income of $68,519 found in the 45 to 64 years age bracket for the primary householder. A total of 1,866 households (24.9%) fall into this category. Meanwhile, the 15 to 24 years age bracket for the primary householder has the lowest median household income of $24,266, with 1,639 households (21.9%) in this group.
| Income Bracket | # Households | Median Income |
| 15 to 24 Years | 1,639 (21.9%) | $24,266 |
| 25 to 44 Years | 2,340 (31.3%) | $52,260 |
| 45 to 64 Years | 1,866 (24.9%) | $68,519 |
| 65+ Years | 1,639 (21.9%) | $52,554 |
| Total | 7,484 (100.0%) | $47,533 |
Poverty in Charleston
Income Below Poverty by Sex and Age in Charleston
With 26.9% poverty level for males and 26.2% for females among the residents of Charleston, 15 year old males and under 5 year old females are the most vulnerable to poverty, with 25 males (67.6%) and 220 females (73.6%) in their respective age groups living below the poverty level.
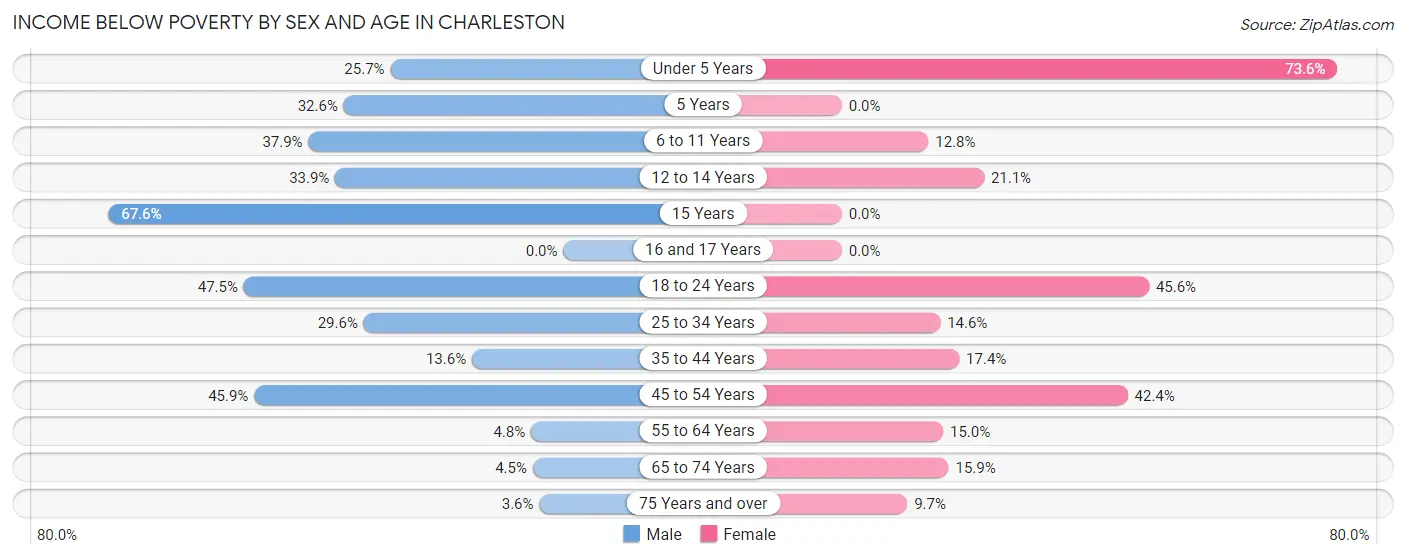
| Age Bracket | Male | Female |
| Under 5 Years | 75 (25.7%) | 220 (73.6%) |
| 5 Years | 30 (32.6%) | 0 (0.0%) |
| 6 to 11 Years | 162 (37.9%) | 43 (12.8%) |
| 12 to 14 Years | 62 (33.9%) | 38 (21.1%) |
| 15 Years | 25 (67.6%) | 0 (0.0%) |
| 16 and 17 Years | 0 (0.0%) | 0 (0.0%) |
| 18 to 24 Years | 780 (47.4%) | 727 (45.6%) |
| 25 to 34 Years | 375 (29.6%) | 165 (14.6%) |
| 35 to 44 Years | 120 (13.6%) | 133 (17.4%) |
| 45 to 54 Years | 303 (45.9%) | 334 (42.4%) |
| 55 to 64 Years | 47 (4.8%) | 133 (15.0%) |
| 65 to 74 Years | 24 (4.5%) | 110 (15.9%) |
| 75 Years and over | 16 (3.6%) | 64 (9.7%) |
| Total | 2,019 (26.9%) | 1,967 (26.2%) |
Income Above Poverty by Sex and Age in Charleston
According to the poverty statistics in Charleston, males aged 16 and 17 years and females aged 5 years are the age groups that are most secure financially, with 100.0% of males and 100.0% of females in these age groups living above the poverty line.
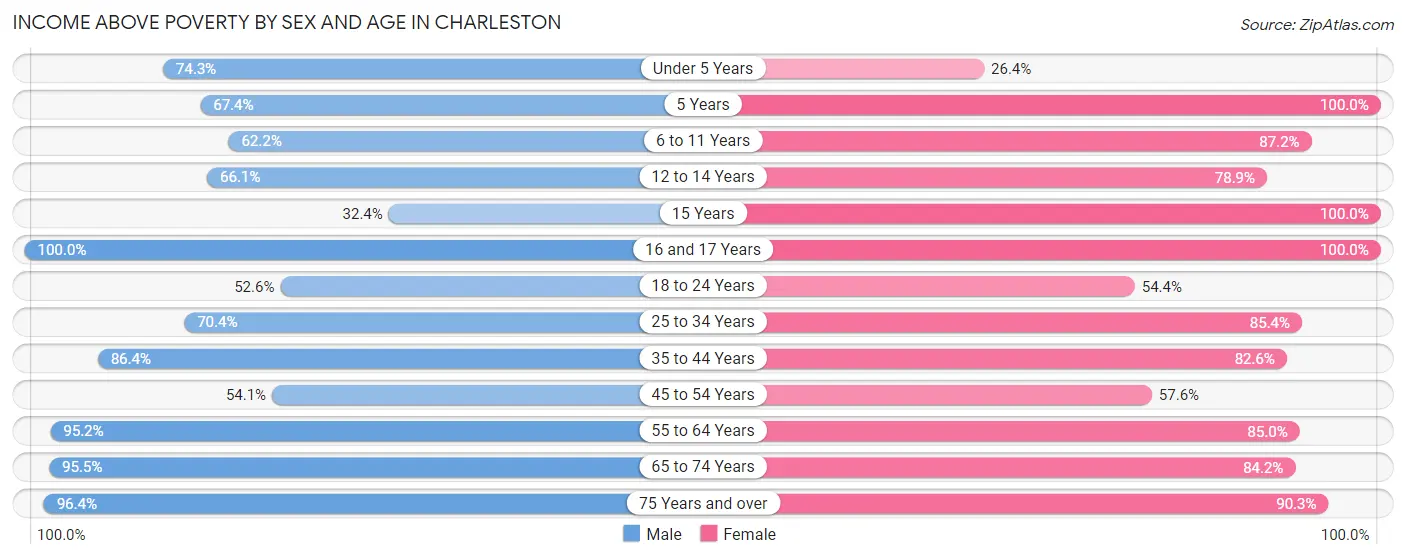
| Age Bracket | Male | Female |
| Under 5 Years | 217 (74.3%) | 79 (26.4%) |
| 5 Years | 62 (67.4%) | 42 (100.0%) |
| 6 to 11 Years | 266 (62.2%) | 292 (87.2%) |
| 12 to 14 Years | 121 (66.1%) | 142 (78.9%) |
| 15 Years | 12 (32.4%) | 37 (100.0%) |
| 16 and 17 Years | 57 (100.0%) | 119 (100.0%) |
| 18 to 24 Years | 864 (52.5%) | 867 (54.4%) |
| 25 to 34 Years | 890 (70.4%) | 964 (85.4%) |
| 35 to 44 Years | 764 (86.4%) | 630 (82.6%) |
| 45 to 54 Years | 357 (54.1%) | 453 (57.6%) |
| 55 to 64 Years | 934 (95.2%) | 752 (85.0%) |
| 65 to 74 Years | 505 (95.5%) | 584 (84.2%) |
| 75 Years and over | 434 (96.4%) | 595 (90.3%) |
| Total | 5,483 (73.1%) | 5,556 (73.9%) |
Income Below Poverty Among Married-Couple Families in Charleston
The poverty statistics for married-couple families in Charleston show that 11.9% or 319 of the total 2,687 families live below the poverty line. Families with 3 or 4 children have the highest poverty rate of 25.6%, comprising of 42 families. On the other hand, families with 1 or 2 children have the lowest poverty rate of 9.1%, which includes 57 families.
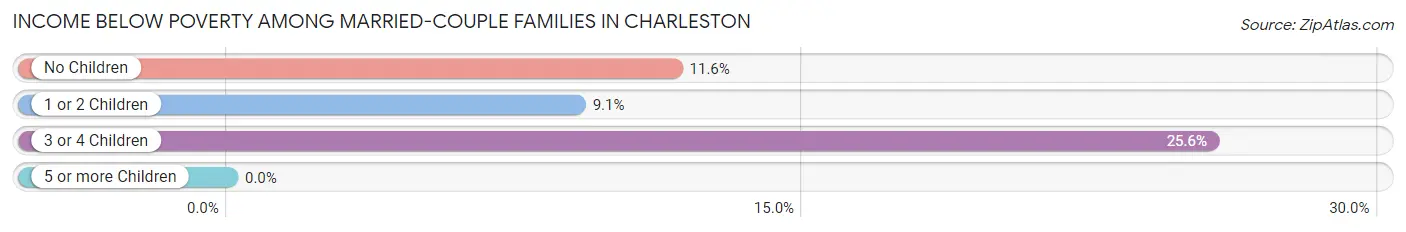
| Children | Above Poverty | Below Poverty |
| No Children | 1,675 (88.4%) | 220 (11.6%) |
| 1 or 2 Children | 571 (90.9%) | 57 (9.1%) |
| 3 or 4 Children | 122 (74.4%) | 42 (25.6%) |
| 5 or more Children | 0 (0.0%) | 0 (0.0%) |
| Total | 2,368 (88.1%) | 319 (11.9%) |
Income Below Poverty Among Single-Parent Households in Charleston
According to the poverty data in Charleston, 30.8% or 91 single-father households and 35.2% or 238 single-mother households are living below the poverty line. Among single-father households, those with 1 or 2 children have the highest poverty rate, with 68 households (46.9%) experiencing poverty. Likewise, among single-mother households, those with 1 or 2 children have the highest poverty rate, with 199 households (65.5%) falling below the poverty line.
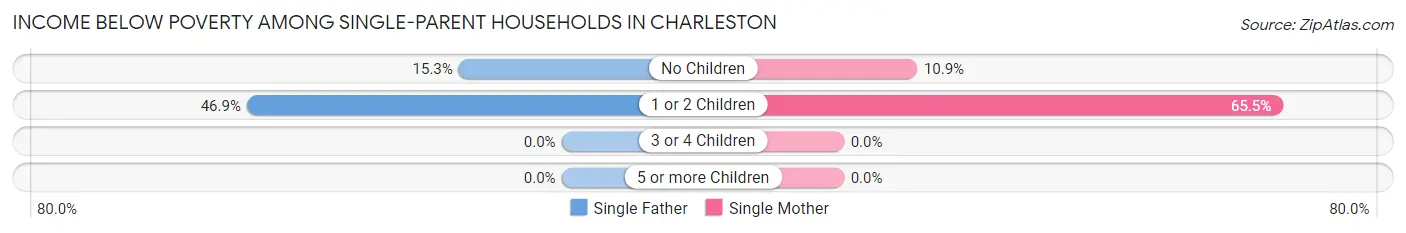
| Children | Single Father | Single Mother |
| No Children | 23 (15.3%) | 39 (10.9%) |
| 1 or 2 Children | 68 (46.9%) | 199 (65.5%) |
| 3 or 4 Children | 0 (0.0%) | 0 (0.0%) |
| 5 or more Children | 0 (0.0%) | 0 (0.0%) |
| Total | 91 (30.8%) | 238 (35.2%) |
Income Below Poverty Among Married-Couple vs Single-Parent Households in Charleston
The poverty data for Charleston shows that 319 of the married-couple family households (11.9%) and 329 of the single-parent households (33.9%) are living below the poverty level. Within the married-couple family households, those with 3 or 4 children have the highest poverty rate, with 42 households (25.6%) falling below the poverty line. Among the single-parent households, those with 1 or 2 children have the highest poverty rate, with 267 household (59.5%) living below poverty.
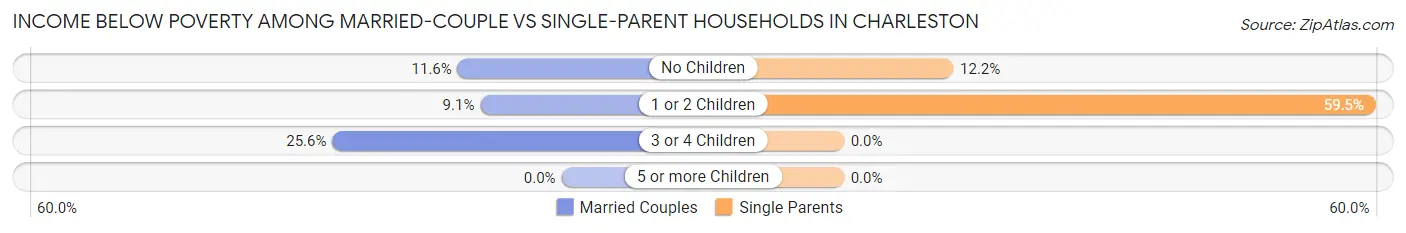
| Children | Married-Couple Families | Single-Parent Households |
| No Children | 220 (11.6%) | 62 (12.2%) |
| 1 or 2 Children | 57 (9.1%) | 267 (59.5%) |
| 3 or 4 Children | 42 (25.6%) | 0 (0.0%) |
| 5 or more Children | 0 (0.0%) | 0 (0.0%) |
| Total | 319 (11.9%) | 329 (33.9%) |
Race in Charleston
The most populous races in Charleston are White / Caucasian (15,394 | 86.5%), Black / African American (1,299 | 7.3%), and Hispanic or Latino (711 | 4.0%).
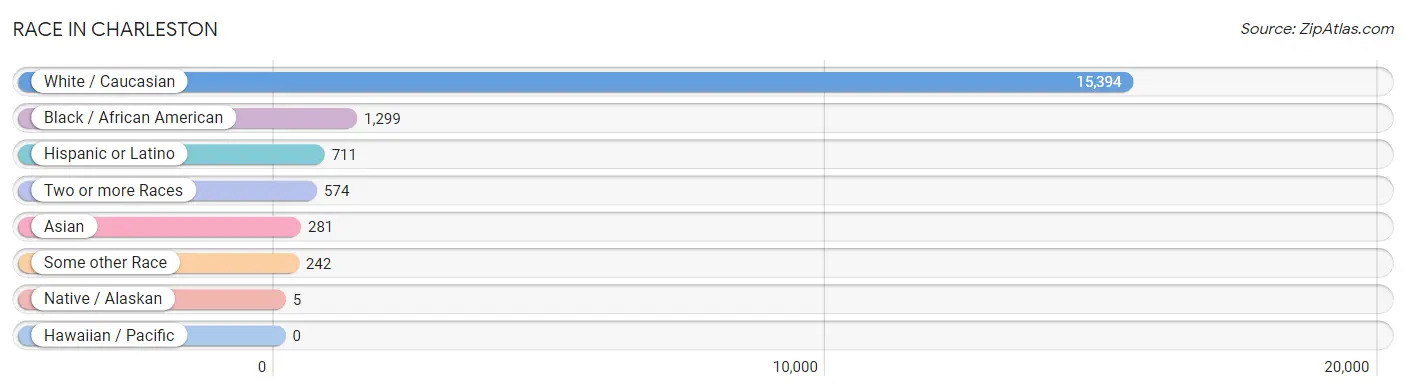
| Race | # Population | % Population |
| Asian | 281 | 1.6% |
| Black / African American | 1,299 | 7.3% |
| Hawaiian / Pacific | 0 | 0.0% |
| Hispanic or Latino | 711 | 4.0% |
| Native / Alaskan | 5 | 0.0% |
| White / Caucasian | 15,394 | 86.5% |
| Two or more Races | 574 | 3.2% |
| Some other Race | 242 | 1.4% |
| Total | 17,795 | 100.0% |
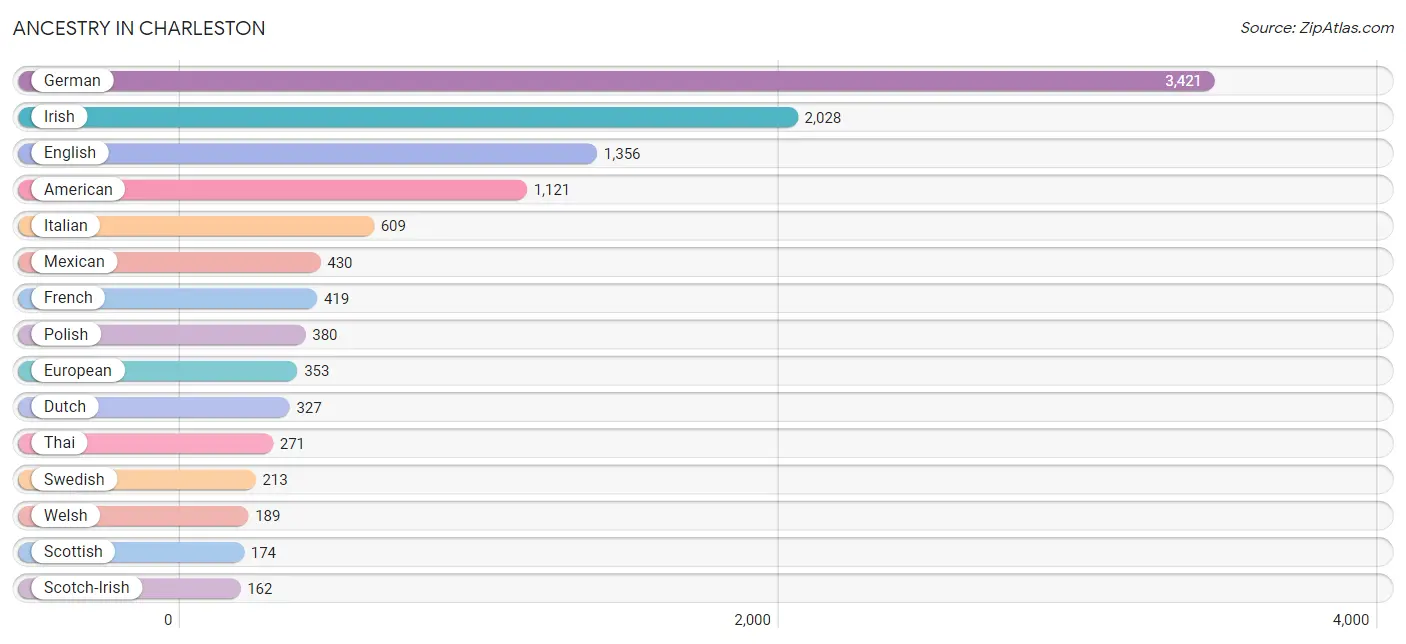
Ancestry in Charleston
The most populous ancestries reported in Charleston are German (3,421 | 19.2%), Irish (2,028 | 11.4%), English (1,356 | 7.6%), American (1,121 | 6.3%), and Italian (609 | 3.4%), together accounting for 48.0% of all Charleston residents.
| Ancestry | # Population | % Population |
| African | 90 | 0.5% |
| American | 1,121 | 6.3% |
| Assyrian / Chaldean / Syriac | 93 | 0.5% |
| Austrian | 25 | 0.1% |
| Belizean | 11 | 0.1% |
| Blackfeet | 4 | 0.0% |
| Brazilian | 91 | 0.5% |
| British | 66 | 0.4% |
| Burmese | 25 | 0.1% |
| Canadian | 55 | 0.3% |
| Central American | 32 | 0.2% |
| Cherokee | 33 | 0.2% |
| Cheyenne | 5 | 0.0% |
| Choctaw | 9 | 0.1% |
| Colombian | 65 | 0.4% |
| Czech | 73 | 0.4% |
| Czechoslovakian | 65 | 0.4% |
| Danish | 60 | 0.3% |
| Dutch | 327 | 1.8% |
| Eastern European | 69 | 0.4% |
| English | 1,356 | 7.6% |
| European | 353 | 2.0% |
| French | 419 | 2.4% |
| French Canadian | 115 | 0.6% |
| German | 3,421 | 19.2% |
| Ghanaian | 29 | 0.2% |
| Greek | 21 | 0.1% |
| Hungarian | 25 | 0.1% |
| Indian (Asian) | 102 | 0.6% |
| Inupiat | 1 | 0.0% |
| Irish | 2,028 | 11.4% |
| Italian | 609 | 3.4% |
| Jamaican | 3 | 0.0% |
| Japanese | 3 | 0.0% |
| Korean | 50 | 0.3% |
| Lithuanian | 12 | 0.1% |
| Macedonian | 8 | 0.0% |
| Mexican | 430 | 2.4% |
| Navajo | 5 | 0.0% |
| Northern European | 4 | 0.0% |
| Norwegian | 63 | 0.4% |
| Pakistani | 6 | 0.0% |
| Polish | 380 | 2.1% |
| Portuguese | 112 | 0.6% |
| Potawatomi | 3 | 0.0% |
| Puerto Rican | 79 | 0.4% |
| Russian | 66 | 0.4% |
| Salvadoran | 32 | 0.2% |
| Scotch-Irish | 162 | 0.9% |
| Scottish | 174 | 1.0% |
| Slovak | 10 | 0.1% |
| South American | 65 | 0.4% |
| Subsaharan African | 138 | 0.8% |
| Sudanese | 6 | 0.0% |
| Swedish | 213 | 1.2% |
| Swiss | 42 | 0.2% |
| Thai | 271 | 1.5% |
| Welsh | 189 | 1.1% | View All 58 Rows |
Immigrants in Charleston
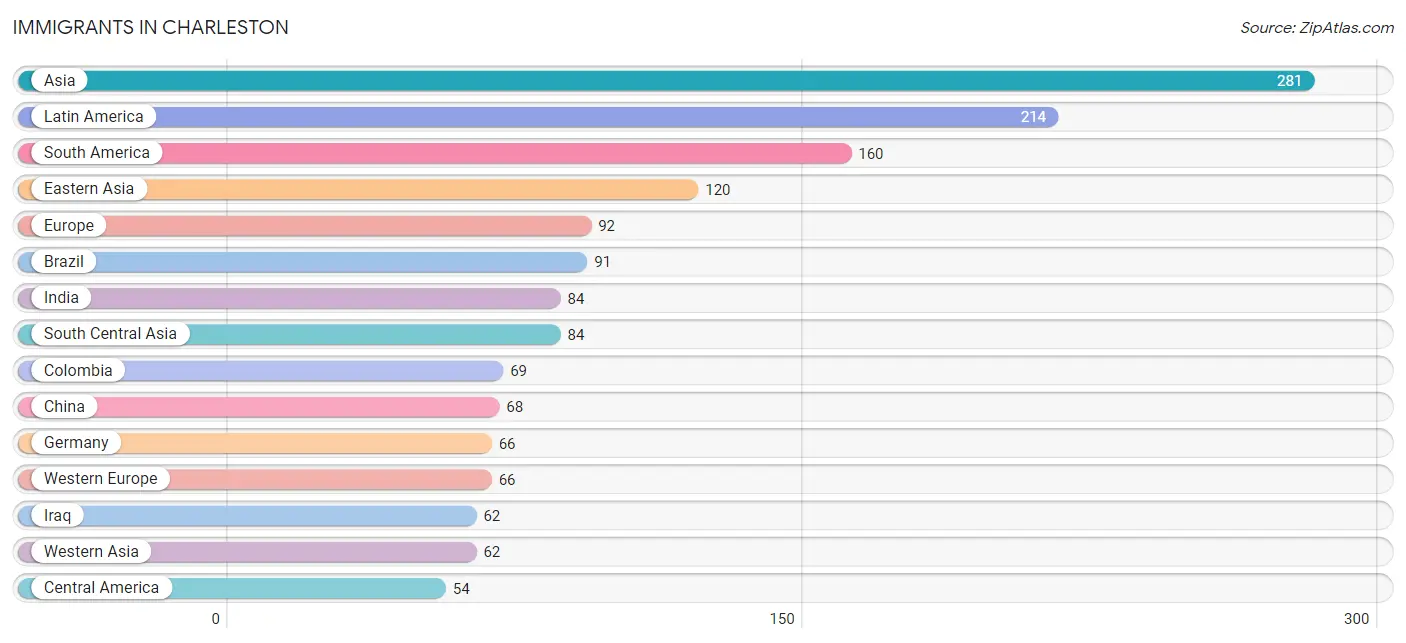
The most numerous immigrant groups reported in Charleston came from Asia (281 | 1.6%), Latin America (214 | 1.2%), South America (160 | 0.9%), Eastern Asia (120 | 0.7%), and Europe (92 | 0.5%), together accounting for 4.9% of all Charleston residents.
| Immigration Origin | # Population | % Population |
| Africa | 44 | 0.3% |
| Asia | 281 | 1.6% |
| Brazil | 91 | 0.5% |
| Cambodia | 3 | 0.0% |
| Central America | 54 | 0.3% |
| China | 68 | 0.4% |
| Colombia | 69 | 0.4% |
| Eastern Africa | 3 | 0.0% |
| Eastern Asia | 120 | 0.7% |
| Eastern Europe | 26 | 0.2% |
| Ethiopia | 3 | 0.0% |
| Europe | 92 | 0.5% |
| Germany | 66 | 0.4% |
| Ghana | 29 | 0.2% |
| India | 84 | 0.5% |
| Iraq | 62 | 0.4% |
| Japan | 8 | 0.0% |
| Korea | 44 | 0.3% |
| Latin America | 214 | 1.2% |
| Mexico | 54 | 0.3% |
| Middle Africa | 3 | 0.0% |
| Nigeria | 3 | 0.0% |
| North Macedonia | 8 | 0.0% |
| Northern Africa | 6 | 0.0% |
| Philippines | 6 | 0.0% |
| Russia | 18 | 0.1% |
| South America | 160 | 0.9% |
| South Central Asia | 84 | 0.5% |
| South Eastern Asia | 15 | 0.1% |
| Sudan | 6 | 0.0% |
| Thailand | 6 | 0.0% |
| Western Africa | 32 | 0.2% |
| Western Asia | 62 | 0.4% |
| Western Europe | 66 | 0.4% |
| Zaire | 3 | 0.0% | View All 35 Rows |
Sex and Age in Charleston
Sex and Age in Charleston
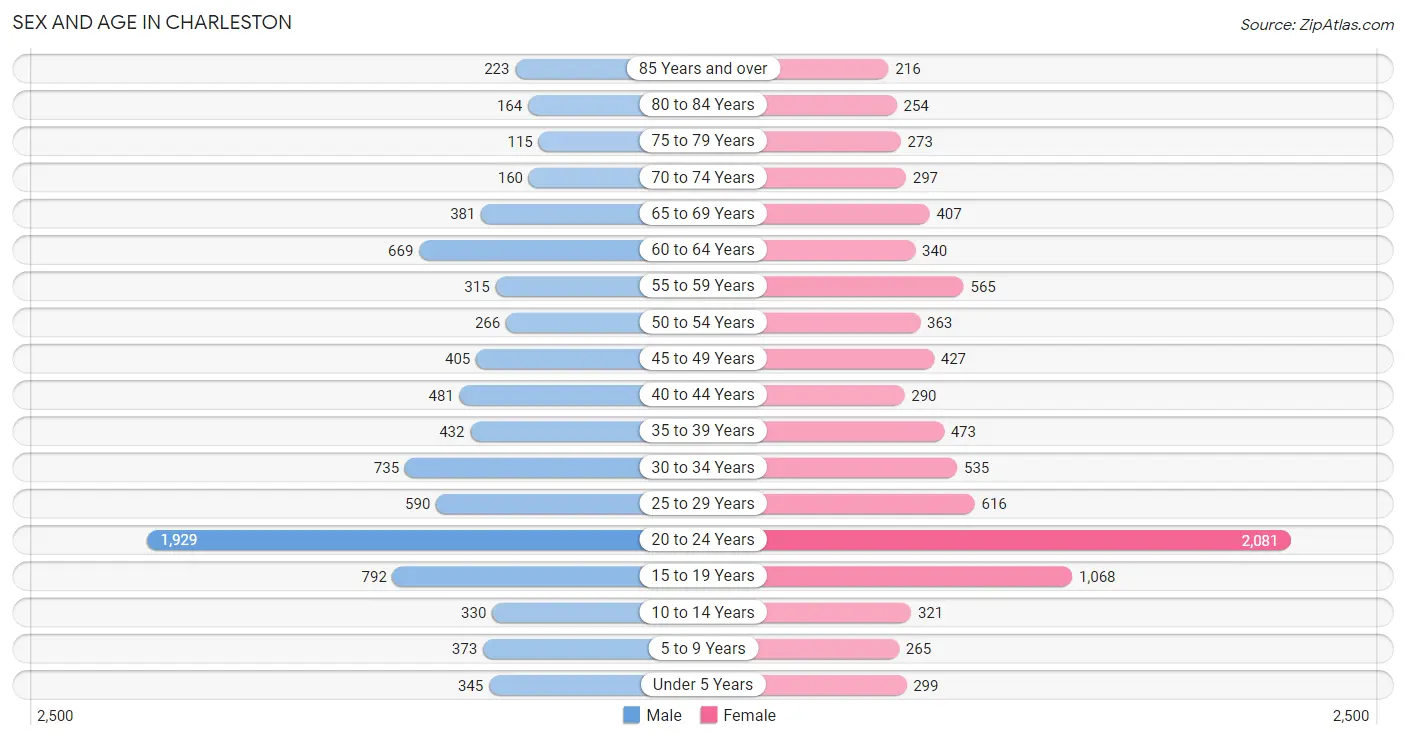
The most populous age groups in Charleston are 20 to 24 Years (1,929 | 22.2%) for men and 20 to 24 Years (2,081 | 22.9%) for women.
| Age Bracket | Male | Female |
| Under 5 Years | 345 (4.0%) | 299 (3.3%) |
| 5 to 9 Years | 373 (4.3%) | 265 (2.9%) |
| 10 to 14 Years | 330 (3.8%) | 321 (3.5%) |
| 15 to 19 Years | 792 (9.1%) | 1,068 (11.7%) |
| 20 to 24 Years | 1,929 (22.2%) | 2,081 (22.9%) |
| 25 to 29 Years | 590 (6.8%) | 616 (6.8%) |
| 30 to 34 Years | 735 (8.4%) | 535 (5.9%) |
| 35 to 39 Years | 432 (5.0%) | 473 (5.2%) |
| 40 to 44 Years | 481 (5.5%) | 290 (3.2%) |
| 45 to 49 Years | 405 (4.6%) | 427 (4.7%) |
| 50 to 54 Years | 266 (3.1%) | 363 (4.0%) |
| 55 to 59 Years | 315 (3.6%) | 565 (6.2%) |
| 60 to 64 Years | 669 (7.7%) | 340 (3.7%) |
| 65 to 69 Years | 381 (4.4%) | 407 (4.5%) |
| 70 to 74 Years | 160 (1.8%) | 297 (3.3%) |
| 75 to 79 Years | 115 (1.3%) | 273 (3.0%) |
| 80 to 84 Years | 164 (1.9%) | 254 (2.8%) |
| 85 Years and over | 223 (2.6%) | 216 (2.4%) |
| Total | 8,705 (100.0%) | 9,090 (100.0%) |
Families and Households in Charleston
Median Family Size in Charleston
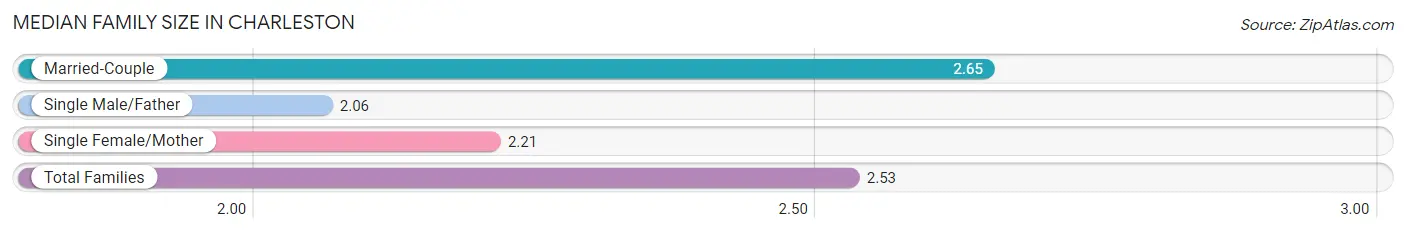
The median family size in Charleston is 2.53 persons per family, with married-couple families (2,687 | 73.4%) accounting for the largest median family size of 2.65 persons per family. On the other hand, single male/father families (295 | 8.1%) represent the smallest median family size with 2.06 persons per family.
| Family Type | # Families | Family Size |
| Married-Couple | 2,687 (73.4%) | 2.65 |
| Single Male/Father | 295 (8.1%) | 2.06 |
| Single Female/Mother | 677 (18.5%) | 2.21 |
| Total Families | 3,659 (100.0%) | 2.53 |
Median Household Size in Charleston
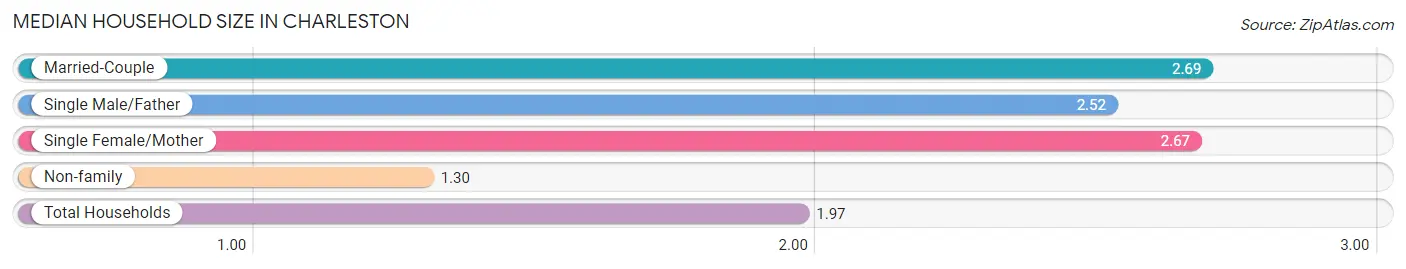
The median household size in Charleston is 1.97 persons per household, with married-couple households (2,687 | 35.9%) accounting for the largest median household size of 2.69 persons per household. non-family households (3,825 | 51.1%) represent the smallest median household size with 1.30 persons per household.
| Household Type | # Households | Household Size |
| Married-Couple | 2,687 (35.9%) | 2.69 |
| Single Male/Father | 295 (3.9%) | 2.52 |
| Single Female/Mother | 677 (9.0%) | 2.67 |
| Non-family | 3,825 (51.1%) | 1.30 |
| Total Households | 7,484 (100.0%) | 1.97 |
Household Size by Marriage Status in Charleston
Out of a total of 7,484 households in Charleston, 3,659 (48.9%) are family households, while 3,825 (51.1%) are nonfamily households. The most numerous type of family households are 2-person households, comprising 2,093, and the most common type of nonfamily households are 1-person households, comprising 2,747.
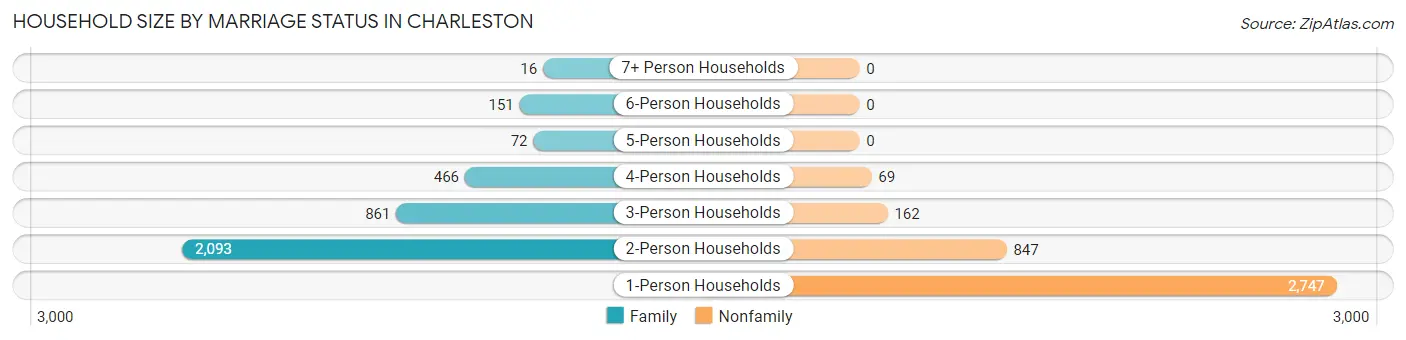
| Household Size | Family Households | Nonfamily Households |
| 1-Person Households | - | 2,747 (36.7%) |
| 2-Person Households | 2,093 (28.0%) | 847 (11.3%) |
| 3-Person Households | 861 (11.5%) | 162 (2.2%) |
| 4-Person Households | 466 (6.2%) | 69 (0.9%) |
| 5-Person Households | 72 (1.0%) | 0 (0.0%) |
| 6-Person Households | 151 (2.0%) | 0 (0.0%) |
| 7+ Person Households | 16 (0.2%) | 0 (0.0%) |
| Total | 3,659 (48.9%) | 3,825 (51.1%) |
Female Fertility in Charleston
Fertility by Age in Charleston
Average fertility rate in Charleston is 32.0 births per 1,000 women. Women in the age bracket of 20 to 34 years have the highest fertility rate with 54.0 births per 1,000 women. Women in the age bracket of 20 to 34 years acount for 100.0% of all women with births.
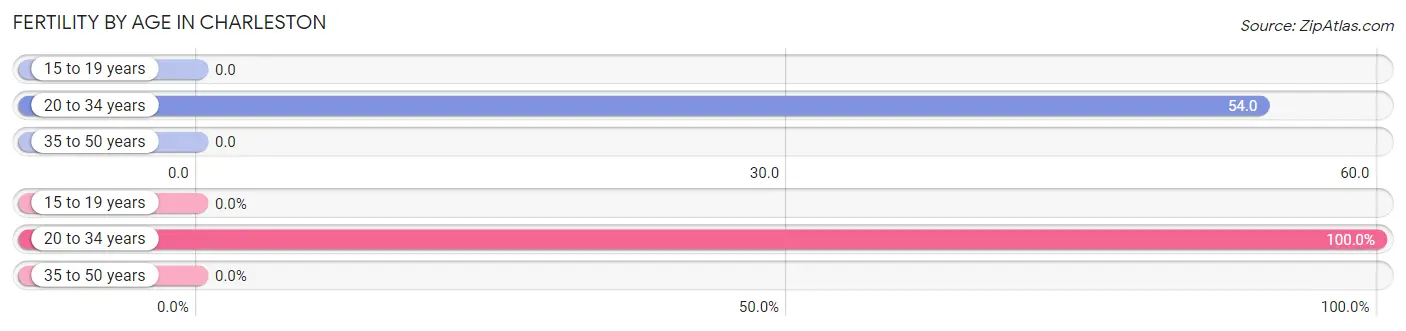
| Age Bracket | Women with Births | Births / 1,000 Women |
| 15 to 19 years | 0 (0.0%) | 0.0 |
| 20 to 34 years | 176 (100.0%) | 54.0 |
| 35 to 50 years | 0 (0.0%) | 0.0 |
| Total | 176 (100.0%) | 32.0 |
Fertility by Age by Marriage Status in Charleston
31.2% of women with births (176) in Charleston are married. The highest percentage of unmarried women with births falls into 20 to 34 years age bracket with 68.8% of them unmarried at the time of birth, while the lowest percentage of unmarried women with births belong to 20 to 34 years age bracket with 68.8% of them unmarried.
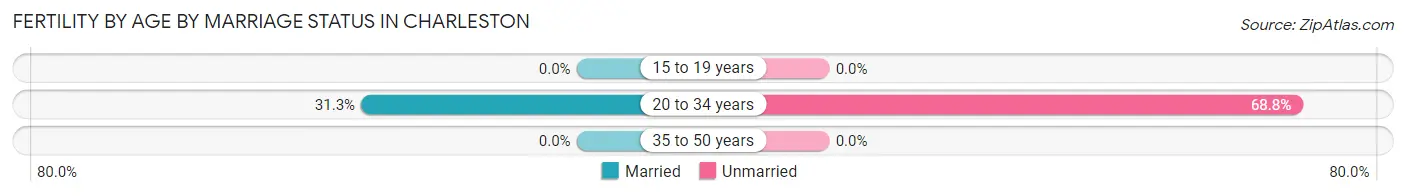
| Age Bracket | Married | Unmarried |
| 15 to 19 years | 0 (0.0%) | 0 (0.0%) |
| 20 to 34 years | 55 (31.2%) | 121 (68.8%) |
| 35 to 50 years | 0 (0.0%) | 0 (0.0%) |
| Total | 55 (31.2%) | 121 (68.8%) |
Fertility by Education in Charleston
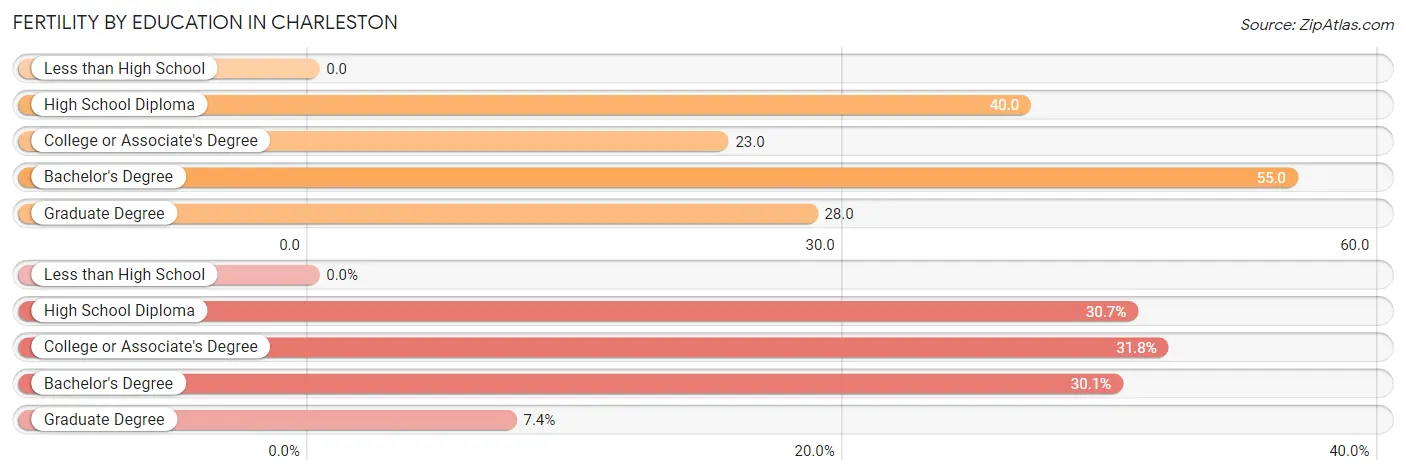
| Educational Attainment | Women with Births | Births / 1,000 Women |
| Less than High School | 0 (0.0%) | 0.0 |
| High School Diploma | 54 (30.7%) | 40.0 |
| College or Associate's Degree | 56 (31.8%) | 23.0 |
| Bachelor's Degree | 53 (30.1%) | 55.0 |
| Graduate Degree | 13 (7.4%) | 28.0 |
| Total | 176 (100.0%) | 32.0 |
Fertility by Education by Marriage Status in Charleston
68.8% of women with births in Charleston are unmarried. Women with the educational attainment of graduate degree are most likely to be married with 100.0% of them married at childbirth, while women with the educational attainment of bachelor's degree are least likely to be married with 100.0% of them unmarried at childbirth.
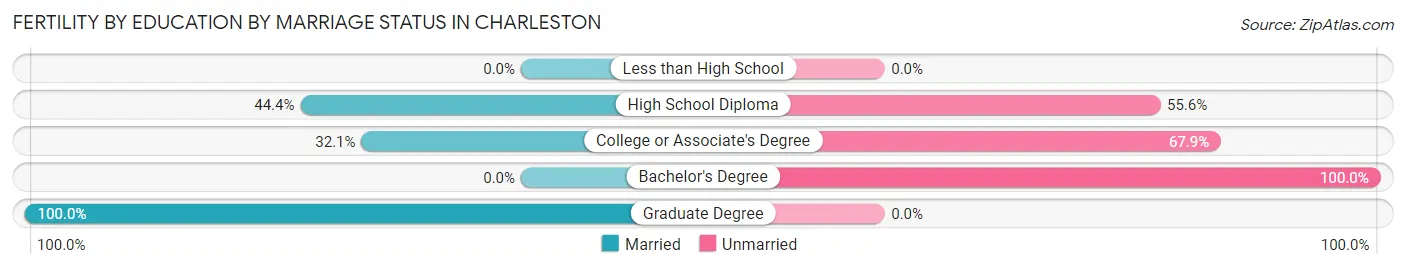
| Educational Attainment | Married | Unmarried |
| Less than High School | 0 (0.0%) | 0 (0.0%) |
| High School Diploma | 24 (44.4%) | 30 (55.6%) |
| College or Associate's Degree | 18 (32.1%) | 38 (67.9%) |
| Bachelor's Degree | 0 (0.0%) | 53 (100.0%) |
| Graduate Degree | 13 (100.0%) | 0 (0.0%) |
| Total | 55 (31.2%) | 121 (68.8%) |
Employment Characteristics in Charleston
Employment by Class of Employer in Charleston
Among the 9,373 employed individuals in Charleston, private company employees (5,609 | 59.8%), not-for-profit organizations (1,426 | 15.2%), and state government employees (1,082 | 11.5%) make up the most common classes of employment.
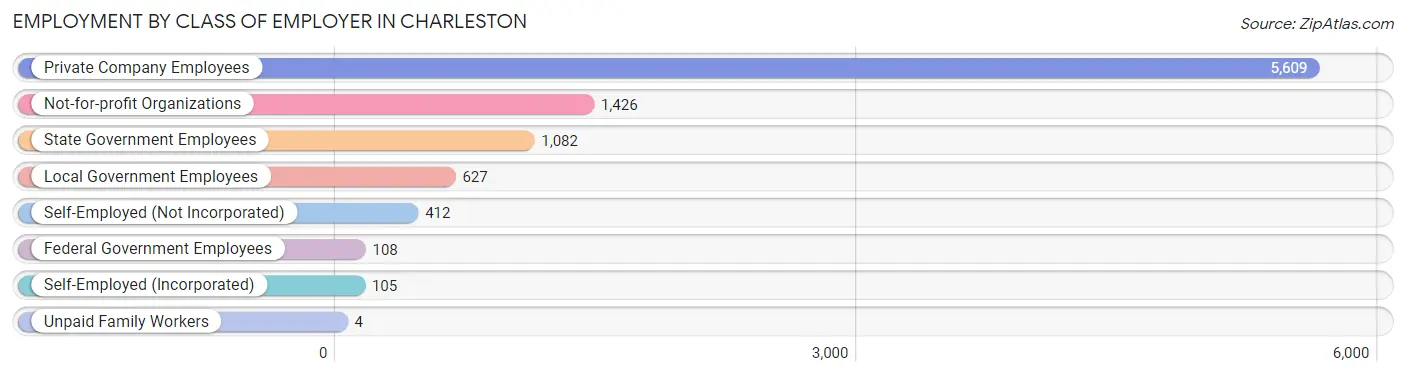
| Employer Class | # Employees | % Employees |
| Private Company Employees | 5,609 | 59.8% |
| Self-Employed (Incorporated) | 105 | 1.1% |
| Self-Employed (Not Incorporated) | 412 | 4.4% |
| Not-for-profit Organizations | 1,426 | 15.2% |
| Local Government Employees | 627 | 6.7% |
| State Government Employees | 1,082 | 11.5% |
| Federal Government Employees | 108 | 1.1% |
| Unpaid Family Workers | 4 | 0.0% |
| Total | 9,373 | 100.0% |
Employment Status by Age in Charleston
According to the labor force statistics for Charleston, out of the total population over 16 years of age (15,788), 66.4% or 10,483 individuals are in the labor force, with 6.5% or 681 of them unemployed. The age group with the highest labor force participation rate is 35 to 44 years, with 85.2% or 1,428 individuals in the labor force. Within the labor force, the 75 years and over age range has the highest percentage of unemployed individuals, with 31.4% or 11 of them being unemployed.
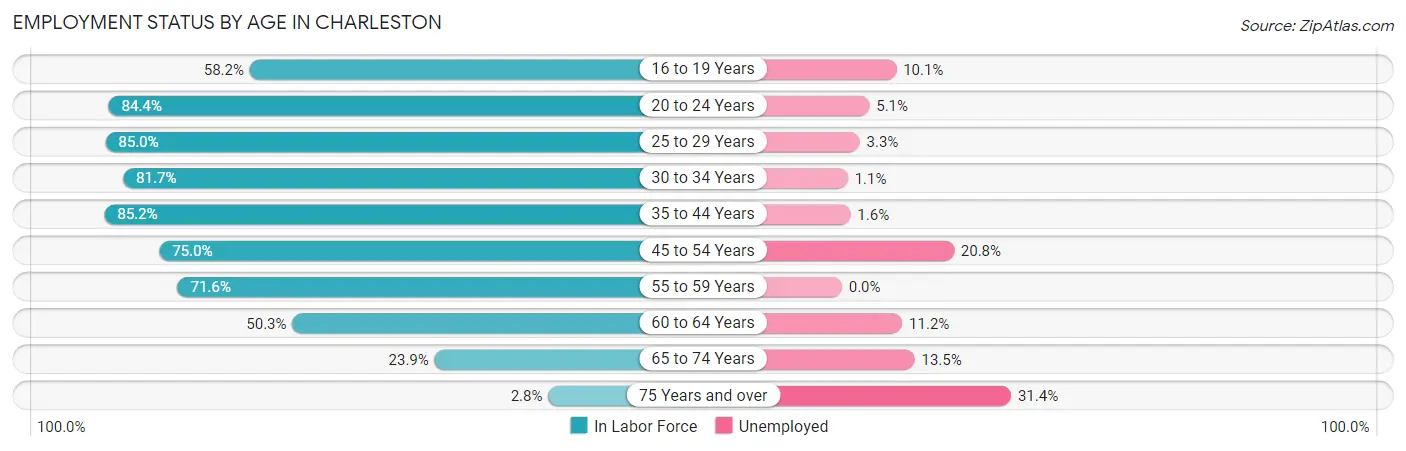
| Age Bracket | In Labor Force | Unemployed |
| 16 to 19 Years | 1,039 (58.2%) | 105 (10.1%) |
| 20 to 24 Years | 3,384 (84.4%) | 173 (5.1%) |
| 25 to 29 Years | 1,025 (85.0%) | 34 (3.3%) |
| 30 to 34 Years | 1,038 (81.7%) | 11 (1.1%) |
| 35 to 44 Years | 1,428 (85.2%) | 23 (1.6%) |
| 45 to 54 Years | 1,096 (75.0%) | 228 (20.8%) |
| 55 to 59 Years | 630 (71.6%) | 0 (0.0%) |
| 60 to 64 Years | 508 (50.3%) | 57 (11.2%) |
| 65 to 74 Years | 298 (23.9%) | 40 (13.5%) |
| 75 Years and over | 35 (2.8%) | 11 (31.4%) |
| Total | 10,483 (66.4%) | 681 (6.5%) |
Employment Status by Educational Attainment in Charleston
According to labor force statistics for Charleston, 76.3% of individuals (5,724) out of the total population between 25 and 64 years of age (7,502) are in the labor force, with 6.2% or 355 of them being unemployed. The group with the highest labor force participation rate are those with the educational attainment of bachelor's degree or higher, with 91.5% or 2,316 individuals in the labor force. Within the labor force, individuals with less than high school education have the highest percentage of unemployment, with 33.8% or 78 of them being unemployed.
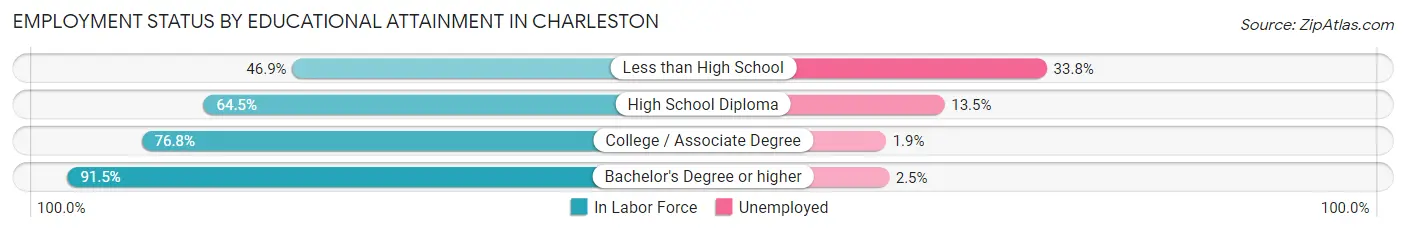
| Educational Attainment | In Labor Force | Unemployed |
| Less than High School | 231 (46.9%) | 167 (33.8%) |
| High School Diploma | 1,371 (64.5%) | 287 (13.5%) |
| College / Associate Degree | 1,807 (76.8%) | 45 (1.9%) |
| Bachelor's Degree or higher | 2,316 (91.5%) | 63 (2.5%) |
| Total | 5,724 (76.3%) | 465 (6.2%) |
Employment Occupations by Sex in Charleston
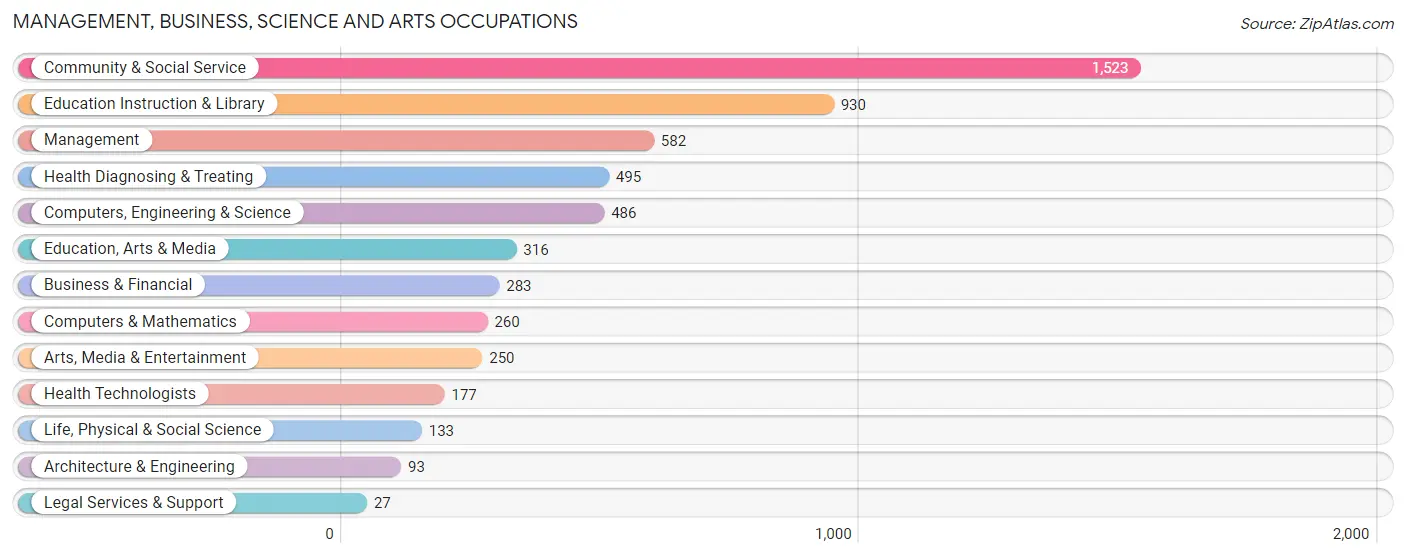
Management, Business, Science and Arts Occupations
The most common Management, Business, Science and Arts occupations in Charleston are Community & Social Service (1,523 | 15.6%), Education Instruction & Library (930 | 9.6%), Management (582 | 6.0%), Health Diagnosing & Treating (495 | 5.1%), and Computers, Engineering & Science (486 | 5.0%).
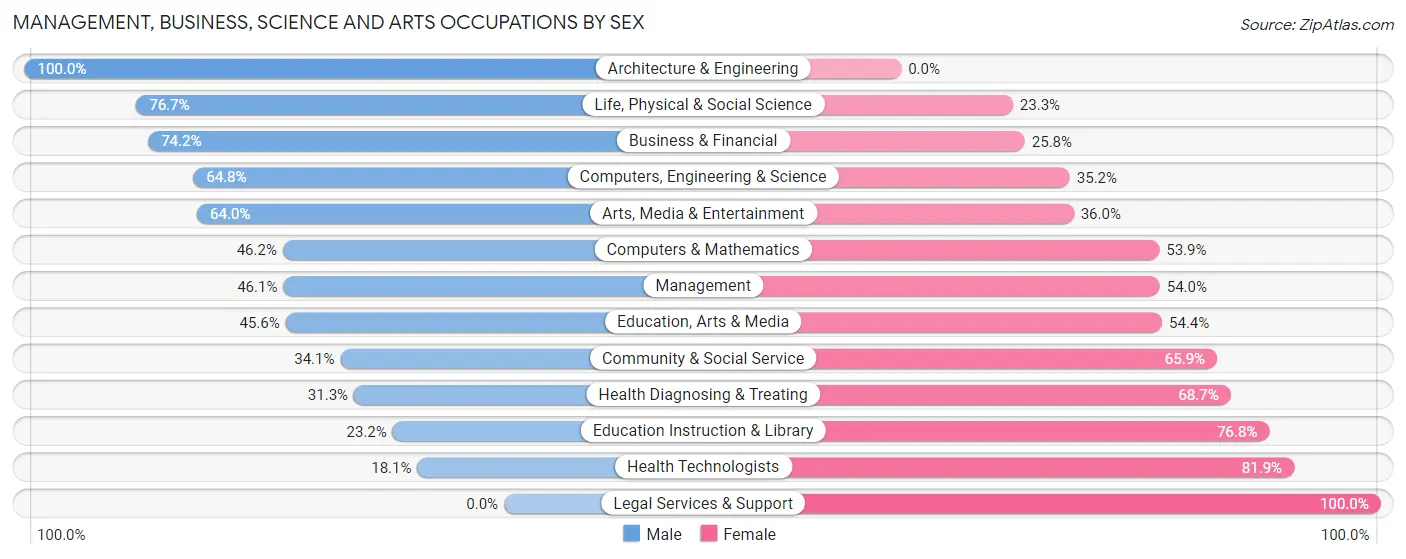
Management, Business, Science and Arts Occupations by Sex
Within the Management, Business, Science and Arts occupations in Charleston, the most male-oriented occupations are Architecture & Engineering (100.0%), Life, Physical & Social Science (76.7%), and Business & Financial (74.2%), while the most female-oriented occupations are Legal Services & Support (100.0%), Health Technologists (81.9%), and Education Instruction & Library (76.8%).
| Occupation | Male | Female |
| Management | 268 (46.1%) | 314 (53.9%) |
| Business & Financial | 210 (74.2%) | 73 (25.8%) |
| Computers, Engineering & Science | 315 (64.8%) | 171 (35.2%) |
| Computers & Mathematics | 120 (46.2%) | 140 (53.8%) |
| Architecture & Engineering | 93 (100.0%) | 0 (0.0%) |
| Life, Physical & Social Science | 102 (76.7%) | 31 (23.3%) |
| Community & Social Service | 520 (34.1%) | 1,003 (65.9%) |
| Education, Arts & Media | 144 (45.6%) | 172 (54.4%) |
| Legal Services & Support | 0 (0.0%) | 27 (100.0%) |
| Education Instruction & Library | 216 (23.2%) | 714 (76.8%) |
| Arts, Media & Entertainment | 160 (64.0%) | 90 (36.0%) |
| Health Diagnosing & Treating | 155 (31.3%) | 340 (68.7%) |
| Health Technologists | 32 (18.1%) | 145 (81.9%) |
| Total (Category) | 1,468 (43.6%) | 1,901 (56.4%) |
| Total (Overall) | 4,939 (50.7%) | 4,803 (49.3%) |
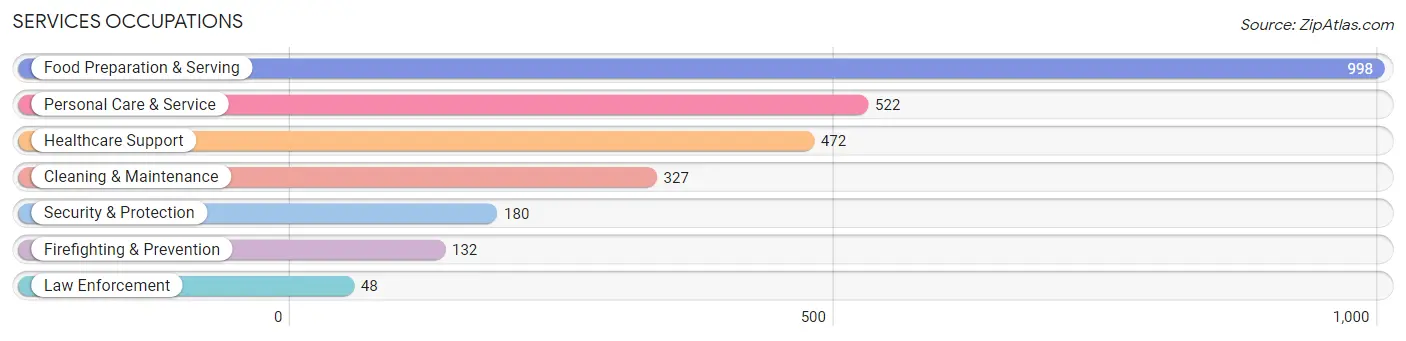
Services Occupations
The most common Services occupations in Charleston are Food Preparation & Serving (998 | 10.2%), Personal Care & Service (522 | 5.4%), Healthcare Support (472 | 4.9%), Cleaning & Maintenance (327 | 3.4%), and Security & Protection (180 | 1.8%).
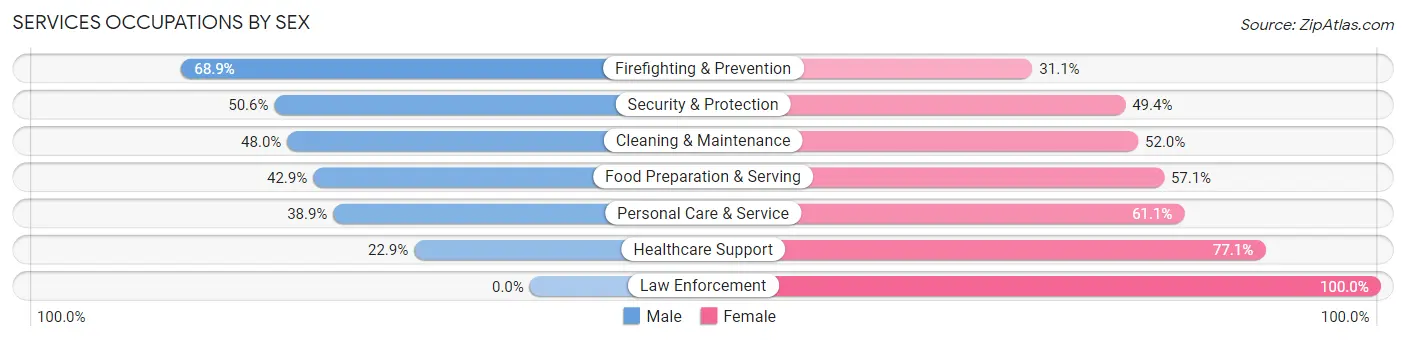
Services Occupations by Sex
Within the Services occupations in Charleston, the most male-oriented occupations are Firefighting & Prevention (68.9%), Security & Protection (50.6%), and Cleaning & Maintenance (48.0%), while the most female-oriented occupations are Law Enforcement (100.0%), Healthcare Support (77.1%), and Personal Care & Service (61.1%).
| Occupation | Male | Female |
| Healthcare Support | 108 (22.9%) | 364 (77.1%) |
| Security & Protection | 91 (50.6%) | 89 (49.4%) |
| Firefighting & Prevention | 91 (68.9%) | 41 (31.1%) |
| Law Enforcement | 0 (0.0%) | 48 (100.0%) |
| Food Preparation & Serving | 428 (42.9%) | 570 (57.1%) |
| Cleaning & Maintenance | 157 (48.0%) | 170 (52.0%) |
| Personal Care & Service | 203 (38.9%) | 319 (61.1%) |
| Total (Category) | 987 (39.5%) | 1,512 (60.5%) |
| Total (Overall) | 4,939 (50.7%) | 4,803 (49.3%) |
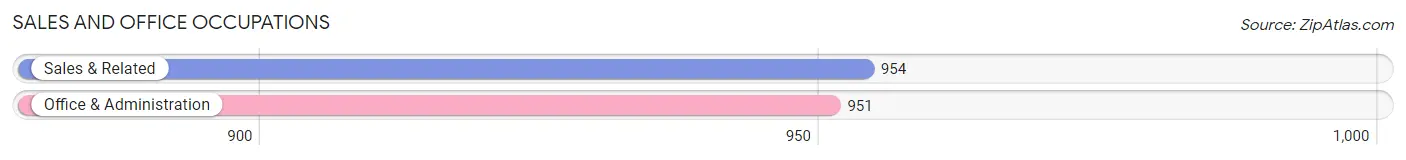
Sales and Office Occupations
The most common Sales and Office occupations in Charleston are Sales & Related (954 | 9.8%), and Office & Administration (951 | 9.8%).
Sales and Office Occupations by Sex
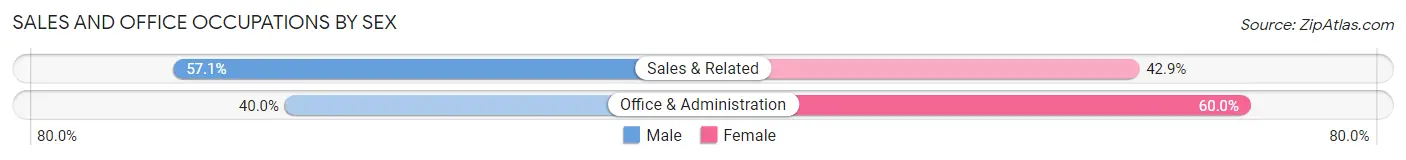
| Occupation | Male | Female |
| Sales & Related | 545 (57.1%) | 409 (42.9%) |
| Office & Administration | 380 (40.0%) | 571 (60.0%) |
| Total (Category) | 925 (48.6%) | 980 (51.4%) |
| Total (Overall) | 4,939 (50.7%) | 4,803 (49.3%) |
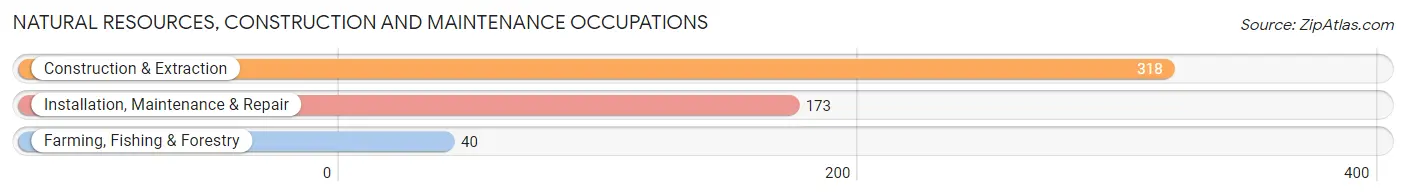
Natural Resources, Construction and Maintenance Occupations
The most common Natural Resources, Construction and Maintenance occupations in Charleston are Construction & Extraction (318 | 3.3%), Installation, Maintenance & Repair (173 | 1.8%), and Farming, Fishing & Forestry (40 | 0.4%).
Natural Resources, Construction and Maintenance Occupations by Sex
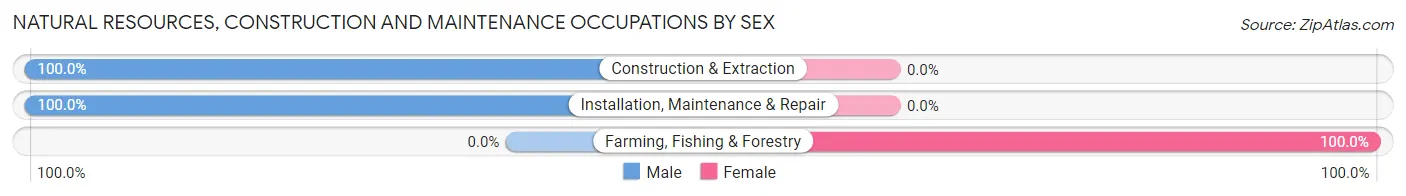
| Occupation | Male | Female |
| Farming, Fishing & Forestry | 0 (0.0%) | 40 (100.0%) |
| Construction & Extraction | 318 (100.0%) | 0 (0.0%) |
| Installation, Maintenance & Repair | 173 (100.0%) | 0 (0.0%) |
| Total (Category) | 491 (92.5%) | 40 (7.5%) |
| Total (Overall) | 4,939 (50.7%) | 4,803 (49.3%) |
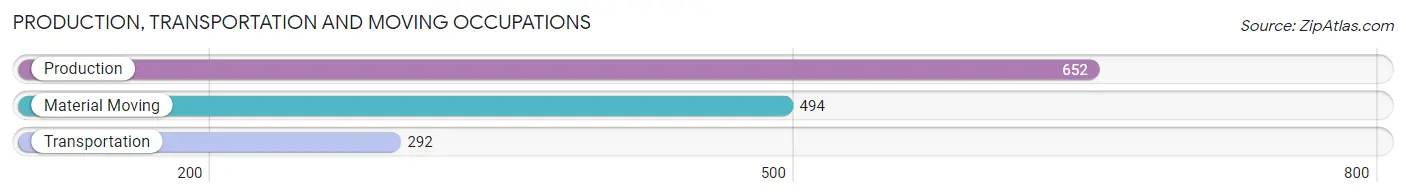
Production, Transportation and Moving Occupations
The most common Production, Transportation and Moving occupations in Charleston are Production (652 | 6.7%), Material Moving (494 | 5.1%), and Transportation (292 | 3.0%).
Production, Transportation and Moving Occupations by Sex
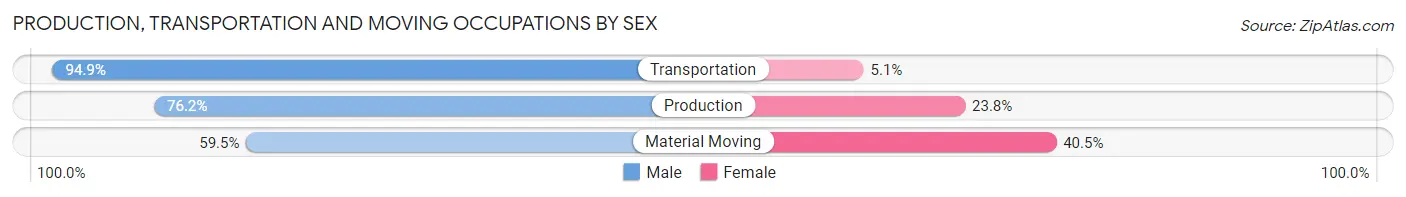
| Occupation | Male | Female |
| Production | 497 (76.2%) | 155 (23.8%) |
| Transportation | 277 (94.9%) | 15 (5.1%) |
| Material Moving | 294 (59.5%) | 200 (40.5%) |
| Total (Category) | 1,068 (74.3%) | 370 (25.7%) |
| Total (Overall) | 4,939 (50.7%) | 4,803 (49.3%) |
Employment Industries by Sex in Charleston
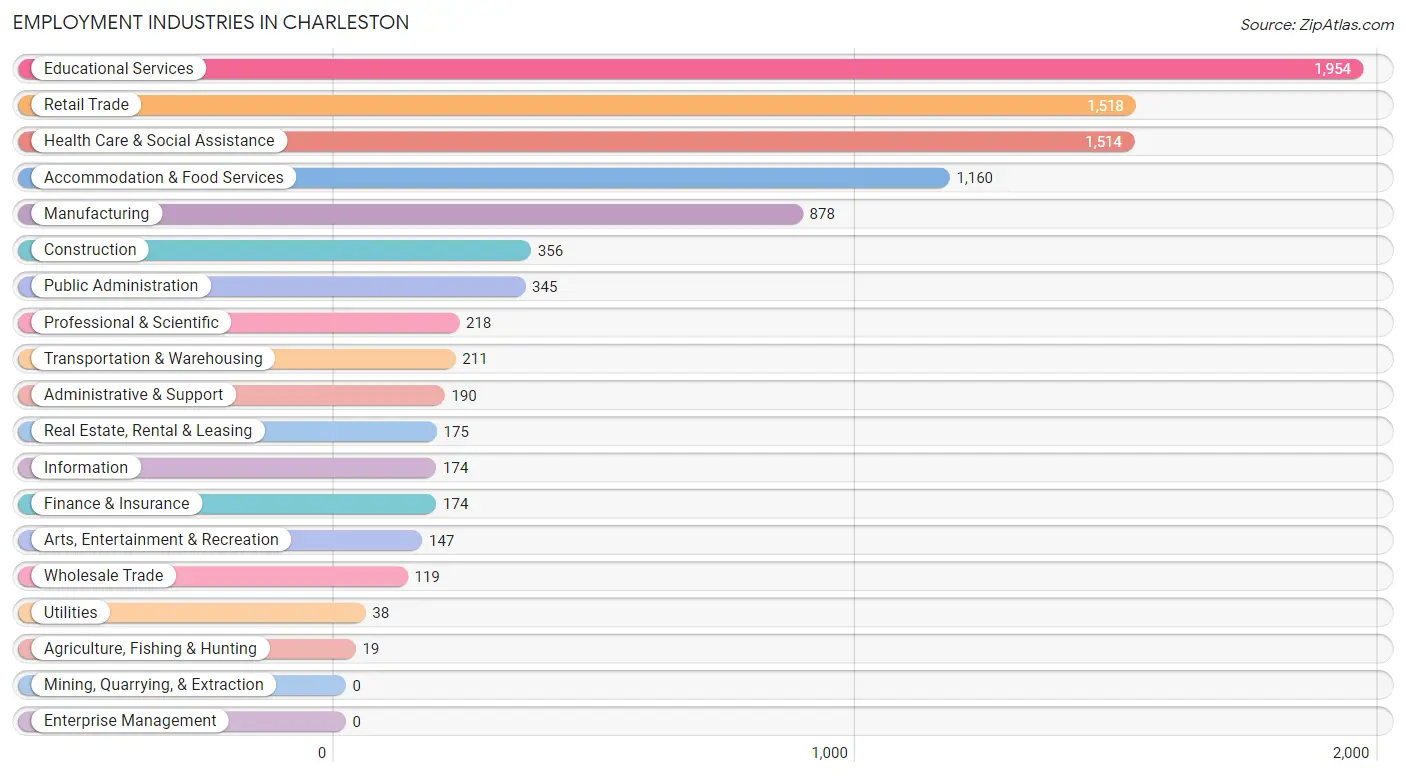
Employment Industries in Charleston
The major employment industries in Charleston include Educational Services (1,954 | 20.1%), Retail Trade (1,518 | 15.6%), Health Care & Social Assistance (1,514 | 15.5%), Accommodation & Food Services (1,160 | 11.9%), and Manufacturing (878 | 9.0%).
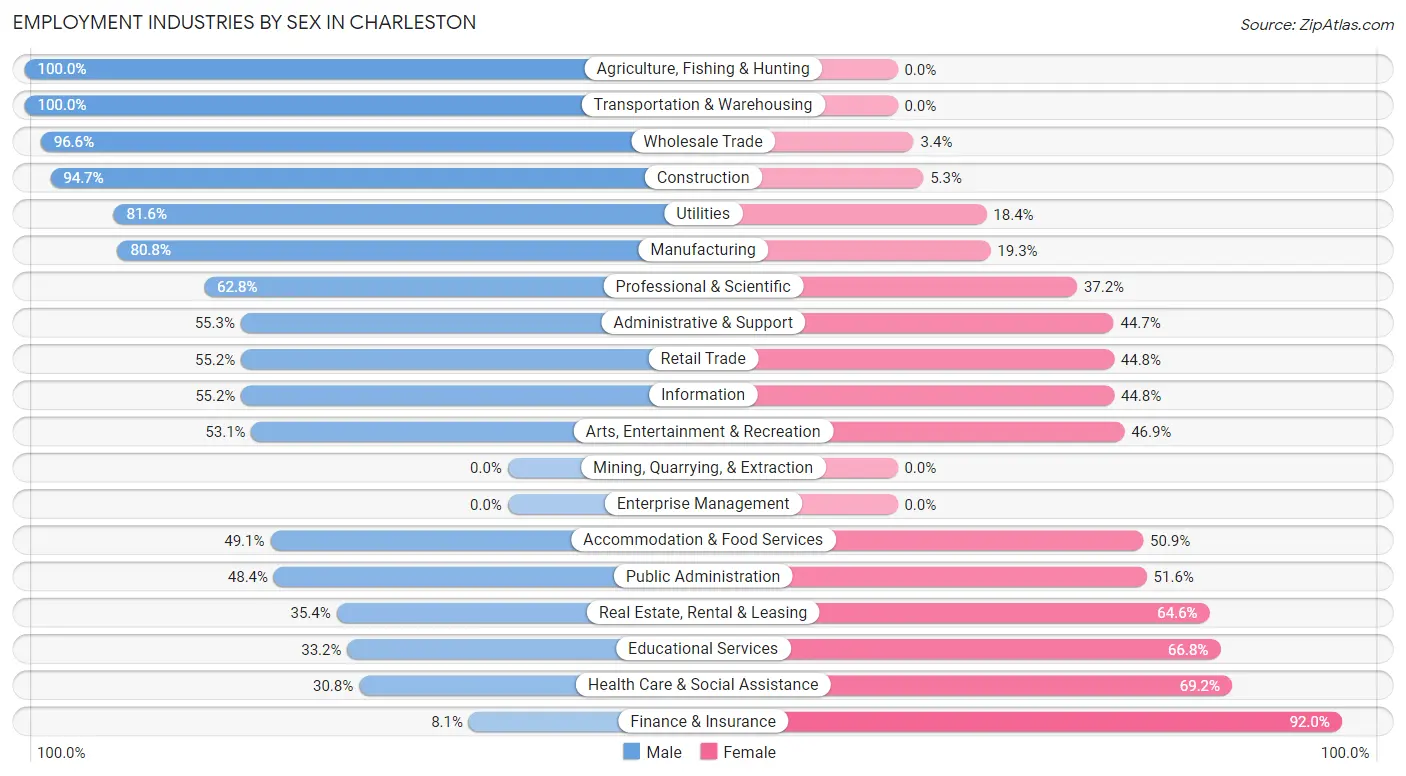
Employment Industries by Sex in Charleston
The Charleston industries that see more men than women are Agriculture, Fishing & Hunting (100.0%), Transportation & Warehousing (100.0%), and Wholesale Trade (96.6%), whereas the industries that tend to have a higher number of women are Finance & Insurance (91.9%), Health Care & Social Assistance (69.2%), and Educational Services (66.8%).
| Industry | Male | Female |
| Agriculture, Fishing & Hunting | 19 (100.0%) | 0 (0.0%) |
| Mining, Quarrying, & Extraction | 0 (0.0%) | 0 (0.0%) |
| Construction | 337 (94.7%) | 19 (5.3%) |
| Manufacturing | 709 (80.7%) | 169 (19.3%) |
| Wholesale Trade | 115 (96.6%) | 4 (3.4%) |
| Retail Trade | 838 (55.2%) | 680 (44.8%) |
| Transportation & Warehousing | 211 (100.0%) | 0 (0.0%) |
| Utilities | 31 (81.6%) | 7 (18.4%) |
| Information | 96 (55.2%) | 78 (44.8%) |
| Finance & Insurance | 14 (8.1%) | 160 (91.9%) |
| Real Estate, Rental & Leasing | 62 (35.4%) | 113 (64.6%) |
| Professional & Scientific | 137 (62.8%) | 81 (37.2%) |
| Enterprise Management | 0 (0.0%) | 0 (0.0%) |
| Administrative & Support | 105 (55.3%) | 85 (44.7%) |
| Educational Services | 649 (33.2%) | 1,305 (66.8%) |
| Health Care & Social Assistance | 466 (30.8%) | 1,048 (69.2%) |
| Arts, Entertainment & Recreation | 78 (53.1%) | 69 (46.9%) |
| Accommodation & Food Services | 570 (49.1%) | 590 (50.9%) |
| Public Administration | 167 (48.4%) | 178 (51.6%) |
| Total | 4,939 (50.7%) | 4,803 (49.3%) |
Education in Charleston
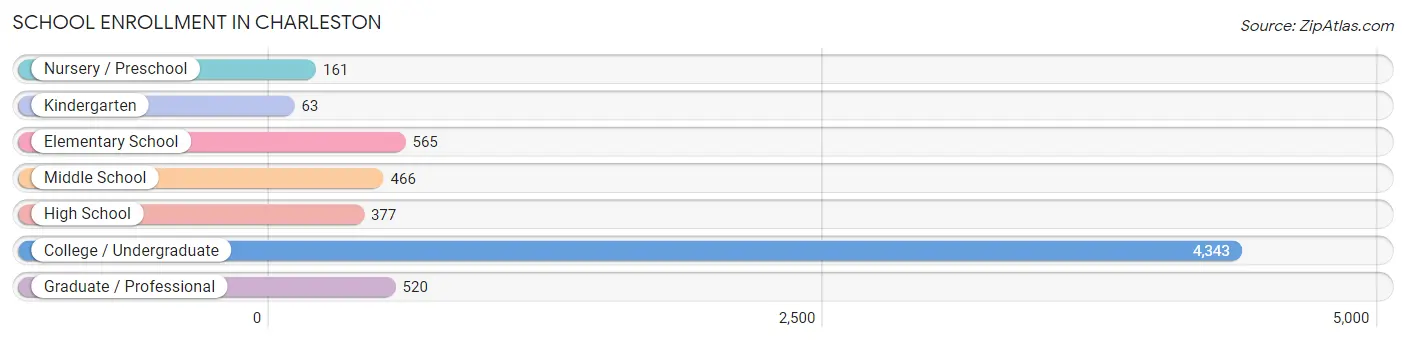
School Enrollment in Charleston
The most common levels of schooling among the 6,495 students in Charleston are college / undergraduate (4,343 | 66.9%), elementary school (565 | 8.7%), and graduate / professional (520 | 8.0%).
| School Level | # Students | % Students |
| Nursery / Preschool | 161 | 2.5% |
| Kindergarten | 63 | 1.0% |
| Elementary School | 565 | 8.7% |
| Middle School | 466 | 7.2% |
| High School | 377 | 5.8% |
| College / Undergraduate | 4,343 | 66.9% |
| Graduate / Professional | 520 | 8.0% |
| Total | 6,495 | 100.0% |
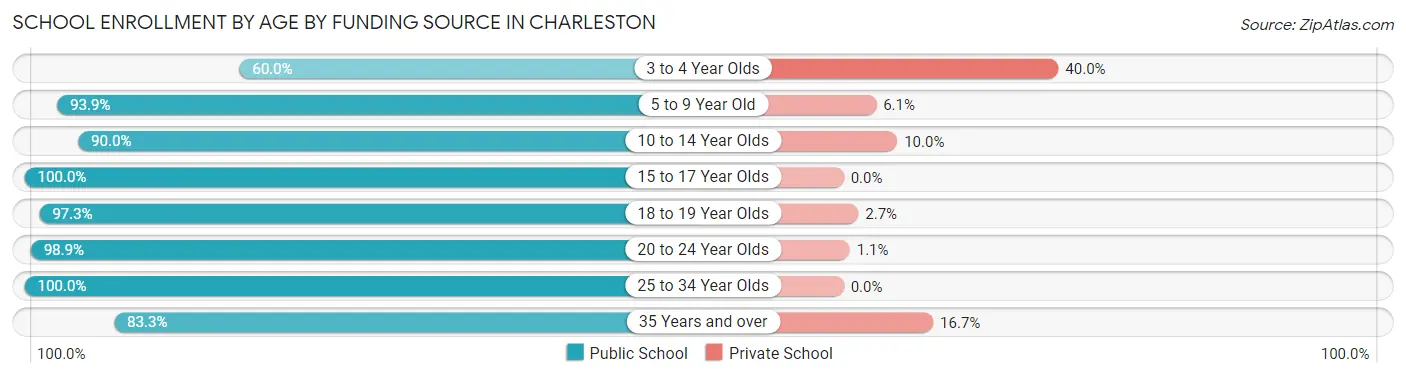
School Enrollment by Age by Funding Source in Charleston
Out of a total of 6,495 students who are enrolled in schools in Charleston, 247 (3.8%) attend a private institution, while the remaining 6,248 (96.2%) are enrolled in public schools. The age group of 3 to 4 year olds has the highest likelihood of being enrolled in private schools, with 46 (40.0% in the age bracket) enrolled. Conversely, the age group of 15 to 17 year olds has the lowest likelihood of being enrolled in a private school, with 225 (100.0% in the age bracket) attending a public institution.
| Age Bracket | Public School | Private School |
| 3 to 4 Year Olds | 69 (60.0%) | 46 (40.0%) |
| 5 to 9 Year Old | 527 (93.9%) | 34 (6.1%) |
| 10 to 14 Year Olds | 586 (90.0%) | 65 (10.0%) |
| 15 to 17 Year Olds | 225 (100.0%) | 0 (0.0%) |
| 18 to 19 Year Olds | 1,497 (97.3%) | 42 (2.7%) |
| 20 to 24 Year Olds | 2,784 (98.9%) | 32 (1.1%) |
| 25 to 34 Year Olds | 438 (100.0%) | 0 (0.0%) |
| 35 Years and over | 125 (83.3%) | 25 (16.7%) |
| Total | 6,248 (96.2%) | 247 (3.8%) |
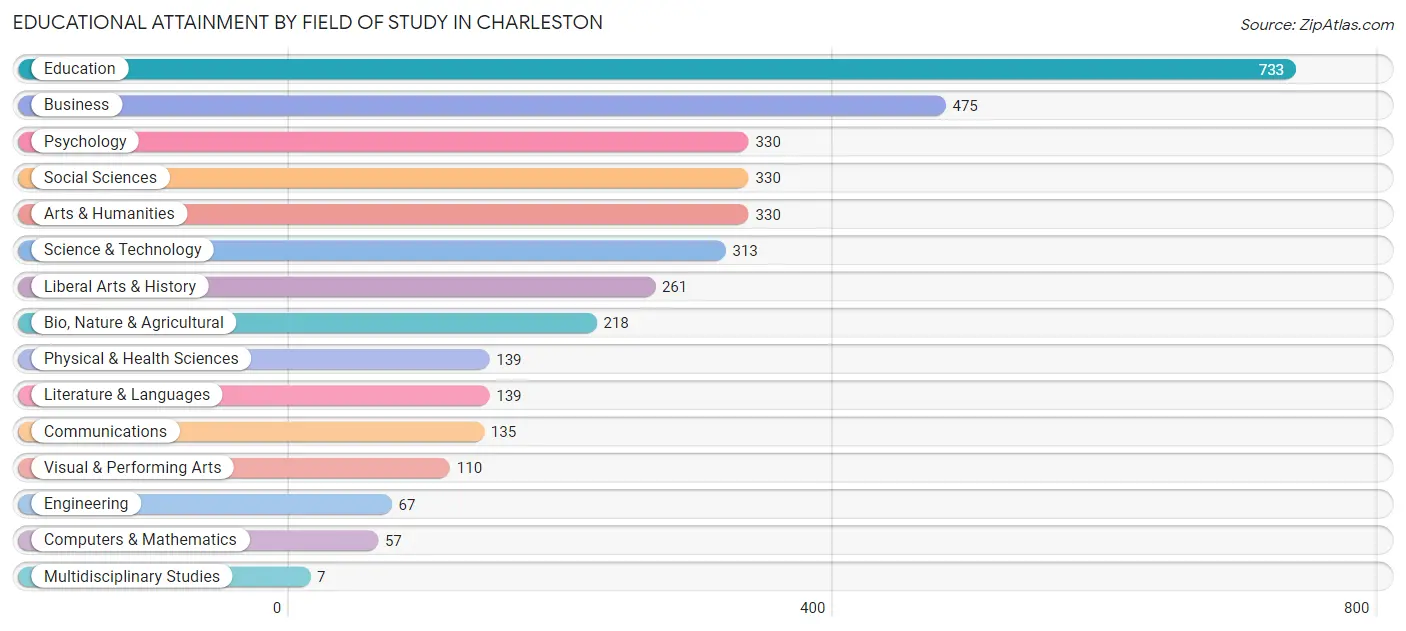
Educational Attainment by Field of Study in Charleston
Education (733 | 20.1%), business (475 | 13.0%), psychology (330 | 9.1%), social sciences (330 | 9.1%), and arts & humanities (330 | 9.1%) are the most common fields of study among 3,644 individuals in Charleston who have obtained a bachelor's degree or higher.
| Field of Study | # Graduates | % Graduates |
| Computers & Mathematics | 57 | 1.6% |
| Bio, Nature & Agricultural | 218 | 6.0% |
| Physical & Health Sciences | 139 | 3.8% |
| Psychology | 330 | 9.1% |
| Social Sciences | 330 | 9.1% |
| Engineering | 67 | 1.8% |
| Multidisciplinary Studies | 7 | 0.2% |
| Science & Technology | 313 | 8.6% |
| Business | 475 | 13.0% |
| Education | 733 | 20.1% |
| Literature & Languages | 139 | 3.8% |
| Liberal Arts & History | 261 | 7.2% |
| Visual & Performing Arts | 110 | 3.0% |
| Communications | 135 | 3.7% |
| Arts & Humanities | 330 | 9.1% |
| Total | 3,644 | 100.0% |
Transportation & Commute in Charleston
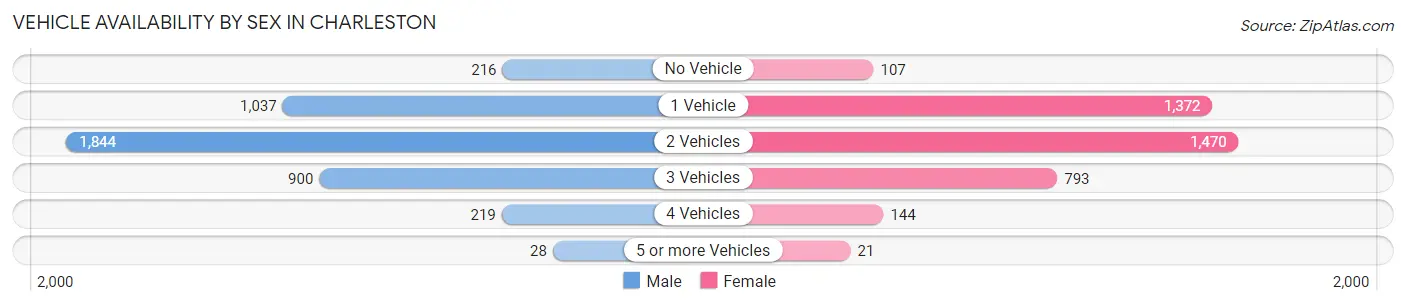
Vehicle Availability by Sex in Charleston
The most prevalent vehicle ownership categories in Charleston are males with 2 vehicles (1,844, accounting for 43.4%) and females with 2 vehicles (1,470, making up 47.2%).
| Vehicles Available | Male | Female |
| No Vehicle | 216 (5.1%) | 107 (2.7%) |
| 1 Vehicle | 1,037 (24.4%) | 1,372 (35.1%) |
| 2 Vehicles | 1,844 (43.4%) | 1,470 (37.6%) |
| 3 Vehicles | 900 (21.2%) | 793 (20.3%) |
| 4 Vehicles | 219 (5.2%) | 144 (3.7%) |
| 5 or more Vehicles | 28 (0.7%) | 21 (0.5%) |
| Total | 4,244 (100.0%) | 3,907 (100.0%) |
Commute Time in Charleston
The most frequently occuring commute durations in Charleston are 5 to 9 minutes (2,406 commuters, 28.1%), less than 5 minutes (1,419 commuters, 16.6%), and 15 to 19 minutes (1,335 commuters, 15.6%).
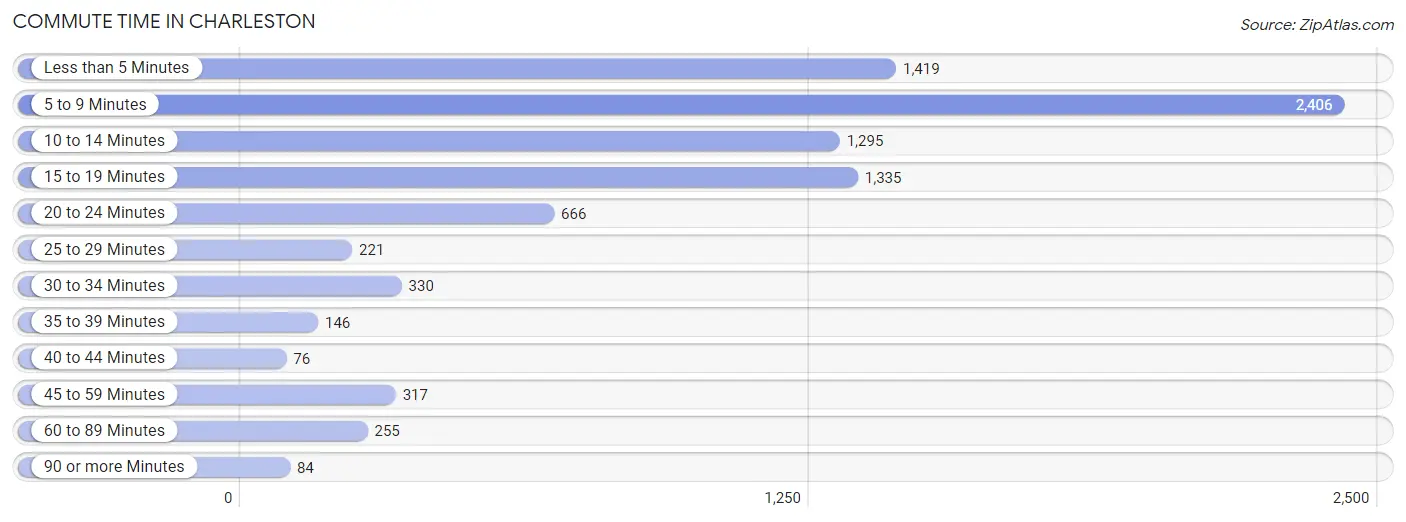
| Commute Time | # Commuters | % Commuters |
| Less than 5 Minutes | 1,419 | 16.6% |
| 5 to 9 Minutes | 2,406 | 28.1% |
| 10 to 14 Minutes | 1,295 | 15.1% |
| 15 to 19 Minutes | 1,335 | 15.6% |
| 20 to 24 Minutes | 666 | 7.8% |
| 25 to 29 Minutes | 221 | 2.6% |
| 30 to 34 Minutes | 330 | 3.9% |
| 35 to 39 Minutes | 146 | 1.7% |
| 40 to 44 Minutes | 76 | 0.9% |
| 45 to 59 Minutes | 317 | 3.7% |
| 60 to 89 Minutes | 255 | 3.0% |
| 90 or more Minutes | 84 | 1.0% |
Commute Time by Sex in Charleston
The most common commute times in Charleston are 5 to 9 minutes (1,008 commuters, 23.1%) for males and 5 to 9 minutes (1,398 commuters, 33.4%) for females.
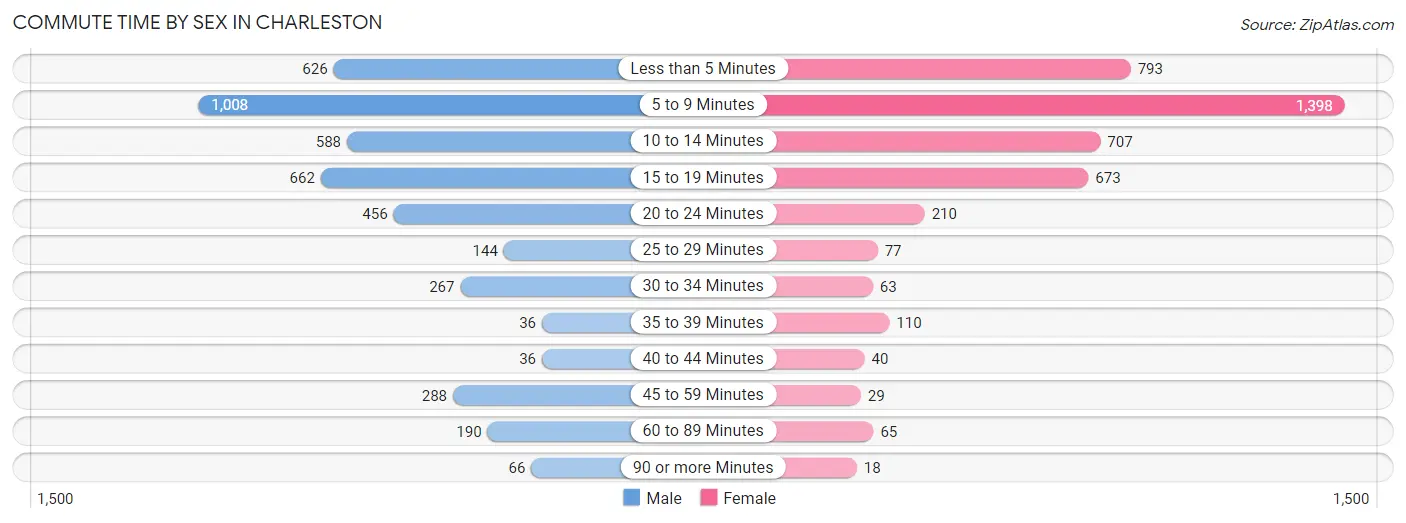
| Commute Time | Male | Female |
| Less than 5 Minutes | 626 (14.3%) | 793 (19.0%) |
| 5 to 9 Minutes | 1,008 (23.1%) | 1,398 (33.4%) |
| 10 to 14 Minutes | 588 (13.5%) | 707 (16.9%) |
| 15 to 19 Minutes | 662 (15.2%) | 673 (16.1%) |
| 20 to 24 Minutes | 456 (10.4%) | 210 (5.0%) |
| 25 to 29 Minutes | 144 (3.3%) | 77 (1.8%) |
| 30 to 34 Minutes | 267 (6.1%) | 63 (1.5%) |
| 35 to 39 Minutes | 36 (0.8%) | 110 (2.6%) |
| 40 to 44 Minutes | 36 (0.8%) | 40 (1.0%) |
| 45 to 59 Minutes | 288 (6.6%) | 29 (0.7%) |
| 60 to 89 Minutes | 190 (4.3%) | 65 (1.5%) |
| 90 or more Minutes | 66 (1.5%) | 18 (0.4%) |
Time of Departure to Work by Sex in Charleston
The most frequent times of departure to work in Charleston are 12:00 PM to 3:59 PM (649, 14.9%) for males and 12:00 PM to 3:59 PM (739, 17.7%) for females.
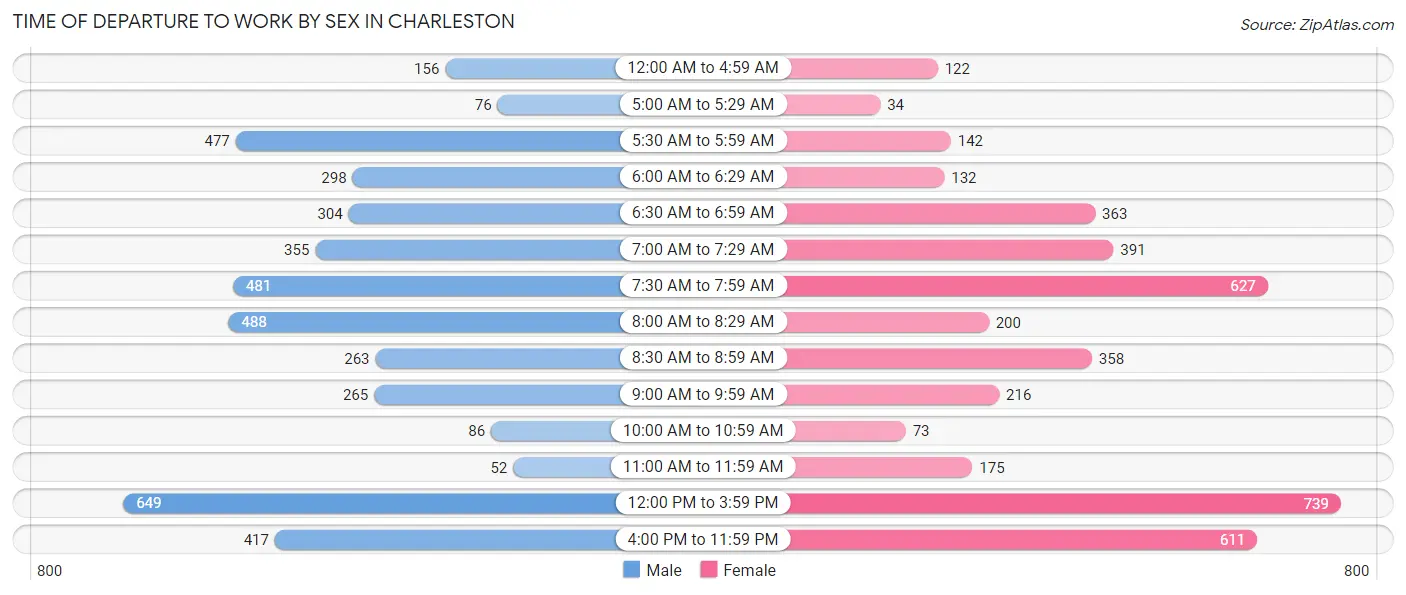
| Time of Departure | Male | Female |
| 12:00 AM to 4:59 AM | 156 (3.6%) | 122 (2.9%) |
| 5:00 AM to 5:29 AM | 76 (1.7%) | 34 (0.8%) |
| 5:30 AM to 5:59 AM | 477 (10.9%) | 142 (3.4%) |
| 6:00 AM to 6:29 AM | 298 (6.8%) | 132 (3.2%) |
| 6:30 AM to 6:59 AM | 304 (7.0%) | 363 (8.7%) |
| 7:00 AM to 7:29 AM | 355 (8.1%) | 391 (9.3%) |
| 7:30 AM to 7:59 AM | 481 (11.0%) | 627 (15.0%) |
| 8:00 AM to 8:29 AM | 488 (11.2%) | 200 (4.8%) |
| 8:30 AM to 8:59 AM | 263 (6.0%) | 358 (8.6%) |
| 9:00 AM to 9:59 AM | 265 (6.1%) | 216 (5.2%) |
| 10:00 AM to 10:59 AM | 86 (2.0%) | 73 (1.8%) |
| 11:00 AM to 11:59 AM | 52 (1.2%) | 175 (4.2%) |
| 12:00 PM to 3:59 PM | 649 (14.9%) | 739 (17.7%) |
| 4:00 PM to 11:59 PM | 417 (9.6%) | 611 (14.6%) |
| Total | 4,367 (100.0%) | 4,183 (100.0%) |
Housing Occupancy in Charleston
Occupancy by Ownership in Charleston
Of the total 7,484 dwellings in Charleston, owner-occupied units account for 3,544 (47.3%), while renter-occupied units make up 3,940 (52.6%).
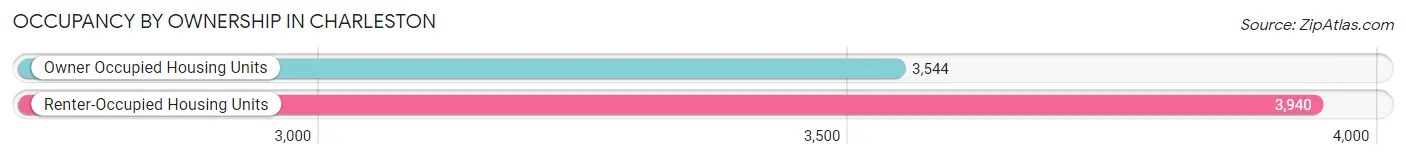
| Occupancy | # Housing Units | % Housing Units |
| Owner Occupied Housing Units | 3,544 | 47.3% |
| Renter-Occupied Housing Units | 3,940 | 52.6% |
| Total Occupied Housing Units | 7,484 | 100.0% |
Occupancy by Household Size in Charleston
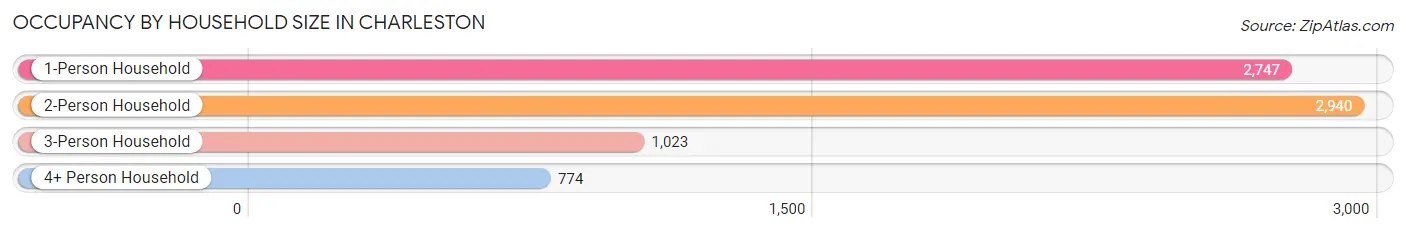
| Household Size | # Housing Units | % Housing Units |
| 1-Person Household | 2,747 | 36.7% |
| 2-Person Household | 2,940 | 39.3% |
| 3-Person Household | 1,023 | 13.7% |
| 4+ Person Household | 774 | 10.3% |
| Total Housing Units | 7,484 | 100.0% |
Occupancy by Ownership by Household Size in Charleston
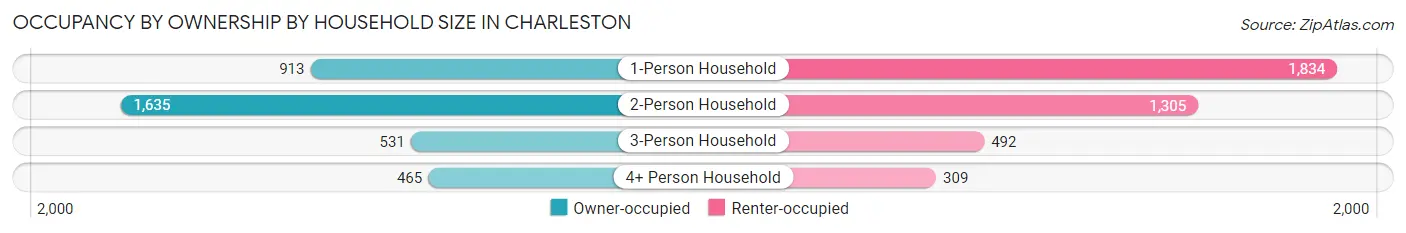
| Household Size | Owner-occupied | Renter-occupied |
| 1-Person Household | 913 (33.2%) | 1,834 (66.8%) |
| 2-Person Household | 1,635 (55.6%) | 1,305 (44.4%) |
| 3-Person Household | 531 (51.9%) | 492 (48.1%) |
| 4+ Person Household | 465 (60.1%) | 309 (39.9%) |
| Total Housing Units | 3,544 (47.3%) | 3,940 (52.6%) |
Occupancy by Educational Attainment in Charleston
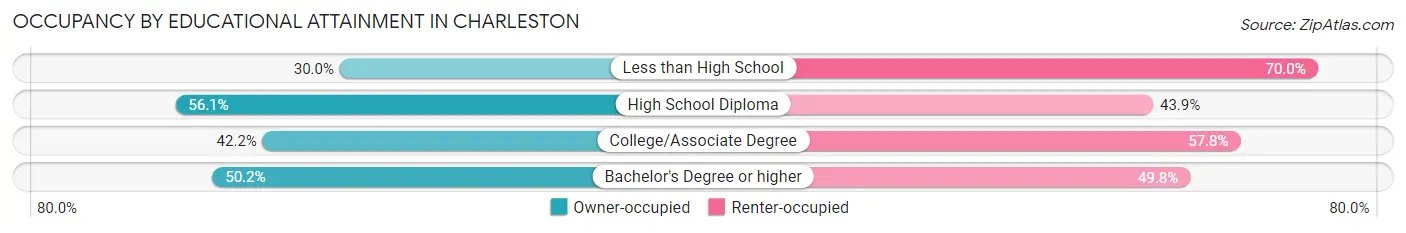
| Household Size | Owner-occupied | Renter-occupied |
| Less than High School | 117 (30.0%) | 273 (70.0%) |
| High School Diploma | 950 (56.1%) | 744 (43.9%) |
| College/Associate Degree | 1,244 (42.2%) | 1,701 (57.8%) |
| Bachelor's Degree or higher | 1,233 (50.2%) | 1,222 (49.8%) |
Occupancy by Age of Householder in Charleston
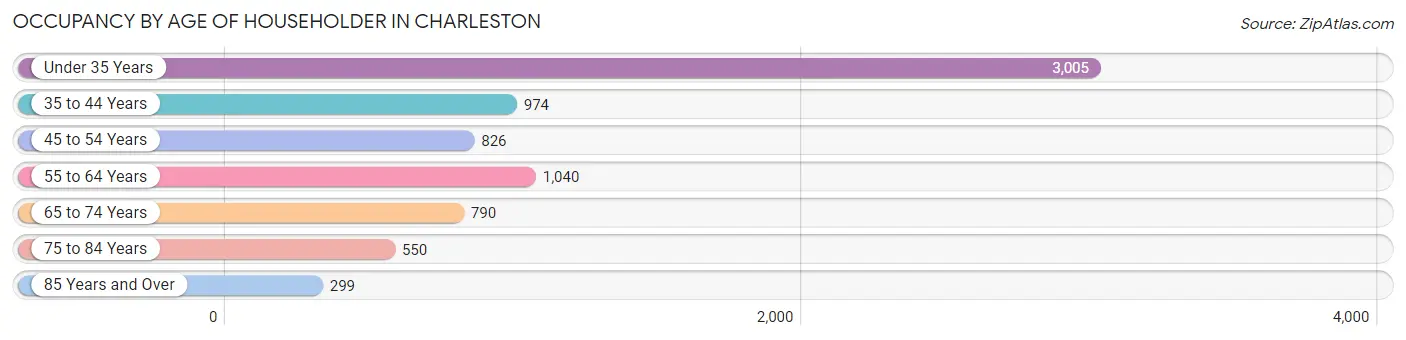
| Age Bracket | # Households | % Households |
| Under 35 Years | 3,005 | 40.2% |
| 35 to 44 Years | 974 | 13.0% |
| 45 to 54 Years | 826 | 11.0% |
| 55 to 64 Years | 1,040 | 13.9% |
| 65 to 74 Years | 790 | 10.6% |
| 75 to 84 Years | 550 | 7.3% |
| 85 Years and Over | 299 | 4.0% |
| Total | 7,484 | 100.0% |
Housing Finances in Charleston
Median Income by Occupancy in Charleston
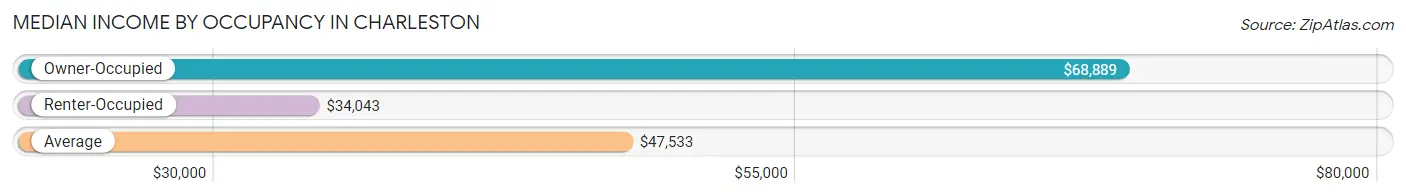
| Occupancy Type | # Households | Median Income |
| Owner-Occupied | 3,544 (47.3%) | $68,889 |
| Renter-Occupied | 3,940 (52.6%) | $34,043 |
| Average | 7,484 (100.0%) | $47,533 |
Occupancy by Householder Income Bracket in Charleston
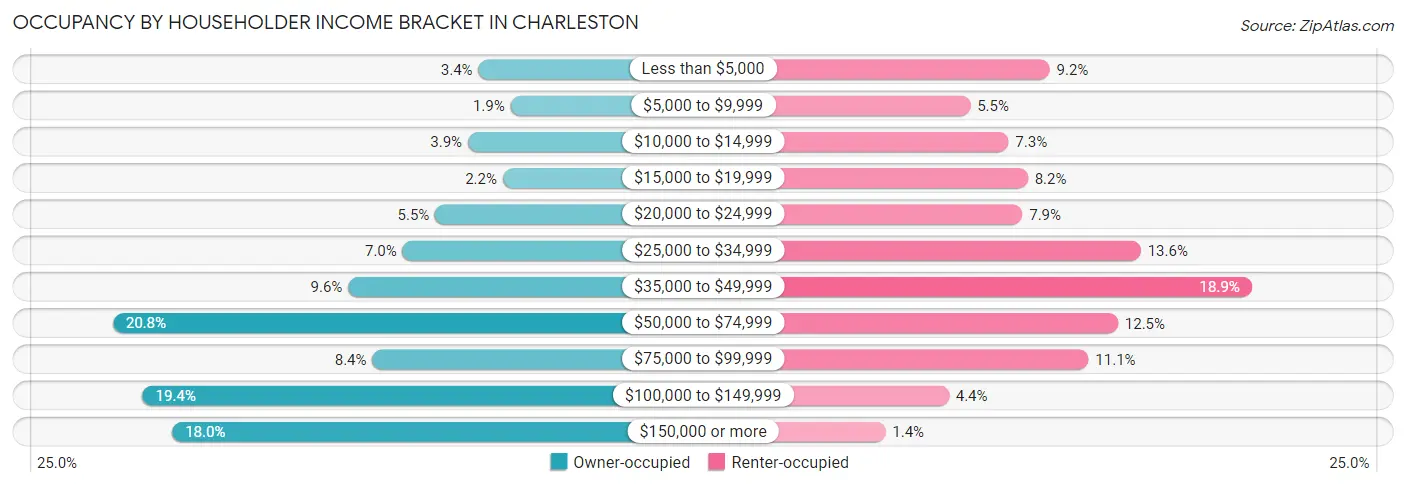
| Income Bracket | Owner-occupied | Renter-occupied |
| Less than $5,000 | 120 (3.4%) | 364 (9.2%) |
| $5,000 to $9,999 | 66 (1.9%) | 215 (5.5%) |
| $10,000 to $14,999 | 138 (3.9%) | 287 (7.3%) |
| $15,000 to $19,999 | 79 (2.2%) | 323 (8.2%) |
| $20,000 to $24,999 | 193 (5.4%) | 313 (7.9%) |
| $25,000 to $34,999 | 248 (7.0%) | 535 (13.6%) |
| $35,000 to $49,999 | 340 (9.6%) | 743 (18.9%) |
| $50,000 to $74,999 | 737 (20.8%) | 492 (12.5%) |
| $75,000 to $99,999 | 299 (8.4%) | 437 (11.1%) |
| $100,000 to $149,999 | 687 (19.4%) | 175 (4.4%) |
| $150,000 or more | 637 (18.0%) | 56 (1.4%) |
| Total | 3,544 (100.0%) | 3,940 (100.0%) |
Monthly Housing Cost Tiers in Charleston
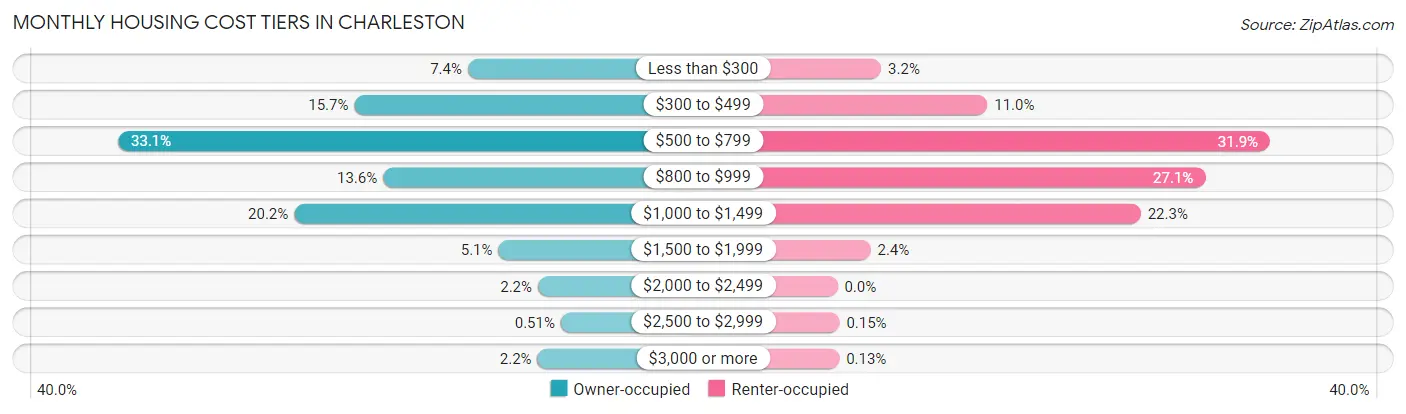
| Monthly Cost | Owner-occupied | Renter-occupied |
| Less than $300 | 261 (7.4%) | 127 (3.2%) |
| $300 to $499 | 557 (15.7%) | 435 (11.0%) |
| $500 to $799 | 1,174 (33.1%) | 1,255 (31.9%) |
| $800 to $999 | 482 (13.6%) | 1,067 (27.1%) |
| $1,000 to $1,499 | 714 (20.2%) | 880 (22.3%) |
| $1,500 to $1,999 | 181 (5.1%) | 96 (2.4%) |
| $2,000 to $2,499 | 78 (2.2%) | 0 (0.0%) |
| $2,500 to $2,999 | 18 (0.5%) | 6 (0.2%) |
| $3,000 or more | 79 (2.2%) | 5 (0.1%) |
| Total | 3,544 (100.0%) | 3,940 (100.0%) |
Physical Housing Characteristics in Charleston
Housing Structures in Charleston
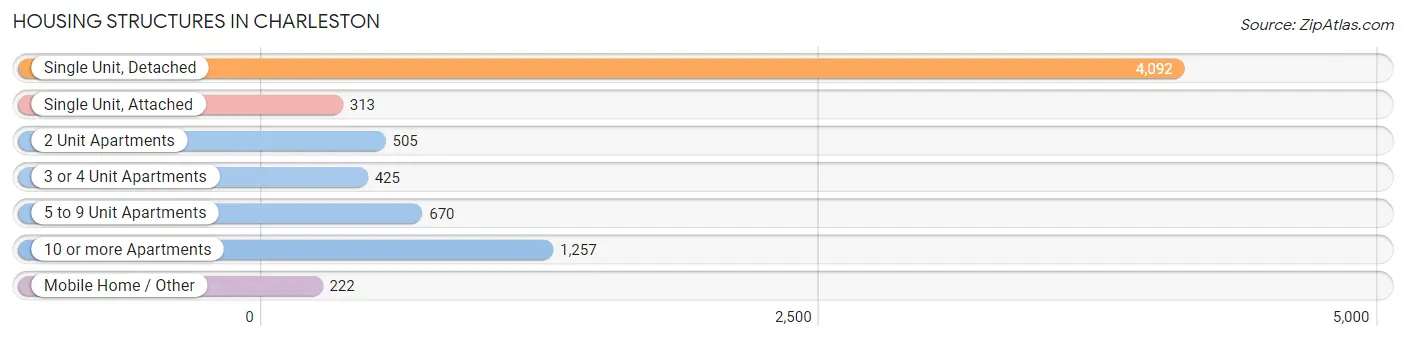
| Structure Type | # Housing Units | % Housing Units |
| Single Unit, Detached | 4,092 | 54.7% |
| Single Unit, Attached | 313 | 4.2% |
| 2 Unit Apartments | 505 | 6.8% |
| 3 or 4 Unit Apartments | 425 | 5.7% |
| 5 to 9 Unit Apartments | 670 | 8.9% |
| 10 or more Apartments | 1,257 | 16.8% |
| Mobile Home / Other | 222 | 3.0% |
| Total | 7,484 | 100.0% |
Housing Structures by Occupancy in Charleston
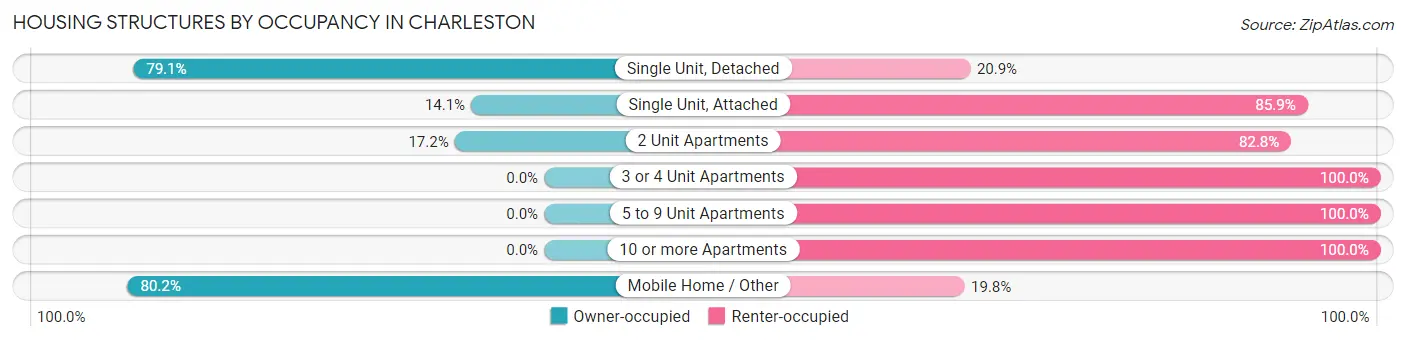
| Structure Type | Owner-occupied | Renter-occupied |
| Single Unit, Detached | 3,235 (79.1%) | 857 (20.9%) |
| Single Unit, Attached | 44 (14.1%) | 269 (85.9%) |
| 2 Unit Apartments | 87 (17.2%) | 418 (82.8%) |
| 3 or 4 Unit Apartments | 0 (0.0%) | 425 (100.0%) |
| 5 to 9 Unit Apartments | 0 (0.0%) | 670 (100.0%) |
| 10 or more Apartments | 0 (0.0%) | 1,257 (100.0%) |
| Mobile Home / Other | 178 (80.2%) | 44 (19.8%) |
| Total | 3,544 (47.3%) | 3,940 (52.6%) |
Housing Structures by Number of Rooms in Charleston
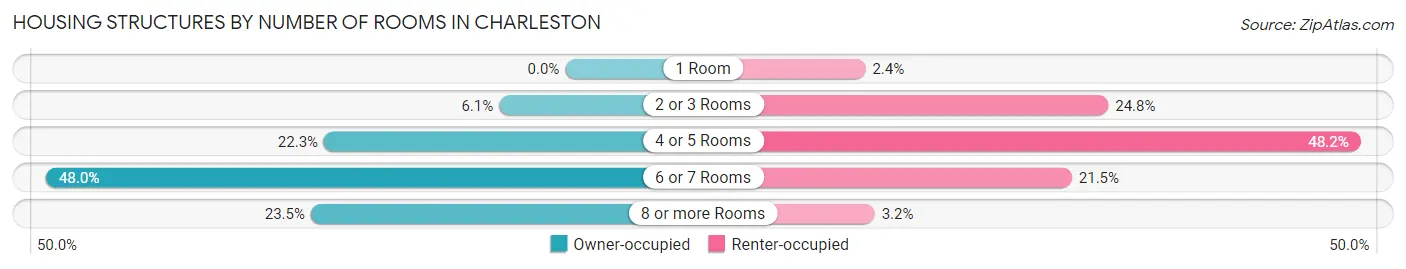
| Number of Rooms | Owner-occupied | Renter-occupied |
| 1 Room | 0 (0.0%) | 93 (2.4%) |
| 2 or 3 Rooms | 217 (6.1%) | 978 (24.8%) |
| 4 or 5 Rooms | 791 (22.3%) | 1,897 (48.1%) |
| 6 or 7 Rooms | 1,702 (48.0%) | 845 (21.4%) |
| 8 or more Rooms | 834 (23.5%) | 127 (3.2%) |
| Total | 3,544 (100.0%) | 3,940 (100.0%) |
Housing Structure by Heating Type in Charleston
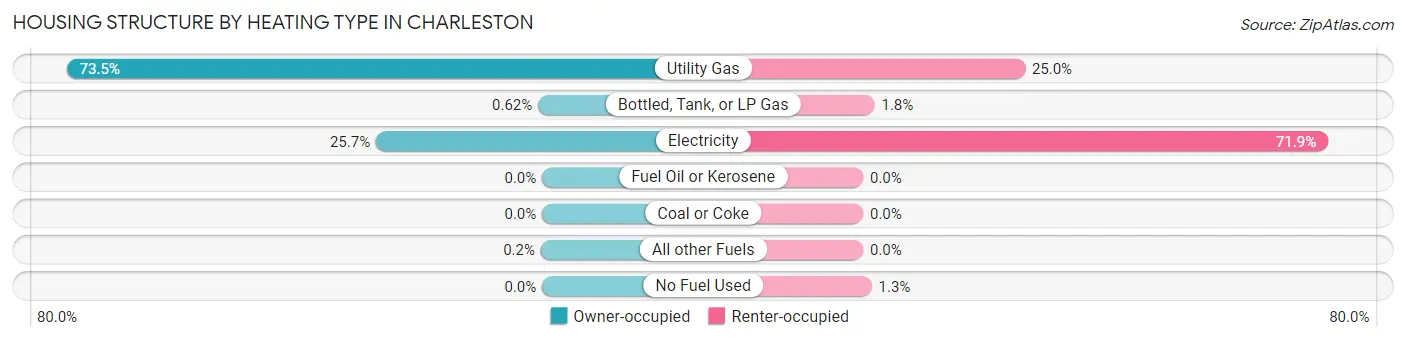
| Heating Type | Owner-occupied | Renter-occupied |
| Utility Gas | 2,605 (73.5%) | 986 (25.0%) |
| Bottled, Tank, or LP Gas | 22 (0.6%) | 70 (1.8%) |
| Electricity | 910 (25.7%) | 2,832 (71.9%) |
| Fuel Oil or Kerosene | 0 (0.0%) | 0 (0.0%) |
| Coal or Coke | 0 (0.0%) | 0 (0.0%) |
| All other Fuels | 7 (0.2%) | 0 (0.0%) |
| No Fuel Used | 0 (0.0%) | 52 (1.3%) |
| Total | 3,544 (100.0%) | 3,940 (100.0%) |
Household Vehicle Usage in Charleston
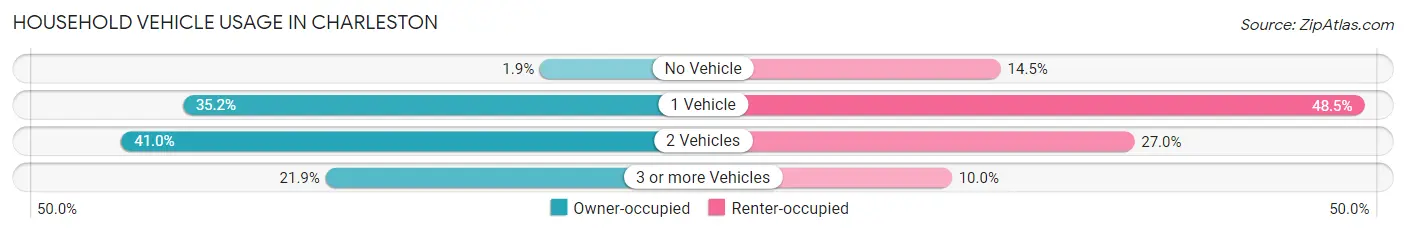
| Vehicles per Household | Owner-occupied | Renter-occupied |
| No Vehicle | 67 (1.9%) | 573 (14.5%) |
| 1 Vehicle | 1,249 (35.2%) | 1,910 (48.5%) |
| 2 Vehicles | 1,452 (41.0%) | 1,064 (27.0%) |
| 3 or more Vehicles | 776 (21.9%) | 393 (10.0%) |
| Total | 3,544 (100.0%) | 3,940 (100.0%) |
Real Estate & Mortgages in Charleston
Real Estate and Mortgage Overview in Charleston
| Characteristic | Without Mortgage | With Mortgage |
| Housing Units | 1,919 | 1,625 |
| Median Property Value | $129,700 | $116,200 |
| Median Household Income | $65,179 | $220 |
| Monthly Housing Costs | $527 | $79 |
| Real Estate Taxes | $2,718 | $98 |
Property Value by Mortgage Status in Charleston
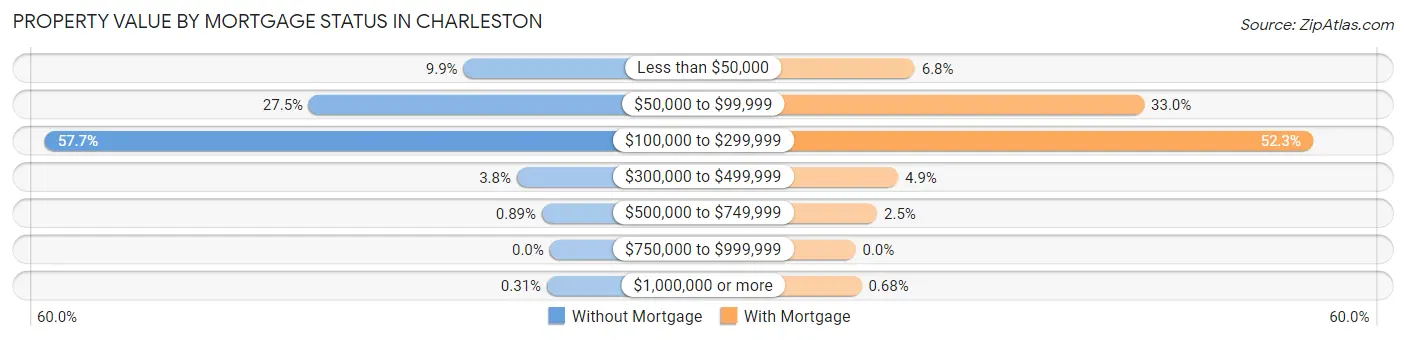
| Property Value | Without Mortgage | With Mortgage |
| Less than $50,000 | 189 (9.9%) | 110 (6.8%) |
| $50,000 to $99,999 | 528 (27.5%) | 536 (33.0%) |
| $100,000 to $299,999 | 1,107 (57.7%) | 849 (52.2%) |
| $300,000 to $499,999 | 72 (3.7%) | 79 (4.9%) |
| $500,000 to $749,999 | 17 (0.9%) | 40 (2.5%) |
| $750,000 to $999,999 | 0 (0.0%) | 0 (0.0%) |
| $1,000,000 or more | 6 (0.3%) | 11 (0.7%) |
| Total | 1,919 (100.0%) | 1,625 (100.0%) |
Household Income by Mortgage Status in Charleston
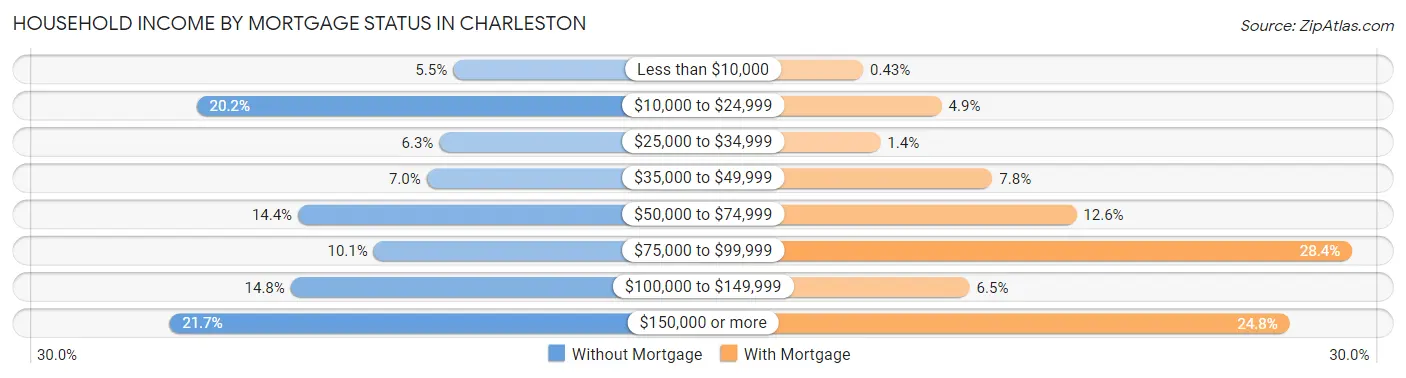
| Household Income | Without Mortgage | With Mortgage |
| Less than $10,000 | 106 (5.5%) | 7 (0.4%) |
| $10,000 to $24,999 | 387 (20.2%) | 80 (4.9%) |
| $25,000 to $34,999 | 121 (6.3%) | 23 (1.4%) |
| $35,000 to $49,999 | 135 (7.0%) | 127 (7.8%) |
| $50,000 to $74,999 | 276 (14.4%) | 205 (12.6%) |
| $75,000 to $99,999 | 193 (10.1%) | 461 (28.4%) |
| $100,000 to $149,999 | 284 (14.8%) | 106 (6.5%) |
| $150,000 or more | 417 (21.7%) | 403 (24.8%) |
| Total | 1,919 (100.0%) | 1,625 (100.0%) |
Property Value to Household Income Ratio in Charleston
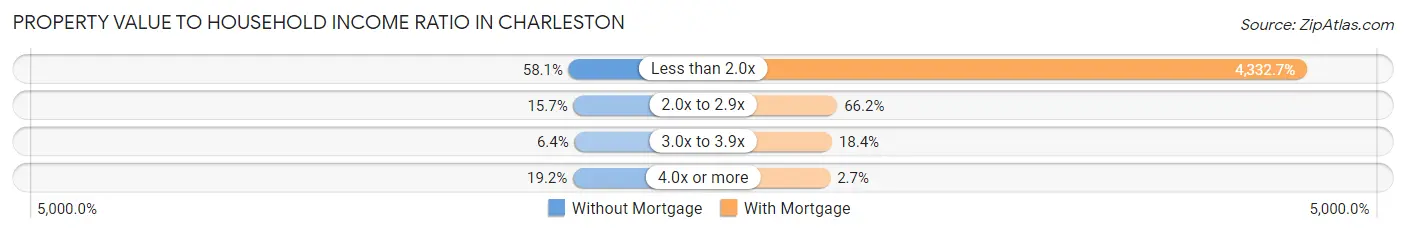
| Value-to-Income Ratio | Without Mortgage | With Mortgage |
| Less than 2.0x | 1,114 (58.1%) | 70,407 (4,332.7%) |
| 2.0x to 2.9x | 301 (15.7%) | 1,076 (66.2%) |
| 3.0x to 3.9x | 123 (6.4%) | 299 (18.4%) |
| 4.0x or more | 368 (19.2%) | 44 (2.7%) |
| Total | 1,919 (100.0%) | 1,625 (100.0%) |
Real Estate Taxes by Mortgage Status in Charleston
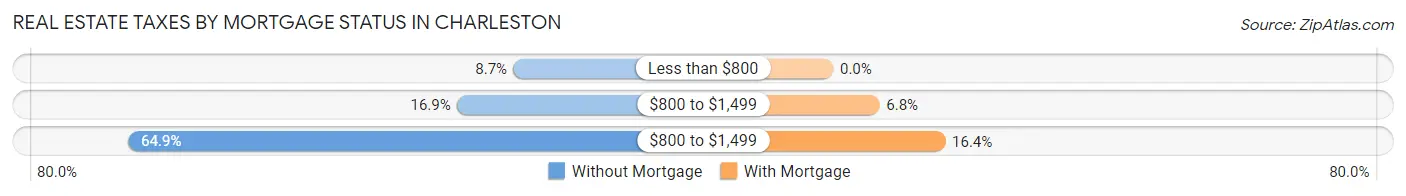
| Property Taxes | Without Mortgage | With Mortgage |
| Less than $800 | 166 (8.6%) | 0 (0.0%) |
| $800 to $1,499 | 324 (16.9%) | 110 (6.8%) |
| $800 to $1,499 | 1,245 (64.9%) | 266 (16.4%) |
| Total | 1,919 (100.0%) | 1,625 (100.0%) |
Health & Disability in Charleston
Health Insurance Coverage by Age in Charleston
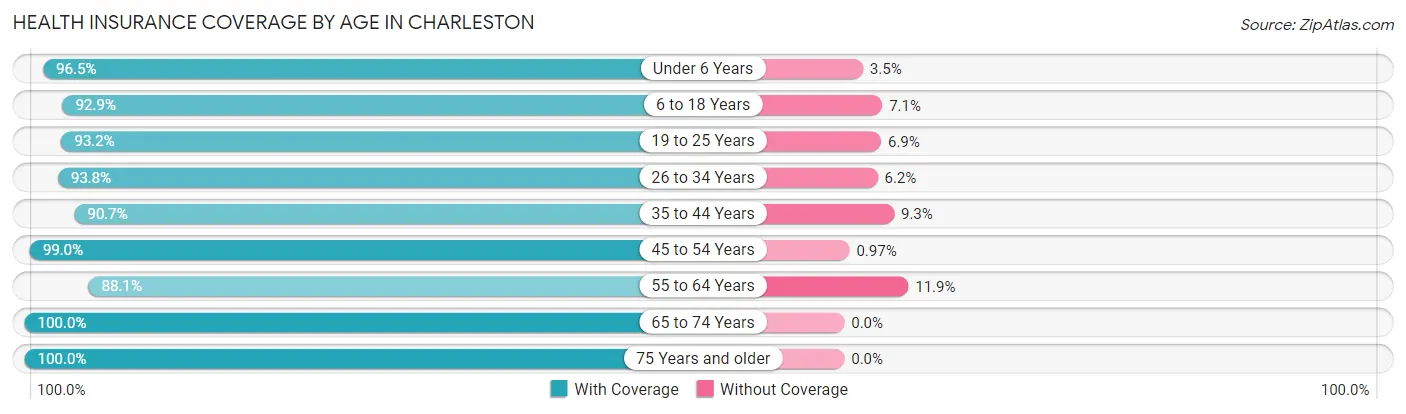
| Age Bracket | With Coverage | Without Coverage |
| Under 6 Years | 751 (96.5%) | 27 (3.5%) |
| 6 to 18 Years | 1,958 (92.9%) | 149 (7.1%) |
| 19 to 25 Years | 4,761 (93.1%) | 350 (6.9%) |
| 26 to 34 Years | 2,043 (93.8%) | 135 (6.2%) |
| 35 to 44 Years | 1,497 (90.7%) | 153 (9.3%) |
| 45 to 54 Years | 1,436 (99.0%) | 14 (1.0%) |
| 55 to 64 Years | 1,646 (88.1%) | 223 (11.9%) |
| 65 to 74 Years | 1,223 (100.0%) | 0 (0.0%) |
| 75 Years and older | 1,109 (100.0%) | 0 (0.0%) |
| Total | 16,424 (94.0%) | 1,051 (6.0%) |
Health Insurance Coverage by Citizenship Status in Charleston
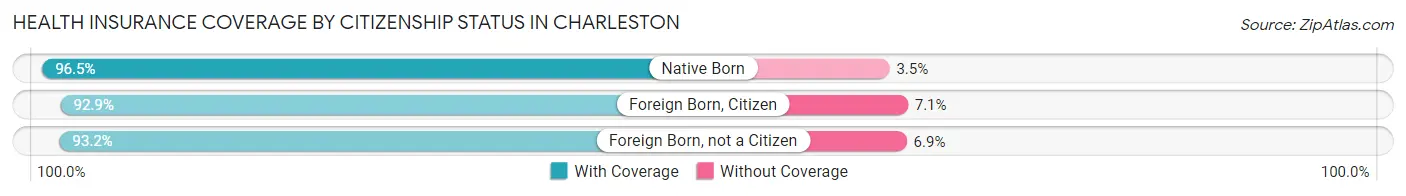
| Citizenship Status | With Coverage | Without Coverage |
| Native Born | 751 (96.5%) | 27 (3.5%) |
| Foreign Born, Citizen | 1,958 (92.9%) | 149 (7.1%) |
| Foreign Born, not a Citizen | 4,761 (93.1%) | 350 (6.9%) |
Health Insurance Coverage by Household Income in Charleston
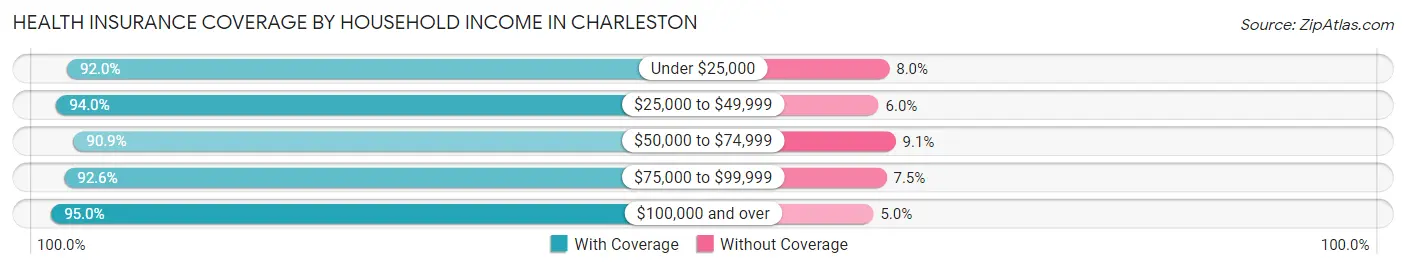
| Household Income | With Coverage | Without Coverage |
| Under $25,000 | 2,926 (92.0%) | 253 (8.0%) |
| $25,000 to $49,999 | 3,563 (94.0%) | 226 (6.0%) |
| $50,000 to $74,999 | 2,176 (90.9%) | 219 (9.1%) |
| $75,000 to $99,999 | 1,330 (92.5%) | 107 (7.4%) |
| $100,000 and over | 3,683 (95.0%) | 194 (5.0%) |
Public vs Private Health Insurance Coverage by Age in Charleston
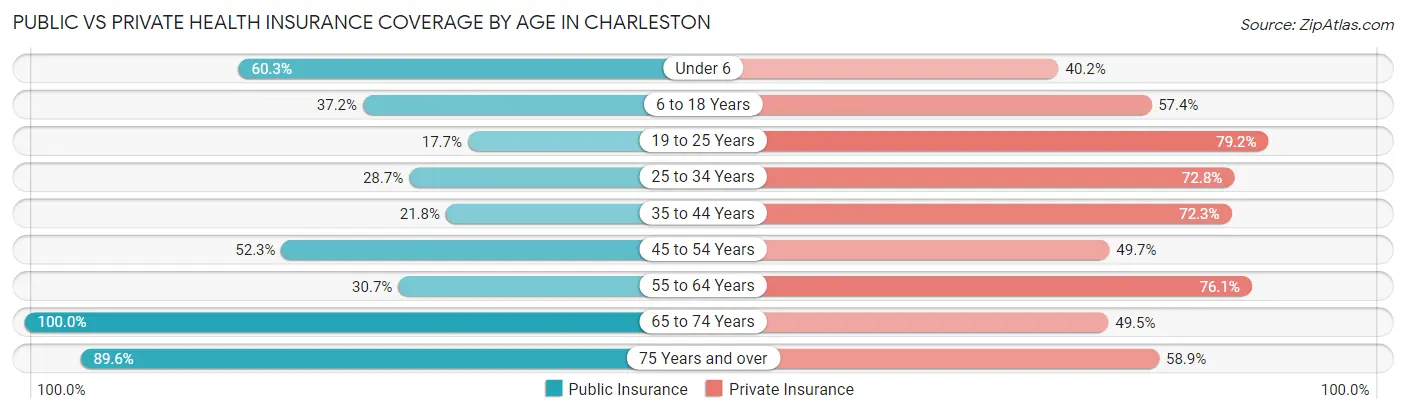
| Age Bracket | Public Insurance | Private Insurance |
| Under 6 | 469 (60.3%) | 313 (40.2%) |
| 6 to 18 Years | 784 (37.2%) | 1,210 (57.4%) |
| 19 to 25 Years | 906 (17.7%) | 4,046 (79.2%) |
| 25 to 34 Years | 624 (28.6%) | 1,586 (72.8%) |
| 35 to 44 Years | 360 (21.8%) | 1,193 (72.3%) |
| 45 to 54 Years | 759 (52.3%) | 720 (49.7%) |
| 55 to 64 Years | 573 (30.7%) | 1,422 (76.1%) |
| 65 to 74 Years | 1,223 (100.0%) | 605 (49.5%) |
| 75 Years and over | 994 (89.6%) | 653 (58.9%) |
| Total | 6,692 (38.3%) | 11,748 (67.2%) |
Disability Status by Sex by Age in Charleston
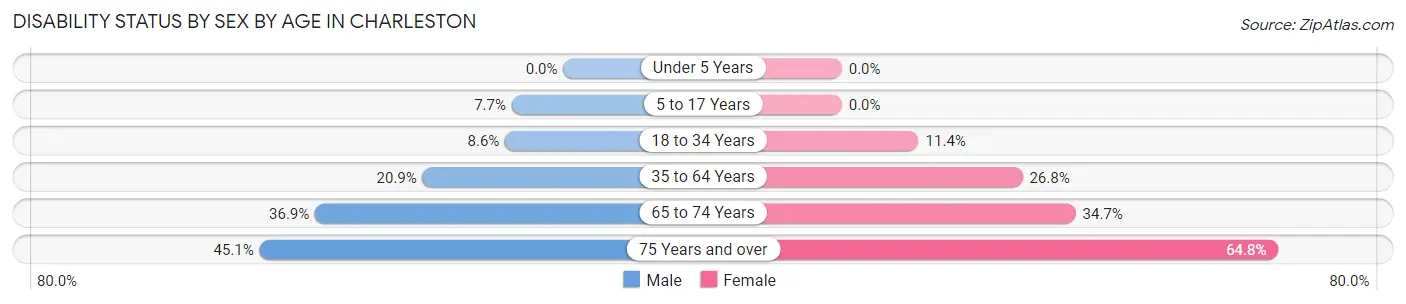
| Age Bracket | Male | Female |
| Under 5 Years | 0 (0.0%) | 0 (0.0%) |
| 5 to 17 Years | 61 (7.6%) | 0 (0.0%) |
| 18 to 34 Years | 336 (8.6%) | 468 (11.4%) |
| 35 to 64 Years | 529 (20.9%) | 654 (26.8%) |
| 65 to 74 Years | 195 (36.9%) | 241 (34.7%) |
| 75 Years and over | 203 (45.1%) | 427 (64.8%) |
Disability Class by Sex by Age in Charleston
Disability Class: Hearing Difficulty
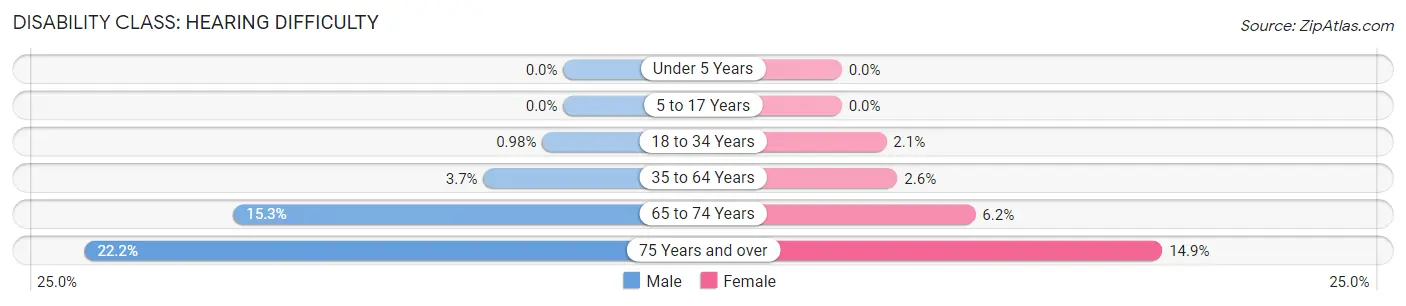
| Age Bracket | Male | Female |
| Under 5 Years | 0 (0.0%) | 0 (0.0%) |
| 5 to 17 Years | 0 (0.0%) | 0 (0.0%) |
| 18 to 34 Years | 38 (1.0%) | 85 (2.1%) |
| 35 to 64 Years | 94 (3.7%) | 63 (2.6%) |
| 65 to 74 Years | 81 (15.3%) | 43 (6.2%) |
| 75 Years and over | 100 (22.2%) | 98 (14.9%) |
Disability Class: Vision Difficulty
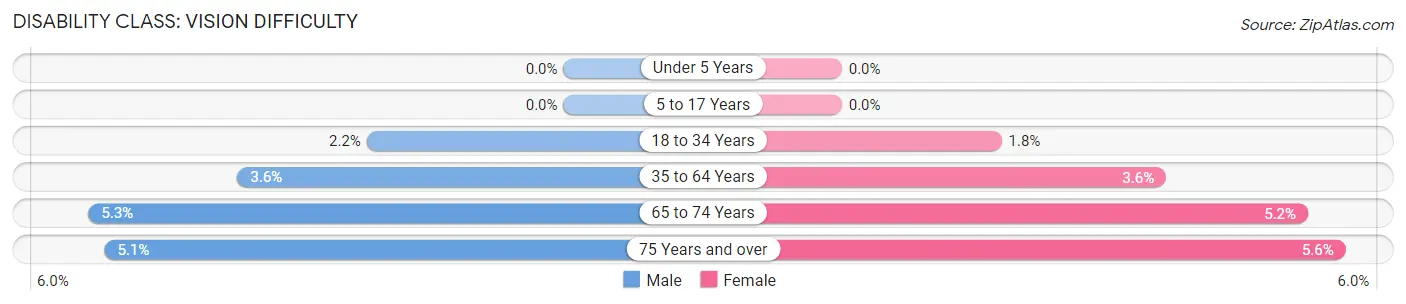
| Age Bracket | Male | Female |
| Under 5 Years | 0 (0.0%) | 0 (0.0%) |
| 5 to 17 Years | 0 (0.0%) | 0 (0.0%) |
| 18 to 34 Years | 85 (2.2%) | 73 (1.8%) |
| 35 to 64 Years | 92 (3.6%) | 88 (3.6%) |
| 65 to 74 Years | 28 (5.3%) | 36 (5.2%) |
| 75 Years and over | 23 (5.1%) | 37 (5.6%) |
Disability Class: Cognitive Difficulty
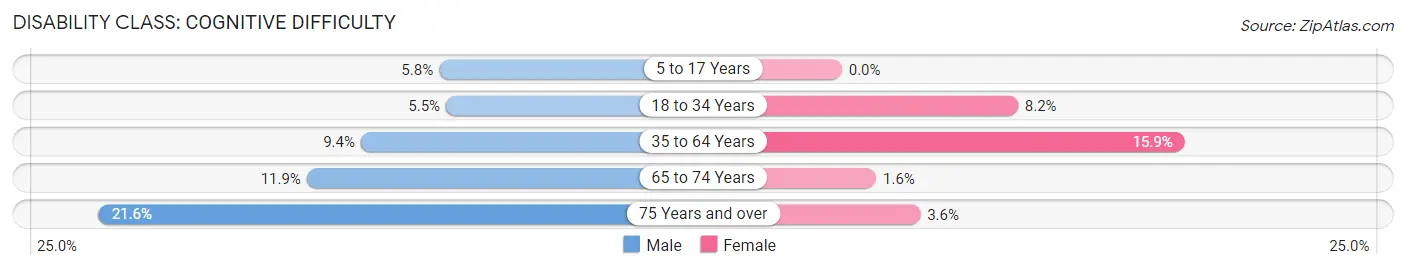
| Age Bracket | Male | Female |
| 5 to 17 Years | 46 (5.8%) | 0 (0.0%) |
| 18 to 34 Years | 212 (5.4%) | 335 (8.2%) |
| 35 to 64 Years | 238 (9.4%) | 388 (15.9%) |
| 65 to 74 Years | 63 (11.9%) | 11 (1.6%) |
| 75 Years and over | 97 (21.6%) | 24 (3.6%) |
Disability Class: Ambulatory Difficulty
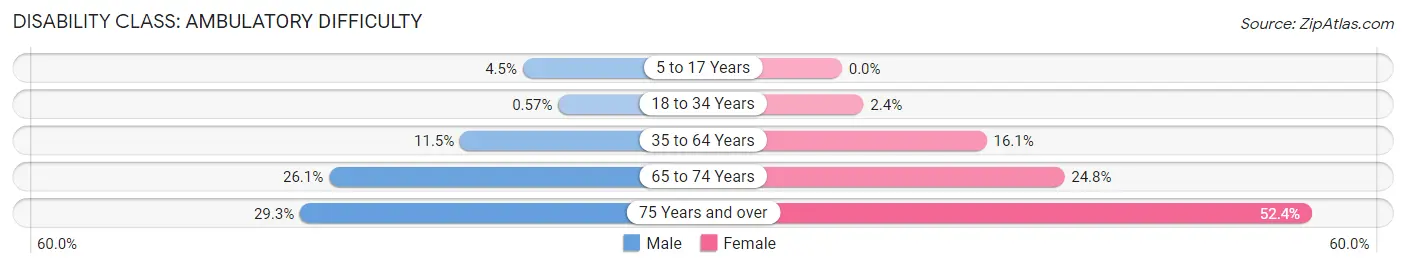
| Age Bracket | Male | Female |
| 5 to 17 Years | 36 (4.5%) | 0 (0.0%) |
| 18 to 34 Years | 22 (0.6%) | 99 (2.4%) |
| 35 to 64 Years | 291 (11.5%) | 393 (16.1%) |
| 65 to 74 Years | 138 (26.1%) | 172 (24.8%) |
| 75 Years and over | 132 (29.3%) | 345 (52.3%) |
Disability Class: Self-Care Difficulty
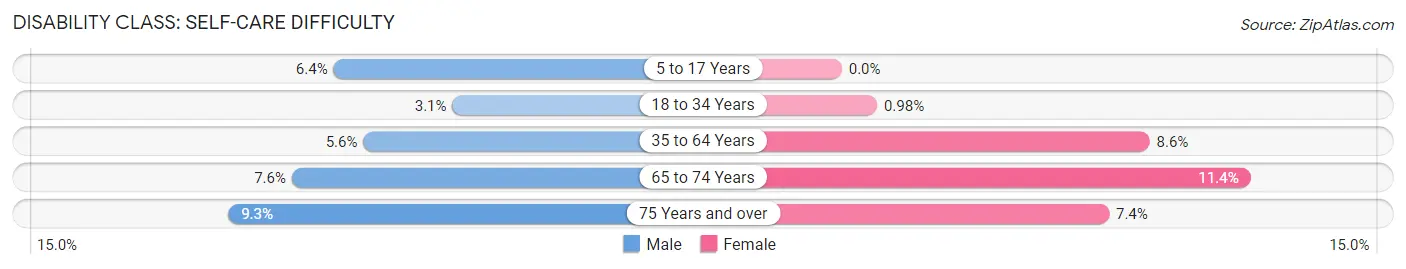
| Age Bracket | Male | Female |
| 5 to 17 Years | 51 (6.4%) | 0 (0.0%) |
| 18 to 34 Years | 120 (3.1%) | 40 (1.0%) |
| 35 to 64 Years | 141 (5.6%) | 209 (8.6%) |
| 65 to 74 Years | 40 (7.6%) | 79 (11.4%) |
| 75 Years and over | 42 (9.3%) | 49 (7.4%) |
Technology Access in Charleston
Computing Device Access in Charleston
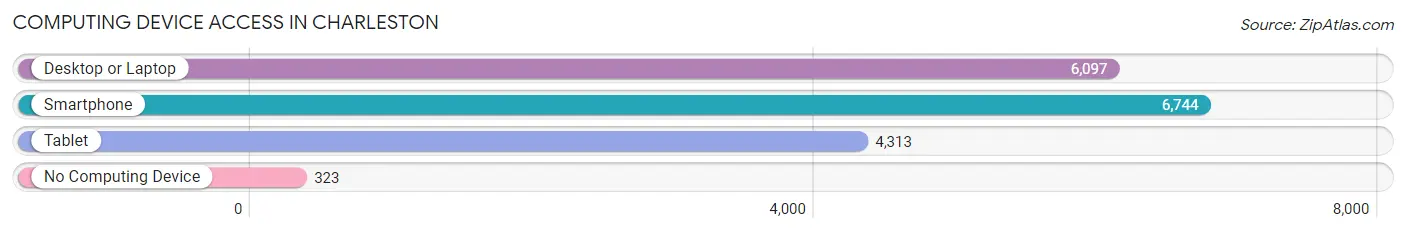
| Device Type | # Households | % Households |
| Desktop or Laptop | 6,097 | 81.5% |
| Smartphone | 6,744 | 90.1% |
| Tablet | 4,313 | 57.6% |
| No Computing Device | 323 | 4.3% |
| Total | 7,484 | 100.0% |
Internet Access in Charleston
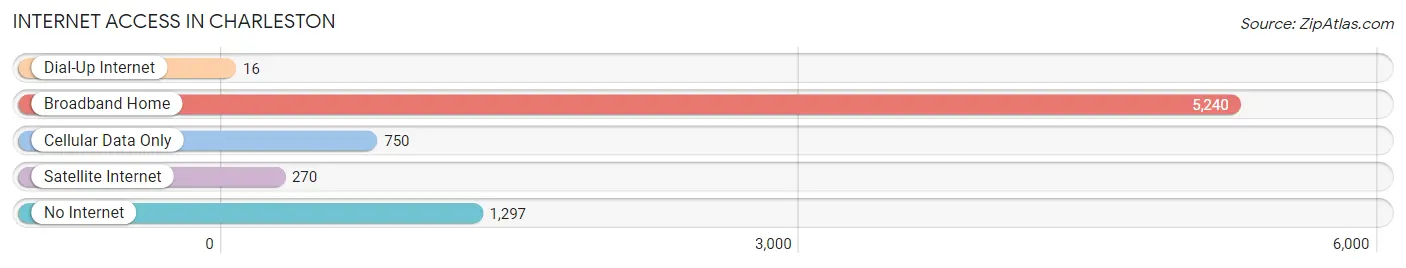
| Internet Type | # Households | % Households |
| Dial-Up Internet | 16 | 0.2% |
| Broadband Home | 5,240 | 70.0% |
| Cellular Data Only | 750 | 10.0% |
| Satellite Internet | 270 | 3.6% |
| No Internet | 1,297 | 17.3% |
| Total | 7,484 | 100.0% |
Charleston Summary
Charleston, Illinois is a city located in Coles County, Illinois, United States. It is the county seat of Coles County and is located in the east-central part of the state. The population of Charleston was 21,838 as of the 2010 census, making it the largest city in Coles County.
History
The area that is now Charleston was first settled in 1826 by John and William Coles, two brothers from Virginia. The brothers named the settlement after their father, Charles Coles. The town was officially incorporated in 1831 and was designated as the county seat of Coles County in 1833.
In the early years of its existence, Charleston was a small agricultural community. The town was connected to the rest of the state by the Illinois Central Railroad in 1854, which helped to spur economic growth. The town also became a center of education, with the establishment of Eastern Illinois University in 1895.
Geography
Charleston is located in east-central Illinois, approximately 120 miles south of Chicago and 40 miles east of Decatur. The city is situated in the flat, fertile plains of the Midwest, with the Embarras River running through the city. The city has a total area of 8.7 square miles, all of which is land.
Climate
Charleston has a humid continental climate, with hot, humid summers and cold, snowy winters. The average annual temperature is 54°F, with an average high of 79°F in July and an average low of 28°F in January. The average annual precipitation is 40 inches, with the wettest month being June, when an average of 4.5 inches of rain falls.
Economy
The economy of Charleston is largely based on agriculture, manufacturing, and education. The city is home to several large agricultural companies, including ADM, Cargill, and Monsanto. The city is also home to several manufacturing companies, including Caterpillar, Inc., and the Charleston Forge Company.
Education is also a major part of the economy, with Eastern Illinois University located in the city. The university has an enrollment of over 10,000 students and employs over 1,000 faculty and staff.
Demographics
As of the 2010 census, the population of Charleston was 21,838. The racial makeup of the city was 87.3% White, 8.2% African American, 0.5% Native American, 1.2% Asian, 0.1% Pacific Islander, 1.2% from other races, and 1.5% from two or more races. Hispanic or Latino of any race were 3.2% of the population.
The median household income in Charleston was $41,945, and the median family income was $50,945. The per capita income for the city was $20,845. About 11.2% of families and 15.3% of the population were below the poverty line, including 22.2% of those under age 18 and 8.2% of those age 65 or over.
Common Questions
What is Per Capita Income in Charleston?
Per Capita income in Charleston is $28,162.
What is the Median Family Income in Charleston?
Median Family Income in Charleston is $60,308.
What is the Median Household income in Charleston?
Median Household Income in Charleston is $47,533.
What is Income or Wage Gap in Charleston?
Income or Wage Gap in Charleston is 15.8%.
Women in Charleston earn 84.2 cents for every dollar earned by a man.
What is Family Income Deficit in Charleston?
Family Income Deficit in Charleston is $8,570.
Families that are below poverty line in Charleston earn $8,570 less on average than the poverty threshold level.
What is Inequality or Gini Index in Charleston?
Inequality or Gini Index in Charleston is 0.47.
What is the Total Population of Charleston?
Total Population of Charleston is 17,795.
What is the Total Male Population of Charleston?
Total Male Population of Charleston is 8,705.
What is the Total Female Population of Charleston?
Total Female Population of Charleston is 9,090.
What is the Ratio of Males per 100 Females in Charleston?
There are 95.76 Males per 100 Females in Charleston.
What is the Ratio of Females per 100 Males in Charleston?
There are 104.42 Females per 100 Males in Charleston.
What is the Median Population Age in Charleston?
Median Population Age in Charleston is 29.4 Years.
What is the Average Family Size in Charleston
Average Family Size in Charleston is 2.5 People.
What is the Average Household Size in Charleston
Average Household Size in Charleston is 2.0 People.
How Large is the Labor Force in Charleston?
There are 10,483 People in the Labor Forcein in Charleston.
What is the Percentage of People in the Labor Force in Charleston?
66.4% of People are in the Labor Force in Charleston.
What is the Unemployment Rate in Charleston?
Unemployment Rate in Charleston is 6.5%.