Cities with the Highest Percentage of Immigrants from Eastern Europe in Minnesota
RELATED REPORTS & OPTIONS
Eastern Europe
Minnesota
Compare Cities
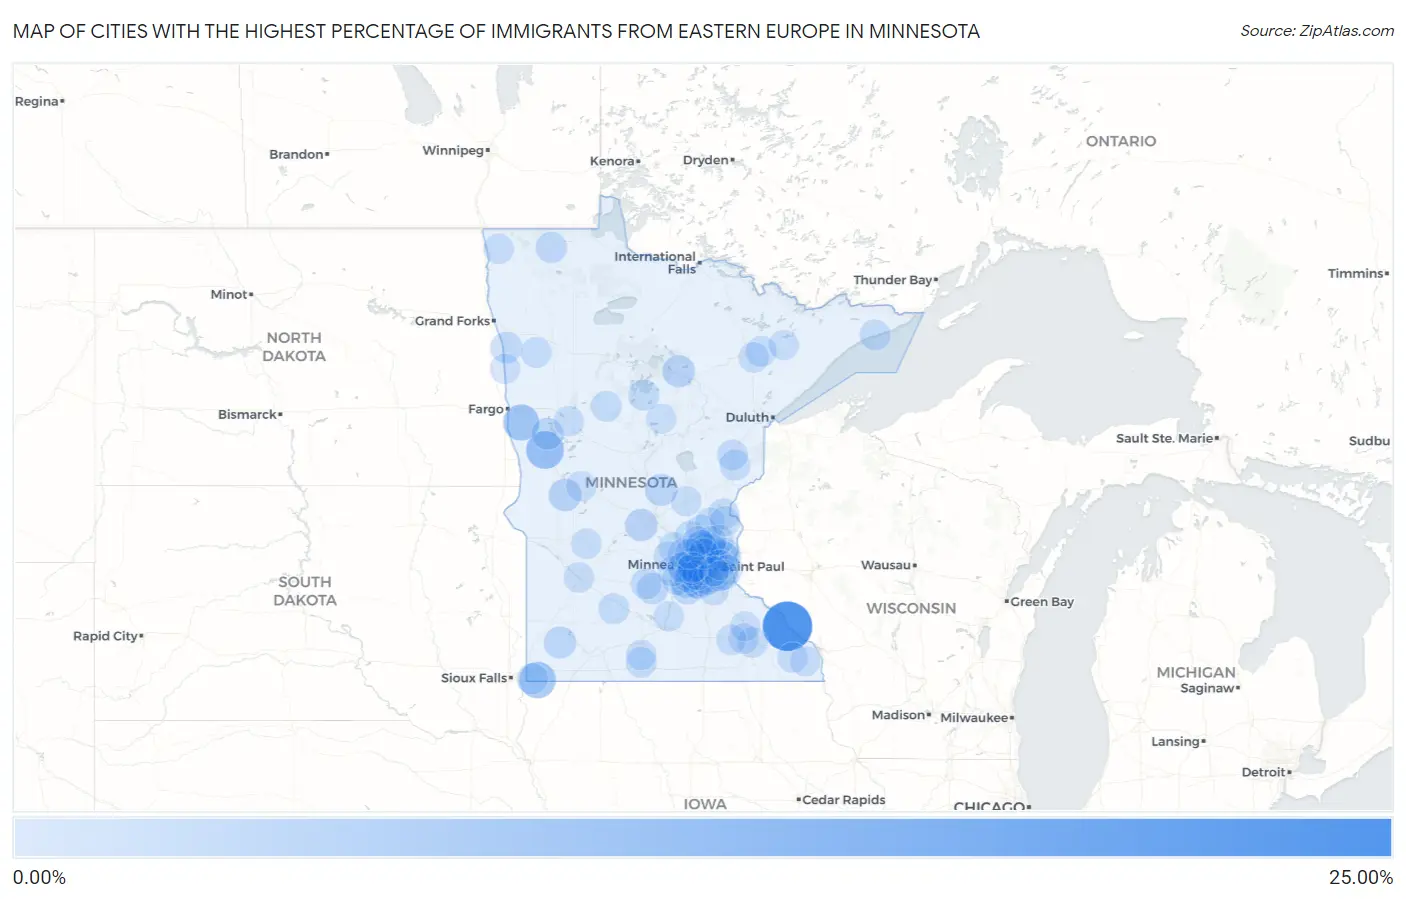
Map of Cities with the Highest Percentage of Immigrants from Eastern Europe in Minnesota
0.00%
25.00%
Cities with the Highest Percentage of Immigrants from Eastern Europe in Minnesota
| City | Eastern Europe | vs State | vs National | |
| 1. | Minneiska | 20.59% | 0.42%(+20.2)#1 | 0.67%(+19.9)#16 |
| 2. | Elizabeth | 8.09% | 0.42%(+7.67)#2 | 0.67%(+7.42)#106 |
| 3. | Steen | 6.73% | 0.42%(+6.31)#3 | 0.67%(+6.06)#146 |
| 4. | Baker | 6.38% | 0.42%(+5.97)#4 | 0.67%(+5.72)#169 |
| 5. | Medicine Lake | 6.21% | 0.42%(+5.79)#5 | 0.67%(+5.54)#175 |
| 6. | Hoffman | 2.94% | 0.42%(+2.52)#6 | 0.67%(+2.27)#618 |
| 7. | Golden Valley | 2.93% | 0.42%(+2.51)#7 | 0.67%(+2.26)#623 |
| 8. | Carver | 2.92% | 0.42%(+2.50)#8 | 0.67%(+2.25)#627 |
| 9. | Cold Spring | 2.73% | 0.42%(+2.31)#9 | 0.67%(+2.06)#694 |
| 10. | Zemple | 2.65% | 0.42%(+2.24)#10 | 0.67%(+1.99)#723 |
| 11. | Shakopee | 2.46% | 0.42%(+2.04)#11 | 0.67%(+1.79)#830 |
| 12. | Buckman | 2.38% | 0.42%(+1.96)#12 | 0.67%(+1.71)#859 |
| 13. | Hadley | 2.33% | 0.42%(+1.91)#13 | 0.67%(+1.66)#896 |
| 14. | Pelican Rapids | 2.09% | 0.42%(+1.67)#14 | 0.67%(+1.42)#1,039 |
| 15. | Climax | 1.78% | 0.42%(+1.36)#15 | 0.67%(+1.11)#1,293 |
| 16. | Jordan | 1.71% | 0.42%(+1.30)#16 | 0.67%(+1.05)#1,346 |
| 17. | New Auburn | 1.71% | 0.42%(+1.29)#17 | 0.67%(+1.04)#1,354 |
| 18. | Plymouth | 1.65% | 0.42%(+1.23)#18 | 0.67%(+0.985)#1,419 |
| 19. | Badger | 1.61% | 0.42%(+1.20)#19 | 0.67%(+0.946)#1,462 |
| 20. | Champlin | 1.58% | 0.42%(+1.16)#20 | 0.67%(+0.909)#1,512 |
| 21. | Dellwood | 1.38% | 0.42%(+0.967)#21 | 0.67%(+0.717)#1,760 |
| 22. | Maple Grove | 1.37% | 0.42%(+0.950)#22 | 0.67%(+0.701)#1,780 |
| 23. | St Louis Park | 1.36% | 0.42%(+0.942)#23 | 0.67%(+0.692)#1,797 |
| 24. | Whipholt | 1.35% | 0.42%(+0.934)#24 | 0.67%(+0.684)#1,810 |
| 25. | Willernie | 1.30% | 0.42%(+0.879)#25 | 0.67%(+0.629)#1,874 |
| 26. | Brownton | 1.29% | 0.42%(+0.869)#26 | 0.67%(+0.620)#1,894 |
| 27. | Mound | 1.27% | 0.42%(+0.855)#27 | 0.67%(+0.606)#1,919 |
| 28. | Hills | 1.22% | 0.42%(+0.807)#28 | 0.67%(+0.557)#2,016 |
| 29. | Minnetonka | 1.22% | 0.42%(+0.804)#29 | 0.67%(+0.555)#2,021 |
| 30. | Spring Lake Park | 1.19% | 0.42%(+0.774)#30 | 0.67%(+0.524)#2,070 |
| 31. | Elk River | 1.18% | 0.42%(+0.762)#31 | 0.67%(+0.513)#2,084 |
| 32. | Biwabik | 1.18% | 0.42%(+0.761)#32 | 0.67%(+0.511)#2,086 |
| 33. | Askov | 1.17% | 0.42%(+0.752)#33 | 0.67%(+0.502)#2,106 |
| 34. | Chanhassen | 1.16% | 0.42%(+0.742)#34 | 0.67%(+0.493)#2,121 |
| 35. | Fridley | 1.16% | 0.42%(+0.740)#35 | 0.67%(+0.490)#2,125 |
| 36. | Morgan | 1.15% | 0.42%(+0.732)#36 | 0.67%(+0.482)#2,140 |
| 37. | Grand Marais | 1.13% | 0.42%(+0.714)#37 | 0.67%(+0.464)#2,174 |
| 38. | Coon Rapids | 1.11% | 0.42%(+0.690)#38 | 0.67%(+0.440)#2,228 |
| 39. | Fertile | 1.10% | 0.42%(+0.686)#39 | 0.67%(+0.436)#2,239 |
| 40. | Falcon Heights | 1.09% | 0.42%(+0.672)#40 | 0.67%(+0.422)#2,264 |
| 41. | Willow River | 1.09% | 0.42%(+0.670)#41 | 0.67%(+0.420)#2,267 |
| 42. | Harris | 1.08% | 0.42%(+0.665)#42 | 0.67%(+0.415)#2,275 |
| 43. | Park Rapids | 1.06% | 0.42%(+0.640)#43 | 0.67%(+0.390)#2,337 |
| 44. | Eagan | 1.04% | 0.42%(+0.624)#44 | 0.67%(+0.374)#2,372 |
| 45. | White Bear Lake | 1.00% | 0.42%(+0.582)#45 | 0.67%(+0.332)#2,467 |
| 46. | Shorewood | 1.00% | 0.42%(+0.580)#46 | 0.67%(+0.330)#2,471 |
| 47. | Buffalo | 0.98% | 0.42%(+0.559)#47 | 0.67%(+0.309)#2,519 |
| 48. | Northrop | 0.96% | 0.42%(+0.544)#48 | 0.67%(+0.294)#2,557 |
| 49. | Long Lake | 0.93% | 0.42%(+0.517)#49 | 0.67%(+0.267)#2,626 |
| 50. | Cologne | 0.91% | 0.42%(+0.493)#50 | 0.67%(+0.244)#2,698 |
| 51. | Lexington | 0.90% | 0.42%(+0.481)#51 | 0.67%(+0.232)#2,729 |
| 52. | Blaine | 0.90% | 0.42%(+0.479)#52 | 0.67%(+0.229)#2,734 |
| 53. | Credit River | 0.89% | 0.42%(+0.472)#53 | 0.67%(+0.223)#2,749 |
| 54. | Prior Lake | 0.88% | 0.42%(+0.459)#54 | 0.67%(+0.209)#2,785 |
| 55. | St Francis | 0.87% | 0.42%(+0.449)#55 | 0.67%(+0.199)#2,824 |
| 56. | Gilbert | 0.82% | 0.42%(+0.406)#56 | 0.67%(+0.157)#2,942 |
| 57. | Granite Falls | 0.78% | 0.42%(+0.367)#57 | 0.67%(+0.117)#3,074 |
| 58. | Rochester | 0.77% | 0.42%(+0.352)#58 | 0.67%(+0.102)#3,119 |
| 59. | Savage | 0.76% | 0.42%(+0.338)#59 | 0.67%(+0.088)#3,168 |
| 60. | Byron | 0.72% | 0.42%(+0.304)#60 | 0.67%(+0.055)#3,280 |
| 61. | Woodland | 0.71% | 0.42%(+0.294)#61 | 0.67%(+0.045)#3,318 |
| 62. | Woodbury | 0.71% | 0.42%(+0.288)#62 | 0.67%(+0.038)#3,344 |
| 63. | Farmington | 0.70% | 0.42%(+0.285)#63 | 0.67%(+0.035)#3,358 |
| 64. | Murdock | 0.70% | 0.42%(+0.284)#64 | 0.67%(+0.035)#3,362 |
| 65. | Rushford Village | 0.70% | 0.42%(+0.283)#65 | 0.67%(+0.033)#3,368 |
| 66. | New Hope | 0.70% | 0.42%(+0.281)#66 | 0.67%(+0.031)#3,378 |
| 67. | Dodge Center | 0.67% | 0.42%(+0.254)#67 | 0.67%(+0.004)#3,489 |
| 68. | Waverly | 0.67% | 0.42%(+0.248)#68 | 0.67%(-0.002)#3,508 |
| 69. | Milaca | 0.66% | 0.42%(+0.242)#69 | 0.67%(-0.007)#3,530 |
| 70. | Truman | 0.66% | 0.42%(+0.241)#70 | 0.67%(-0.009)#3,540 |
| 71. | Mayer | 0.65% | 0.42%(+0.233)#71 | 0.67%(-0.017)#3,572 |
| 72. | Garfield | 0.65% | 0.42%(+0.232)#72 | 0.67%(-0.018)#3,575 |
| 73. | Isanti | 0.64% | 0.42%(+0.225)#73 | 0.67%(-0.025)#3,602 |
| 74. | Hallock | 0.62% | 0.42%(+0.207)#74 | 0.67%(-0.043)#3,678 |
| 75. | Minnetrista | 0.62% | 0.42%(+0.206)#75 | 0.67%(-0.044)#3,684 |
| 76. | St Peter | 0.62% | 0.42%(+0.206)#76 | 0.67%(-0.044)#3,685 |
| 77. | Greenfield | 0.62% | 0.42%(+0.201)#77 | 0.67%(-0.048)#3,699 |
| 78. | Edina | 0.61% | 0.42%(+0.188)#78 | 0.67%(-0.062)#3,763 |
| 79. | Columbus | 0.60% | 0.42%(+0.181)#79 | 0.67%(-0.069)#3,792 |
| 80. | Eden Prairie | 0.60% | 0.42%(+0.178)#80 | 0.67%(-0.071)#3,801 |
| 81. | Ham Lake | 0.59% | 0.42%(+0.177)#81 | 0.67%(-0.073)#3,807 |
| 82. | Anoka | 0.59% | 0.42%(+0.169)#82 | 0.67%(-0.080)#3,841 |
| 83. | Babbitt | 0.58% | 0.42%(+0.164)#83 | 0.67%(-0.086)#3,867 |
| 84. | Excelsior | 0.58% | 0.42%(+0.159)#84 | 0.67%(-0.091)#3,892 |
| 85. | Burnsville | 0.57% | 0.42%(+0.152)#85 | 0.67%(-0.097)#3,920 |
| 86. | Chaska | 0.57% | 0.42%(+0.152)#86 | 0.67%(-0.098)#3,924 |
| 87. | Frazee | 0.57% | 0.42%(+0.148)#87 | 0.67%(-0.101)#3,936 |
| 88. | Houston | 0.56% | 0.42%(+0.143)#88 | 0.67%(-0.107)#3,956 |
| 89. | St Paul Park | 0.55% | 0.42%(+0.128)#89 | 0.67%(-0.121)#4,026 |
| 90. | Brooklyn Park | 0.54% | 0.42%(+0.125)#90 | 0.67%(-0.124)#4,041 |
| 91. | Inver Grove Heights | 0.54% | 0.42%(+0.121)#91 | 0.67%(-0.129)#4,062 |
| 92. | Corcoran | 0.52% | 0.42%(+0.102)#92 | 0.67%(-0.148)#4,152 |
| 93. | Maplewood | 0.52% | 0.42%(+0.099)#93 | 0.67%(-0.150)#4,165 |
| 94. | North Branch | 0.50% | 0.42%(+0.084)#94 | 0.67%(-0.166)#4,240 |
| 95. | Ramsey | 0.50% | 0.42%(+0.083)#95 | 0.67%(-0.167)#4,244 |
| 96. | Pine Island | 0.50% | 0.42%(+0.079)#96 | 0.67%(-0.171)#4,261 |
| 97. | Mendota Heights | 0.49% | 0.42%(+0.072)#97 | 0.67%(-0.178)#4,292 |
| 98. | Halstad | 0.48% | 0.42%(+0.065)#98 | 0.67%(-0.185)#4,328 |
| 99. | Deephaven | 0.47% | 0.42%(+0.050)#99 | 0.67%(-0.200)#4,415 |
| 100. | Fifty Lakes | 0.46% | 0.42%(+0.047)#100 | 0.67%(-0.203)#4,429 |
Common Questions
What are the Top 10 Cities with the Highest Percentage of Immigrants from Eastern Europe in Minnesota?
Top 10 Cities with the Highest Percentage of Immigrants from Eastern Europe in Minnesota are:
#1
20.59%
#2
8.09%
#3
6.73%
#4
6.38%
#5
6.21%
#6
2.94%
#7
2.93%
#8
2.92%
#9
2.73%
#10
2.65%
What city has the Highest Percentage of Immigrants from Eastern Europe in Minnesota?
Minneiska has the Highest Percentage of Immigrants from Eastern Europe in Minnesota with 20.59%.
What is the Percentage of Immigrants from Eastern Europe in the State of Minnesota?
Percentage of Immigrants from Eastern Europe in Minnesota is 0.42%.
What is the Percentage of Immigrants from Eastern Europe in the United States?
Percentage of Immigrants from Eastern Europe in the United States is 0.67%.