Cities with the Highest Percentage of Immigrants from Eastern Europe in Oklahoma
RELATED REPORTS & OPTIONS
Eastern Europe
Oklahoma
Compare Cities
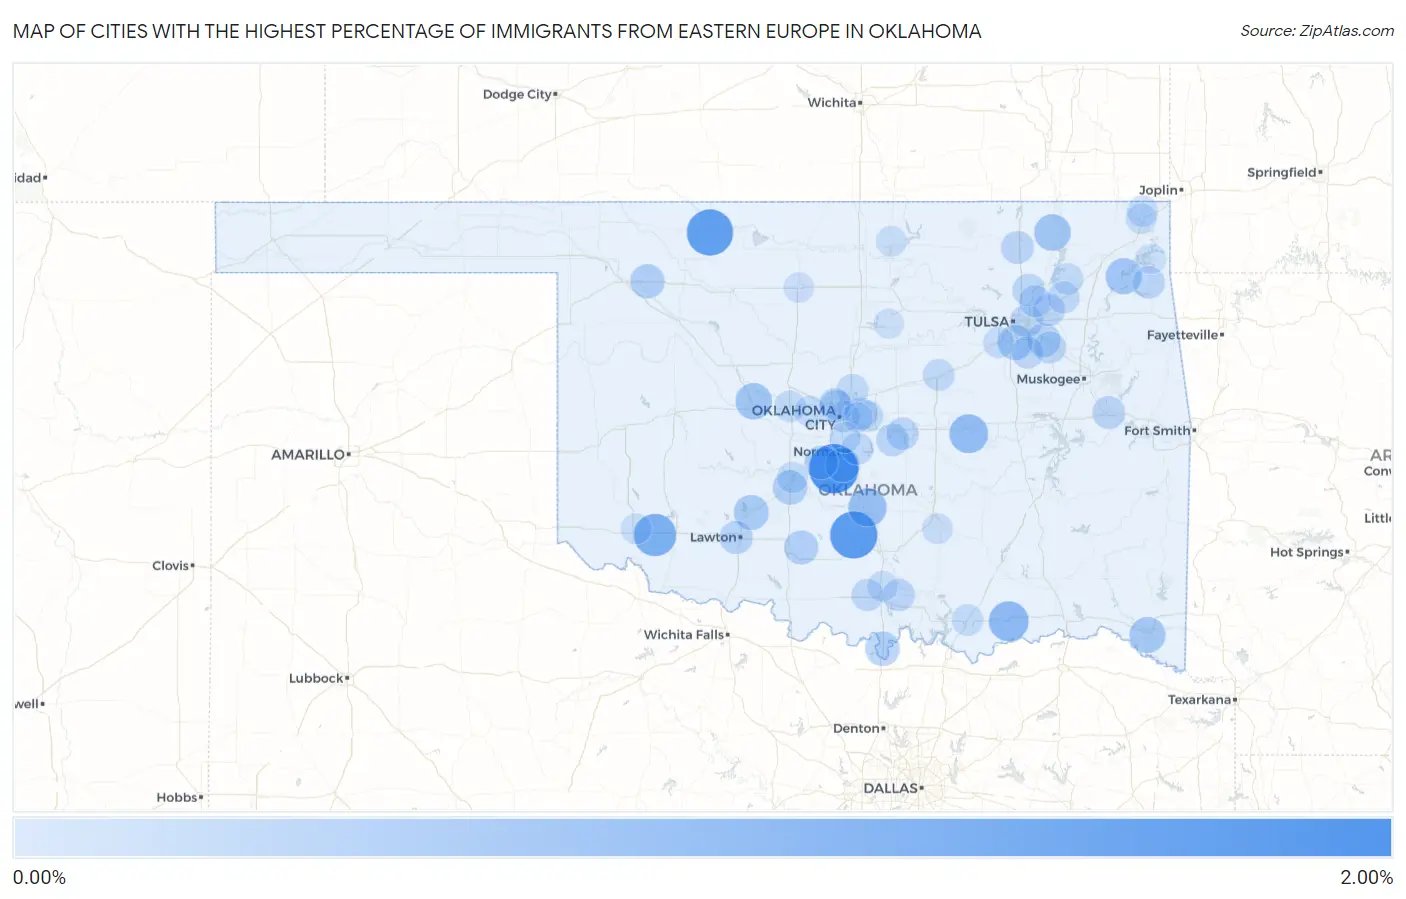
Map of Cities with the Highest Percentage of Immigrants from Eastern Europe in Oklahoma
0.00%
2.00%
Cities with the Highest Percentage of Immigrants from Eastern Europe in Oklahoma
| City | Eastern Europe | vs State | vs National | |
| 1. | Cole | 1.88% | 0.12%(+1.76)#1 | 0.67%(+1.21)#1,193 |
| 2. | Elmore City | 1.65% | 0.12%(+1.53)#2 | 0.67%(+0.981)#1,423 |
| 3. | Alva | 1.55% | 0.12%(+1.43)#3 | 0.67%(+0.887)#1,531 |
| 4. | Headrick | 1.16% | 0.12%(+1.04)#4 | 0.67%(+0.496)#2,117 |
| 5. | Bennington | 0.91% | 0.12%(+0.795)#5 | 0.67%(+0.248)#2,688 |
| 6. | Bearden | 0.81% | 0.12%(+0.687)#6 | 0.67%(+0.139)#2,989 |
| 7. | Paoli | 0.76% | 0.12%(+0.636)#7 | 0.67%(+0.088)#3,166 |
| 8. | Delaware | 0.61% | 0.12%(+0.488)#8 | 0.67%(-0.059)#3,749 |
| 9. | Geary | 0.59% | 0.12%(+0.466)#9 | 0.67%(-0.081)#3,845 |
| 10. | Disney | 0.56% | 0.12%(+0.442)#10 | 0.67%(-0.105)#3,950 |
| 11. | Idabel | 0.54% | 0.12%(+0.424)#11 | 0.67%(-0.124)#4,038 |
| 12. | Elgin | 0.46% | 0.12%(+0.338)#12 | 0.67%(-0.210)#4,463 |
| 13. | Jenks | 0.44% | 0.12%(+0.321)#13 | 0.67%(-0.226)#4,552 |
| 14. | Thackerville | 0.41% | 0.12%(+0.286)#14 | 0.67%(-0.261)#4,773 |
| 15. | Ninnekah | 0.40% | 0.12%(+0.285)#15 | 0.67%(-0.263)#4,780 |
| 16. | Goldsby | 0.40% | 0.12%(+0.281)#16 | 0.67%(-0.266)#4,800 |
| 17. | Mooreland | 0.39% | 0.12%(+0.269)#17 | 0.67%(-0.278)#4,883 |
| 18. | Duncan | 0.36% | 0.12%(+0.245)#18 | 0.67%(-0.302)#5,047 |
| 19. | Blanchard | 0.33% | 0.12%(+0.213)#19 | 0.67%(-0.334)#5,251 |
| 20. | Broken Arrow | 0.32% | 0.12%(+0.199)#20 | 0.67%(-0.348)#5,345 |
| 21. | Lawton | 0.27% | 0.12%(+0.153)#21 | 0.67%(-0.395)#5,755 |
| 22. | Webbers Falls | 0.25% | 0.12%(+0.135)#22 | 0.67%(-0.413)#5,927 |
| 23. | Bartlesville | 0.25% | 0.12%(+0.130)#23 | 0.67%(-0.418)#5,982 |
| 24. | Nichols Hills | 0.23% | 0.12%(+0.114)#24 | 0.67%(-0.434)#6,134 |
| 25. | Bethel Acres | 0.23% | 0.12%(+0.109)#25 | 0.67%(-0.439)#6,185 |
| 26. | Tulsa | 0.23% | 0.12%(+0.106)#26 | 0.67%(-0.441)#6,204 |
| 27. | Collinsville | 0.22% | 0.12%(+0.103)#27 | 0.67%(-0.444)#6,236 |
| 28. | Shawnee | 0.22% | 0.12%(+0.097)#28 | 0.67%(-0.450)#6,301 |
| 29. | Dickson | 0.21% | 0.12%(+0.088)#29 | 0.67%(-0.460)#6,382 |
| 30. | Verdigris | 0.21% | 0.12%(+0.088)#30 | 0.67%(-0.460)#6,388 |
| 31. | Jay | 0.21% | 0.12%(+0.087)#31 | 0.67%(-0.460)#6,391 |
| 32. | Nicoma Park | 0.20% | 0.12%(+0.077)#32 | 0.67%(-0.470)#6,486 |
| 33. | Owasso | 0.18% | 0.12%(+0.064)#33 | 0.67%(-0.484)#6,624 |
| 34. | Coweta | 0.18% | 0.12%(+0.062)#34 | 0.67%(-0.485)#6,641 |
| 35. | Lone Grove | 0.18% | 0.12%(+0.059)#35 | 0.67%(-0.488)#6,667 |
| 36. | Bixby | 0.18% | 0.12%(+0.058)#36 | 0.67%(-0.490)#6,689 |
| 37. | Norman | 0.16% | 0.12%(+0.045)#37 | 0.67%(-0.503)#6,803 |
| 38. | Claremore | 0.16% | 0.12%(+0.043)#38 | 0.67%(-0.505)#6,830 |
| 39. | Edmond | 0.16% | 0.12%(+0.041)#39 | 0.67%(-0.506)#6,839 |
| 40. | Stroud | 0.15% | 0.12%(+0.026)#40 | 0.67%(-0.522)#7,000 |
| 41. | Oklahoma City | 0.14% | 0.12%(+0.022)#41 | 0.67%(-0.525)#7,045 |
| 42. | Choctaw | 0.14% | 0.12%(+0.020)#42 | 0.67%(-0.527)#7,063 |
| 43. | Durant | 0.14% | 0.12%(+0.019)#43 | 0.67%(-0.529)#7,074 |
| 44. | Bushyhead | 0.14% | 0.12%(+0.019)#44 | 0.67%(-0.529)#7,075 |
| 45. | El Reno | 0.13% | 0.12%(+0.012)#45 | 0.67%(-0.535)#7,132 |
| 46. | The Village | 0.13% | 0.12%(+0.007)#46 | 0.67%(-0.541)#7,176 |
| 47. | Yukon | 0.11% | 0.12%(-0.012)#47 | 0.67%(-0.560)#7,331 |
| 48. | Chickasha | 0.10% | 0.12%(-0.015)#48 | 0.67%(-0.562)#7,357 |
| 49. | Moore | 0.097% | 0.12%(-0.022)#49 | 0.67%(-0.570)#7,431 |
| 50. | Commerce | 0.087% | 0.12%(-0.033)#50 | 0.67%(-0.580)#7,520 |
| 51. | Sapulpa | 0.086% | 0.12%(-0.033)#51 | 0.67%(-0.581)#7,526 |
| 52. | Miami | 0.077% | 0.12%(-0.043)#52 | 0.67%(-0.590)#7,601 |
| 53. | Altus | 0.075% | 0.12%(-0.045)#53 | 0.67%(-0.592)#7,626 |
| 54. | Ponca City | 0.070% | 0.12%(-0.050)#54 | 0.67%(-0.598)#7,674 |
| 55. | Ardmore | 0.061% | 0.12%(-0.059)#55 | 0.67%(-0.607)#7,752 |
| 56. | Ada | 0.060% | 0.12%(-0.059)#56 | 0.67%(-0.607)#7,754 |
| 57. | Enid | 0.020% | 0.12%(-0.100)#57 | 0.67%(-0.647)#8,043 |
| 58. | Stillwater | 0.014% | 0.12%(-0.105)#58 | 0.67%(-0.653)#8,072 |
| 59. | Grove | 0.014% | 0.12%(-0.105)#59 | 0.67%(-0.653)#8,074 |
| 60. | Midwest City | 0.012% | 0.12%(-0.108)#60 | 0.67%(-0.655)#8,082 |
Common Questions
What are the Top 10 Cities with the Highest Percentage of Immigrants from Eastern Europe in Oklahoma?
Top 10 Cities with the Highest Percentage of Immigrants from Eastern Europe in Oklahoma are:
#1
1.88%
#2
1.65%
#3
1.55%
#4
1.16%
#5
0.91%
#6
0.81%
#7
0.76%
#8
0.61%
#9
0.59%
#10
0.56%
What city has the Highest Percentage of Immigrants from Eastern Europe in Oklahoma?
Cole has the Highest Percentage of Immigrants from Eastern Europe in Oklahoma with 1.88%.
What is the Percentage of Immigrants from Eastern Europe in the State of Oklahoma?
Percentage of Immigrants from Eastern Europe in Oklahoma is 0.12%.
What is the Percentage of Immigrants from Eastern Europe in the United States?
Percentage of Immigrants from Eastern Europe in the United States is 0.67%.