Cities with the Highest Percentage of Immigrants from Eastern Europe in New York
RELATED REPORTS & OPTIONS
Eastern Europe
New York
Compare Cities
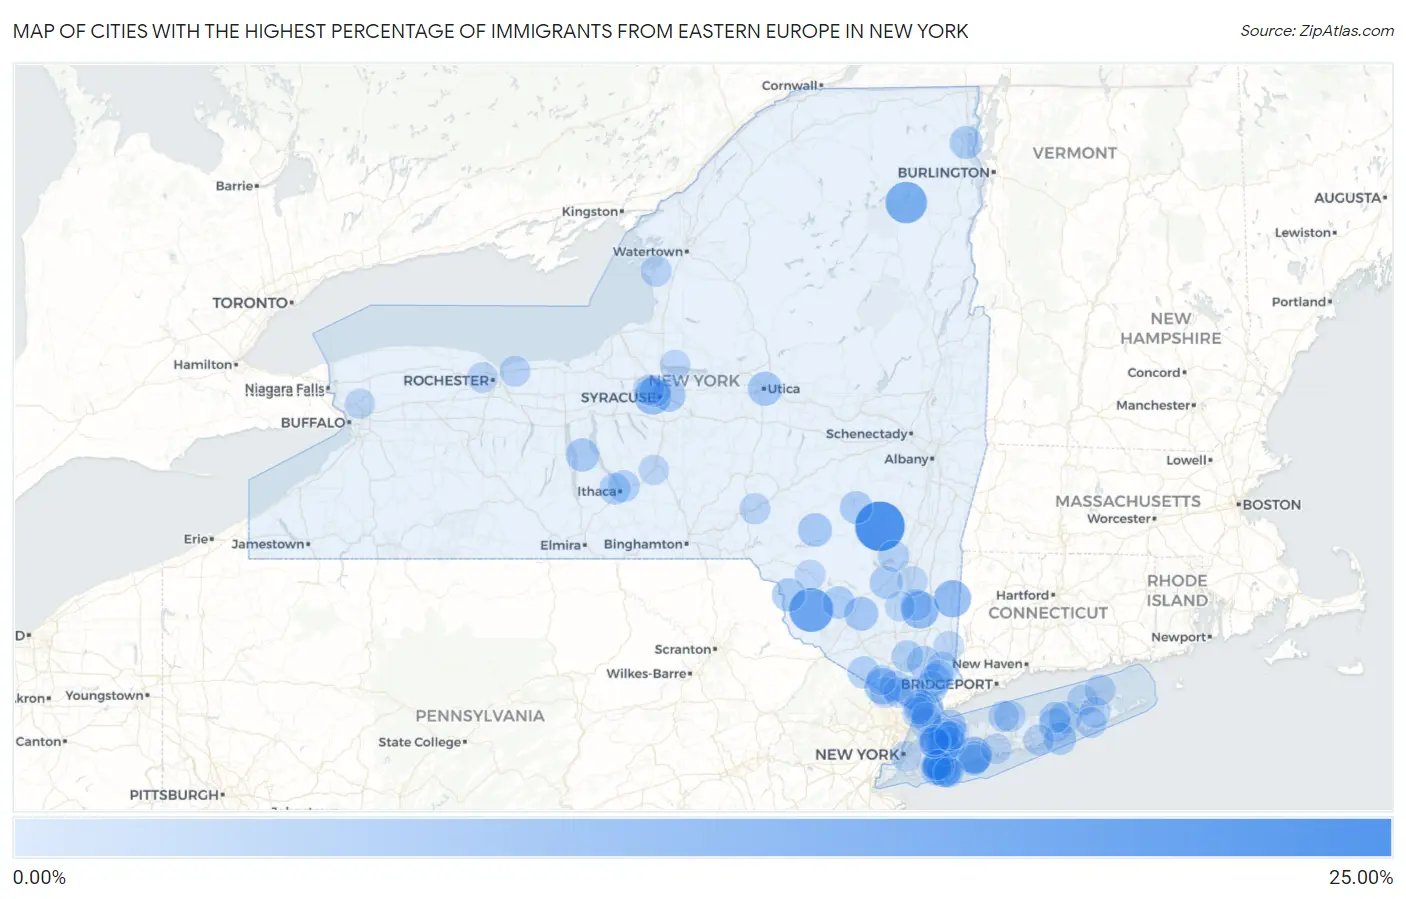
Map of Cities with the Highest Percentage of Immigrants from Eastern Europe in New York
0.00%
25.00%
Cities with the Highest Percentage of Immigrants from Eastern Europe in New York
| City | Eastern Europe | vs State | vs National | |
| 1. | Hunter | 22.33% | 1.86%(+20.5)#1 | 0.67%(+21.7)#13 |
| 2. | Smallwood | 16.52% | 1.86%(+14.7)#2 | 0.67%(+15.8)#24 |
| 3. | Lake Placid | 13.95% | 1.86%(+12.1)#3 | 0.67%(+13.3)#35 |
| 4. | Titusville | 9.79% | 1.86%(+7.93)#4 | 0.67%(+9.12)#81 |
| 5. | Dover Plains | 9.53% | 1.86%(+7.67)#5 | 0.67%(+8.86)#85 |
| 6. | Solvay | 9.04% | 1.86%(+7.17)#6 | 0.67%(+8.37)#89 |
| 7. | North Lindenhurst | 8.79% | 1.86%(+6.93)#7 | 0.67%(+8.13)#94 |
| 8. | Hewlett Harbor | 8.44% | 1.86%(+6.58)#8 | 0.67%(+7.78)#98 |
| 9. | Sloatsburg | 8.06% | 1.86%(+6.20)#9 | 0.67%(+7.39)#107 |
| 10. | Woodbourne | 7.26% | 1.86%(+5.40)#10 | 0.67%(+6.60)#127 |
| 11. | Hartsdale | 7.17% | 1.86%(+5.31)#11 | 0.67%(+6.50)#132 |
| 12. | Barnum Island | 6.93% | 1.86%(+5.06)#12 | 0.67%(+6.26)#139 |
| 13. | Sleepy Hollow Lake | 6.42% | 1.86%(+4.56)#13 | 0.67%(+5.75)#164 |
| 14. | Utica | 6.41% | 1.86%(+4.55)#14 | 0.67%(+5.75)#165 |
| 15. | Island Park | 6.27% | 1.86%(+4.40)#15 | 0.67%(+5.60)#174 |
| 16. | Walker Valley | 6.18% | 1.86%(+4.32)#16 | 0.67%(+5.51)#176 |
| 17. | Andes | 6.09% | 1.86%(+4.22)#17 | 0.67%(+5.42)#185 |
| 18. | East Syracuse | 5.77% | 1.86%(+3.91)#18 | 0.67%(+5.11)#202 |
| 19. | Hortonville | 5.67% | 1.86%(+3.81)#19 | 0.67%(+5.01)#206 |
| 20. | Ovid | 5.60% | 1.86%(+3.74)#20 | 0.67%(+4.94)#211 |
| 21. | Greenvale | 5.41% | 1.86%(+3.55)#21 | 0.67%(+4.75)#228 |
| 22. | Shrub Oak | 5.40% | 1.86%(+3.53)#22 | 0.67%(+4.73)#230 |
| 23. | Lindenhurst | 5.39% | 1.86%(+3.53)#23 | 0.67%(+4.72)#231 |
| 24. | Parc | 5.26% | 1.86%(+3.40)#24 | 0.67%(+4.60)#238 |
| 25. | Lattingtown | 5.20% | 1.86%(+3.34)#25 | 0.67%(+4.53)#244 |
| 26. | Setauket | 5.11% | 1.86%(+3.25)#26 | 0.67%(+4.44)#255 |
| 27. | Stone Ridge | 5.11% | 1.86%(+3.24)#27 | 0.67%(+4.44)#256 |
| 28. | Prattsville | 5.10% | 1.86%(+3.24)#28 | 0.67%(+4.43)#257 |
| 29. | Riverside | 4.99% | 1.86%(+3.13)#29 | 0.67%(+4.32)#267 |
| 30. | Jamesport | 4.90% | 1.86%(+3.03)#30 | 0.67%(+4.23)#276 |
| 31. | Mount Kisco | 4.85% | 1.86%(+2.98)#31 | 0.67%(+4.18)#284 |
| 32. | Quiogue | 4.83% | 1.86%(+2.97)#32 | 0.67%(+4.16)#286 |
| 33. | Woodridge | 4.70% | 1.86%(+2.84)#33 | 0.67%(+4.03)#295 |
| 34. | Albertson | 4.67% | 1.86%(+2.81)#34 | 0.67%(+4.00)#301 |
| 35. | Chappaqua | 4.66% | 1.86%(+2.80)#35 | 0.67%(+3.99)#302 |
| 36. | Kauneonga Lake | 4.64% | 1.86%(+2.78)#36 | 0.67%(+3.97)#305 |
| 37. | Warwick | 4.58% | 1.86%(+2.72)#37 | 0.67%(+3.92)#309 |
| 38. | Valley Cottage | 4.58% | 1.86%(+2.71)#38 | 0.67%(+3.91)#311 |
| 39. | Hewlett Bay Park | 4.25% | 1.86%(+2.39)#39 | 0.67%(+3.58)#349 |
| 40. | Northeast Ithaca | 4.15% | 1.86%(+2.29)#40 | 0.67%(+3.48)#368 |
| 41. | Roslyn Estates | 4.15% | 1.86%(+2.29)#41 | 0.67%(+3.48)#369 |
| 42. | Golden S Bridge | 4.11% | 1.86%(+2.25)#42 | 0.67%(+3.45)#375 |
| 43. | Mineola | 4.05% | 1.86%(+2.19)#43 | 0.67%(+3.39)#384 |
| 44. | Marcy | 4.05% | 1.86%(+2.18)#44 | 0.67%(+3.38)#386 |
| 45. | Highland Falls | 4.03% | 1.86%(+2.17)#45 | 0.67%(+3.37)#387 |
| 46. | Northwest Ithaca | 3.95% | 1.86%(+2.09)#46 | 0.67%(+3.29)#397 |
| 47. | Pelham | 3.95% | 1.86%(+2.09)#47 | 0.67%(+3.29)#399 |
| 48. | Galeville | 3.92% | 1.86%(+2.06)#48 | 0.67%(+3.25)#405 |
| 49. | Arlington | 3.91% | 1.86%(+2.05)#49 | 0.67%(+3.24)#406 |
| 50. | Copiague | 3.88% | 1.86%(+2.02)#50 | 0.67%(+3.21)#413 |
| 51. | Zena | 3.72% | 1.86%(+1.86)#51 | 0.67%(+3.05)#435 |
| 52. | Belle Terre | 3.70% | 1.86%(+1.84)#52 | 0.67%(+3.03)#442 |
| 53. | Wesley Hills | 3.67% | 1.86%(+1.81)#53 | 0.67%(+3.01)#446 |
| 54. | Saddle Rock | 3.65% | 1.86%(+1.78)#54 | 0.67%(+2.98)#451 |
| 55. | Riverhead | 3.59% | 1.86%(+1.72)#55 | 0.67%(+2.92)#472 |
| 56. | Irvington | 3.58% | 1.86%(+1.72)#56 | 0.67%(+2.91)#473 |
| 57. | Old Westbury | 3.56% | 1.86%(+1.70)#57 | 0.67%(+2.89)#475 |
| 58. | Upper Brookville | 3.51% | 1.86%(+1.65)#58 | 0.67%(+2.84)#489 |
| 59. | Sea Cliff | 3.44% | 1.86%(+1.57)#59 | 0.67%(+2.77)#498 |
| 60. | Moriches | 3.39% | 1.86%(+1.53)#60 | 0.67%(+2.72)#507 |
| 61. | Henderson | 3.36% | 1.86%(+1.50)#61 | 0.67%(+2.69)#512 |
| 62. | Old Field | 3.33% | 1.86%(+1.47)#62 | 0.67%(+2.67)#518 |
| 63. | Hastings On Hudson | 3.30% | 1.86%(+1.44)#63 | 0.67%(+2.63)#522 |
| 64. | Unadilla | 3.28% | 1.86%(+1.42)#64 | 0.67%(+2.61)#528 |
| 65. | Lawrence | 3.28% | 1.86%(+1.42)#65 | 0.67%(+2.61)#532 |
| 66. | Lakeland | 3.18% | 1.86%(+1.32)#66 | 0.67%(+2.52)#550 |
| 67. | Webster | 3.18% | 1.86%(+1.32)#67 | 0.67%(+2.51)#551 |
| 68. | Southold | 3.13% | 1.86%(+1.27)#68 | 0.67%(+2.46)#563 |
| 69. | Great Neck Plaza | 3.13% | 1.86%(+1.27)#69 | 0.67%(+2.46)#564 |
| 70. | Noyack | 3.13% | 1.86%(+1.26)#70 | 0.67%(+2.46)#565 |
| 71. | Orient | 3.11% | 1.86%(+1.25)#71 | 0.67%(+2.45)#567 |
| 72. | Dobbs Ferry | 3.11% | 1.86%(+1.25)#72 | 0.67%(+2.45)#568 |
| 73. | New York | 3.11% | 1.86%(+1.25)#73 | 0.67%(+2.45)#569 |
| 74. | Hillburn | 3.09% | 1.86%(+1.23)#74 | 0.67%(+2.43)#575 |
| 75. | Water Mill | 3.08% | 1.86%(+1.21)#75 | 0.67%(+2.41)#583 |
| 76. | North Gates | 3.02% | 1.86%(+1.16)#76 | 0.67%(+2.35)#596 |
| 77. | Spring Valley | 2.97% | 1.86%(+1.11)#77 | 0.67%(+2.31)#608 |
| 78. | Niagara University | 2.87% | 1.86%(+1.01)#78 | 0.67%(+2.21)#644 |
| 79. | Hewlett | 2.85% | 1.86%(+0.983)#79 | 0.67%(+2.18)#657 |
| 80. | Islip Terrace | 2.84% | 1.86%(+0.977)#80 | 0.67%(+2.17)#660 |
| 81. | Greenville Cdp Westchester County | 2.82% | 1.86%(+0.954)#81 | 0.67%(+2.15)#666 |
| 82. | Livingston Manor | 2.78% | 1.86%(+0.918)#82 | 0.67%(+2.11)#678 |
| 83. | Loudonville | 2.77% | 1.86%(+0.906)#83 | 0.67%(+2.10)#680 |
| 84. | Brewster Hill | 2.76% | 1.86%(+0.902)#84 | 0.67%(+2.10)#682 |
| 85. | Roessleville | 2.75% | 1.86%(+0.883)#85 | 0.67%(+2.08)#691 |
| 86. | Woodmere | 2.72% | 1.86%(+0.854)#86 | 0.67%(+2.05)#697 |
| 87. | Tuxedo Park | 2.71% | 1.86%(+0.852)#87 | 0.67%(+2.05)#698 |
| 88. | Mountain Dale | 2.69% | 1.86%(+0.830)#88 | 0.67%(+2.03)#707 |
| 89. | Staatsburg | 2.68% | 1.86%(+0.820)#89 | 0.67%(+2.02)#711 |
| 90. | Constantia | 2.66% | 1.86%(+0.801)#90 | 0.67%(+2.00)#719 |
| 91. | Great Neck Estates | 2.62% | 1.86%(+0.760)#91 | 0.67%(+1.96)#741 |
| 92. | University At Buffalo | 2.62% | 1.86%(+0.755)#92 | 0.67%(+1.95)#744 |
| 93. | Eastchester | 2.61% | 1.86%(+0.745)#93 | 0.67%(+1.94)#751 |
| 94. | Lido Beach | 2.56% | 1.86%(+0.700)#94 | 0.67%(+1.90)#774 |
| 95. | Bedford Hills | 2.56% | 1.86%(+0.698)#95 | 0.67%(+1.89)#775 |
| 96. | Clintondale | 2.55% | 1.86%(+0.683)#96 | 0.67%(+1.88)#778 |
| 97. | Great Neck | 2.52% | 1.86%(+0.660)#97 | 0.67%(+1.86)#785 |
| 98. | Bard College | 2.52% | 1.86%(+0.653)#98 | 0.67%(+1.85)#792 |
| 99. | Old Brookville | 2.51% | 1.86%(+0.646)#99 | 0.67%(+1.84)#797 |
| 100. | Munsons Corners | 2.50% | 1.86%(+0.637)#100 | 0.67%(+1.83)#800 |
Common Questions
What are the Top 10 Cities with the Highest Percentage of Immigrants from Eastern Europe in New York?
Top 10 Cities with the Highest Percentage of Immigrants from Eastern Europe in New York are:
#1
22.33%
#2
16.52%
#3
13.95%
#4
9.79%
#5
9.53%
#6
9.04%
#7
8.79%
#8
8.44%
#9
8.06%
#10
7.17%
What city has the Highest Percentage of Immigrants from Eastern Europe in New York?
Hunter has the Highest Percentage of Immigrants from Eastern Europe in New York with 22.33%.
What is the Percentage of Immigrants from Eastern Europe in the State of New York?
Percentage of Immigrants from Eastern Europe in New York is 1.86%.
What is the Percentage of Immigrants from Eastern Europe in the United States?
Percentage of Immigrants from Eastern Europe in the United States is 0.67%.