Monona, IA Map & Demographics
Monona Map
Monona Overview
$35,032
PER CAPITA INCOME
$90,250
AVG FAMILY INCOME
$53,250
AVG HOUSEHOLD INCOME
30.4%
WAGE / INCOME GAP [ % ]
69.6¢/ $1
WAGE / INCOME GAP [ $ ]
0.41
INEQUALITY / GINI INDEX
1,571
TOTAL POPULATION
738
MALE POPULATION
833
FEMALE POPULATION
88.60
MALES / 100 FEMALES
112.87
FEMALES / 100 MALES
43.6
MEDIAN AGE
2.8
AVG FAMILY SIZE
2.2
AVG HOUSEHOLD SIZE
855
LABOR FORCE [ PEOPLE ]
68.5%
PERCENT IN LABOR FORCE
1.3%
UNEMPLOYMENT RATE
Monona Zip Codes
Monona Area Codes
Income in Monona
Income Overview in Monona
Per Capita Income in Monona is $35,032, while median incomes of families and households are $90,250 and $53,250 respectively.
| Characteristic | Number | Measure |
| Per Capita Income | 1,571 | $35,032 |
| Median Family Income | 411 | $90,250 |
| Mean Family Income | 411 | $97,259 |
| Median Household Income | 716 | $53,250 |
| Mean Household Income | 716 | $76,358 |
| Income Deficit | 411 | $0 |
| Wage / Income Gap (%) | 1,571 | 30.44% |
| Wage / Income Gap ($) | 1,571 | 69.56¢ per $1 |
| Gini / Inequality Index | 1,571 | 0.41 |
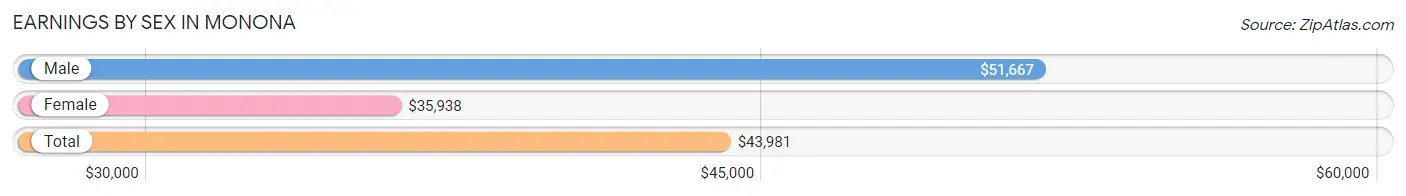
Earnings by Sex in Monona
Average Earnings in Monona are $43,981, $51,667 for men and $35,938 for women, a difference of 30.4%.
| Sex | Number | Average Earnings |
| Male | 440 (50.2%) | $51,667 |
| Female | 436 (49.8%) | $35,938 |
| Total | 876 (100.0%) | $43,981 |
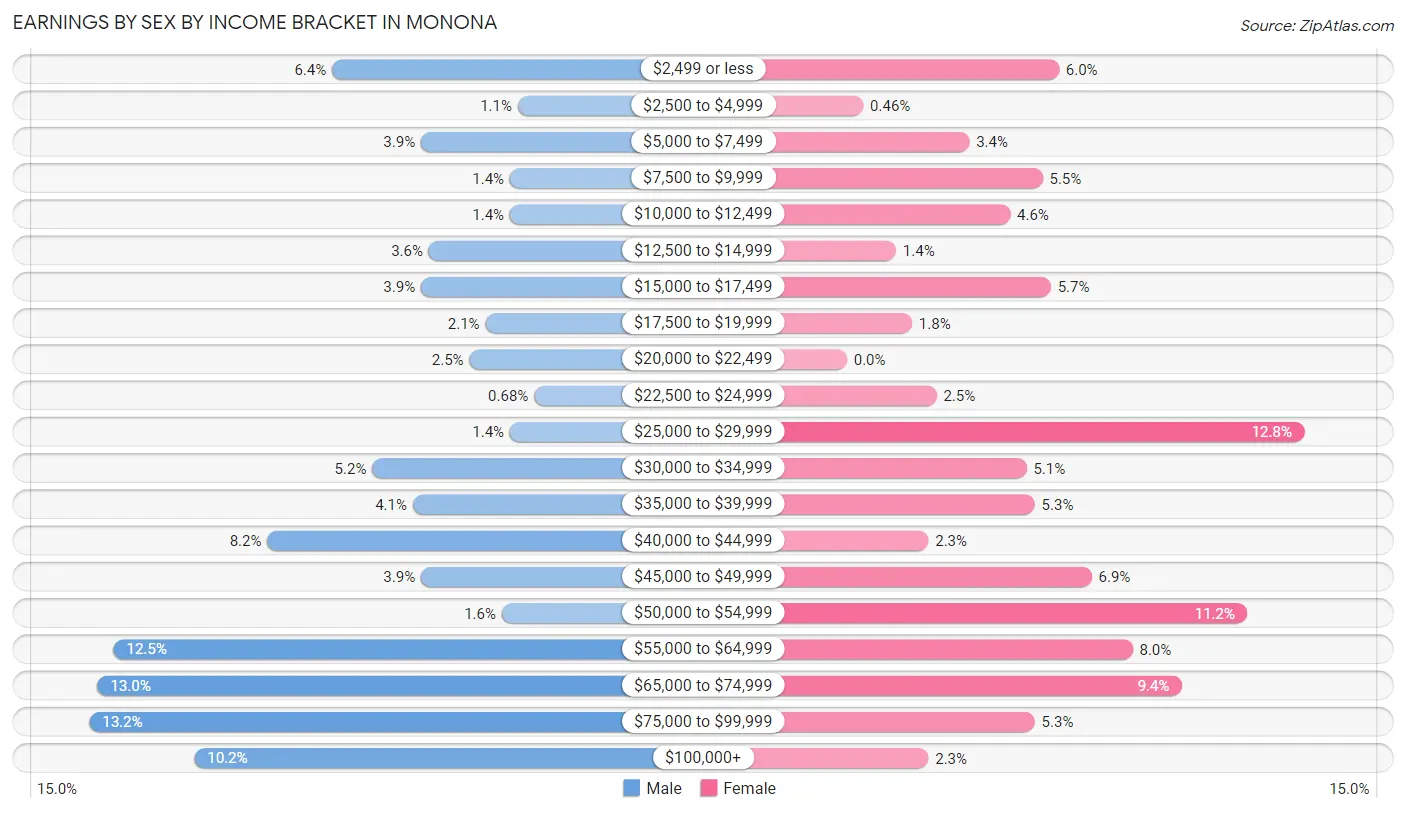
Earnings by Sex by Income Bracket in Monona
The most common earnings brackets in Monona are $75,000 to $99,999 for men (58 | 13.2%) and $25,000 to $29,999 for women (56 | 12.8%).
| Income | Male | Female |
| $2,499 or less | 28 (6.4%) | 26 (6.0%) |
| $2,500 to $4,999 | 5 (1.1%) | 2 (0.5%) |
| $5,000 to $7,499 | 17 (3.9%) | 15 (3.4%) |
| $7,500 to $9,999 | 6 (1.4%) | 24 (5.5%) |
| $10,000 to $12,499 | 6 (1.4%) | 20 (4.6%) |
| $12,500 to $14,999 | 16 (3.6%) | 6 (1.4%) |
| $15,000 to $17,499 | 17 (3.9%) | 25 (5.7%) |
| $17,500 to $19,999 | 9 (2.1%) | 8 (1.8%) |
| $20,000 to $22,499 | 11 (2.5%) | 0 (0.0%) |
| $22,500 to $24,999 | 3 (0.7%) | 11 (2.5%) |
| $25,000 to $29,999 | 6 (1.4%) | 56 (12.8%) |
| $30,000 to $34,999 | 23 (5.2%) | 22 (5.1%) |
| $35,000 to $39,999 | 18 (4.1%) | 23 (5.3%) |
| $40,000 to $44,999 | 36 (8.2%) | 10 (2.3%) |
| $45,000 to $49,999 | 17 (3.9%) | 30 (6.9%) |
| $50,000 to $54,999 | 7 (1.6%) | 49 (11.2%) |
| $55,000 to $64,999 | 55 (12.5%) | 35 (8.0%) |
| $65,000 to $74,999 | 57 (13.0%) | 41 (9.4%) |
| $75,000 to $99,999 | 58 (13.2%) | 23 (5.3%) |
| $100,000+ | 45 (10.2%) | 10 (2.3%) |
| Total | 440 (100.0%) | 436 (100.0%) |
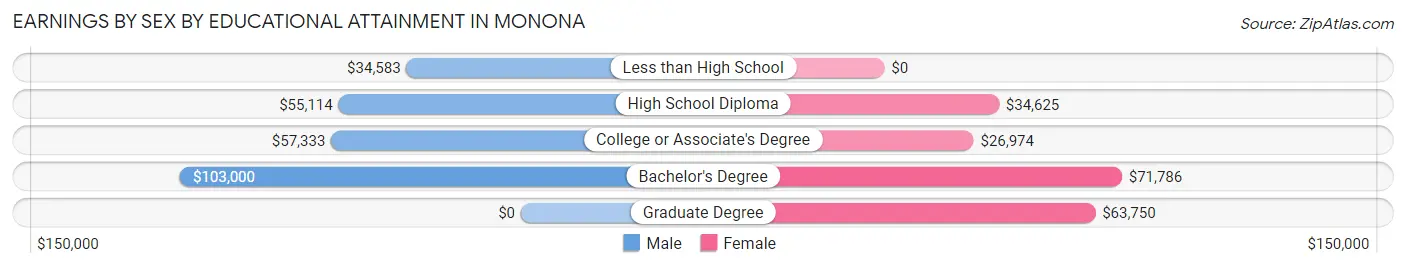
Earnings by Sex by Educational Attainment in Monona
Average earnings in Monona are $56,034 for men and $38,393 for women, a difference of 31.5%. Men with an educational attainment of bachelor's degree enjoy the highest average annual earnings of $103,000, while those with less than high school education earn the least with $34,583. Women with an educational attainment of bachelor's degree earn the most with the average annual earnings of $71,786, while those with college or associate's degree education have the smallest earnings of $26,974.
| Educational Attainment | Male Income | Female Income |
| Less than High School | $34,583 | $0 |
| High School Diploma | $55,114 | $34,625 |
| College or Associate's Degree | $57,333 | $26,974 |
| Bachelor's Degree | $103,000 | $71,786 |
| Graduate Degree | - | - |
| Total | $56,034 | $38,393 |
Family Income in Monona
Family Income Brackets in Monona
According to the Monona family income data, there are 107 families falling into the $100,000 to $149,999 income range, which is the most common income bracket and makes up 26.0% of all families. Conversely, the less than $10,000 income bracket is the least frequent group with only 1 families (0.2%) belonging to this category.
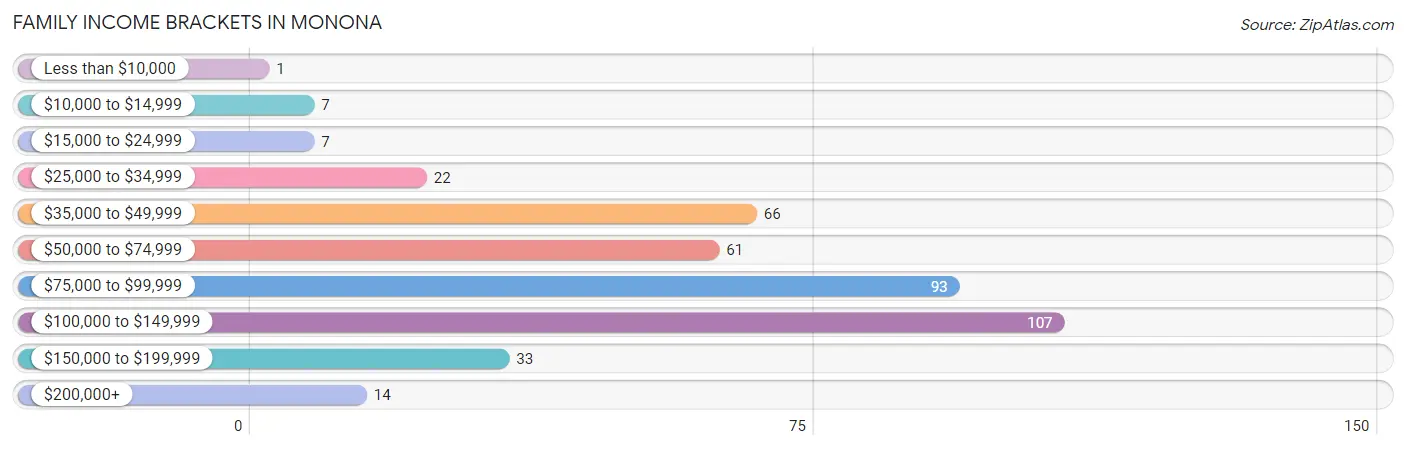
| Income Bracket | # Families | % Families |
| Less than $10,000 | 1 | 0.2% |
| $10,000 to $14,999 | 7 | 1.7% |
| $15,000 to $24,999 | 7 | 1.7% |
| $25,000 to $34,999 | 22 | 5.4% |
| $35,000 to $49,999 | 66 | 16.1% |
| $50,000 to $74,999 | 61 | 14.8% |
| $75,000 to $99,999 | 93 | 22.6% |
| $100,000 to $149,999 | 107 | 26.0% |
| $150,000 to $199,999 | 33 | 8.0% |
| $200,000+ | 14 | 3.4% |
Family Income by Famaliy Size in Monona
4-person families (83 | 20.2%) account for the highest median family income in Monona with $139,688 per family, while 2-person families (218 | 53.0%) have the highest median income of $36,354 per family member.
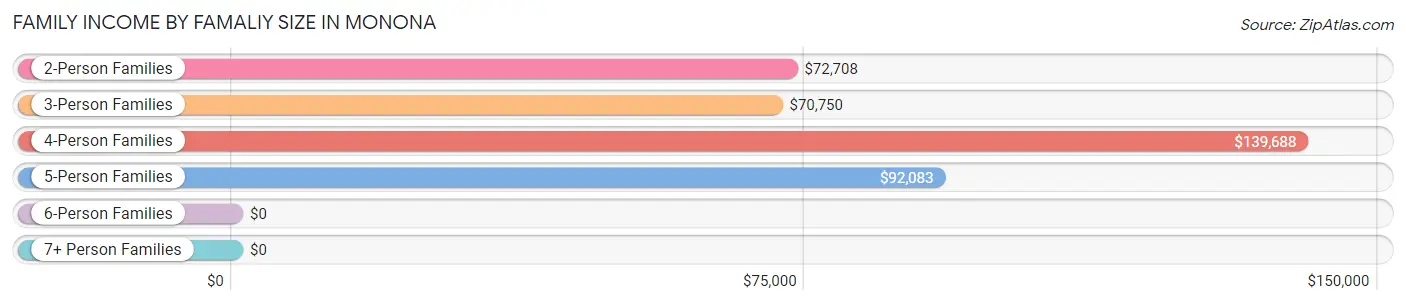
| Income Bracket | # Families | Median Income |
| 2-Person Families | 218 (53.0%) | $72,708 |
| 3-Person Families | 69 (16.8%) | $70,750 |
| 4-Person Families | 83 (20.2%) | $139,688 |
| 5-Person Families | 33 (8.0%) | $92,083 |
| 6-Person Families | 0 (0.0%) | $0 |
| 7+ Person Families | 8 (1.9%) | $0 |
| Total | 411 (100.0%) | $90,250 |
Family Income by Number of Earners in Monona
The median family income in Monona is $90,250, with families comprising 3+ earners (34) having the highest median family income of $130,833, while families with no earners (56) have the lowest median family income of $41,429, accounting for 8.3% and 13.6% of families, respectively.
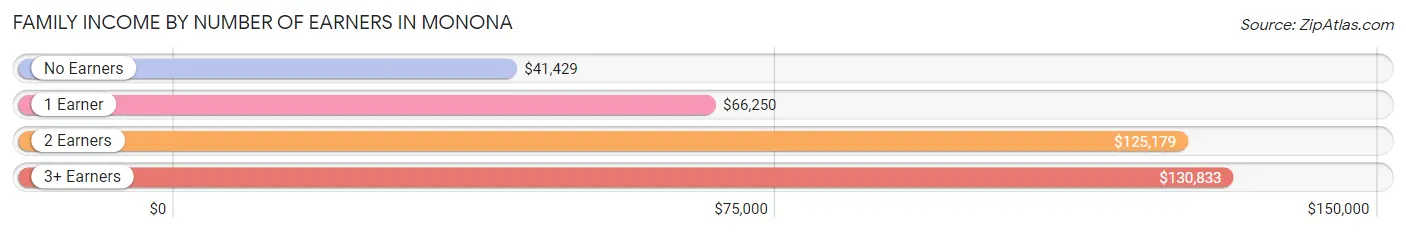
| Number of Earners | # Families | Median Income |
| No Earners | 56 (13.6%) | $41,429 |
| 1 Earner | 96 (23.4%) | $66,250 |
| 2 Earners | 225 (54.7%) | $125,179 |
| 3+ Earners | 34 (8.3%) | $130,833 |
| Total | 411 (100.0%) | $90,250 |
Household Income in Monona
Household Income Brackets in Monona
With 187 households falling in the category, the $35,000 to $49,999 income range is the most frequent in Monona, accounting for 26.1% of all households. In contrast, only 23 households (3.2%) fall into the $200,000+ income bracket, making it the least populous group.
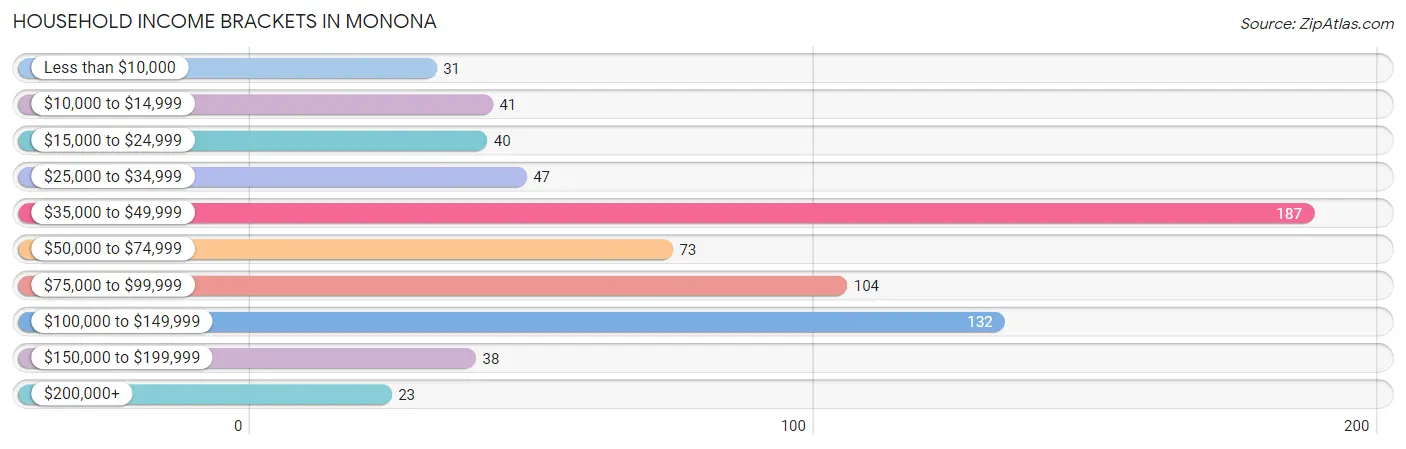
| Income Bracket | # Households | % Households |
| Less than $10,000 | 31 | 4.3% |
| $10,000 to $14,999 | 41 | 5.7% |
| $15,000 to $24,999 | 40 | 5.6% |
| $25,000 to $34,999 | 47 | 6.6% |
| $35,000 to $49,999 | 187 | 26.1% |
| $50,000 to $74,999 | 73 | 10.2% |
| $75,000 to $99,999 | 104 | 14.5% |
| $100,000 to $149,999 | 132 | 18.4% |
| $150,000 to $199,999 | 38 | 5.3% |
| $200,000+ | 23 | 3.2% |
Household Income by Householder Age in Monona
The median household income in Monona is $53,250, with the highest median household income of $93,000 found in the 25 to 44 years age bracket for the primary householder. A total of 200 households (27.9%) fall into this category. Meanwhile, the 15 to 24 years age bracket for the primary householder has the lowest median household income of $0, with 25 households (3.5%) in this group.
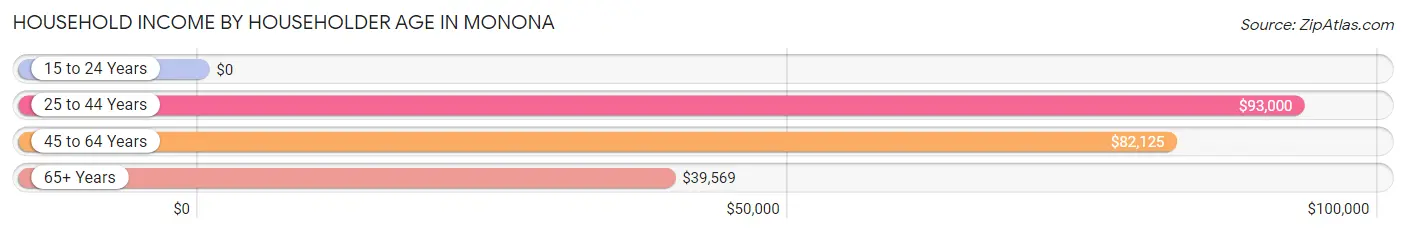
| Income Bracket | # Households | Median Income |
| 15 to 24 Years | 25 (3.5%) | $0 |
| 25 to 44 Years | 200 (27.9%) | $93,000 |
| 45 to 64 Years | 209 (29.2%) | $82,125 |
| 65+ Years | 282 (39.4%) | $39,569 |
| Total | 716 (100.0%) | $53,250 |
Poverty in Monona
Income Below Poverty by Sex and Age in Monona
With 7.0% poverty level for males and 10.3% for females among the residents of Monona, 18 to 24 year old males and 18 to 24 year old females are the most vulnerable to poverty, with 12 males (60.0%) and 16 females (36.4%) in their respective age groups living below the poverty level.
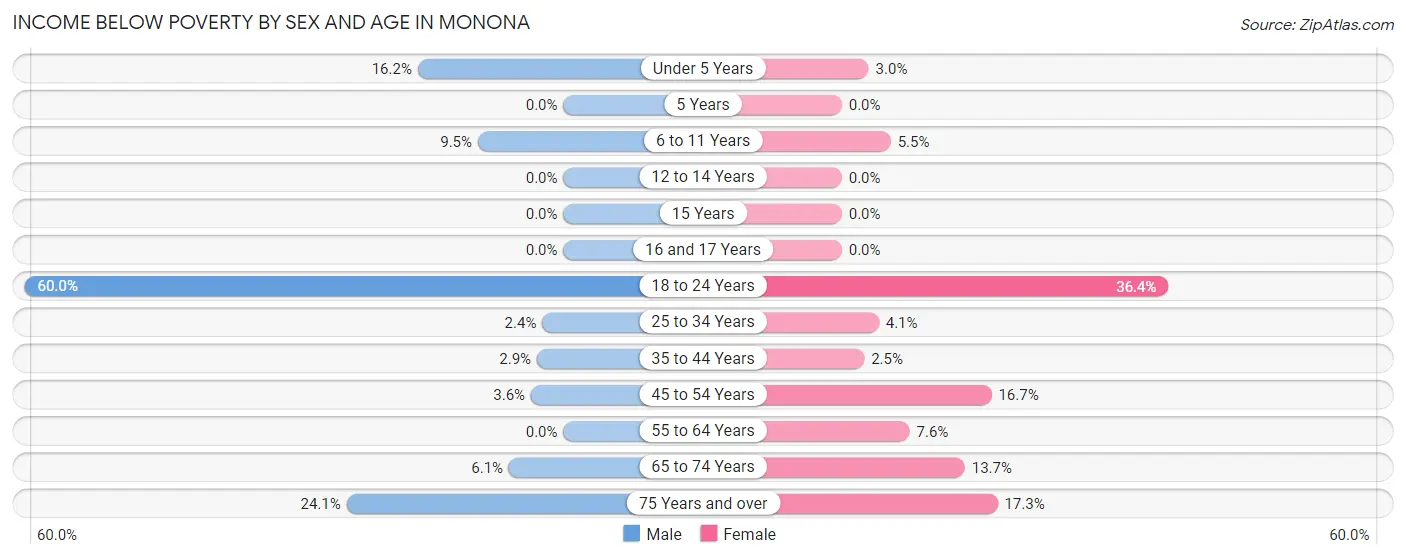
| Age Bracket | Male | Female |
| Under 5 Years | 6 (16.2%) | 2 (3.0%) |
| 5 Years | 0 (0.0%) | 0 (0.0%) |
| 6 to 11 Years | 4 (9.5%) | 3 (5.4%) |
| 12 to 14 Years | 0 (0.0%) | 0 (0.0%) |
| 15 Years | 0 (0.0%) | 0 (0.0%) |
| 16 and 17 Years | 0 (0.0%) | 0 (0.0%) |
| 18 to 24 Years | 12 (60.0%) | 16 (36.4%) |
| 25 to 34 Years | 2 (2.4%) | 4 (4.1%) |
| 35 to 44 Years | 3 (2.9%) | 3 (2.5%) |
| 45 to 54 Years | 3 (3.6%) | 10 (16.7%) |
| 55 to 64 Years | 0 (0.0%) | 8 (7.5%) |
| 65 to 74 Years | 6 (6.1%) | 10 (13.7%) |
| 75 Years and over | 14 (24.1%) | 30 (17.3%) |
| Total | 50 (7.0%) | 86 (10.3%) |
Income Above Poverty by Sex and Age in Monona
According to the poverty statistics in Monona, males aged 5 years and females aged 5 years are the age groups that are most secure financially, with 100.0% of males and 100.0% of females in these age groups living above the poverty line.
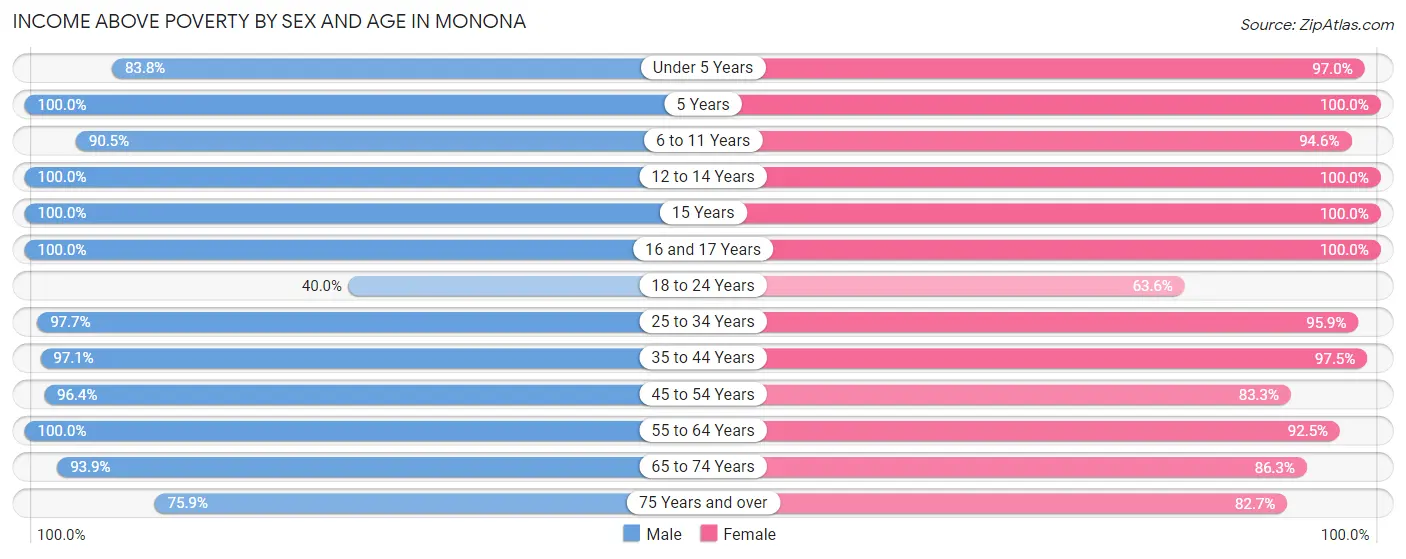
| Age Bracket | Male | Female |
| Under 5 Years | 31 (83.8%) | 65 (97.0%) |
| 5 Years | 19 (100.0%) | 6 (100.0%) |
| 6 to 11 Years | 38 (90.5%) | 52 (94.6%) |
| 12 to 14 Years | 39 (100.0%) | 26 (100.0%) |
| 15 Years | 11 (100.0%) | 2 (100.0%) |
| 16 and 17 Years | 34 (100.0%) | 4 (100.0%) |
| 18 to 24 Years | 8 (40.0%) | 28 (63.6%) |
| 25 to 34 Years | 83 (97.7%) | 93 (95.9%) |
| 35 to 44 Years | 99 (97.1%) | 117 (97.5%) |
| 45 to 54 Years | 80 (96.4%) | 50 (83.3%) |
| 55 to 64 Years | 90 (100.0%) | 98 (92.4%) |
| 65 to 74 Years | 93 (93.9%) | 63 (86.3%) |
| 75 Years and over | 44 (75.9%) | 143 (82.7%) |
| Total | 669 (93.0%) | 747 (89.7%) |
Income Below Poverty Among Married-Couple Families in Monona
The poverty statistics for married-couple families in Monona show that 2.2% or 7 of the total 319 families live below the poverty line. Families with 1 or 2 children have the highest poverty rate of 2.8%, comprising of 3 families. On the other hand, families with 3 or 4 children have the lowest poverty rate of 0.0%, which includes 0 families.
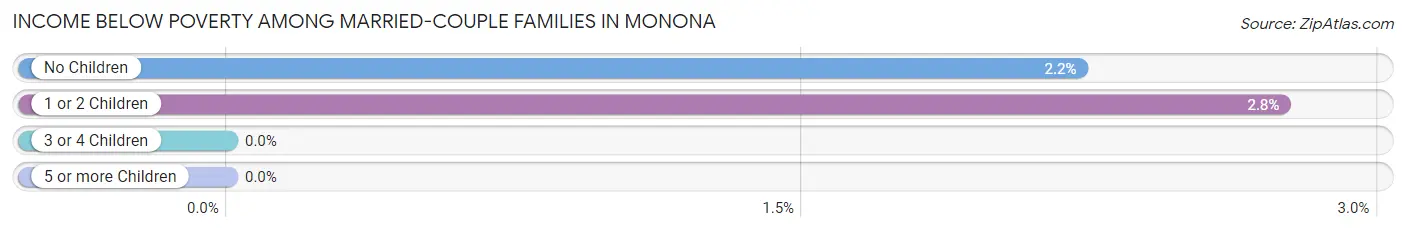
| Children | Above Poverty | Below Poverty |
| No Children | 176 (97.8%) | 4 (2.2%) |
| 1 or 2 Children | 106 (97.3%) | 3 (2.8%) |
| 3 or 4 Children | 30 (100.0%) | 0 (0.0%) |
| 5 or more Children | 0 (0.0%) | 0 (0.0%) |
| Total | 312 (97.8%) | 7 (2.2%) |
Income Below Poverty Among Single-Parent Households in Monona
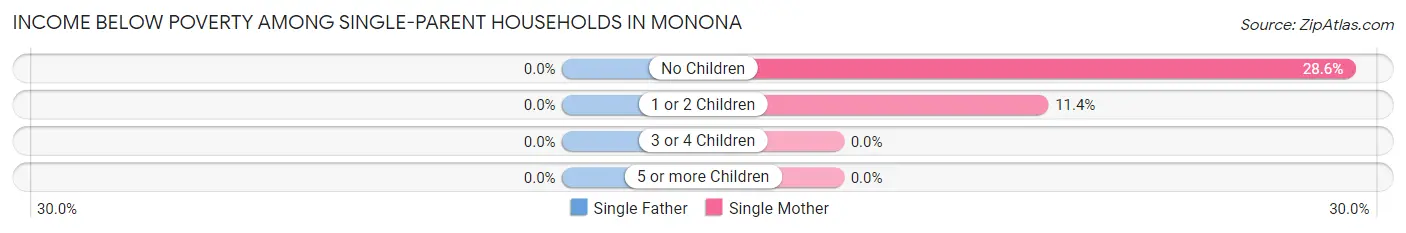
| Children | Single Father | Single Mother |
| No Children | 0 (0.0%) | 4 (28.6%) |
| 1 or 2 Children | 0 (0.0%) | 4 (11.4%) |
| 3 or 4 Children | 0 (0.0%) | 0 (0.0%) |
| 5 or more Children | 0 (0.0%) | 0 (0.0%) |
| Total | 0 (0.0%) | 8 (13.3%) |
Income Below Poverty Among Married-Couple vs Single-Parent Households in Monona
The poverty data for Monona shows that 7 of the married-couple family households (2.2%) and 8 of the single-parent households (8.7%) are living below the poverty level. Within the married-couple family households, those with 1 or 2 children have the highest poverty rate, with 3 households (2.8%) falling below the poverty line. Among the single-parent households, those with no children have the highest poverty rate, with 4 household (12.1%) living below poverty.
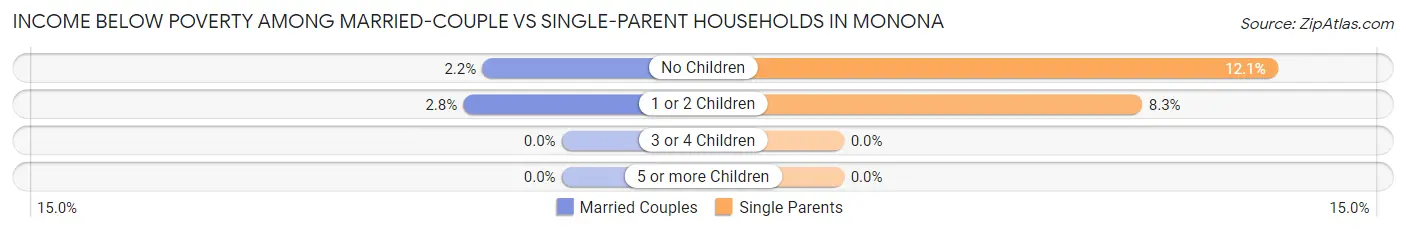
| Children | Married-Couple Families | Single-Parent Households |
| No Children | 4 (2.2%) | 4 (12.1%) |
| 1 or 2 Children | 3 (2.8%) | 4 (8.3%) |
| 3 or 4 Children | 0 (0.0%) | 0 (0.0%) |
| 5 or more Children | 0 (0.0%) | 0 (0.0%) |
| Total | 7 (2.2%) | 8 (8.7%) |
Race in Monona
The most populous races in Monona are White / Caucasian (1,499 | 95.4%), Two or more Races (39 | 2.5%), and Hispanic or Latino (34 | 2.2%).
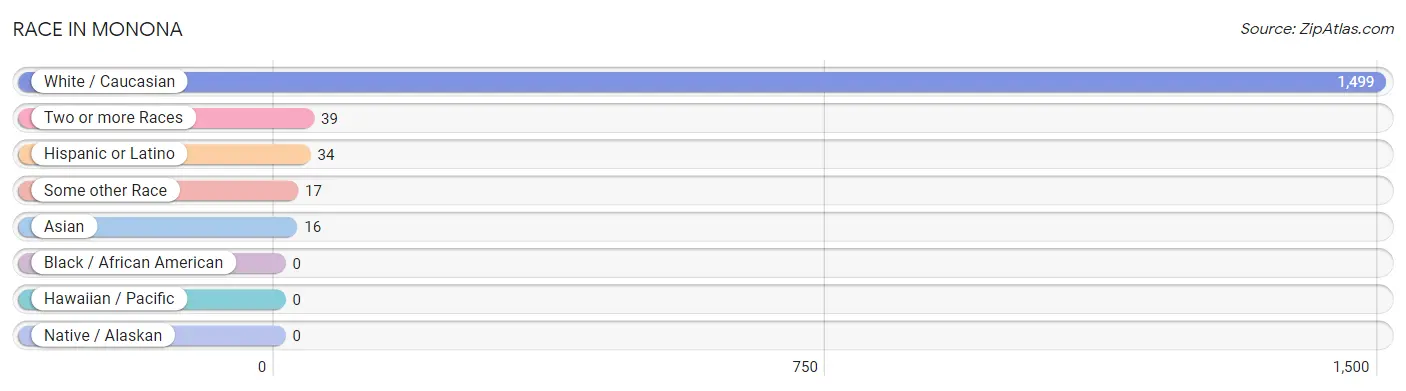
| Race | # Population | % Population |
| Asian | 16 | 1.0% |
| Black / African American | 0 | 0.0% |
| Hawaiian / Pacific | 0 | 0.0% |
| Hispanic or Latino | 34 | 2.2% |
| Native / Alaskan | 0 | 0.0% |
| White / Caucasian | 1,499 | 95.4% |
| Two or more Races | 39 | 2.5% |
| Some other Race | 17 | 1.1% |
| Total | 1,571 | 100.0% |
Ancestry in Monona
The most populous ancestries reported in Monona are German (763 | 48.6%), Norwegian (185 | 11.8%), Irish (179 | 11.4%), American (98 | 6.2%), and Czech (73 | 4.6%), together accounting for 82.6% of all Monona residents.
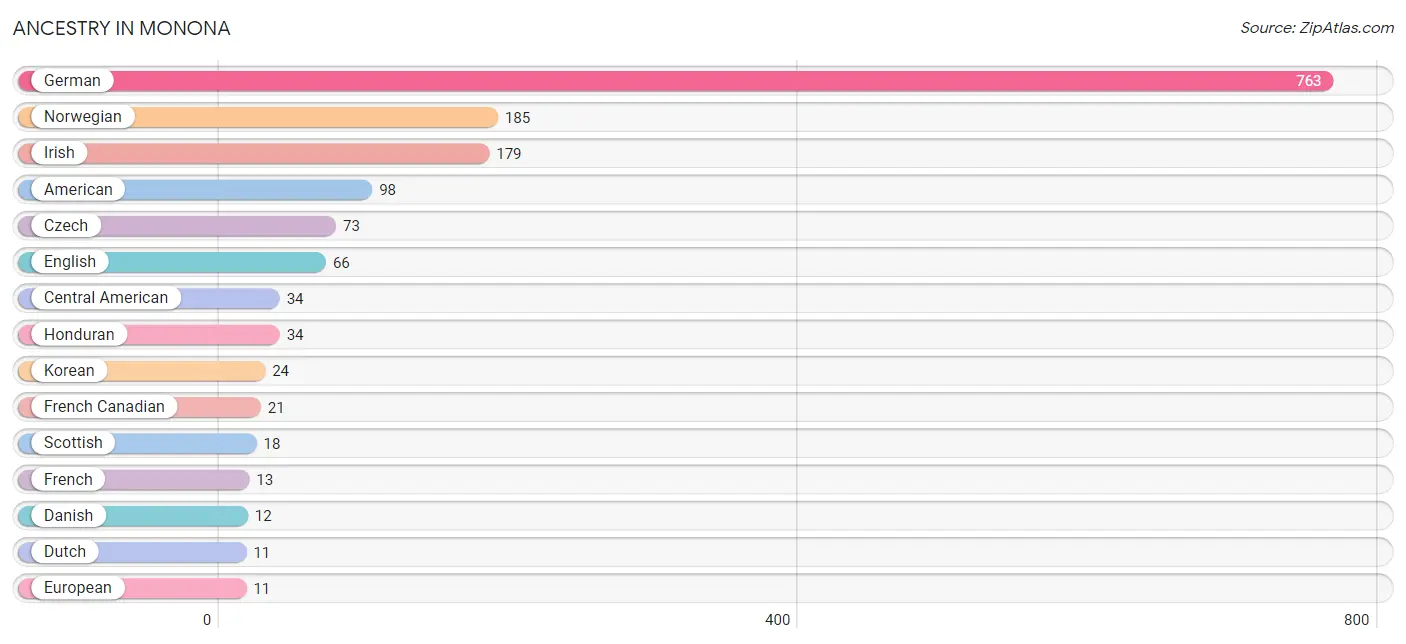
| Ancestry | # Population | % Population |
| American | 98 | 6.2% |
| Central American | 34 | 2.2% |
| Chippewa | 1 | 0.1% |
| Czech | 73 | 4.6% |
| Czechoslovakian | 10 | 0.6% |
| Danish | 12 | 0.8% |
| Dutch | 11 | 0.7% |
| English | 66 | 4.2% |
| European | 11 | 0.7% |
| French | 13 | 0.8% |
| French Canadian | 21 | 1.3% |
| German | 763 | 48.6% |
| Honduran | 34 | 2.2% |
| Irish | 179 | 11.4% |
| Italian | 7 | 0.4% |
| Korean | 24 | 1.5% |
| Lithuanian | 3 | 0.2% |
| Norwegian | 185 | 11.8% |
| Polish | 7 | 0.4% |
| Scandinavian | 10 | 0.6% |
| Scotch-Irish | 7 | 0.4% |
| Scottish | 18 | 1.1% |
| Swedish | 8 | 0.5% |
| Swiss | 6 | 0.4% |
| Welsh | 2 | 0.1% | View All 25 Rows |
Immigrants in Monona
The most numerous immigrant groups reported in Monona came from Central America (17 | 1.1%), Honduras (17 | 1.1%), Latin America (17 | 1.1%), Asia (16 | 1.0%), and Philippines (16 | 1.0%), together accounting for 5.3% of all Monona residents.
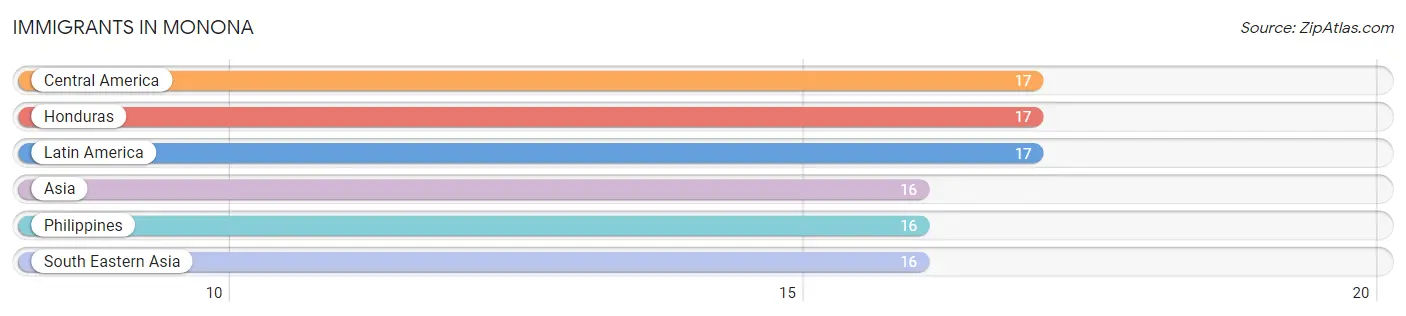
| Immigration Origin | # Population | % Population |
| Asia | 16 | 1.0% |
| Central America | 17 | 1.1% |
| Honduras | 17 | 1.1% |
| Latin America | 17 | 1.1% |
| Philippines | 16 | 1.0% |
| South Eastern Asia | 16 | 1.0% | View All 6 Rows |
Sex and Age in Monona
Sex and Age in Monona
The most populous age groups in Monona are 65 to 69 Years (76 | 10.3%) for men and 85 Years and over (84 | 10.1%) for women.
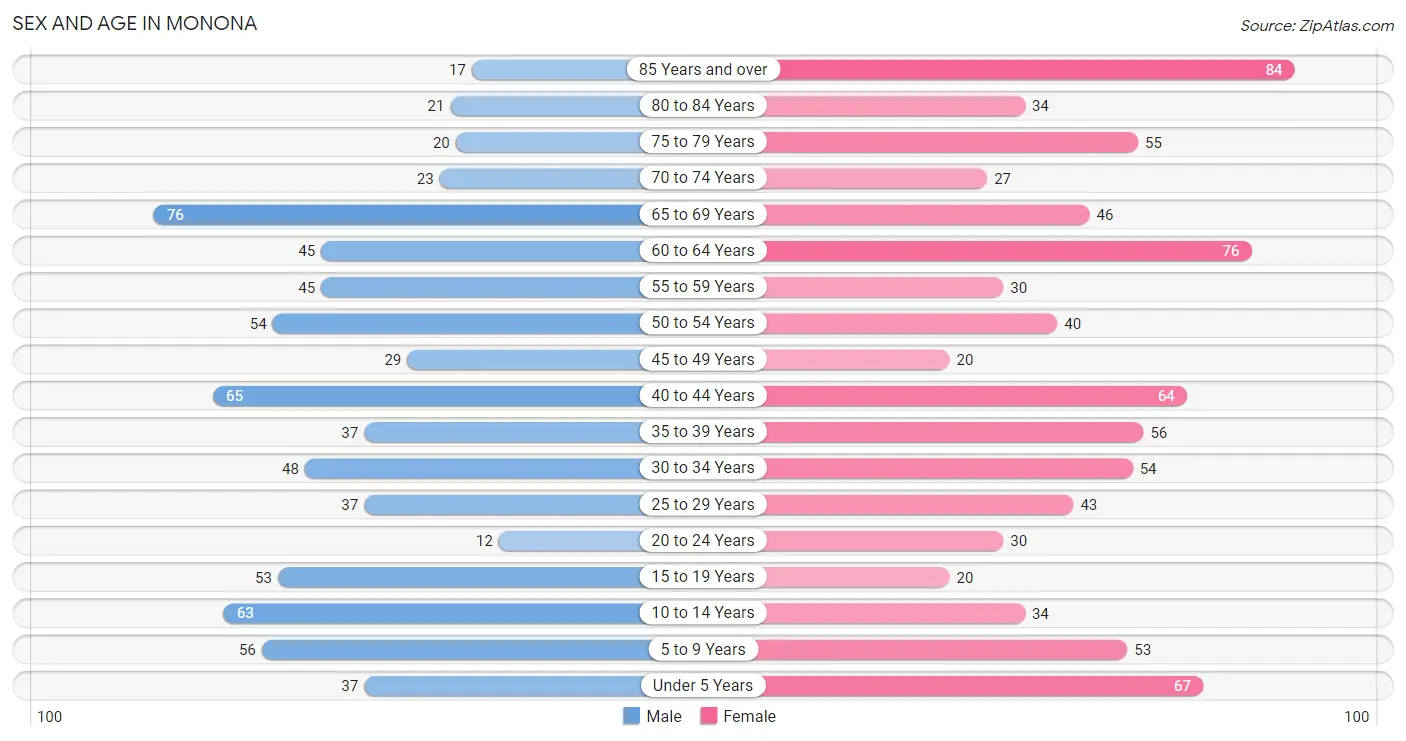
| Age Bracket | Male | Female |
| Under 5 Years | 37 (5.0%) | 67 (8.0%) |
| 5 to 9 Years | 56 (7.6%) | 53 (6.4%) |
| 10 to 14 Years | 63 (8.5%) | 34 (4.1%) |
| 15 to 19 Years | 53 (7.2%) | 20 (2.4%) |
| 20 to 24 Years | 12 (1.6%) | 30 (3.6%) |
| 25 to 29 Years | 37 (5.0%) | 43 (5.2%) |
| 30 to 34 Years | 48 (6.5%) | 54 (6.5%) |
| 35 to 39 Years | 37 (5.0%) | 56 (6.7%) |
| 40 to 44 Years | 65 (8.8%) | 64 (7.7%) |
| 45 to 49 Years | 29 (3.9%) | 20 (2.4%) |
| 50 to 54 Years | 54 (7.3%) | 40 (4.8%) |
| 55 to 59 Years | 45 (6.1%) | 30 (3.6%) |
| 60 to 64 Years | 45 (6.1%) | 76 (9.1%) |
| 65 to 69 Years | 76 (10.3%) | 46 (5.5%) |
| 70 to 74 Years | 23 (3.1%) | 27 (3.2%) |
| 75 to 79 Years | 20 (2.7%) | 55 (6.6%) |
| 80 to 84 Years | 21 (2.9%) | 34 (4.1%) |
| 85 Years and over | 17 (2.3%) | 84 (10.1%) |
| Total | 738 (100.0%) | 833 (100.0%) |
Families and Households in Monona
Median Family Size in Monona
The median family size in Monona is 2.83 persons per family, with single female/mother families (60 | 14.6%) accounting for the largest median family size of 2.9 persons per family. On the other hand, single male/father families (32 | 7.8%) represent the smallest median family size with 2.41 persons per family.
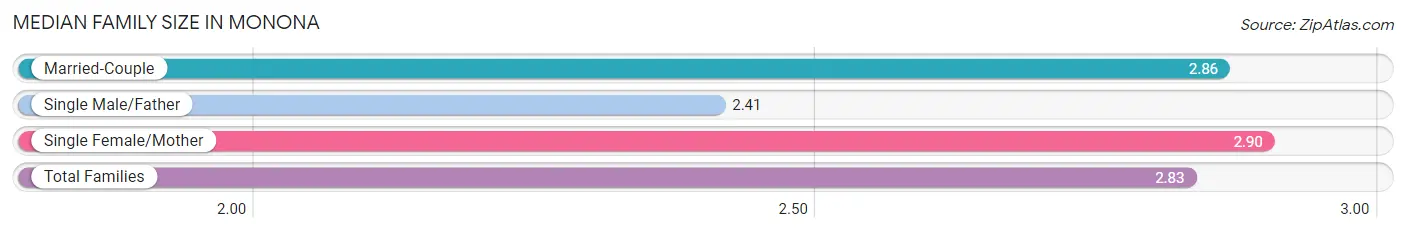
| Family Type | # Families | Family Size |
| Married-Couple | 319 (77.6%) | 2.86 |
| Single Male/Father | 32 (7.8%) | 2.41 |
| Single Female/Mother | 60 (14.6%) | 2.90 |
| Total Families | 411 (100.0%) | 2.83 |
Median Household Size in Monona
The median household size in Monona is 2.19 persons per household, with single male/father households (32 | 4.5%) accounting for the largest median household size of 3.28 persons per household. non-family households (305 | 42.6%) represent the smallest median household size with 1.18 persons per household.
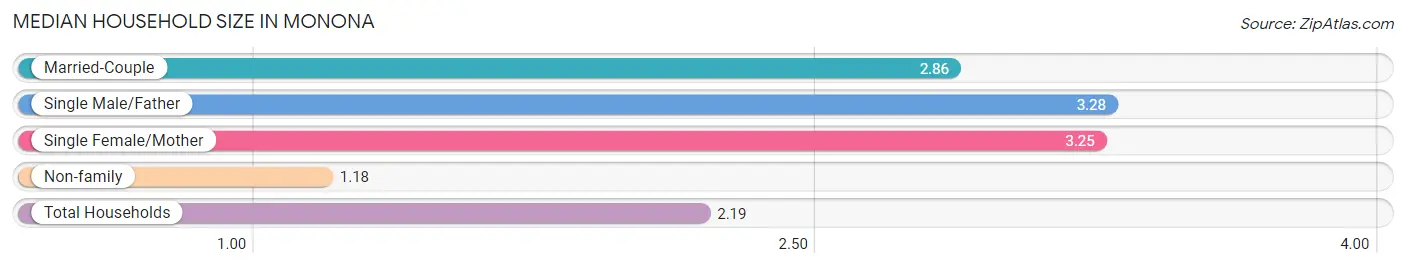
| Household Type | # Households | Household Size |
| Married-Couple | 319 (44.6%) | 2.86 |
| Single Male/Father | 32 (4.5%) | 3.28 |
| Single Female/Mother | 60 (8.4%) | 3.25 |
| Non-family | 305 (42.6%) | 1.18 |
| Total Households | 716 (100.0%) | 2.19 |
Household Size by Marriage Status in Monona
Out of a total of 716 households in Monona, 411 (57.4%) are family households, while 305 (42.6%) are nonfamily households. The most numerous type of family households are 2-person households, comprising 194, and the most common type of nonfamily households are 1-person households, comprising 261.
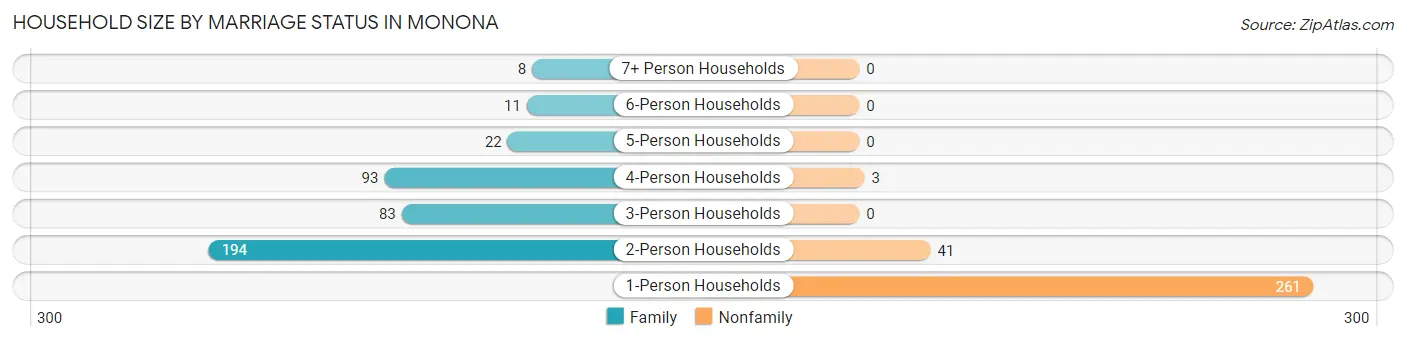
| Household Size | Family Households | Nonfamily Households |
| 1-Person Households | - | 261 (36.4%) |
| 2-Person Households | 194 (27.1%) | 41 (5.7%) |
| 3-Person Households | 83 (11.6%) | 0 (0.0%) |
| 4-Person Households | 93 (13.0%) | 3 (0.4%) |
| 5-Person Households | 22 (3.1%) | 0 (0.0%) |
| 6-Person Households | 11 (1.5%) | 0 (0.0%) |
| 7+ Person Households | 8 (1.1%) | 0 (0.0%) |
| Total | 411 (57.4%) | 305 (42.6%) |
Female Fertility in Monona
Fertility by Age in Monona
Average fertility rate in Monona is 86.0 births per 1,000 women. Women in the age bracket of 20 to 34 years have the highest fertility rate with 102.0 births per 1,000 women. Women in the age bracket of 20 to 34 years acount for 52.0% of all women with births.
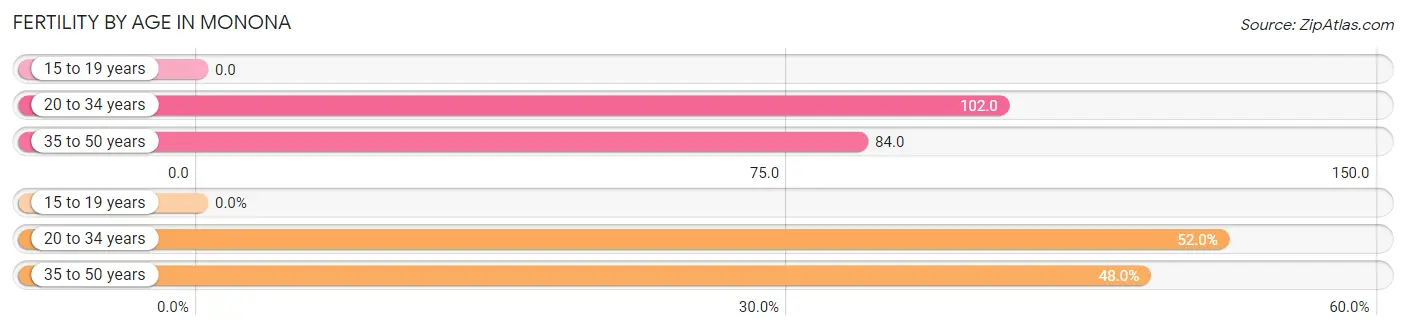
| Age Bracket | Women with Births | Births / 1,000 Women |
| 15 to 19 years | 0 (0.0%) | 0.0 |
| 20 to 34 years | 13 (52.0%) | 102.0 |
| 35 to 50 years | 12 (48.0%) | 84.0 |
| Total | 25 (100.0%) | 86.0 |
Fertility by Age by Marriage Status in Monona
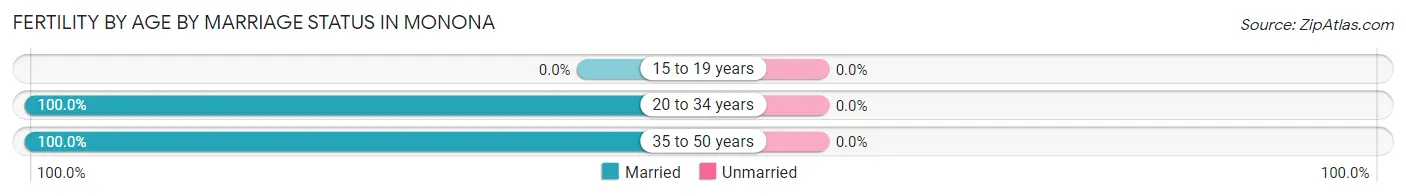
| Age Bracket | Married | Unmarried |
| 15 to 19 years | 0 (0.0%) | 0 (0.0%) |
| 20 to 34 years | 13 (100.0%) | 0 (0.0%) |
| 35 to 50 years | 12 (100.0%) | 0 (0.0%) |
| Total | 25 (100.0%) | 0 (0.0%) |
Fertility by Education in Monona
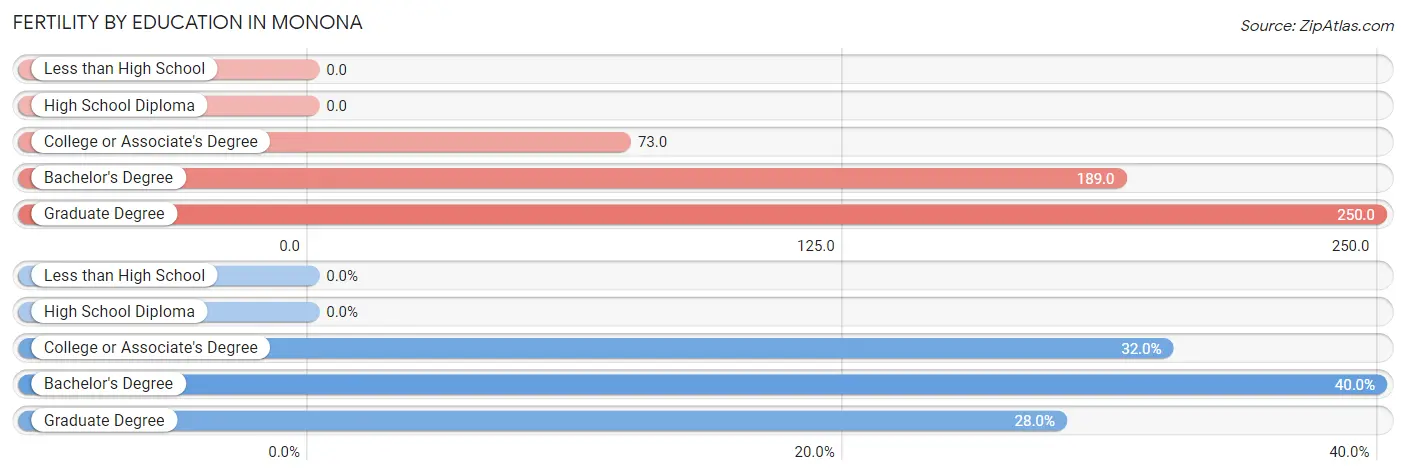
| Educational Attainment | Women with Births | Births / 1,000 Women |
| Less than High School | 0 (0.0%) | 0.0 |
| High School Diploma | 0 (0.0%) | 0.0 |
| College or Associate's Degree | 8 (32.0%) | 73.0 |
| Bachelor's Degree | 10 (40.0%) | 189.0 |
| Graduate Degree | 7 (28.0%) | 250.0 |
| Total | 25 (100.0%) | 86.0 |
Fertility by Education by Marriage Status in Monona
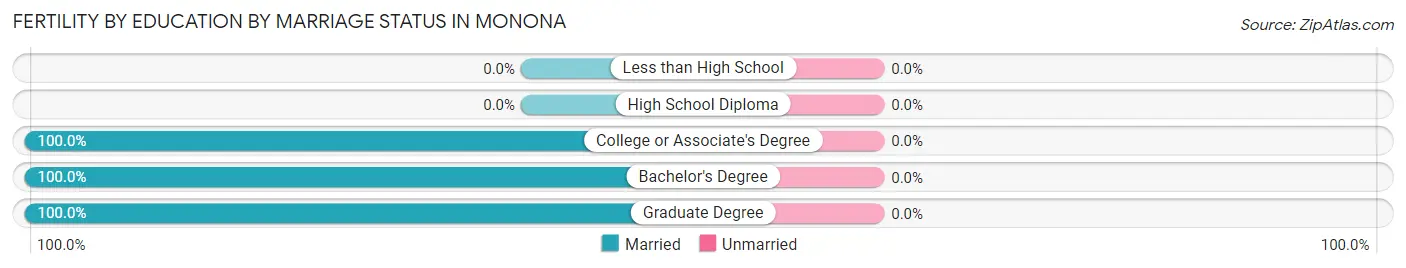
| Educational Attainment | Married | Unmarried |
| Less than High School | 0 (0.0%) | 0 (0.0%) |
| High School Diploma | 0 (0.0%) | 0 (0.0%) |
| College or Associate's Degree | 8 (100.0%) | 0 (0.0%) |
| Bachelor's Degree | 10 (100.0%) | 0 (0.0%) |
| Graduate Degree | 7 (100.0%) | 0 (0.0%) |
| Total | 25 (100.0%) | 0 (0.0%) |
Employment Characteristics in Monona
Employment by Class of Employer in Monona
Among the 824 employed individuals in Monona, private company employees (631 | 76.6%), local government employees (64 | 7.8%), and not-for-profit organizations (56 | 6.8%) make up the most common classes of employment.
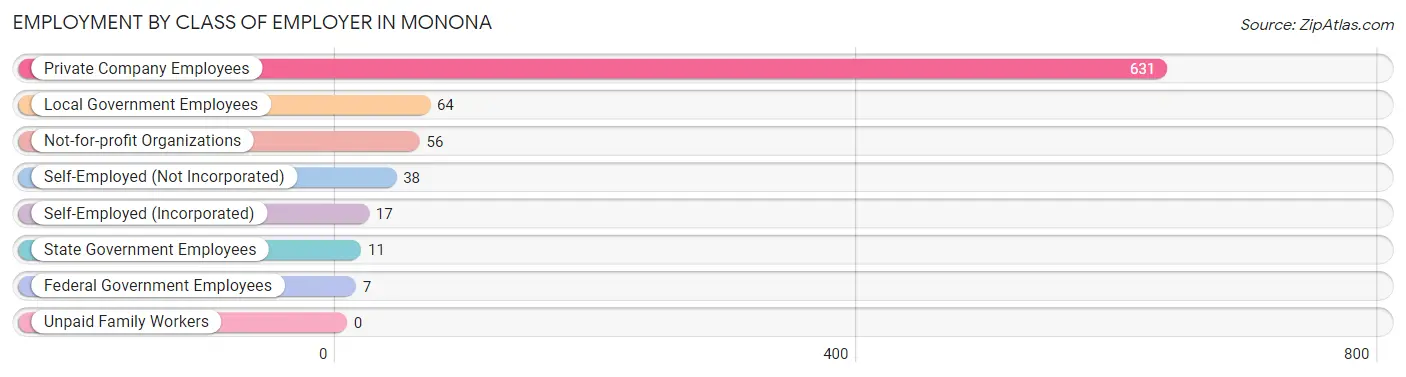
| Employer Class | # Employees | % Employees |
| Private Company Employees | 631 | 76.6% |
| Self-Employed (Incorporated) | 17 | 2.1% |
| Self-Employed (Not Incorporated) | 38 | 4.6% |
| Not-for-profit Organizations | 56 | 6.8% |
| Local Government Employees | 64 | 7.8% |
| State Government Employees | 11 | 1.3% |
| Federal Government Employees | 7 | 0.9% |
| Unpaid Family Workers | 0 | 0.0% |
| Total | 824 | 100.0% |
Employment Status by Age in Monona
According to the labor force statistics for Monona, out of the total population over 16 years of age (1,248), 68.5% or 855 individuals are in the labor force, with 1.3% or 11 of them unemployed. The age group with the highest labor force participation rate is 20 to 24 years, with 100.0% or 42 individuals in the labor force. Within the labor force, the 35 to 44 years age range has the highest percentage of unemployed individuals, with 5.0% or 11 of them being unemployed.
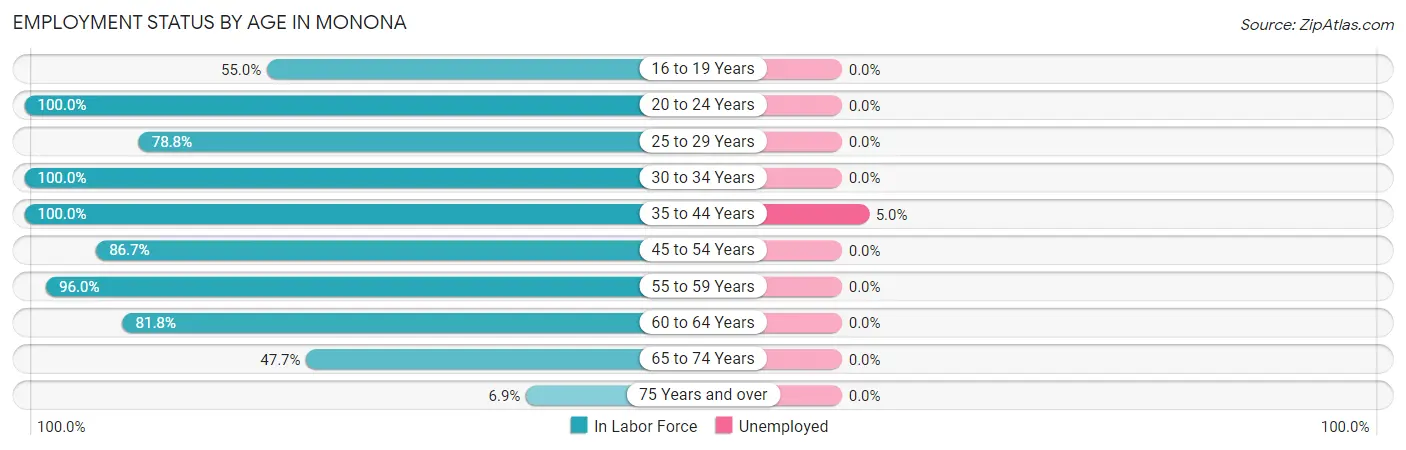
| Age Bracket | In Labor Force | Unemployed |
| 16 to 19 Years | 33 (55.0%) | 0 (0.0%) |
| 20 to 24 Years | 42 (100.0%) | 0 (0.0%) |
| 25 to 29 Years | 63 (78.8%) | 0 (0.0%) |
| 30 to 34 Years | 102 (100.0%) | 0 (0.0%) |
| 35 to 44 Years | 222 (100.0%) | 11 (5.0%) |
| 45 to 54 Years | 124 (86.7%) | 0 (0.0%) |
| 55 to 59 Years | 72 (96.0%) | 0 (0.0%) |
| 60 to 64 Years | 99 (81.8%) | 0 (0.0%) |
| 65 to 74 Years | 82 (47.7%) | 0 (0.0%) |
| 75 Years and over | 16 (6.9%) | 0 (0.0%) |
| Total | 855 (68.5%) | 11 (1.3%) |
Employment Status by Educational Attainment in Monona
According to labor force statistics for Monona, 91.8% of individuals (682) out of the total population between 25 and 64 years of age (743) are in the labor force, with 1.6% or 11 of them being unemployed. The group with the highest labor force participation rate are those with the educational attainment of less than high school, with 100.0% or 27 individuals in the labor force. Within the labor force, individuals with college / associate degree education have the highest percentage of unemployment, with 4.4% or 11 of them being unemployed.
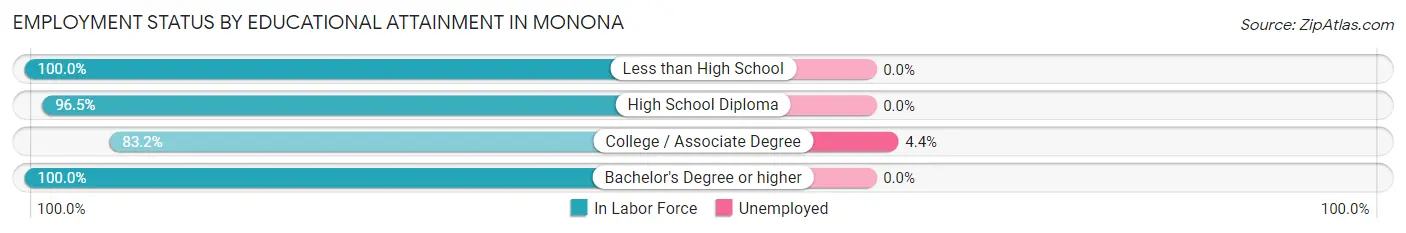
| Educational Attainment | In Labor Force | Unemployed |
| Less than High School | 27 (100.0%) | 0 (0.0%) |
| High School Diploma | 276 (96.5%) | 0 (0.0%) |
| College / Associate Degree | 252 (83.2%) | 13 (4.4%) |
| Bachelor's Degree or higher | 127 (100.0%) | 0 (0.0%) |
| Total | 682 (91.8%) | 12 (1.6%) |
Employment Occupations by Sex in Monona
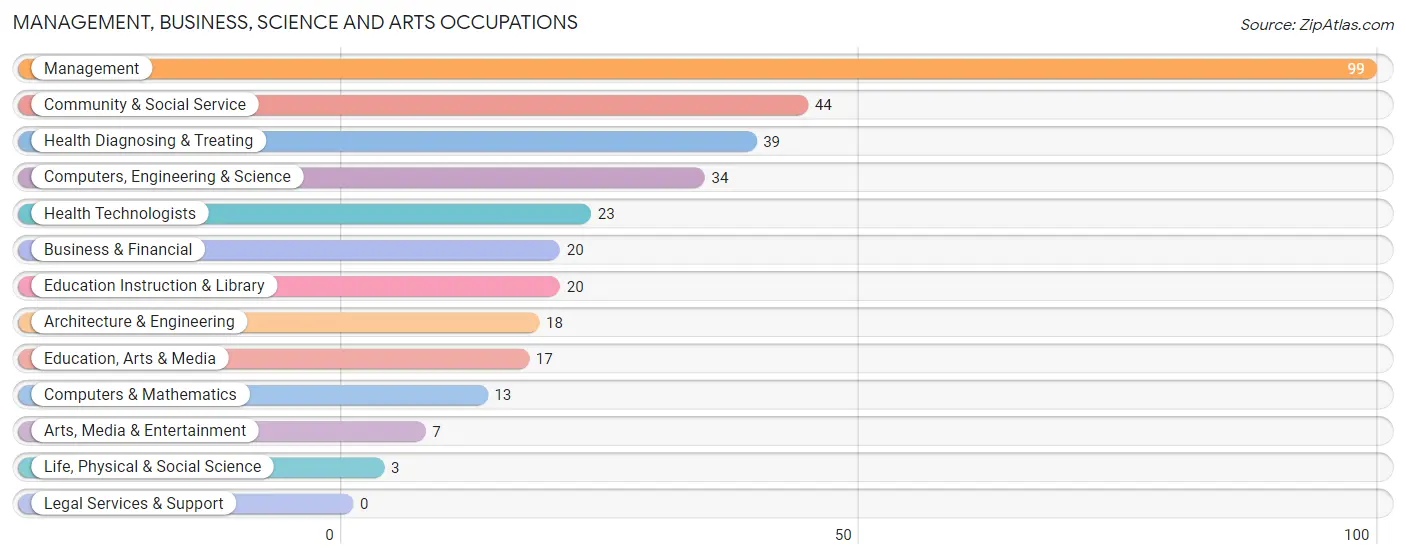
Management, Business, Science and Arts Occupations
The most common Management, Business, Science and Arts occupations in Monona are Management (99 | 11.7%), Community & Social Service (44 | 5.2%), Health Diagnosing & Treating (39 | 4.6%), Computers, Engineering & Science (34 | 4.0%), and Health Technologists (23 | 2.7%).
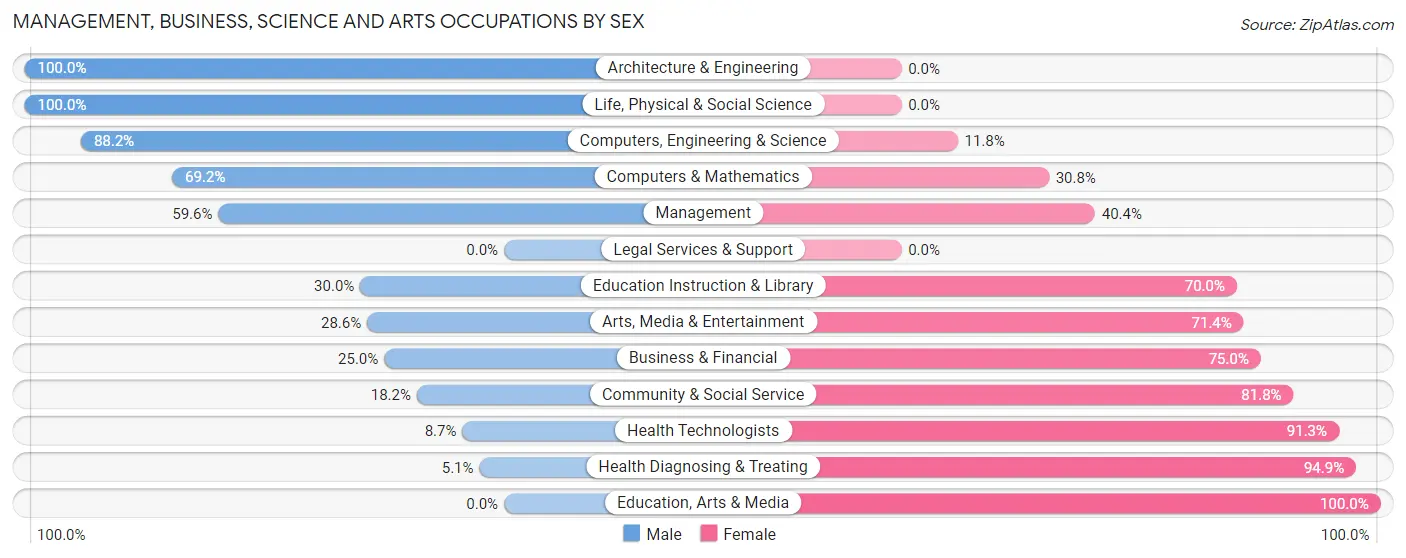
Management, Business, Science and Arts Occupations by Sex
Within the Management, Business, Science and Arts occupations in Monona, the most male-oriented occupations are Architecture & Engineering (100.0%), Life, Physical & Social Science (100.0%), and Computers, Engineering & Science (88.2%), while the most female-oriented occupations are Education, Arts & Media (100.0%), Health Diagnosing & Treating (94.9%), and Health Technologists (91.3%).
| Occupation | Male | Female |
| Management | 59 (59.6%) | 40 (40.4%) |
| Business & Financial | 5 (25.0%) | 15 (75.0%) |
| Computers, Engineering & Science | 30 (88.2%) | 4 (11.8%) |
| Computers & Mathematics | 9 (69.2%) | 4 (30.8%) |
| Architecture & Engineering | 18 (100.0%) | 0 (0.0%) |
| Life, Physical & Social Science | 3 (100.0%) | 0 (0.0%) |
| Community & Social Service | 8 (18.2%) | 36 (81.8%) |
| Education, Arts & Media | 0 (0.0%) | 17 (100.0%) |
| Legal Services & Support | 0 (0.0%) | 0 (0.0%) |
| Education Instruction & Library | 6 (30.0%) | 14 (70.0%) |
| Arts, Media & Entertainment | 2 (28.6%) | 5 (71.4%) |
| Health Diagnosing & Treating | 2 (5.1%) | 37 (94.9%) |
| Health Technologists | 2 (8.7%) | 21 (91.3%) |
| Total (Category) | 104 (44.1%) | 132 (55.9%) |
| Total (Overall) | 427 (50.6%) | 417 (49.4%) |
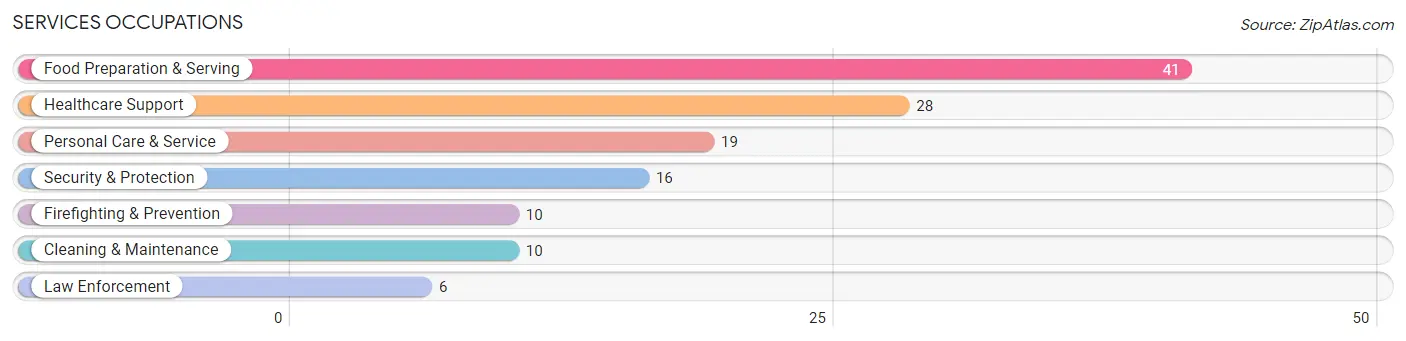
Services Occupations
The most common Services occupations in Monona are Food Preparation & Serving (41 | 4.9%), Healthcare Support (28 | 3.3%), Personal Care & Service (19 | 2.2%), Security & Protection (16 | 1.9%), and Firefighting & Prevention (10 | 1.2%).
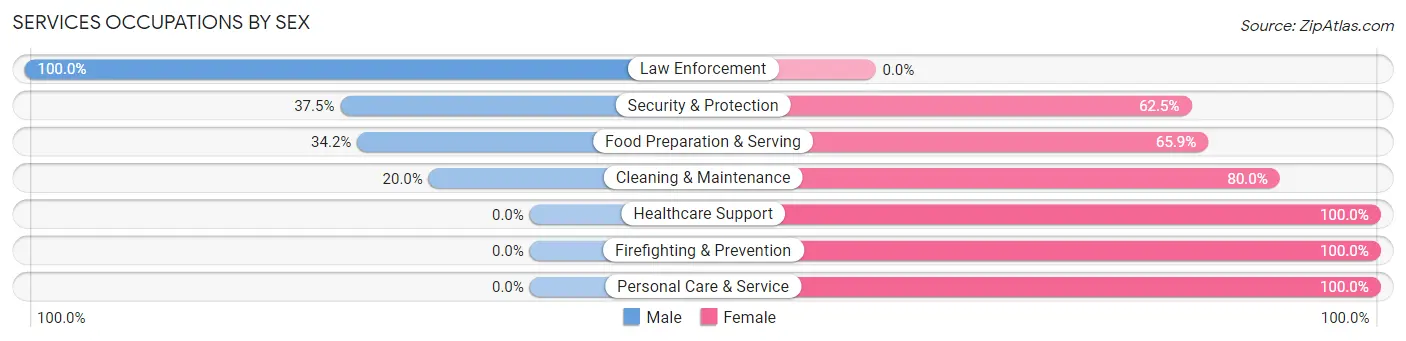
Services Occupations by Sex
Within the Services occupations in Monona, the most male-oriented occupations are Law Enforcement (100.0%), Security & Protection (37.5%), and Food Preparation & Serving (34.2%), while the most female-oriented occupations are Healthcare Support (100.0%), Firefighting & Prevention (100.0%), and Personal Care & Service (100.0%).
| Occupation | Male | Female |
| Healthcare Support | 0 (0.0%) | 28 (100.0%) |
| Security & Protection | 6 (37.5%) | 10 (62.5%) |
| Firefighting & Prevention | 0 (0.0%) | 10 (100.0%) |
| Law Enforcement | 6 (100.0%) | 0 (0.0%) |
| Food Preparation & Serving | 14 (34.2%) | 27 (65.8%) |
| Cleaning & Maintenance | 2 (20.0%) | 8 (80.0%) |
| Personal Care & Service | 0 (0.0%) | 19 (100.0%) |
| Total (Category) | 22 (19.3%) | 92 (80.7%) |
| Total (Overall) | 427 (50.6%) | 417 (49.4%) |
Sales and Office Occupations
The most common Sales and Office occupations in Monona are Office & Administration (117 | 13.9%), and Sales & Related (91 | 10.8%).
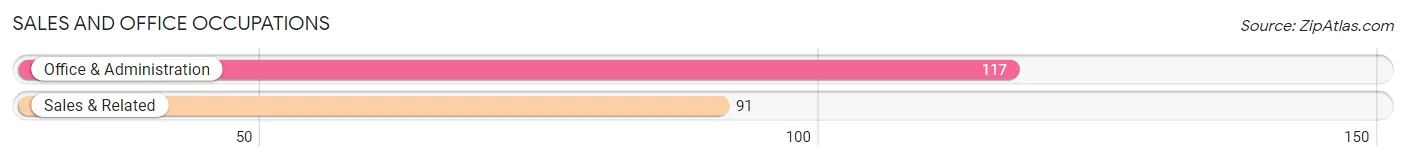
Sales and Office Occupations by Sex
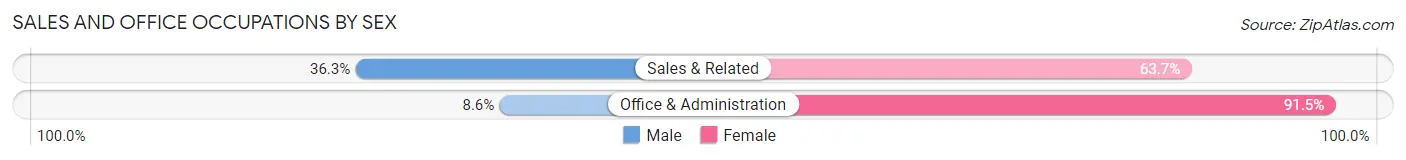
| Occupation | Male | Female |
| Sales & Related | 33 (36.3%) | 58 (63.7%) |
| Office & Administration | 10 (8.6%) | 107 (91.4%) |
| Total (Category) | 43 (20.7%) | 165 (79.3%) |
| Total (Overall) | 427 (50.6%) | 417 (49.4%) |
Natural Resources, Construction and Maintenance Occupations
The most common Natural Resources, Construction and Maintenance occupations in Monona are Installation, Maintenance & Repair (46 | 5.4%), Construction & Extraction (28 | 3.3%), and Farming, Fishing & Forestry (11 | 1.3%).
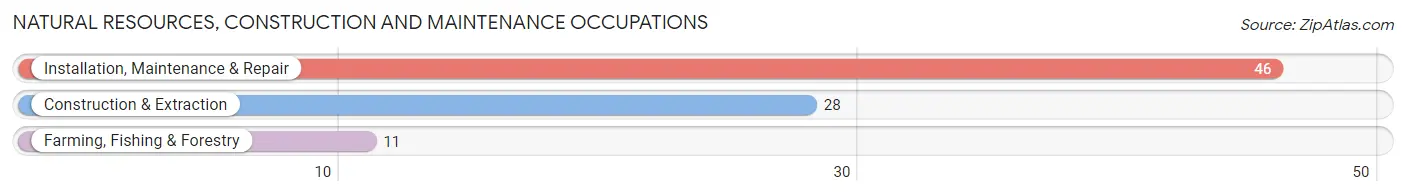
Natural Resources, Construction and Maintenance Occupations by Sex
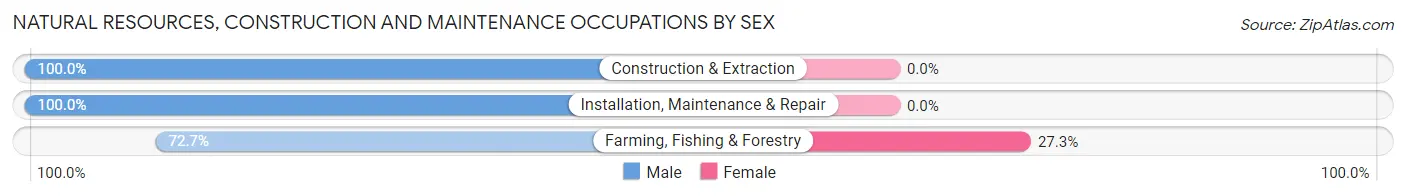
| Occupation | Male | Female |
| Farming, Fishing & Forestry | 8 (72.7%) | 3 (27.3%) |
| Construction & Extraction | 28 (100.0%) | 0 (0.0%) |
| Installation, Maintenance & Repair | 46 (100.0%) | 0 (0.0%) |
| Total (Category) | 82 (96.5%) | 3 (3.5%) |
| Total (Overall) | 427 (50.6%) | 417 (49.4%) |
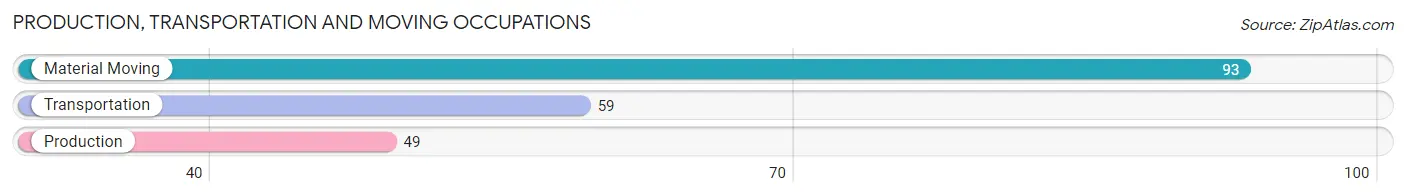
Production, Transportation and Moving Occupations
The most common Production, Transportation and Moving occupations in Monona are Material Moving (93 | 11.0%), Transportation (59 | 7.0%), and Production (49 | 5.8%).
Production, Transportation and Moving Occupations by Sex
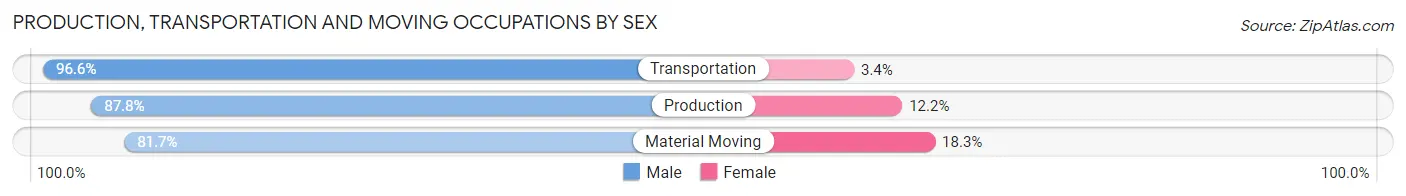
| Occupation | Male | Female |
| Production | 43 (87.8%) | 6 (12.2%) |
| Transportation | 57 (96.6%) | 2 (3.4%) |
| Material Moving | 76 (81.7%) | 17 (18.3%) |
| Total (Category) | 176 (87.6%) | 25 (12.4%) |
| Total (Overall) | 427 (50.6%) | 417 (49.4%) |
Employment Industries by Sex in Monona
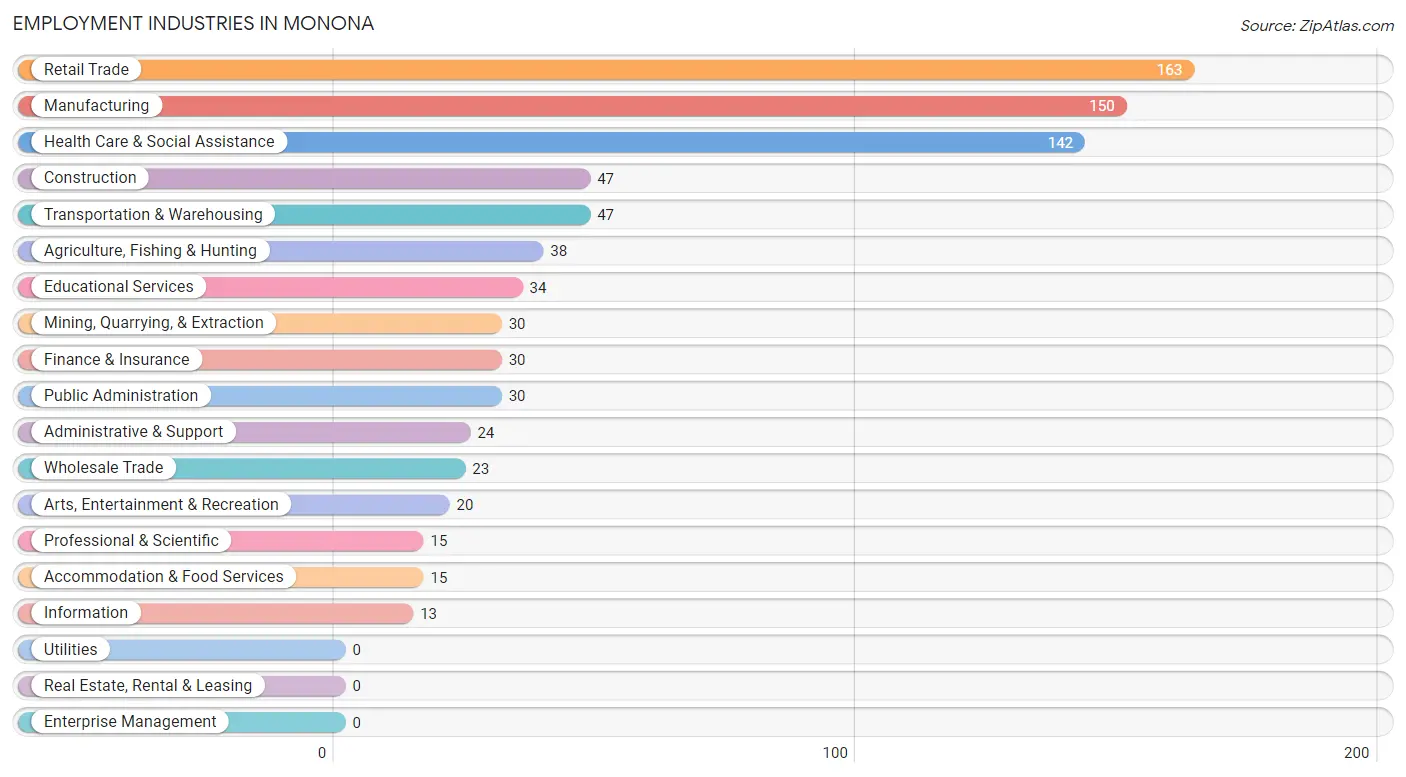
Employment Industries in Monona
The major employment industries in Monona include Retail Trade (163 | 19.3%), Manufacturing (150 | 17.8%), Health Care & Social Assistance (142 | 16.8%), Construction (47 | 5.6%), and Transportation & Warehousing (47 | 5.6%).
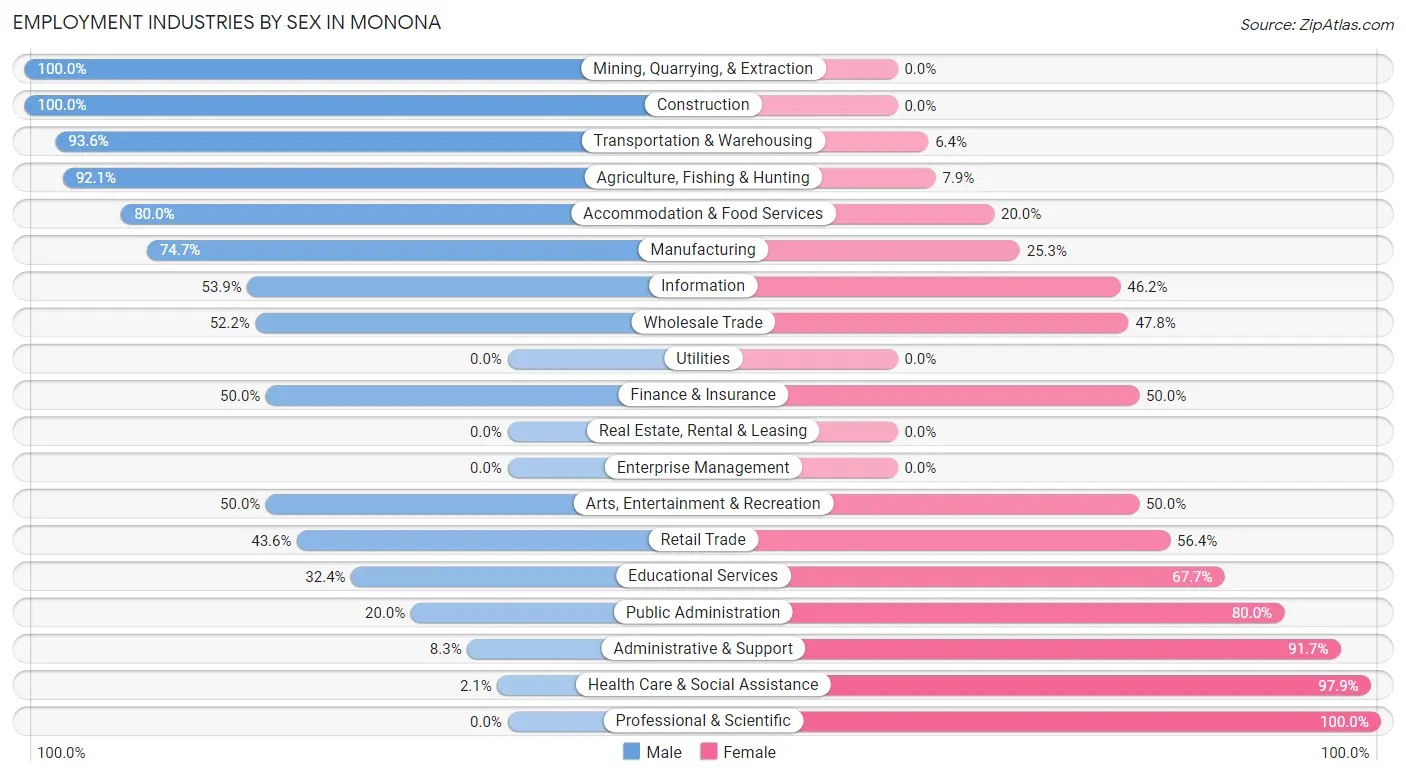
Employment Industries by Sex in Monona
The Monona industries that see more men than women are Mining, Quarrying, & Extraction (100.0%), Construction (100.0%), and Transportation & Warehousing (93.6%), whereas the industries that tend to have a higher number of women are Professional & Scientific (100.0%), Health Care & Social Assistance (97.9%), and Administrative & Support (91.7%).
| Industry | Male | Female |
| Agriculture, Fishing & Hunting | 35 (92.1%) | 3 (7.9%) |
| Mining, Quarrying, & Extraction | 30 (100.0%) | 0 (0.0%) |
| Construction | 47 (100.0%) | 0 (0.0%) |
| Manufacturing | 112 (74.7%) | 38 (25.3%) |
| Wholesale Trade | 12 (52.2%) | 11 (47.8%) |
| Retail Trade | 71 (43.6%) | 92 (56.4%) |
| Transportation & Warehousing | 44 (93.6%) | 3 (6.4%) |
| Utilities | 0 (0.0%) | 0 (0.0%) |
| Information | 7 (53.8%) | 6 (46.2%) |
| Finance & Insurance | 15 (50.0%) | 15 (50.0%) |
| Real Estate, Rental & Leasing | 0 (0.0%) | 0 (0.0%) |
| Professional & Scientific | 0 (0.0%) | 15 (100.0%) |
| Enterprise Management | 0 (0.0%) | 0 (0.0%) |
| Administrative & Support | 2 (8.3%) | 22 (91.7%) |
| Educational Services | 11 (32.4%) | 23 (67.6%) |
| Health Care & Social Assistance | 3 (2.1%) | 139 (97.9%) |
| Arts, Entertainment & Recreation | 10 (50.0%) | 10 (50.0%) |
| Accommodation & Food Services | 12 (80.0%) | 3 (20.0%) |
| Public Administration | 6 (20.0%) | 24 (80.0%) |
| Total | 427 (50.6%) | 417 (49.4%) |
Education in Monona
School Enrollment in Monona
The most common levels of schooling among the 319 students in Monona are middle school (81 | 25.4%), elementary school (66 | 20.7%), and high school (66 | 20.7%).
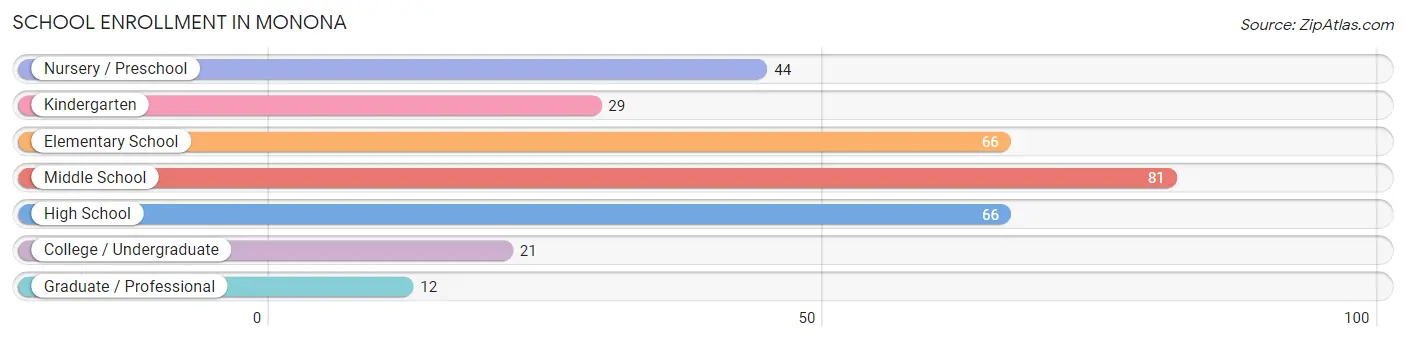
| School Level | # Students | % Students |
| Nursery / Preschool | 44 | 13.8% |
| Kindergarten | 29 | 9.1% |
| Elementary School | 66 | 20.7% |
| Middle School | 81 | 25.4% |
| High School | 66 | 20.7% |
| College / Undergraduate | 21 | 6.6% |
| Graduate / Professional | 12 | 3.8% |
| Total | 319 | 100.0% |
School Enrollment by Age by Funding Source in Monona
Out of a total of 319 students who are enrolled in schools in Monona, 39 (12.2%) attend a private institution, while the remaining 280 (87.8%) are enrolled in public schools. The age group of 35 years and over has the highest likelihood of being enrolled in private schools, with 12 (70.6% in the age bracket) enrolled. Conversely, the age group of 10 to 14 year olds has the lowest likelihood of being enrolled in a private school, with 94 (100.0% in the age bracket) attending a public institution.
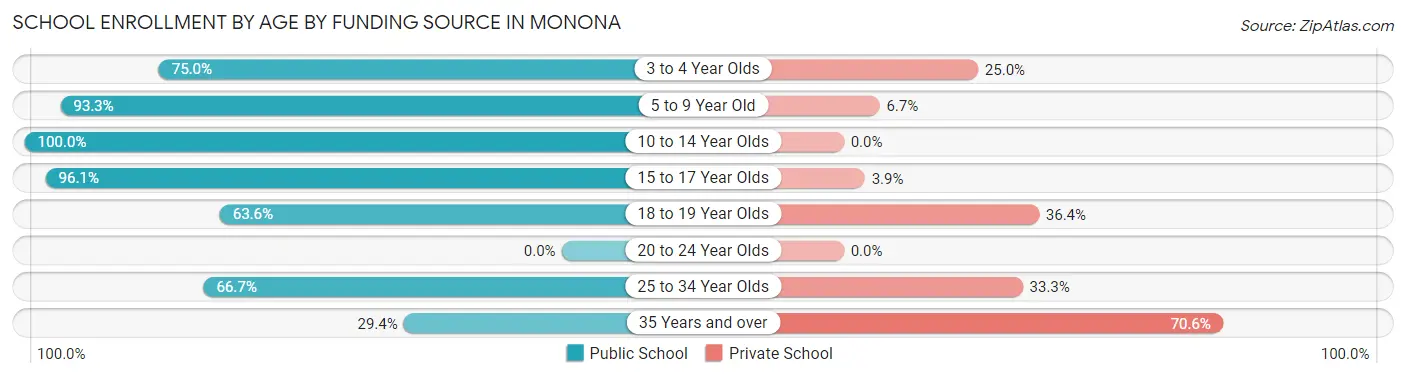
| Age Bracket | Public School | Private School |
| 3 to 4 Year Olds | 33 (75.0%) | 11 (25.0%) |
| 5 to 9 Year Old | 84 (93.3%) | 6 (6.7%) |
| 10 to 14 Year Olds | 94 (100.0%) | 0 (0.0%) |
| 15 to 17 Year Olds | 49 (96.1%) | 2 (3.9%) |
| 18 to 19 Year Olds | 7 (63.6%) | 4 (36.4%) |
| 20 to 24 Year Olds | 0 (0.0%) | 0 (0.0%) |
| 25 to 34 Year Olds | 8 (66.7%) | 4 (33.3%) |
| 35 Years and over | 5 (29.4%) | 12 (70.6%) |
| Total | 280 (87.8%) | 39 (12.2%) |
Educational Attainment by Field of Study in Monona
Science & technology (35 | 21.0%), education (26 | 15.6%), business (20 | 12.0%), social sciences (19 | 11.4%), and engineering (15 | 9.0%) are the most common fields of study among 167 individuals in Monona who have obtained a bachelor's degree or higher.
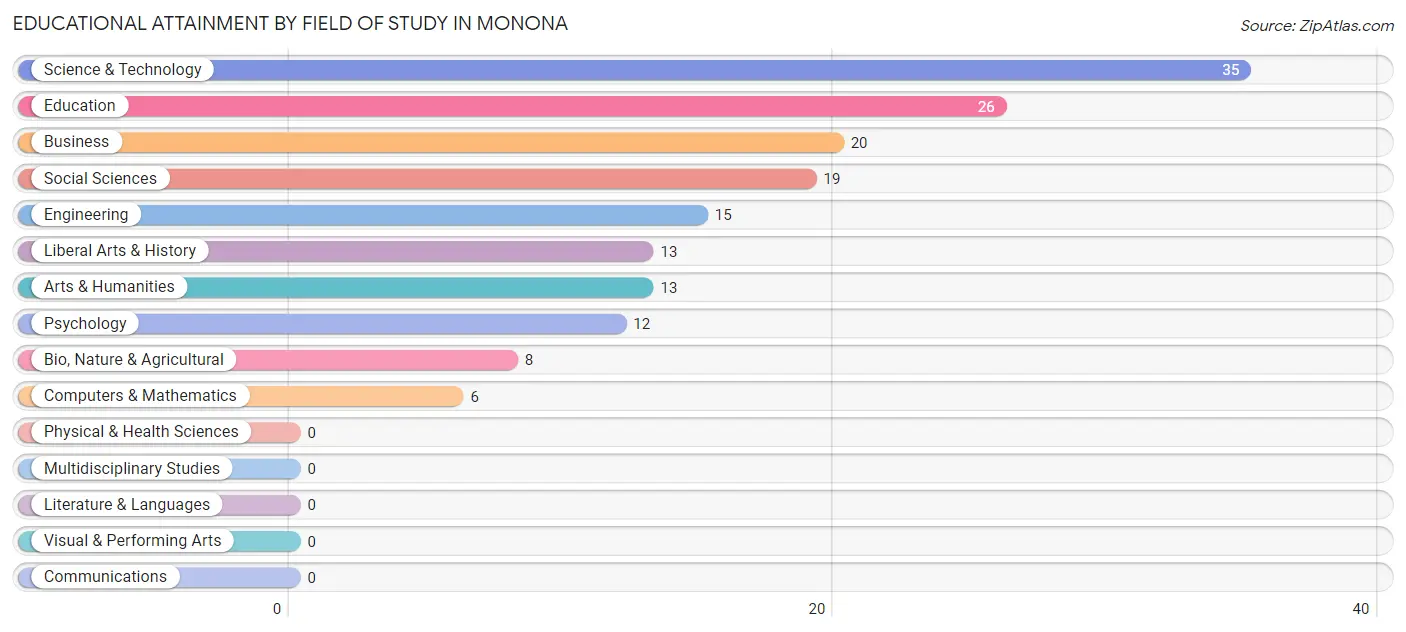
| Field of Study | # Graduates | % Graduates |
| Computers & Mathematics | 6 | 3.6% |
| Bio, Nature & Agricultural | 8 | 4.8% |
| Physical & Health Sciences | 0 | 0.0% |
| Psychology | 12 | 7.2% |
| Social Sciences | 19 | 11.4% |
| Engineering | 15 | 9.0% |
| Multidisciplinary Studies | 0 | 0.0% |
| Science & Technology | 35 | 21.0% |
| Business | 20 | 12.0% |
| Education | 26 | 15.6% |
| Literature & Languages | 0 | 0.0% |
| Liberal Arts & History | 13 | 7.8% |
| Visual & Performing Arts | 0 | 0.0% |
| Communications | 0 | 0.0% |
| Arts & Humanities | 13 | 7.8% |
| Total | 167 | 100.0% |
Transportation & Commute in Monona
Vehicle Availability by Sex in Monona
The most prevalent vehicle ownership categories in Monona are males with 2 vehicles (198, accounting for 46.6%) and females with 2 vehicles (166, making up 49.6%).
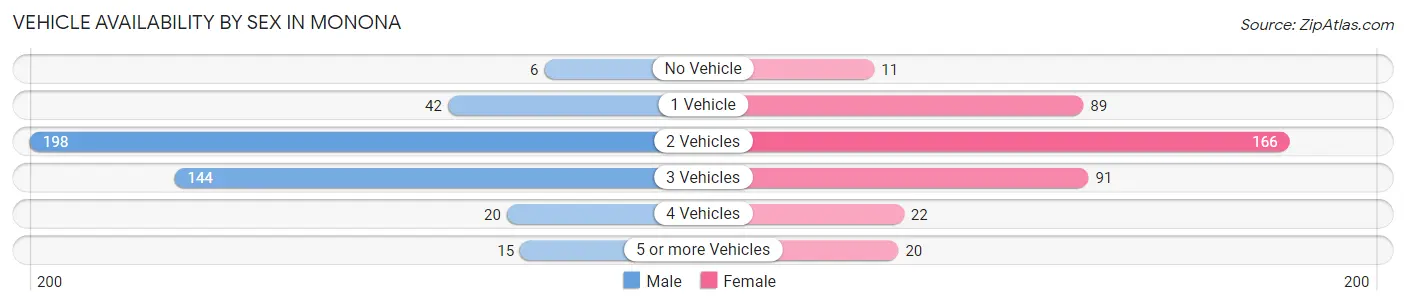
| Vehicles Available | Male | Female |
| No Vehicle | 6 (1.4%) | 11 (2.8%) |
| 1 Vehicle | 42 (9.9%) | 89 (22.3%) |
| 2 Vehicles | 198 (46.6%) | 166 (41.6%) |
| 3 Vehicles | 144 (33.9%) | 91 (22.8%) |
| 4 Vehicles | 20 (4.7%) | 22 (5.5%) |
| 5 or more Vehicles | 15 (3.5%) | 20 (5.0%) |
| Total | 425 (100.0%) | 399 (100.0%) |
Commute Time in Monona
The most frequently occuring commute durations in Monona are less than 5 minutes (141 commuters, 18.5%), 20 to 24 minutes (109 commuters, 14.3%), and 30 to 34 minutes (92 commuters, 12.1%).
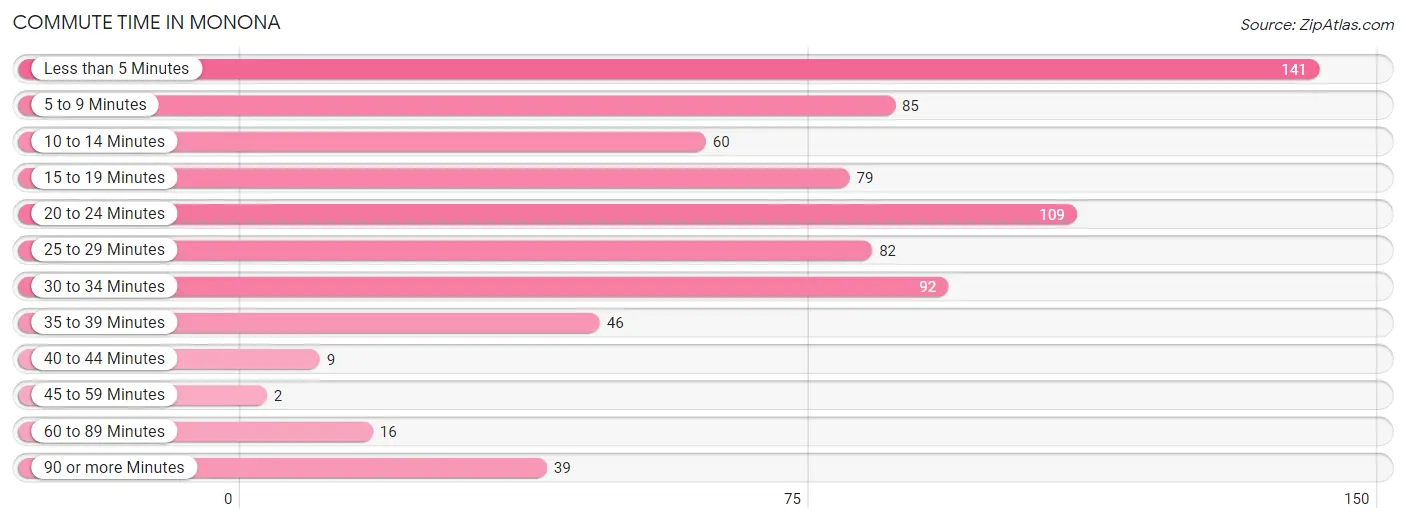
| Commute Time | # Commuters | % Commuters |
| Less than 5 Minutes | 141 | 18.5% |
| 5 to 9 Minutes | 85 | 11.2% |
| 10 to 14 Minutes | 60 | 7.9% |
| 15 to 19 Minutes | 79 | 10.4% |
| 20 to 24 Minutes | 109 | 14.3% |
| 25 to 29 Minutes | 82 | 10.8% |
| 30 to 34 Minutes | 92 | 12.1% |
| 35 to 39 Minutes | 46 | 6.0% |
| 40 to 44 Minutes | 9 | 1.2% |
| 45 to 59 Minutes | 2 | 0.3% |
| 60 to 89 Minutes | 16 | 2.1% |
| 90 or more Minutes | 39 | 5.1% |
Commute Time by Sex in Monona
The most common commute times in Monona are less than 5 minutes (79 commuters, 19.0%) for males and less than 5 minutes (62 commuters, 18.0%) for females.
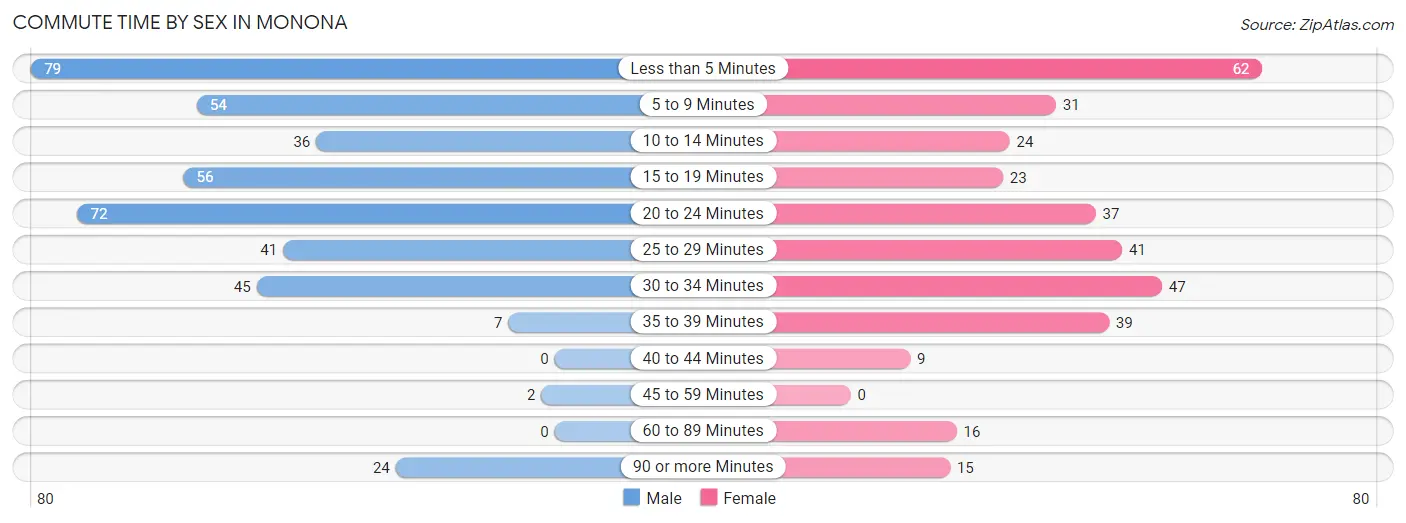
| Commute Time | Male | Female |
| Less than 5 Minutes | 79 (19.0%) | 62 (18.0%) |
| 5 to 9 Minutes | 54 (13.0%) | 31 (9.0%) |
| 10 to 14 Minutes | 36 (8.6%) | 24 (7.0%) |
| 15 to 19 Minutes | 56 (13.5%) | 23 (6.7%) |
| 20 to 24 Minutes | 72 (17.3%) | 37 (10.8%) |
| 25 to 29 Minutes | 41 (9.9%) | 41 (11.9%) |
| 30 to 34 Minutes | 45 (10.8%) | 47 (13.7%) |
| 35 to 39 Minutes | 7 (1.7%) | 39 (11.3%) |
| 40 to 44 Minutes | 0 (0.0%) | 9 (2.6%) |
| 45 to 59 Minutes | 2 (0.5%) | 0 (0.0%) |
| 60 to 89 Minutes | 0 (0.0%) | 16 (4.6%) |
| 90 or more Minutes | 24 (5.8%) | 15 (4.4%) |
Time of Departure to Work by Sex in Monona
The most frequent times of departure to work in Monona are 6:30 AM to 6:59 AM (70, 16.8%) for males and 7:00 AM to 7:29 AM (53, 15.4%) for females.
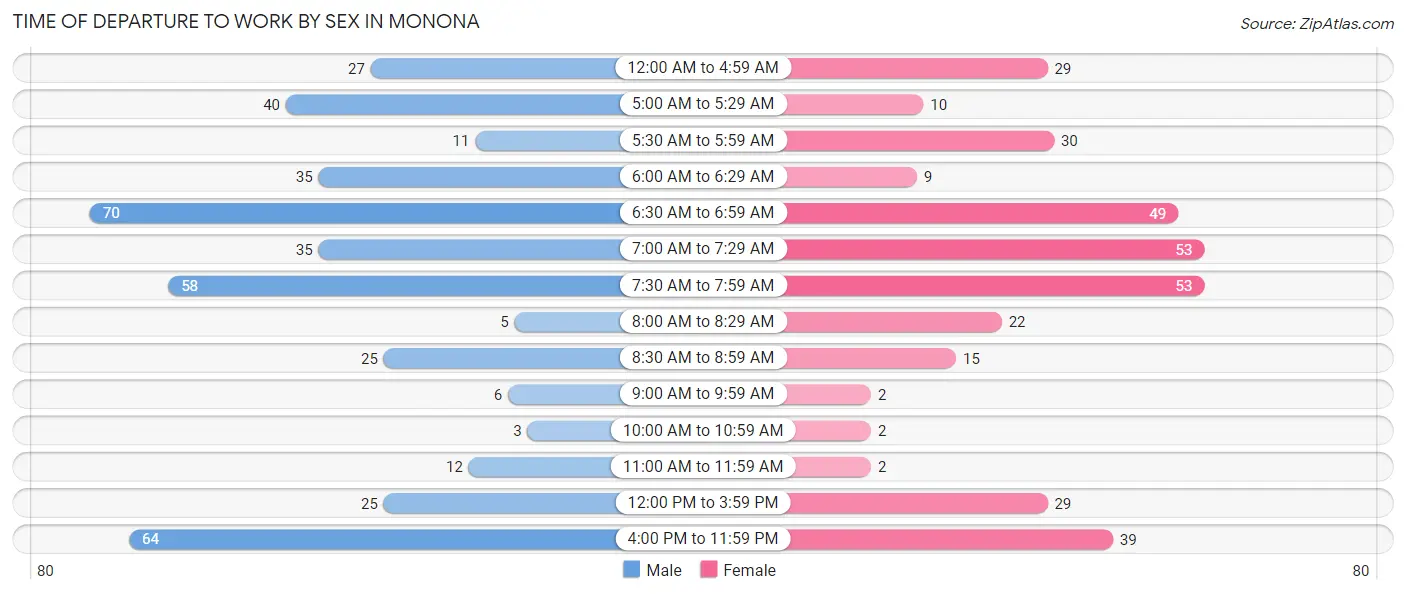
| Time of Departure | Male | Female |
| 12:00 AM to 4:59 AM | 27 (6.5%) | 29 (8.4%) |
| 5:00 AM to 5:29 AM | 40 (9.6%) | 10 (2.9%) |
| 5:30 AM to 5:59 AM | 11 (2.6%) | 30 (8.7%) |
| 6:00 AM to 6:29 AM | 35 (8.4%) | 9 (2.6%) |
| 6:30 AM to 6:59 AM | 70 (16.8%) | 49 (14.2%) |
| 7:00 AM to 7:29 AM | 35 (8.4%) | 53 (15.4%) |
| 7:30 AM to 7:59 AM | 58 (13.9%) | 53 (15.4%) |
| 8:00 AM to 8:29 AM | 5 (1.2%) | 22 (6.4%) |
| 8:30 AM to 8:59 AM | 25 (6.0%) | 15 (4.4%) |
| 9:00 AM to 9:59 AM | 6 (1.4%) | 2 (0.6%) |
| 10:00 AM to 10:59 AM | 3 (0.7%) | 2 (0.6%) |
| 11:00 AM to 11:59 AM | 12 (2.9%) | 2 (0.6%) |
| 12:00 PM to 3:59 PM | 25 (6.0%) | 29 (8.4%) |
| 4:00 PM to 11:59 PM | 64 (15.4%) | 39 (11.3%) |
| Total | 416 (100.0%) | 344 (100.0%) |
Housing Occupancy in Monona
Occupancy by Ownership in Monona
Of the total 716 dwellings in Monona, owner-occupied units account for 475 (66.3%), while renter-occupied units make up 241 (33.7%).
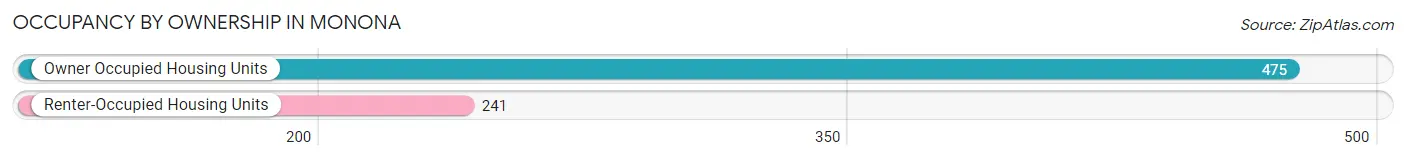
| Occupancy | # Housing Units | % Housing Units |
| Owner Occupied Housing Units | 475 | 66.3% |
| Renter-Occupied Housing Units | 241 | 33.7% |
| Total Occupied Housing Units | 716 | 100.0% |
Occupancy by Household Size in Monona
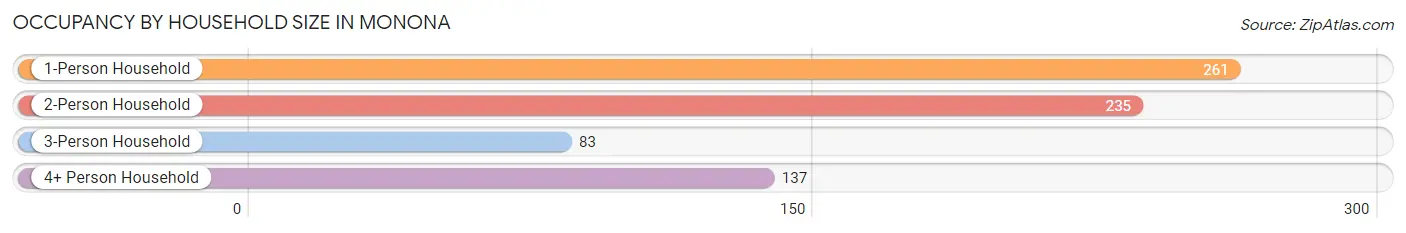
| Household Size | # Housing Units | % Housing Units |
| 1-Person Household | 261 | 36.4% |
| 2-Person Household | 235 | 32.8% |
| 3-Person Household | 83 | 11.6% |
| 4+ Person Household | 137 | 19.1% |
| Total Housing Units | 716 | 100.0% |
Occupancy by Ownership by Household Size in Monona
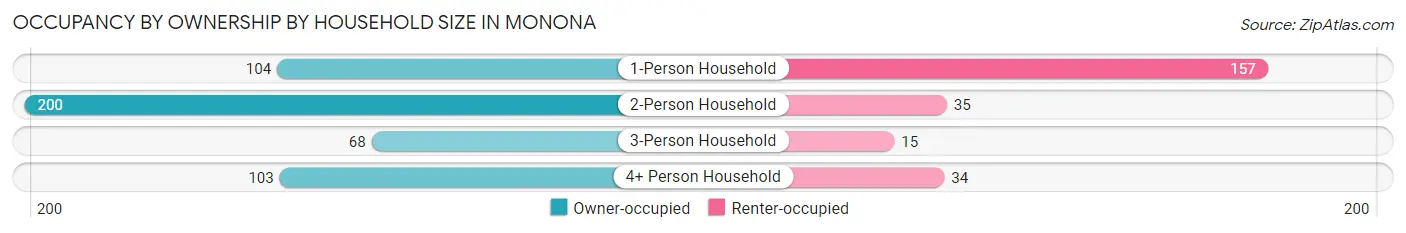
| Household Size | Owner-occupied | Renter-occupied |
| 1-Person Household | 104 (39.9%) | 157 (60.2%) |
| 2-Person Household | 200 (85.1%) | 35 (14.9%) |
| 3-Person Household | 68 (81.9%) | 15 (18.1%) |
| 4+ Person Household | 103 (75.2%) | 34 (24.8%) |
| Total Housing Units | 475 (66.3%) | 241 (33.7%) |
Occupancy by Educational Attainment in Monona
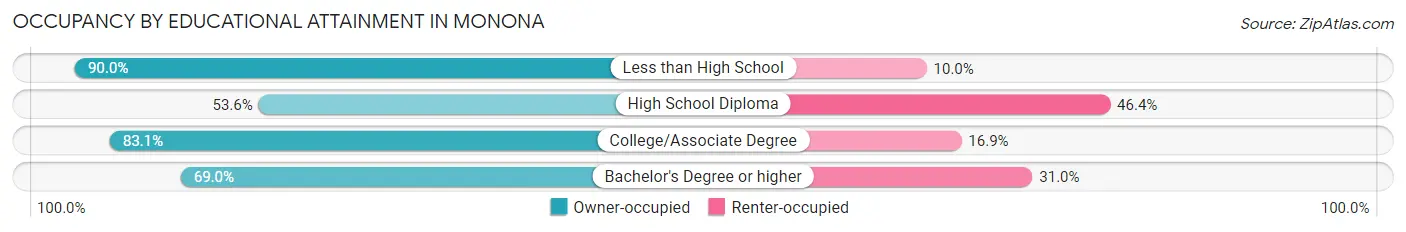
| Household Size | Owner-occupied | Renter-occupied |
| Less than High School | 27 (90.0%) | 3 (10.0%) |
| High School Diploma | 193 (53.6%) | 167 (46.4%) |
| College/Associate Degree | 177 (83.1%) | 36 (16.9%) |
| Bachelor's Degree or higher | 78 (69.0%) | 35 (31.0%) |
Occupancy by Age of Householder in Monona
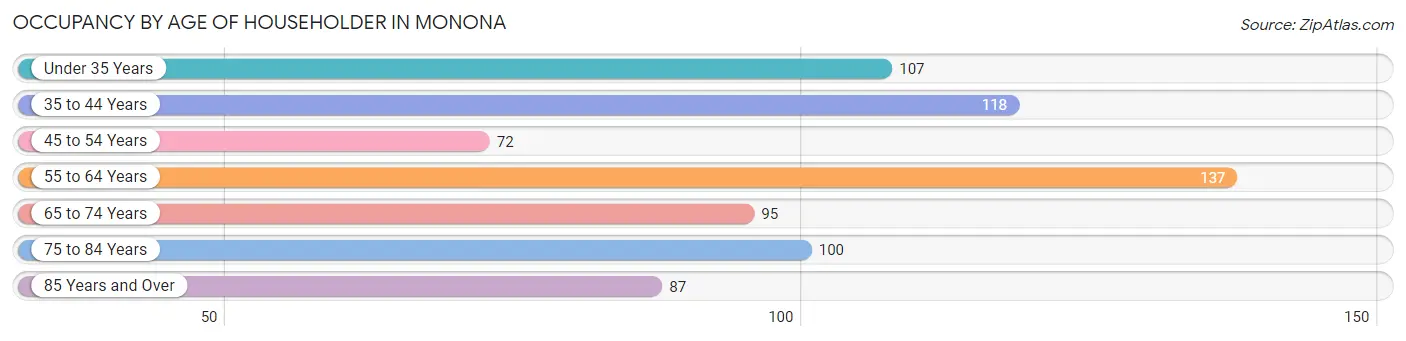
| Age Bracket | # Households | % Households |
| Under 35 Years | 107 | 14.9% |
| 35 to 44 Years | 118 | 16.5% |
| 45 to 54 Years | 72 | 10.1% |
| 55 to 64 Years | 137 | 19.1% |
| 65 to 74 Years | 95 | 13.3% |
| 75 to 84 Years | 100 | 14.0% |
| 85 Years and Over | 87 | 12.1% |
| Total | 716 | 100.0% |
Housing Finances in Monona
Median Income by Occupancy in Monona
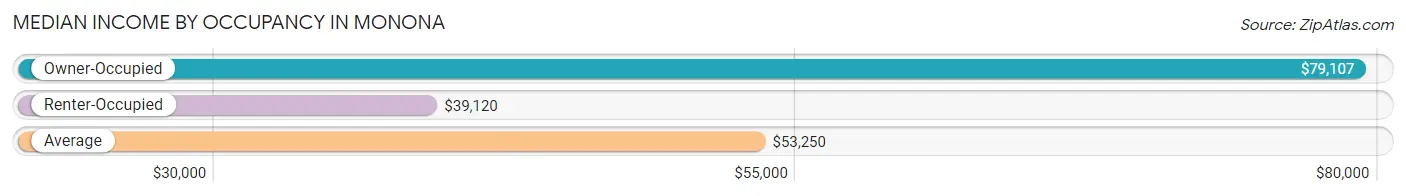
| Occupancy Type | # Households | Median Income |
| Owner-Occupied | 475 (66.3%) | $79,107 |
| Renter-Occupied | 241 (33.7%) | $39,120 |
| Average | 716 (100.0%) | $53,250 |
Occupancy by Householder Income Bracket in Monona
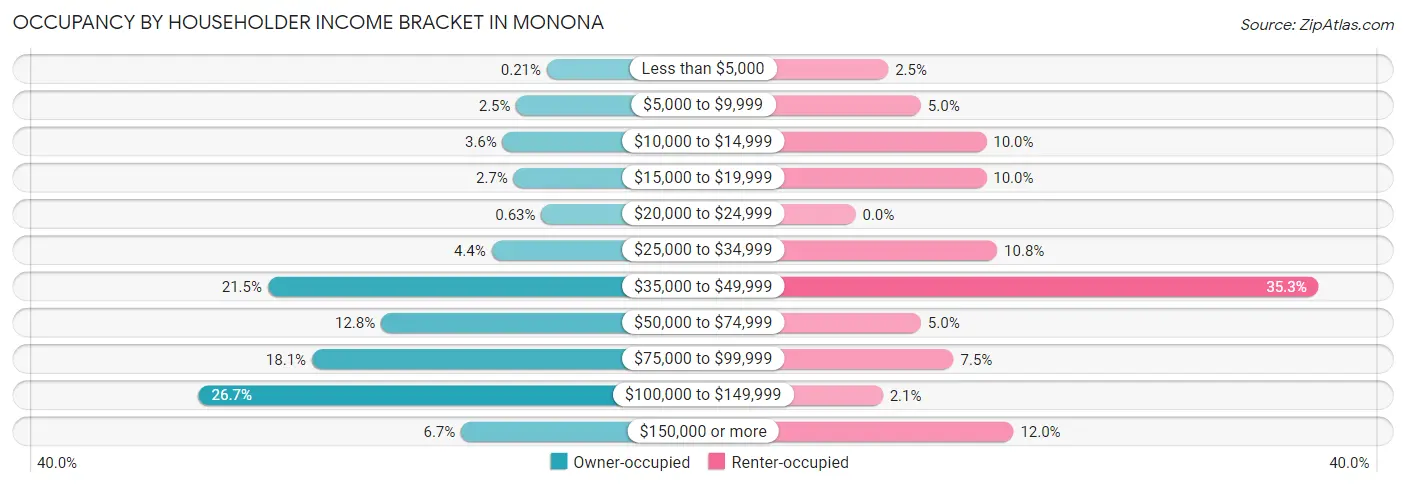
| Income Bracket | Owner-occupied | Renter-occupied |
| Less than $5,000 | 1 (0.2%) | 6 (2.5%) |
| $5,000 to $9,999 | 12 (2.5%) | 12 (5.0%) |
| $10,000 to $14,999 | 17 (3.6%) | 24 (10.0%) |
| $15,000 to $19,999 | 13 (2.7%) | 24 (10.0%) |
| $20,000 to $24,999 | 3 (0.6%) | 0 (0.0%) |
| $25,000 to $34,999 | 21 (4.4%) | 26 (10.8%) |
| $35,000 to $49,999 | 102 (21.5%) | 85 (35.3%) |
| $50,000 to $74,999 | 61 (12.8%) | 12 (5.0%) |
| $75,000 to $99,999 | 86 (18.1%) | 18 (7.5%) |
| $100,000 to $149,999 | 127 (26.7%) | 5 (2.1%) |
| $150,000 or more | 32 (6.7%) | 29 (12.0%) |
| Total | 475 (100.0%) | 241 (100.0%) |
Monthly Housing Cost Tiers in Monona
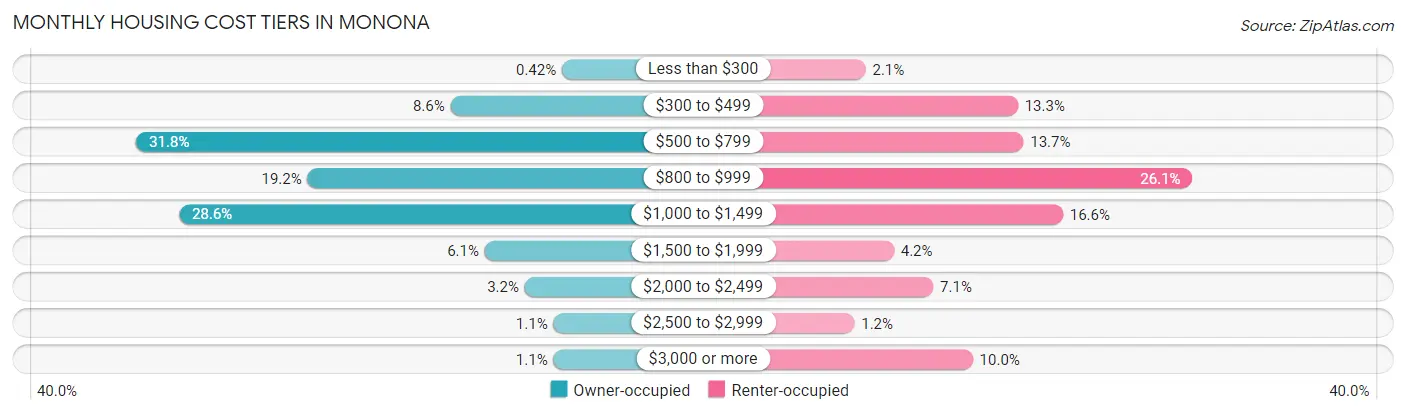
| Monthly Cost | Owner-occupied | Renter-occupied |
| Less than $300 | 2 (0.4%) | 5 (2.1%) |
| $300 to $499 | 41 (8.6%) | 32 (13.3%) |
| $500 to $799 | 151 (31.8%) | 33 (13.7%) |
| $800 to $999 | 91 (19.2%) | 63 (26.1%) |
| $1,000 to $1,499 | 136 (28.6%) | 40 (16.6%) |
| $1,500 to $1,999 | 29 (6.1%) | 10 (4.2%) |
| $2,000 to $2,499 | 15 (3.2%) | 17 (7.0%) |
| $2,500 to $2,999 | 5 (1.1%) | 3 (1.2%) |
| $3,000 or more | 5 (1.1%) | 24 (10.0%) |
| Total | 475 (100.0%) | 241 (100.0%) |
Physical Housing Characteristics in Monona
Housing Structures in Monona
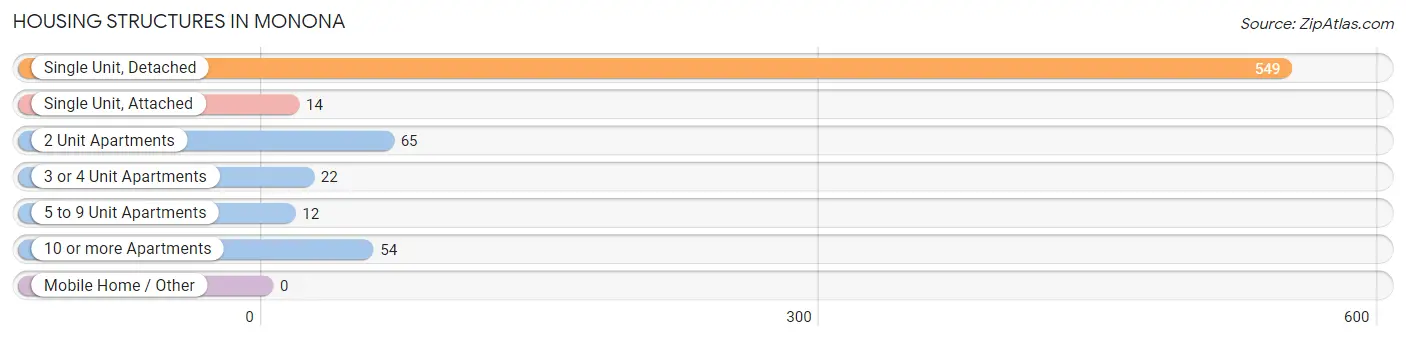
| Structure Type | # Housing Units | % Housing Units |
| Single Unit, Detached | 549 | 76.7% |
| Single Unit, Attached | 14 | 2.0% |
| 2 Unit Apartments | 65 | 9.1% |
| 3 or 4 Unit Apartments | 22 | 3.1% |
| 5 to 9 Unit Apartments | 12 | 1.7% |
| 10 or more Apartments | 54 | 7.5% |
| Mobile Home / Other | 0 | 0.0% |
| Total | 716 | 100.0% |
Housing Structures by Occupancy in Monona
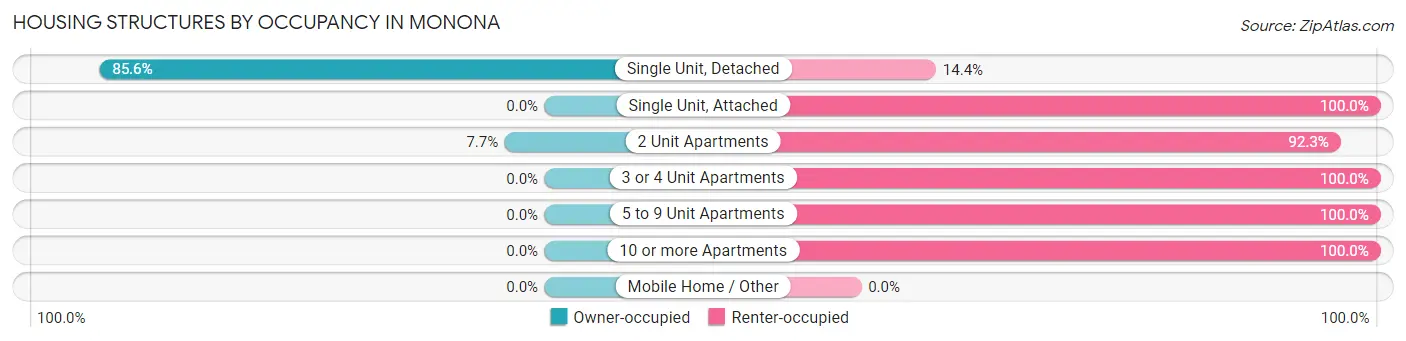
| Structure Type | Owner-occupied | Renter-occupied |
| Single Unit, Detached | 470 (85.6%) | 79 (14.4%) |
| Single Unit, Attached | 0 (0.0%) | 14 (100.0%) |
| 2 Unit Apartments | 5 (7.7%) | 60 (92.3%) |
| 3 or 4 Unit Apartments | 0 (0.0%) | 22 (100.0%) |
| 5 to 9 Unit Apartments | 0 (0.0%) | 12 (100.0%) |
| 10 or more Apartments | 0 (0.0%) | 54 (100.0%) |
| Mobile Home / Other | 0 (0.0%) | 0 (0.0%) |
| Total | 475 (66.3%) | 241 (33.7%) |
Housing Structures by Number of Rooms in Monona
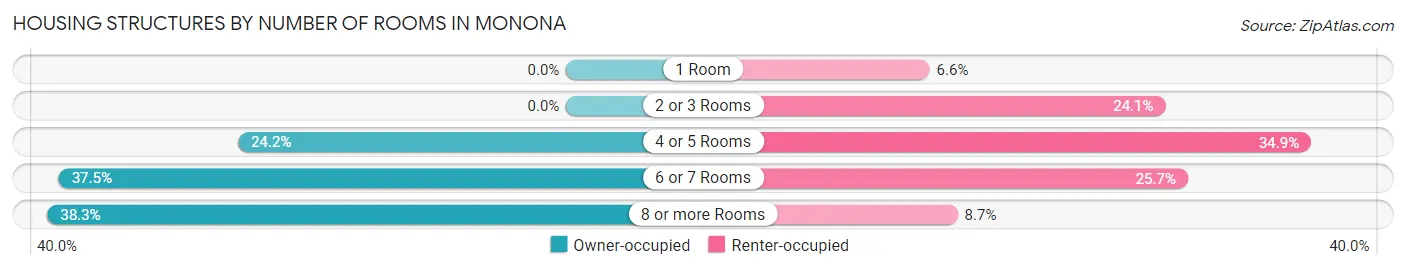
| Number of Rooms | Owner-occupied | Renter-occupied |
| 1 Room | 0 (0.0%) | 16 (6.6%) |
| 2 or 3 Rooms | 0 (0.0%) | 58 (24.1%) |
| 4 or 5 Rooms | 115 (24.2%) | 84 (34.8%) |
| 6 or 7 Rooms | 178 (37.5%) | 62 (25.7%) |
| 8 or more Rooms | 182 (38.3%) | 21 (8.7%) |
| Total | 475 (100.0%) | 241 (100.0%) |
Housing Structure by Heating Type in Monona
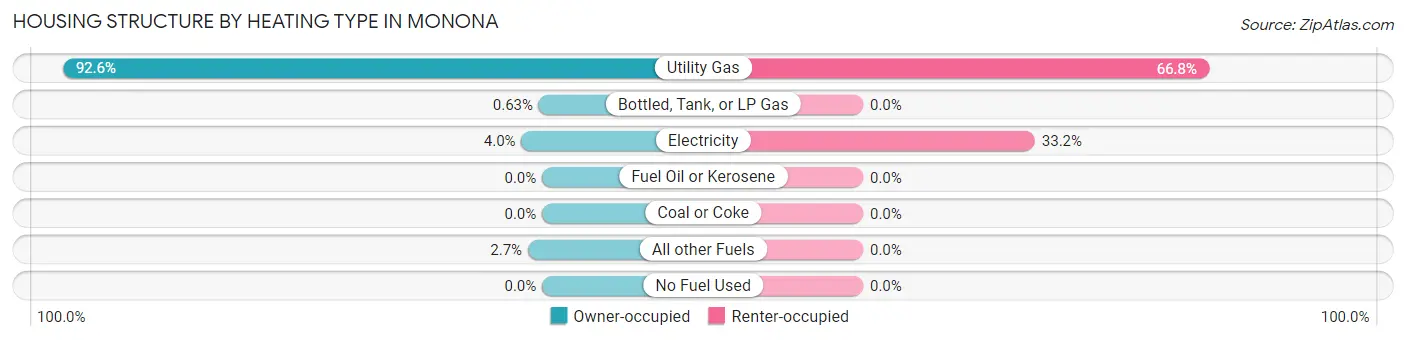
| Heating Type | Owner-occupied | Renter-occupied |
| Utility Gas | 440 (92.6%) | 161 (66.8%) |
| Bottled, Tank, or LP Gas | 3 (0.6%) | 0 (0.0%) |
| Electricity | 19 (4.0%) | 80 (33.2%) |
| Fuel Oil or Kerosene | 0 (0.0%) | 0 (0.0%) |
| Coal or Coke | 0 (0.0%) | 0 (0.0%) |
| All other Fuels | 13 (2.7%) | 0 (0.0%) |
| No Fuel Used | 0 (0.0%) | 0 (0.0%) |
| Total | 475 (100.0%) | 241 (100.0%) |
Household Vehicle Usage in Monona
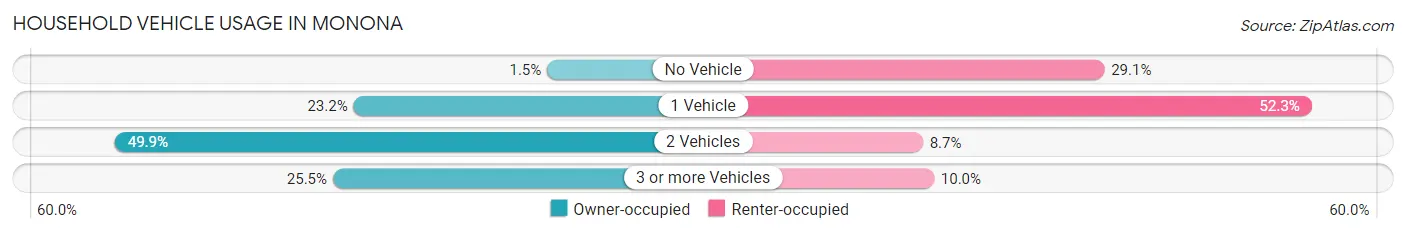
| Vehicles per Household | Owner-occupied | Renter-occupied |
| No Vehicle | 7 (1.5%) | 70 (29.0%) |
| 1 Vehicle | 110 (23.2%) | 126 (52.3%) |
| 2 Vehicles | 237 (49.9%) | 21 (8.7%) |
| 3 or more Vehicles | 121 (25.5%) | 24 (10.0%) |
| Total | 475 (100.0%) | 241 (100.0%) |
Real Estate & Mortgages in Monona
Real Estate and Mortgage Overview in Monona
| Characteristic | Without Mortgage | With Mortgage |
| Housing Units | 164 | 311 |
| Median Property Value | $122,700 | $113,700 |
| Median Household Income | $41,429 | $20 |
| Monthly Housing Costs | $624 | $5 |
| Real Estate Taxes | $2,102 | $0 |
Property Value by Mortgage Status in Monona
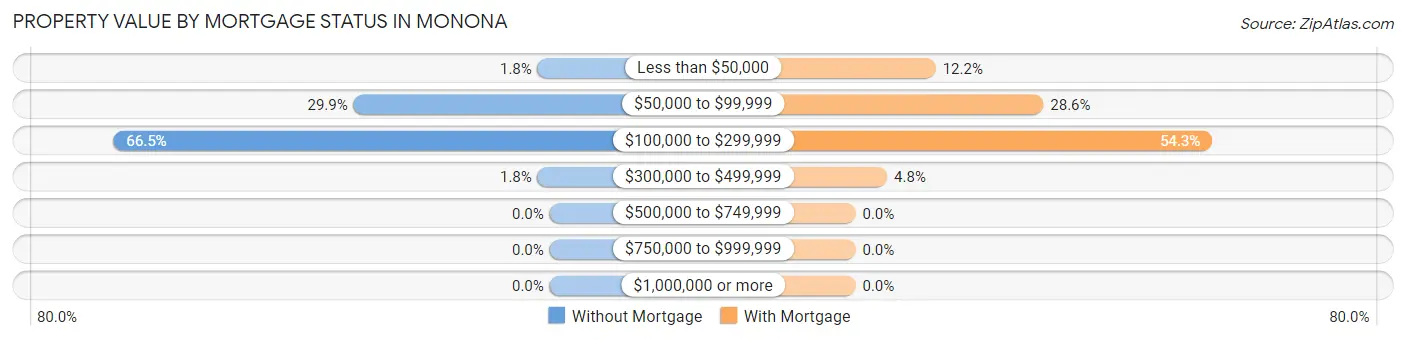
| Property Value | Without Mortgage | With Mortgage |
| Less than $50,000 | 3 (1.8%) | 38 (12.2%) |
| $50,000 to $99,999 | 49 (29.9%) | 89 (28.6%) |
| $100,000 to $299,999 | 109 (66.5%) | 169 (54.3%) |
| $300,000 to $499,999 | 3 (1.8%) | 15 (4.8%) |
| $500,000 to $749,999 | 0 (0.0%) | 0 (0.0%) |
| $750,000 to $999,999 | 0 (0.0%) | 0 (0.0%) |
| $1,000,000 or more | 0 (0.0%) | 0 (0.0%) |
| Total | 164 (100.0%) | 311 (100.0%) |
Household Income by Mortgage Status in Monona
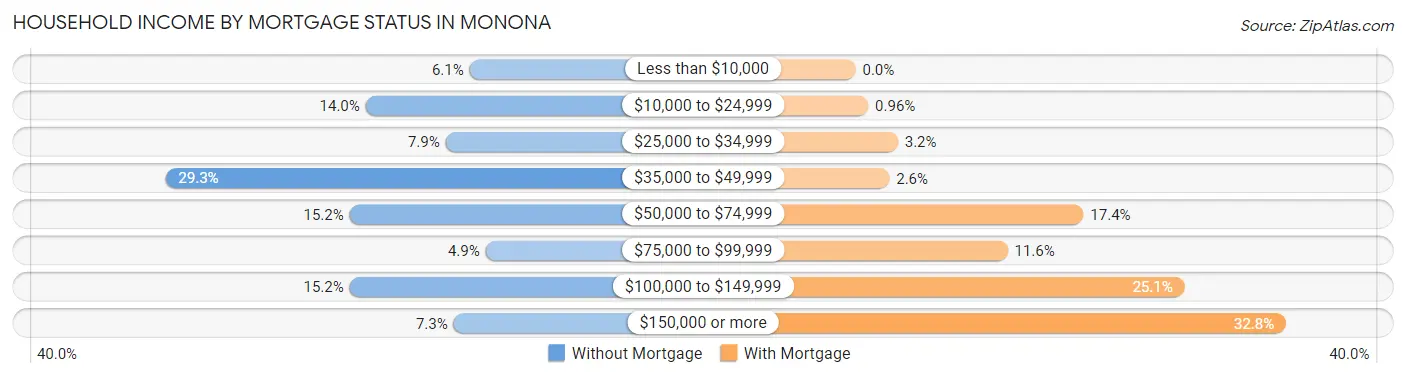
| Household Income | Without Mortgage | With Mortgage |
| Less than $10,000 | 10 (6.1%) | 0 (0.0%) |
| $10,000 to $24,999 | 23 (14.0%) | 3 (1.0%) |
| $25,000 to $34,999 | 13 (7.9%) | 10 (3.2%) |
| $35,000 to $49,999 | 48 (29.3%) | 8 (2.6%) |
| $50,000 to $74,999 | 25 (15.2%) | 54 (17.4%) |
| $75,000 to $99,999 | 8 (4.9%) | 36 (11.6%) |
| $100,000 to $149,999 | 25 (15.2%) | 78 (25.1%) |
| $150,000 or more | 12 (7.3%) | 102 (32.8%) |
| Total | 164 (100.0%) | 311 (100.0%) |
Property Value to Household Income Ratio in Monona
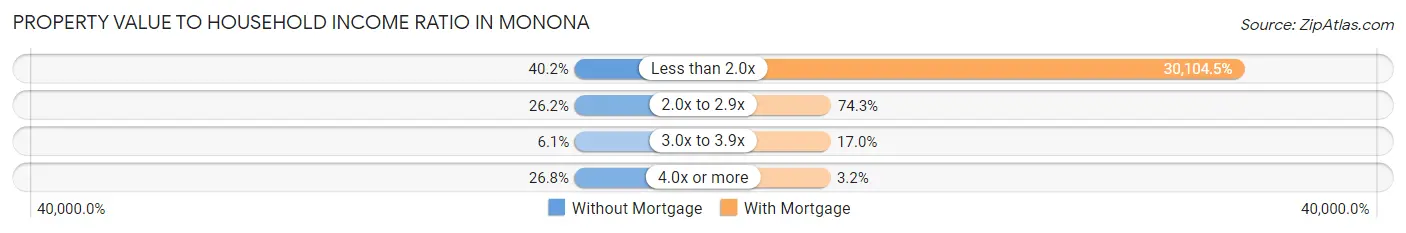
| Value-to-Income Ratio | Without Mortgage | With Mortgage |
| Less than 2.0x | 66 (40.2%) | 93,625 (30,104.5%) |
| 2.0x to 2.9x | 43 (26.2%) | 231 (74.3%) |
| 3.0x to 3.9x | 10 (6.1%) | 53 (17.0%) |
| 4.0x or more | 44 (26.8%) | 10 (3.2%) |
| Total | 164 (100.0%) | 311 (100.0%) |
Real Estate Taxes by Mortgage Status in Monona
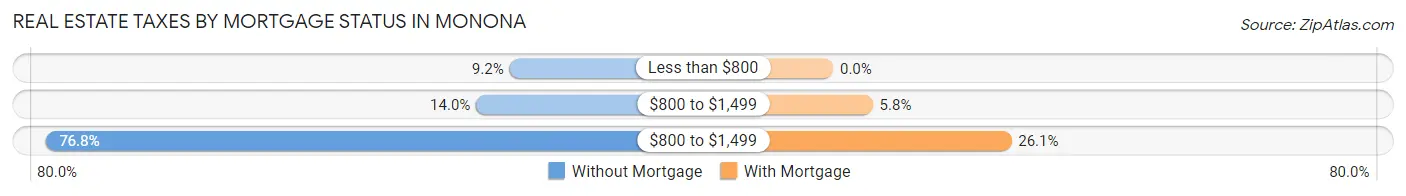
| Property Taxes | Without Mortgage | With Mortgage |
| Less than $800 | 15 (9.1%) | 0 (0.0%) |
| $800 to $1,499 | 23 (14.0%) | 18 (5.8%) |
| $800 to $1,499 | 126 (76.8%) | 81 (26.1%) |
| Total | 164 (100.0%) | 311 (100.0%) |
Health & Disability in Monona
Health Insurance Coverage by Age in Monona
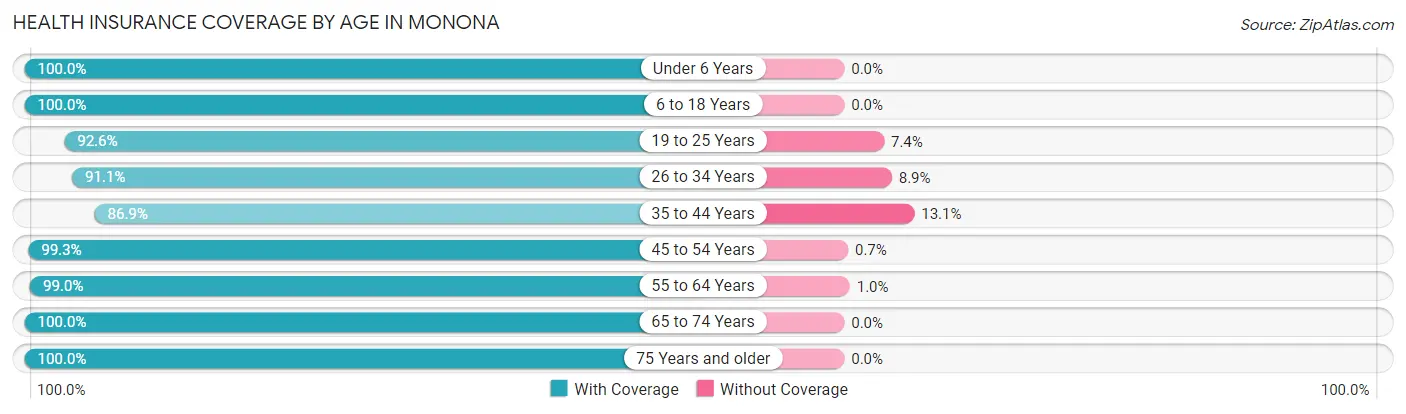
| Age Bracket | With Coverage | Without Coverage |
| Under 6 Years | 129 (100.0%) | 0 (0.0%) |
| 6 to 18 Years | 239 (100.0%) | 0 (0.0%) |
| 19 to 25 Years | 75 (92.6%) | 6 (7.4%) |
| 26 to 34 Years | 144 (91.1%) | 14 (8.9%) |
| 35 to 44 Years | 193 (86.9%) | 29 (13.1%) |
| 45 to 54 Years | 142 (99.3%) | 1 (0.7%) |
| 55 to 64 Years | 194 (99.0%) | 2 (1.0%) |
| 65 to 74 Years | 172 (100.0%) | 0 (0.0%) |
| 75 Years and older | 231 (100.0%) | 0 (0.0%) |
| Total | 1,519 (96.7%) | 52 (3.3%) |
Health Insurance Coverage by Citizenship Status in Monona
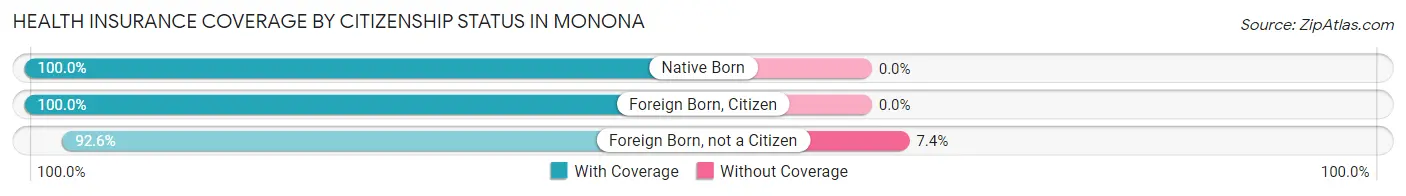
| Citizenship Status | With Coverage | Without Coverage |
| Native Born | 129 (100.0%) | 0 (0.0%) |
| Foreign Born, Citizen | 239 (100.0%) | 0 (0.0%) |
| Foreign Born, not a Citizen | 75 (92.6%) | 6 (7.4%) |
Health Insurance Coverage by Household Income in Monona
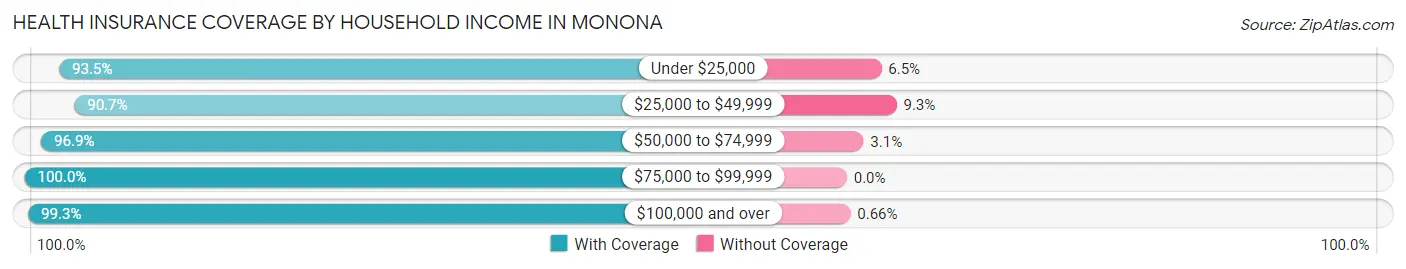
| Household Income | With Coverage | Without Coverage |
| Under $25,000 | 130 (93.5%) | 9 (6.5%) |
| $25,000 to $49,999 | 331 (90.7%) | 34 (9.3%) |
| $50,000 to $74,999 | 156 (96.9%) | 5 (3.1%) |
| $75,000 to $99,999 | 300 (100.0%) | 0 (0.0%) |
| $100,000 and over | 602 (99.3%) | 4 (0.7%) |
Public vs Private Health Insurance Coverage by Age in Monona
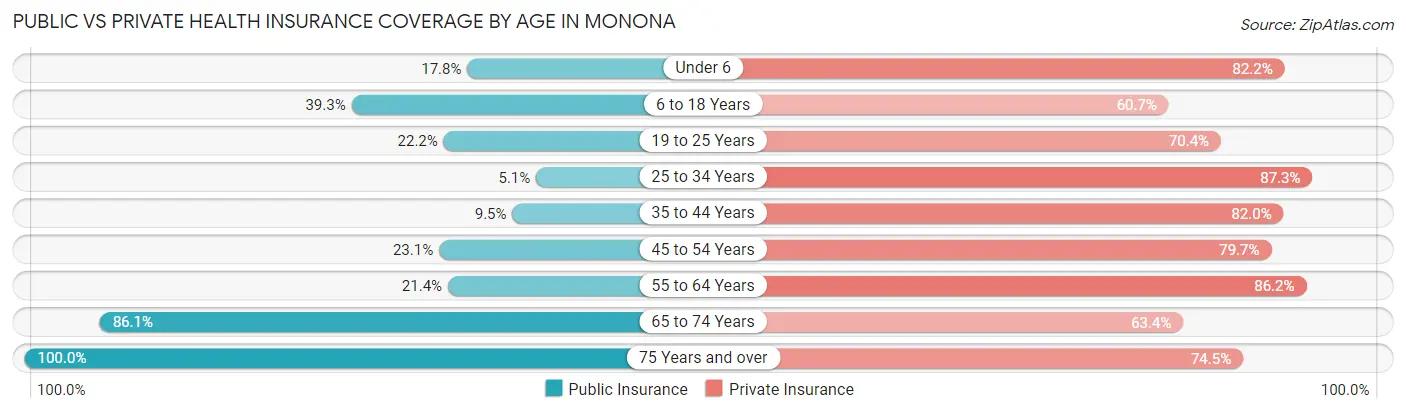
| Age Bracket | Public Insurance | Private Insurance |
| Under 6 | 23 (17.8%) | 106 (82.2%) |
| 6 to 18 Years | 94 (39.3%) | 145 (60.7%) |
| 19 to 25 Years | 18 (22.2%) | 57 (70.4%) |
| 25 to 34 Years | 8 (5.1%) | 138 (87.3%) |
| 35 to 44 Years | 21 (9.5%) | 182 (82.0%) |
| 45 to 54 Years | 33 (23.1%) | 114 (79.7%) |
| 55 to 64 Years | 42 (21.4%) | 169 (86.2%) |
| 65 to 74 Years | 148 (86.1%) | 109 (63.4%) |
| 75 Years and over | 231 (100.0%) | 172 (74.5%) |
| Total | 618 (39.3%) | 1,192 (75.9%) |
Disability Status by Sex by Age in Monona
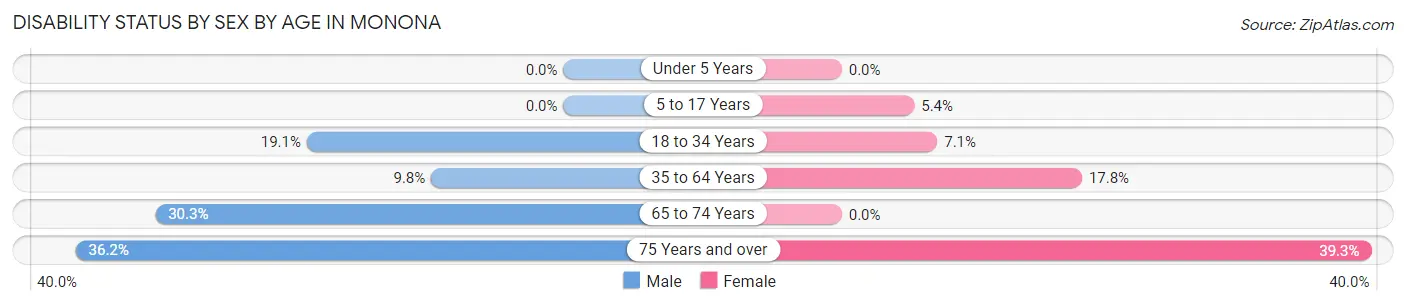
| Age Bracket | Male | Female |
| Under 5 Years | 0 (0.0%) | 0 (0.0%) |
| 5 to 17 Years | 0 (0.0%) | 5 (5.4%) |
| 18 to 34 Years | 20 (19.1%) | 10 (7.1%) |
| 35 to 64 Years | 27 (9.8%) | 51 (17.8%) |
| 65 to 74 Years | 30 (30.3%) | 0 (0.0%) |
| 75 Years and over | 21 (36.2%) | 68 (39.3%) |
Disability Class by Sex by Age in Monona
Disability Class: Hearing Difficulty
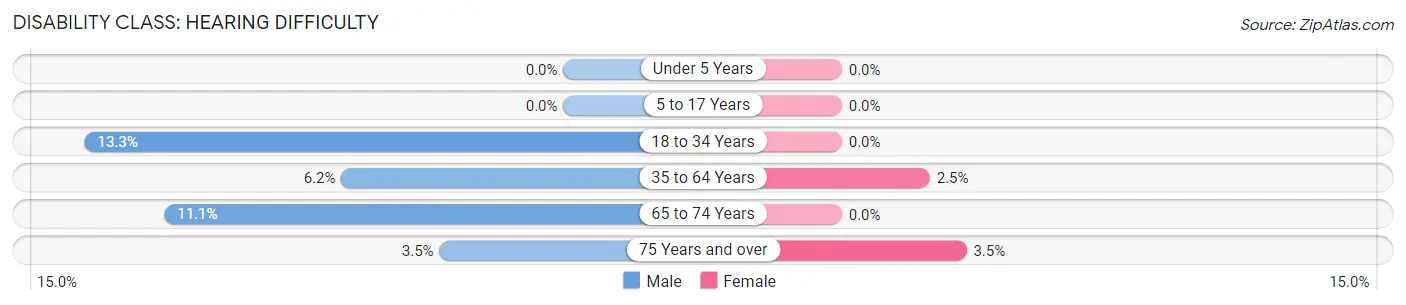
| Age Bracket | Male | Female |
| Under 5 Years | 0 (0.0%) | 0 (0.0%) |
| 5 to 17 Years | 0 (0.0%) | 0 (0.0%) |
| 18 to 34 Years | 14 (13.3%) | 0 (0.0%) |
| 35 to 64 Years | 17 (6.2%) | 7 (2.5%) |
| 65 to 74 Years | 11 (11.1%) | 0 (0.0%) |
| 75 Years and over | 2 (3.5%) | 6 (3.5%) |
Disability Class: Vision Difficulty
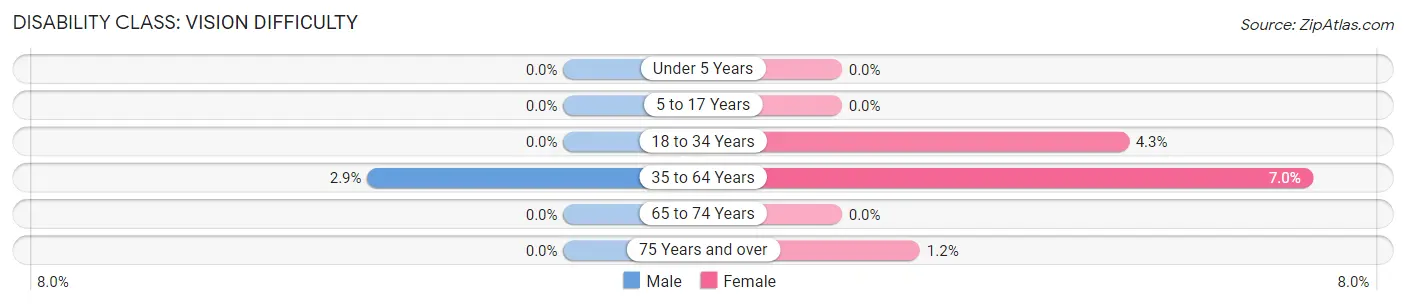
| Age Bracket | Male | Female |
| Under 5 Years | 0 (0.0%) | 0 (0.0%) |
| 5 to 17 Years | 0 (0.0%) | 0 (0.0%) |
| 18 to 34 Years | 0 (0.0%) | 6 (4.3%) |
| 35 to 64 Years | 8 (2.9%) | 20 (7.0%) |
| 65 to 74 Years | 0 (0.0%) | 0 (0.0%) |
| 75 Years and over | 0 (0.0%) | 2 (1.2%) |
Disability Class: Cognitive Difficulty
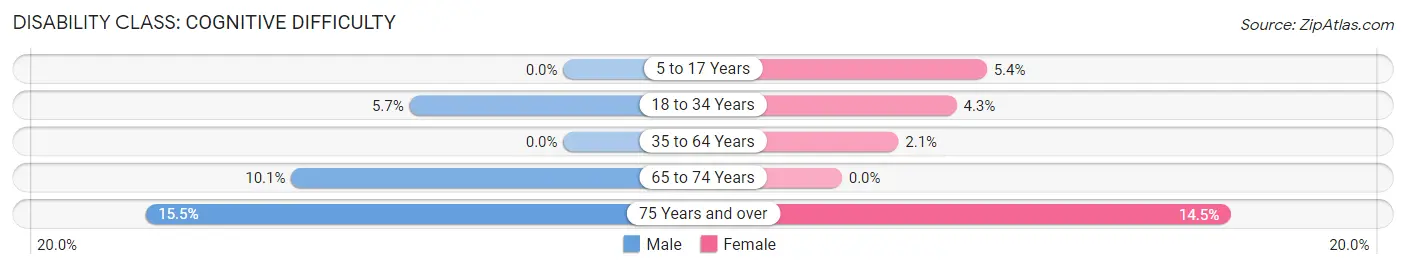
| Age Bracket | Male | Female |
| 5 to 17 Years | 0 (0.0%) | 5 (5.4%) |
| 18 to 34 Years | 6 (5.7%) | 6 (4.3%) |
| 35 to 64 Years | 0 (0.0%) | 6 (2.1%) |
| 65 to 74 Years | 10 (10.1%) | 0 (0.0%) |
| 75 Years and over | 9 (15.5%) | 25 (14.4%) |
Disability Class: Ambulatory Difficulty
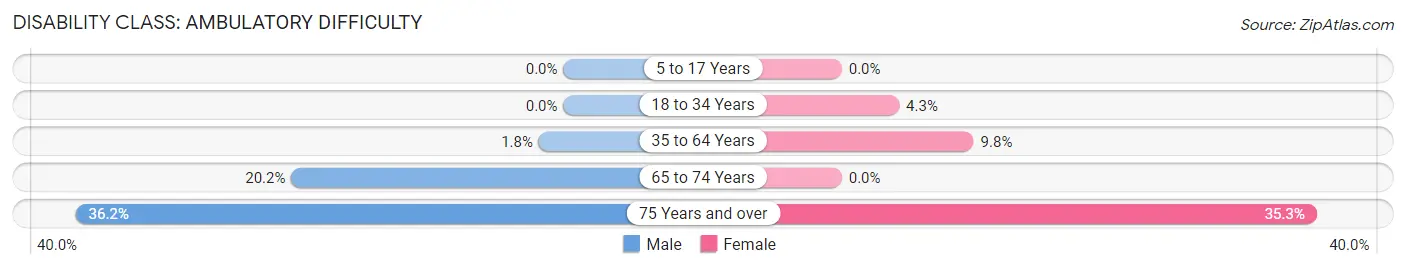
| Age Bracket | Male | Female |
| 5 to 17 Years | 0 (0.0%) | 0 (0.0%) |
| 18 to 34 Years | 0 (0.0%) | 6 (4.3%) |
| 35 to 64 Years | 5 (1.8%) | 28 (9.8%) |
| 65 to 74 Years | 20 (20.2%) | 0 (0.0%) |
| 75 Years and over | 21 (36.2%) | 61 (35.3%) |
Disability Class: Self-Care Difficulty
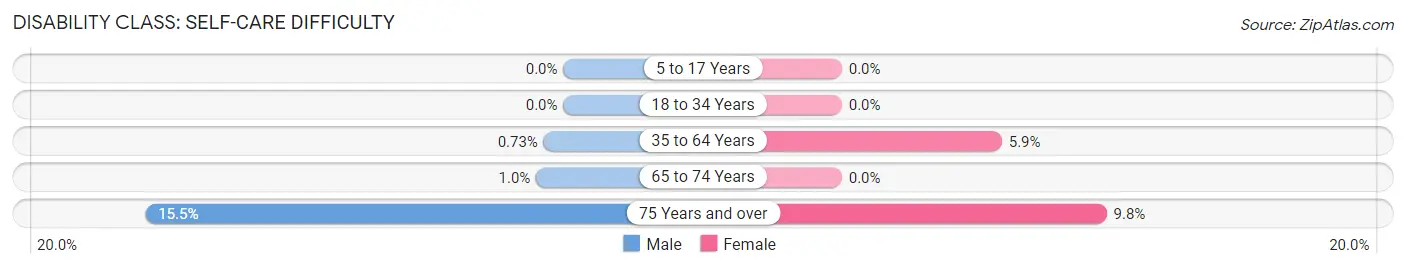
| Age Bracket | Male | Female |
| 5 to 17 Years | 0 (0.0%) | 0 (0.0%) |
| 18 to 34 Years | 0 (0.0%) | 0 (0.0%) |
| 35 to 64 Years | 2 (0.7%) | 17 (5.9%) |
| 65 to 74 Years | 1 (1.0%) | 0 (0.0%) |
| 75 Years and over | 9 (15.5%) | 17 (9.8%) |
Technology Access in Monona
Computing Device Access in Monona
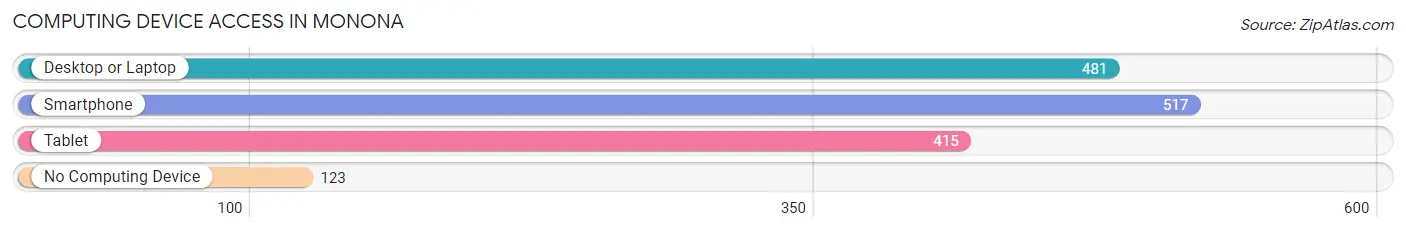
| Device Type | # Households | % Households |
| Desktop or Laptop | 481 | 67.2% |
| Smartphone | 517 | 72.2% |
| Tablet | 415 | 58.0% |
| No Computing Device | 123 | 17.2% |
| Total | 716 | 100.0% |
Internet Access in Monona
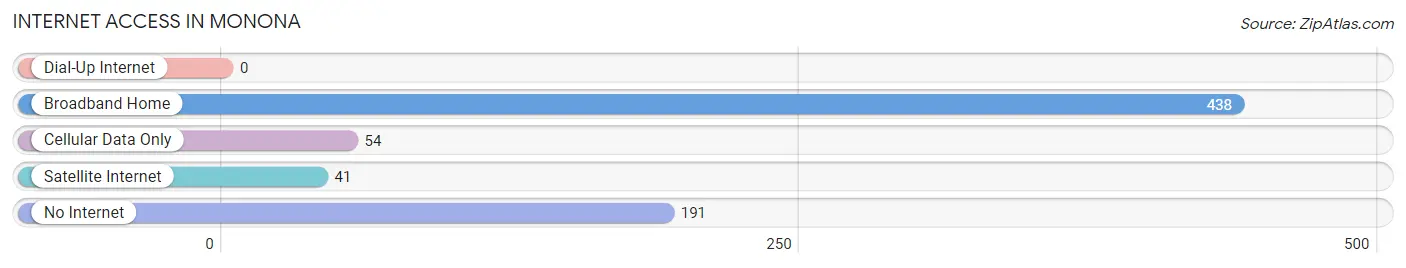
| Internet Type | # Households | % Households |
| Dial-Up Internet | 0 | 0.0% |
| Broadband Home | 438 | 61.2% |
| Cellular Data Only | 54 | 7.5% |
| Satellite Internet | 41 | 5.7% |
| No Internet | 191 | 26.7% |
| Total | 716 | 100.0% |
Monona Summary
Monona, Iowa is a small city located in Clayton County, Iowa. It is situated on the banks of the Upper Iowa River and is home to a population of approximately 1,500 people. The city is known for its rich history, beautiful geography, and vibrant economy.
History
Monona was founded in 1856 by a group of settlers from Wisconsin. The city was named after the Native American word for “beautiful”. The settlers were attracted to the area due to its fertile soil and abundant natural resources. The city quickly grew and by the late 1800s, it had become a thriving agricultural and industrial center.
The city was also home to a number of businesses, including a flour mill, a sawmill, a brickyard, and a creamery. In the early 1900s, the city was home to a number of churches, schools, and other civic organizations.
In the 1920s, the city experienced a period of growth and prosperity. The population increased from 1,000 to 1,500 and the city was home to a number of businesses, including a bank, a hotel, a movie theater, and a variety of stores.
The Great Depression hit Monona hard, and the city experienced a period of decline. The population decreased and many businesses closed. However, the city was able to recover and by the 1950s, it had become a thriving agricultural center once again.
Geography
Monona is located in the Upper Iowa River Valley, which is known for its rolling hills and lush green valleys. The city is surrounded by a number of small towns and villages, including Luana, Farmersburg, and Marquette.
The city is located in a temperate climate zone, with hot summers and cold winters. The average temperature in the summer is around 75 degrees Fahrenheit, while the average temperature in the winter is around 25 degrees Fahrenheit.
The city is home to a number of parks and recreational areas, including the Monona City Park, which features a playground, picnic areas, and a walking trail. The city is also home to a number of historic sites, including the Monona County Courthouse, which was built in 1856.
Economy
Monona’s economy is largely based on agriculture and manufacturing. The city is home to a number of farms, which produce a variety of crops, including corn, soybeans, and hay. The city is also home to a number of manufacturing companies, which produce a variety of products, including furniture, clothing, and automotive parts.
The city is also home to a number of small businesses, including restaurants, shops, and other services. The city is also home to a number of banks, which provide financial services to the local community.
Demographics
As of the 2010 census, the population of Monona was 1,500. The population is largely white (97.3%), with a small percentage of African Americans (1.3%) and Hispanics (1.3%). The median household income is $41,250, and the median age is 43.
Monona is a small city with a rich history, beautiful geography, and vibrant economy. The city is home to a diverse population and a variety of businesses and services. The city is a great place to live, work, and raise a family.
Common Questions
What is Per Capita Income in Monona?
Per Capita income in Monona is $35,032.
What is the Median Family Income in Monona?
Median Family Income in Monona is $90,250.
What is the Median Household income in Monona?
Median Household Income in Monona is $53,250.
What is Income or Wage Gap in Monona?
Income or Wage Gap in Monona is 30.4%.
Women in Monona earn 69.6 cents for every dollar earned by a man.
What is Inequality or Gini Index in Monona?
Inequality or Gini Index in Monona is 0.41.
What is the Total Population of Monona?
Total Population of Monona is 1,571.
What is the Total Male Population of Monona?
Total Male Population of Monona is 738.
What is the Total Female Population of Monona?
Total Female Population of Monona is 833.
What is the Ratio of Males per 100 Females in Monona?
There are 88.60 Males per 100 Females in Monona.
What is the Ratio of Females per 100 Males in Monona?
There are 112.87 Females per 100 Males in Monona.
What is the Median Population Age in Monona?
Median Population Age in Monona is 43.6 Years.
What is the Average Family Size in Monona
Average Family Size in Monona is 2.8 People.
What is the Average Household Size in Monona
Average Household Size in Monona is 2.2 People.
How Large is the Labor Force in Monona?
There are 855 People in the Labor Forcein in Monona.
What is the Percentage of People in the Labor Force in Monona?
68.5% of People are in the Labor Force in Monona.
What is the Unemployment Rate in Monona?
Unemployment Rate in Monona is 1.3%.