Clarinda, IA Map & Demographics
Clarinda Map
Clarinda Overview
$26,662
PER CAPITA INCOME
$69,375
AVG FAMILY INCOME
$51,413
AVG HOUSEHOLD INCOME
26.7%
WAGE / INCOME GAP [ % ]
73.3¢/ $1
WAGE / INCOME GAP [ $ ]
0.43
INEQUALITY / GINI INDEX
5,371
TOTAL POPULATION
3,040
MALE POPULATION
2,331
FEMALE POPULATION
130.42
MALES / 100 FEMALES
76.68
FEMALES / 100 MALES
41.0
MEDIAN AGE
3.1
AVG FAMILY SIZE
2.3
AVG HOUSEHOLD SIZE
2,326
LABOR FORCE [ PEOPLE ]
51.3%
PERCENT IN LABOR FORCE
11.0%
UNEMPLOYMENT RATE
Clarinda Zip Codes
Clarinda Area Codes
Income in Clarinda
Income Overview in Clarinda
Per Capita Income in Clarinda is $26,662, while median incomes of families and households are $69,375 and $51,413 respectively.
| Characteristic | Number | Measure |
| Per Capita Income | 5,371 | $26,662 |
| Median Family Income | 1,110 | $69,375 |
| Mean Family Income | 1,110 | $87,397 |
| Median Household Income | 1,980 | $51,413 |
| Mean Household Income | 1,980 | $67,054 |
| Income Deficit | 1,110 | $0 |
| Wage / Income Gap (%) | 5,371 | 26.65% |
| Wage / Income Gap ($) | 5,371 | 73.35¢ per $1 |
| Gini / Inequality Index | 5,371 | 0.43 |
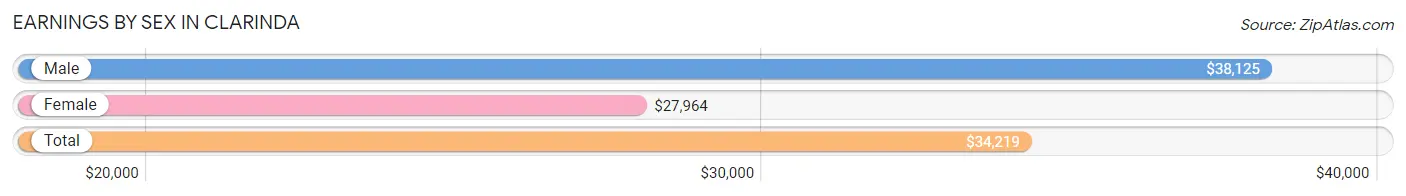
Earnings by Sex in Clarinda
Average Earnings in Clarinda are $34,219, $38,125 for men and $27,964 for women, a difference of 26.7%.
| Sex | Number | Average Earnings |
| Male | 1,480 (59.7%) | $38,125 |
| Female | 999 (40.3%) | $27,964 |
| Total | 2,479 (100.0%) | $34,219 |
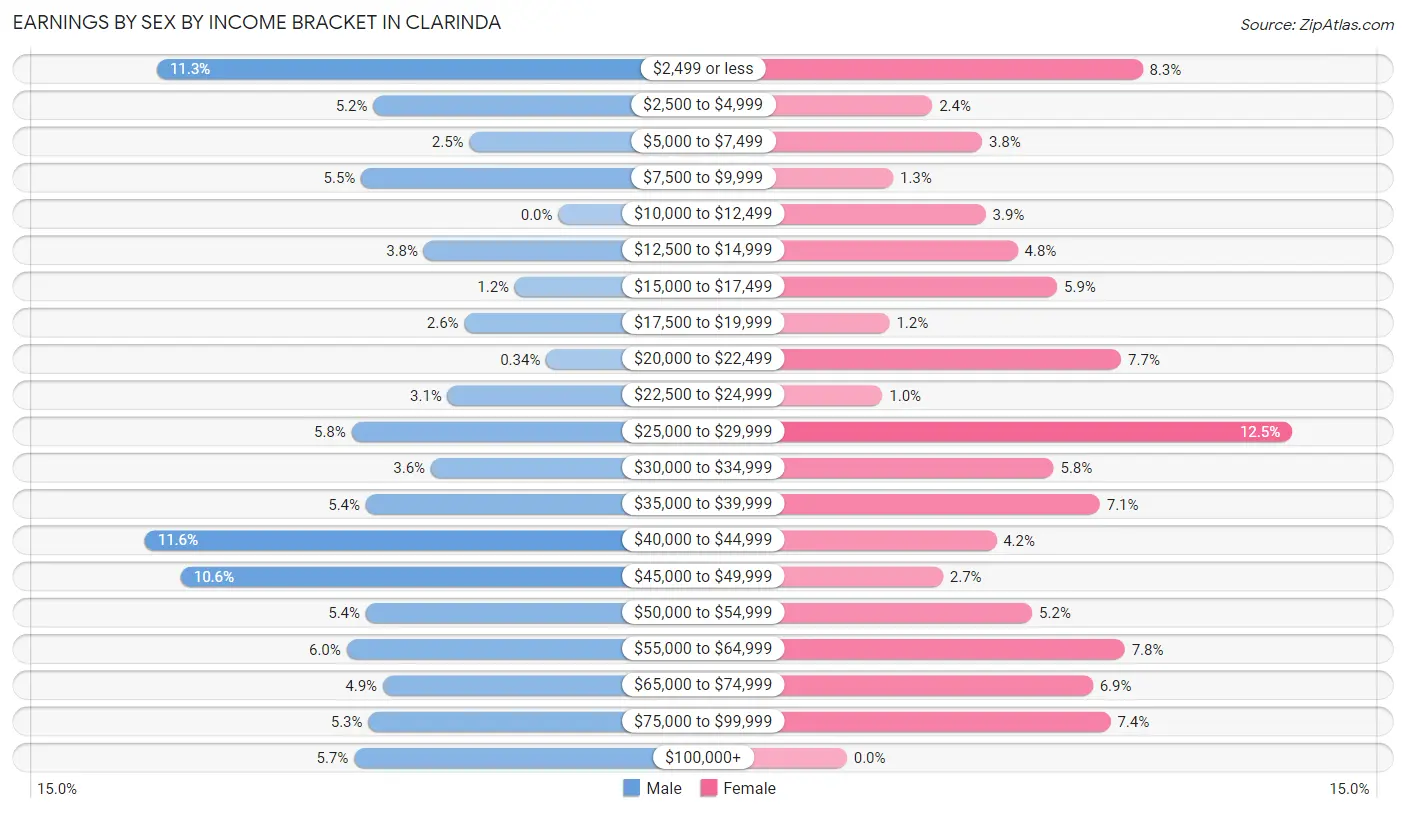
Earnings by Sex by Income Bracket in Clarinda
The most common earnings brackets in Clarinda are $40,000 to $44,999 for men (172 | 11.6%) and $25,000 to $29,999 for women (125 | 12.5%).
| Income | Male | Female |
| $2,499 or less | 167 (11.3%) | 83 (8.3%) |
| $2,500 to $4,999 | 77 (5.2%) | 24 (2.4%) |
| $5,000 to $7,499 | 37 (2.5%) | 38 (3.8%) |
| $7,500 to $9,999 | 82 (5.5%) | 13 (1.3%) |
| $10,000 to $12,499 | 0 (0.0%) | 39 (3.9%) |
| $12,500 to $14,999 | 56 (3.8%) | 48 (4.8%) |
| $15,000 to $17,499 | 18 (1.2%) | 59 (5.9%) |
| $17,500 to $19,999 | 39 (2.6%) | 12 (1.2%) |
| $20,000 to $22,499 | 5 (0.3%) | 77 (7.7%) |
| $22,500 to $24,999 | 46 (3.1%) | 10 (1.0%) |
| $25,000 to $29,999 | 86 (5.8%) | 125 (12.5%) |
| $30,000 to $34,999 | 53 (3.6%) | 58 (5.8%) |
| $35,000 to $39,999 | 80 (5.4%) | 71 (7.1%) |
| $40,000 to $44,999 | 172 (11.6%) | 42 (4.2%) |
| $45,000 to $49,999 | 157 (10.6%) | 27 (2.7%) |
| $50,000 to $54,999 | 80 (5.4%) | 52 (5.2%) |
| $55,000 to $64,999 | 88 (5.9%) | 78 (7.8%) |
| $65,000 to $74,999 | 73 (4.9%) | 69 (6.9%) |
| $75,000 to $99,999 | 79 (5.3%) | 74 (7.4%) |
| $100,000+ | 85 (5.7%) | 0 (0.0%) |
| Total | 1,480 (100.0%) | 999 (100.0%) |
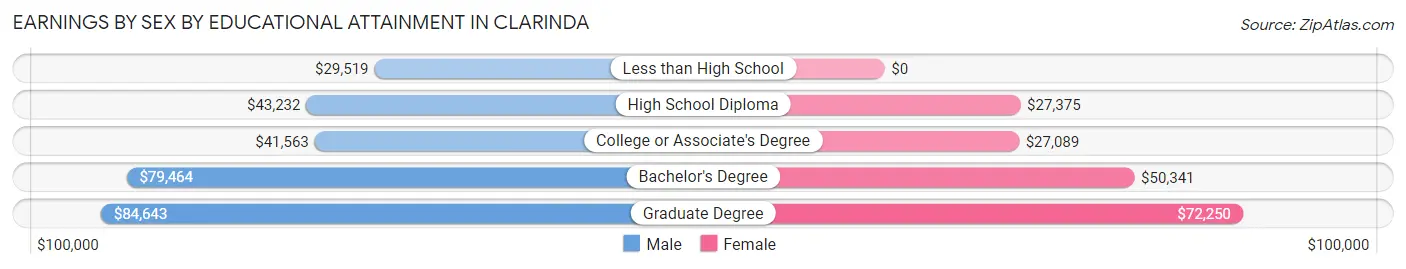
Earnings by Sex by Educational Attainment in Clarinda
Average earnings in Clarinda are $43,589 for men and $31,571 for women, a difference of 27.6%. Men with an educational attainment of graduate degree enjoy the highest average annual earnings of $84,643, while those with less than high school education earn the least with $29,519. Women with an educational attainment of graduate degree earn the most with the average annual earnings of $72,250, while those with college or associate's degree education have the smallest earnings of $27,089.
| Educational Attainment | Male Income | Female Income |
| Less than High School | $29,519 | $0 |
| High School Diploma | $43,232 | $27,375 |
| College or Associate's Degree | $41,563 | $27,089 |
| Bachelor's Degree | $79,464 | $50,341 |
| Graduate Degree | $84,643 | $72,250 |
| Total | $43,589 | $31,571 |
Family Income in Clarinda
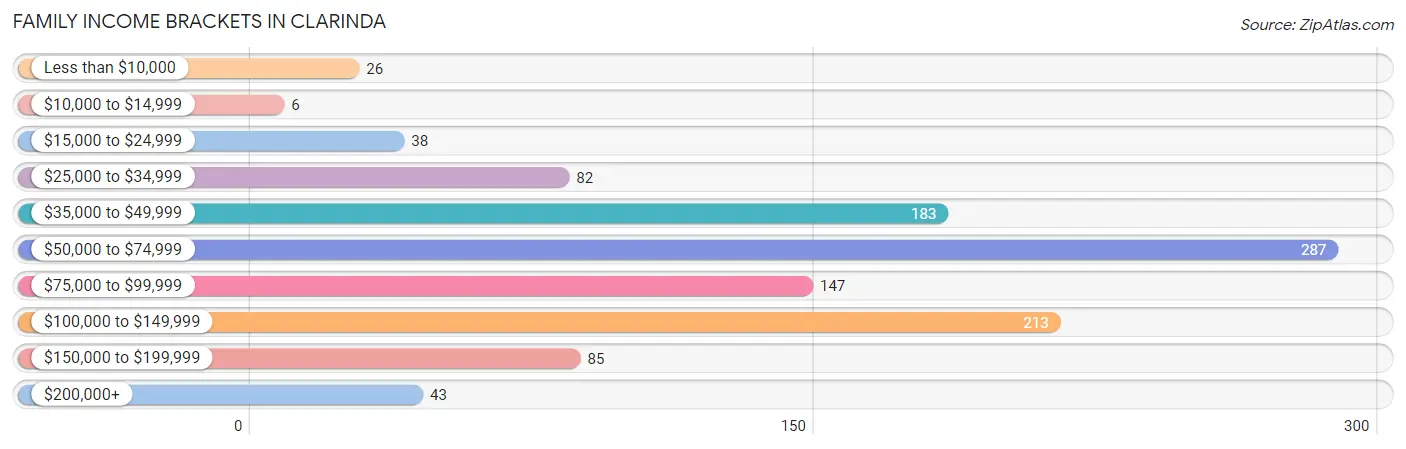
Family Income Brackets in Clarinda
According to the Clarinda family income data, there are 287 families falling into the $50,000 to $74,999 income range, which is the most common income bracket and makes up 25.9% of all families. Conversely, the $10,000 to $14,999 income bracket is the least frequent group with only 6 families (0.5%) belonging to this category.
| Income Bracket | # Families | % Families |
| Less than $10,000 | 26 | 2.3% |
| $10,000 to $14,999 | 6 | 0.5% |
| $15,000 to $24,999 | 38 | 3.4% |
| $25,000 to $34,999 | 82 | 7.4% |
| $35,000 to $49,999 | 183 | 16.5% |
| $50,000 to $74,999 | 287 | 25.9% |
| $75,000 to $99,999 | 147 | 13.2% |
| $100,000 to $149,999 | 213 | 19.2% |
| $150,000 to $199,999 | 85 | 7.7% |
| $200,000+ | 43 | 3.9% |
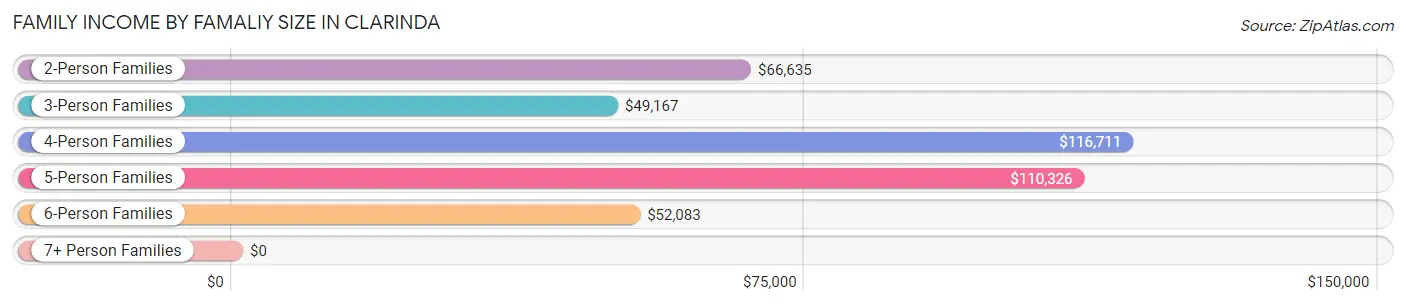
Family Income by Famaliy Size in Clarinda
4-person families (230 | 20.7%) account for the highest median family income in Clarinda with $116,711 per family, while 2-person families (585 | 52.7%) have the highest median income of $33,318 per family member.
| Income Bracket | # Families | Median Income |
| 2-Person Families | 585 (52.7%) | $66,635 |
| 3-Person Families | 158 (14.2%) | $49,167 |
| 4-Person Families | 230 (20.7%) | $116,711 |
| 5-Person Families | 82 (7.4%) | $110,326 |
| 6-Person Families | 55 (5.0%) | $52,083 |
| 7+ Person Families | 0 (0.0%) | $0 |
| Total | 1,110 (100.0%) | $69,375 |
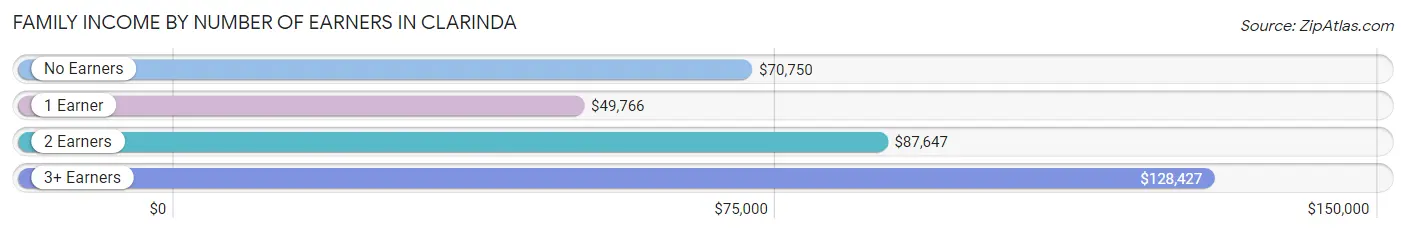
Family Income by Number of Earners in Clarinda
The median family income in Clarinda is $69,375, with families comprising 3+ earners (121) having the highest median family income of $128,427, while families with 1 earner (390) have the lowest median family income of $49,766, accounting for 10.9% and 35.1% of families, respectively.
| Number of Earners | # Families | Median Income |
| No Earners | 195 (17.6%) | $70,750 |
| 1 Earner | 390 (35.1%) | $49,766 |
| 2 Earners | 404 (36.4%) | $87,647 |
| 3+ Earners | 121 (10.9%) | $128,427 |
| Total | 1,110 (100.0%) | $69,375 |
Household Income in Clarinda
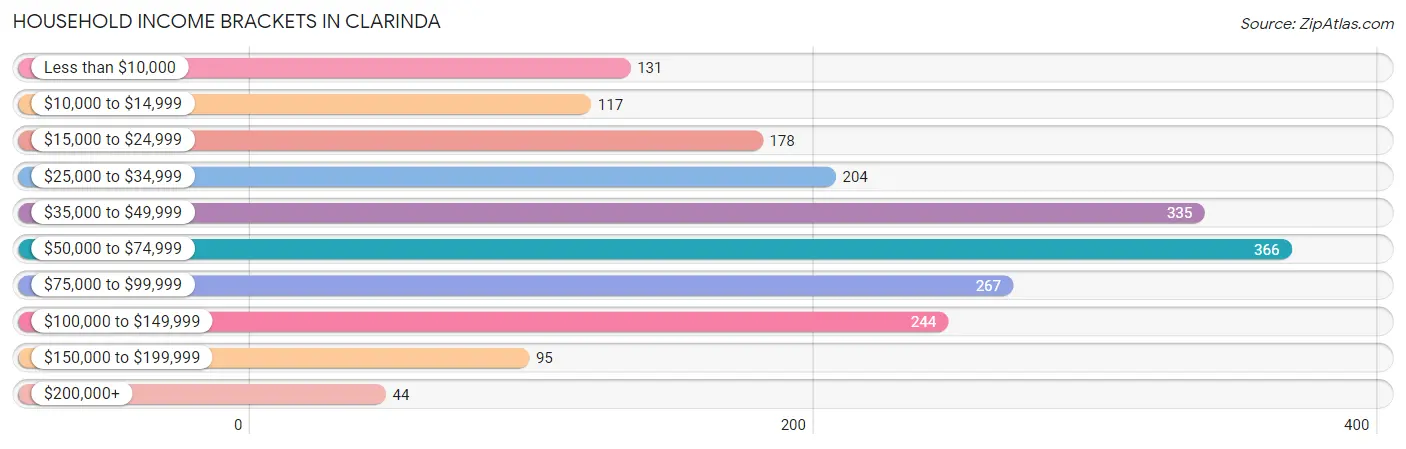
Household Income Brackets in Clarinda
With 366 households falling in the category, the $50,000 to $74,999 income range is the most frequent in Clarinda, accounting for 18.5% of all households. In contrast, only 44 households (2.2%) fall into the $200,000+ income bracket, making it the least populous group.
| Income Bracket | # Households | % Households |
| Less than $10,000 | 131 | 6.6% |
| $10,000 to $14,999 | 117 | 5.9% |
| $15,000 to $24,999 | 178 | 9.0% |
| $25,000 to $34,999 | 204 | 10.3% |
| $35,000 to $49,999 | 335 | 16.9% |
| $50,000 to $74,999 | 366 | 18.5% |
| $75,000 to $99,999 | 267 | 13.5% |
| $100,000 to $149,999 | 244 | 12.3% |
| $150,000 to $199,999 | 95 | 4.8% |
| $200,000+ | 44 | 2.2% |
Household Income by Householder Age in Clarinda
The median household income in Clarinda is $51,413, with the highest median household income of $58,929 found in the 45 to 64 years age bracket for the primary householder. A total of 658 households (33.2%) fall into this category. Meanwhile, the 15 to 24 years age bracket for the primary householder has the lowest median household income of $0, with 81 households (4.1%) in this group.
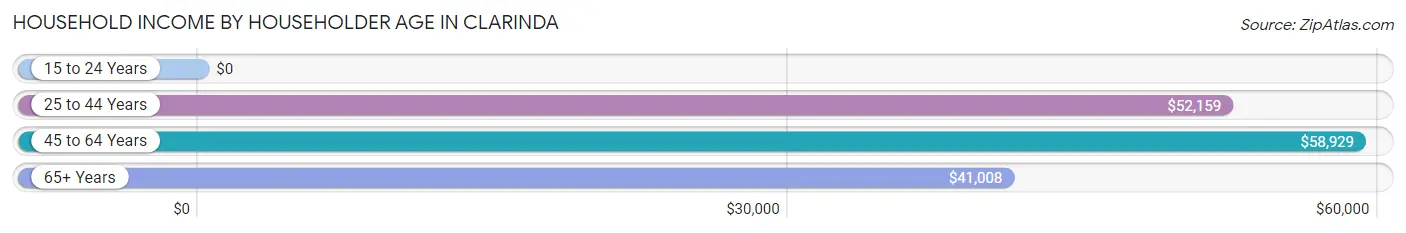
| Income Bracket | # Households | Median Income |
| 15 to 24 Years | 81 (4.1%) | $0 |
| 25 to 44 Years | 570 (28.8%) | $52,159 |
| 45 to 64 Years | 658 (33.2%) | $58,929 |
| 65+ Years | 671 (33.9%) | $41,008 |
| Total | 1,980 (100.0%) | $51,413 |
Poverty in Clarinda
Income Below Poverty by Sex and Age in Clarinda
With 13.8% poverty level for males and 9.8% for females among the residents of Clarinda, 35 to 44 year old males and 15 year old females are the most vulnerable to poverty, with 107 males (37.3%) and 10 females (66.7%) in their respective age groups living below the poverty level.
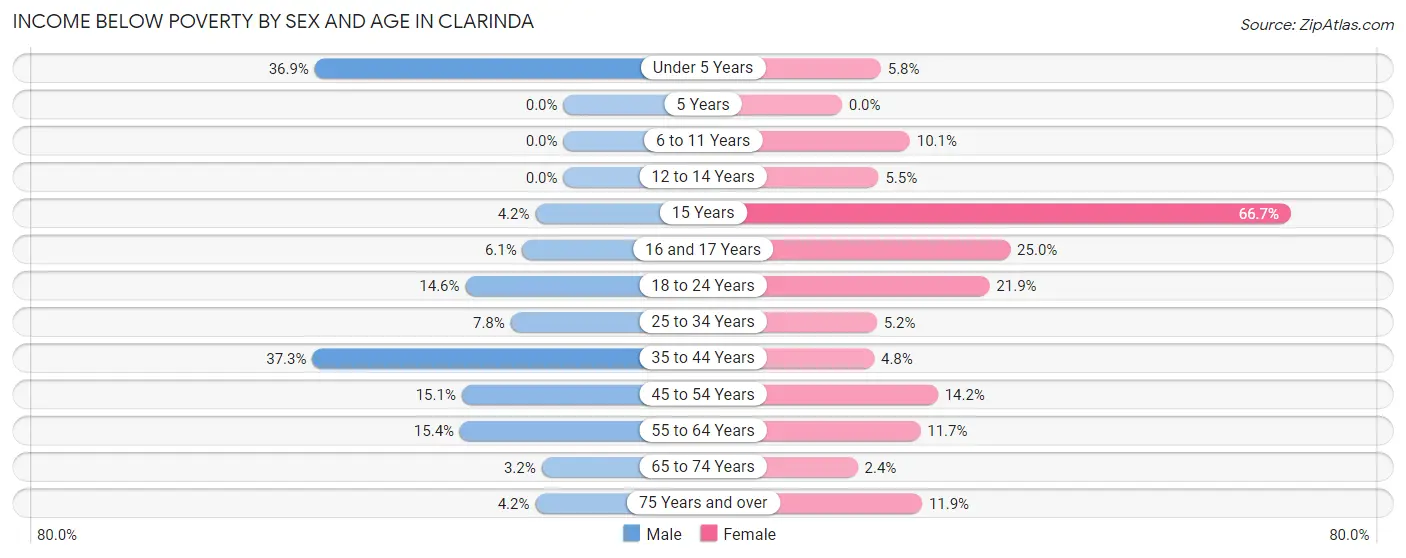
| Age Bracket | Male | Female |
| Under 5 Years | 48 (36.9%) | 7 (5.8%) |
| 5 Years | 0 (0.0%) | 0 (0.0%) |
| 6 to 11 Years | 0 (0.0%) | 10 (10.1%) |
| 12 to 14 Years | 0 (0.0%) | 6 (5.4%) |
| 15 Years | 2 (4.2%) | 10 (66.7%) |
| 16 and 17 Years | 8 (6.1%) | 7 (25.0%) |
| 18 to 24 Years | 31 (14.5%) | 32 (21.9%) |
| 25 to 34 Years | 26 (7.8%) | 10 (5.2%) |
| 35 to 44 Years | 107 (37.3%) | 14 (4.8%) |
| 45 to 54 Years | 35 (15.1%) | 41 (14.2%) |
| 55 to 64 Years | 45 (15.4%) | 38 (11.7%) |
| 65 to 74 Years | 8 (3.2%) | 6 (2.4%) |
| 75 Years and over | 8 (4.2%) | 40 (11.9%) |
| Total | 318 (13.8%) | 221 (9.8%) |
Income Above Poverty by Sex and Age in Clarinda
According to the poverty statistics in Clarinda, males aged 5 years and females aged 5 years are the age groups that are most secure financially, with 100.0% of males and 100.0% of females in these age groups living above the poverty line.
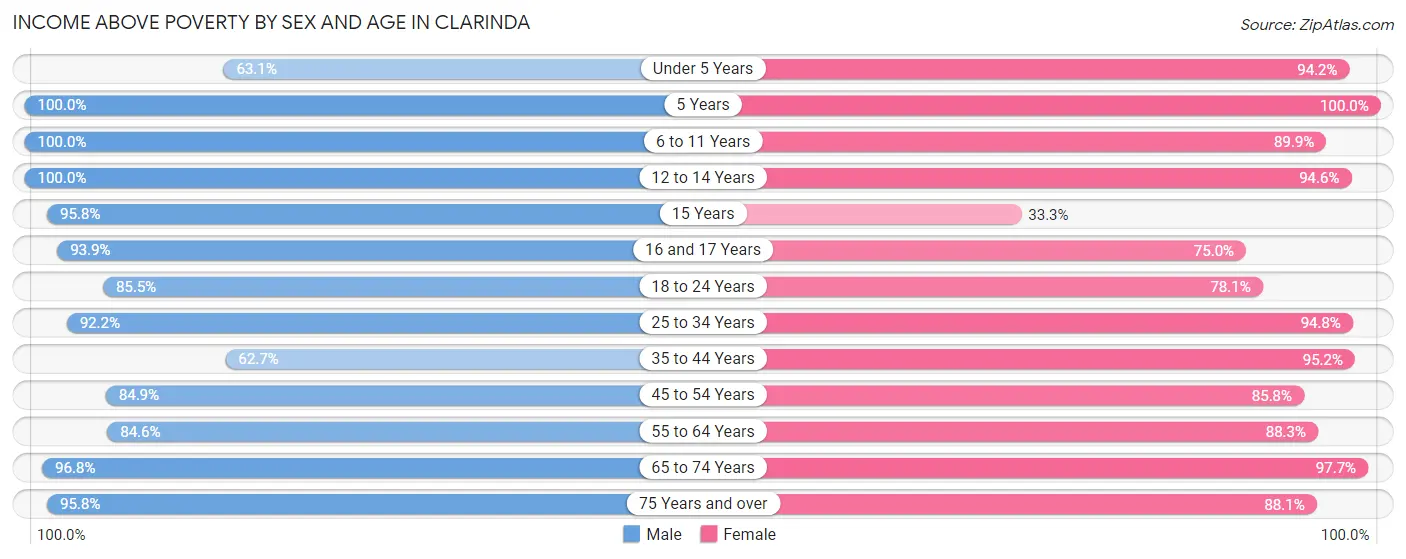
| Age Bracket | Male | Female |
| Under 5 Years | 82 (63.1%) | 114 (94.2%) |
| 5 Years | 23 (100.0%) | 39 (100.0%) |
| 6 to 11 Years | 144 (100.0%) | 89 (89.9%) |
| 12 to 14 Years | 33 (100.0%) | 104 (94.6%) |
| 15 Years | 46 (95.8%) | 5 (33.3%) |
| 16 and 17 Years | 124 (93.9%) | 21 (75.0%) |
| 18 to 24 Years | 182 (85.5%) | 114 (78.1%) |
| 25 to 34 Years | 306 (92.2%) | 183 (94.8%) |
| 35 to 44 Years | 180 (62.7%) | 278 (95.2%) |
| 45 to 54 Years | 197 (84.9%) | 247 (85.8%) |
| 55 to 64 Years | 248 (84.6%) | 288 (88.3%) |
| 65 to 74 Years | 239 (96.8%) | 249 (97.7%) |
| 75 Years and over | 184 (95.8%) | 296 (88.1%) |
| Total | 1,988 (86.2%) | 2,027 (90.2%) |
Income Below Poverty Among Married-Couple Families in Clarinda
The poverty statistics for married-couple families in Clarinda show that 2.8% or 23 of the total 825 families live below the poverty line. Families with 3 or 4 children have the highest poverty rate of 10.6%, comprising of 9 families. On the other hand, families with 1 or 2 children have the lowest poverty rate of 0.0%, which includes 0 families.
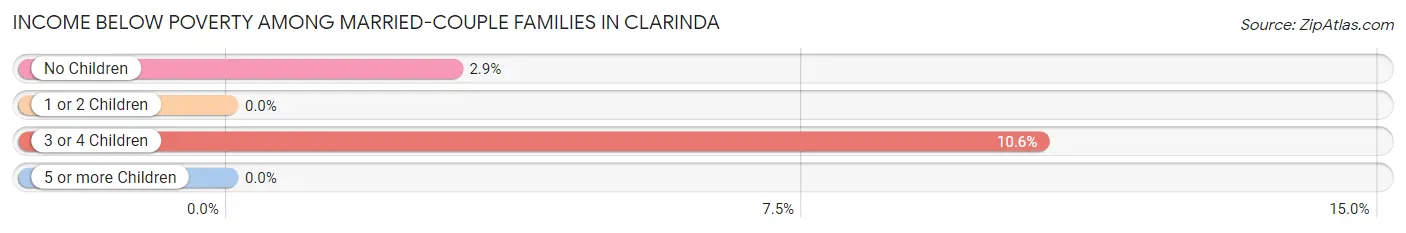
| Children | Above Poverty | Below Poverty |
| No Children | 464 (97.1%) | 14 (2.9%) |
| 1 or 2 Children | 262 (100.0%) | 0 (0.0%) |
| 3 or 4 Children | 76 (89.4%) | 9 (10.6%) |
| 5 or more Children | 0 (0.0%) | 0 (0.0%) |
| Total | 802 (97.2%) | 23 (2.8%) |
Income Below Poverty Among Single-Parent Households in Clarinda
According to the poverty data in Clarinda, 19.2% or 23 single-father households and 21.2% or 35 single-mother households are living below the poverty line. Among single-father households, those with no children have the highest poverty rate, with 23 households (35.9%) experiencing poverty. Likewise, among single-mother households, those with 1 or 2 children have the highest poverty rate, with 30 households (34.9%) falling below the poverty line.
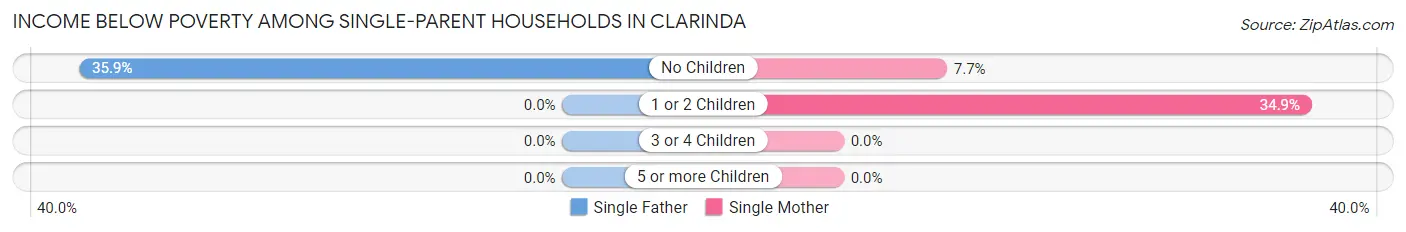
| Children | Single Father | Single Mother |
| No Children | 23 (35.9%) | 5 (7.7%) |
| 1 or 2 Children | 0 (0.0%) | 30 (34.9%) |
| 3 or 4 Children | 0 (0.0%) | 0 (0.0%) |
| 5 or more Children | 0 (0.0%) | 0 (0.0%) |
| Total | 23 (19.2%) | 35 (21.2%) |
Income Below Poverty Among Married-Couple vs Single-Parent Households in Clarinda
The poverty data for Clarinda shows that 23 of the married-couple family households (2.8%) and 58 of the single-parent households (20.3%) are living below the poverty level. Within the married-couple family households, those with 3 or 4 children have the highest poverty rate, with 9 households (10.6%) falling below the poverty line. Among the single-parent households, those with 1 or 2 children have the highest poverty rate, with 30 household (23.1%) living below poverty.
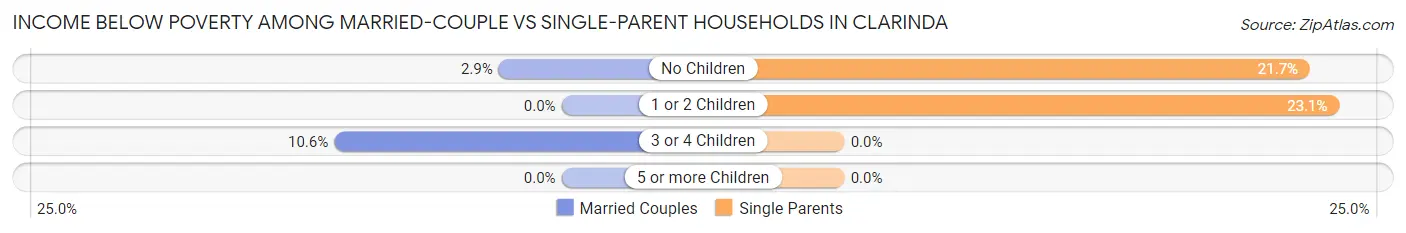
| Children | Married-Couple Families | Single-Parent Households |
| No Children | 14 (2.9%) | 28 (21.7%) |
| 1 or 2 Children | 0 (0.0%) | 30 (23.1%) |
| 3 or 4 Children | 9 (10.6%) | 0 (0.0%) |
| 5 or more Children | 0 (0.0%) | 0 (0.0%) |
| Total | 23 (2.8%) | 58 (20.3%) |
Race in Clarinda
The most populous races in Clarinda are White / Caucasian (4,783 | 89.0%), Hispanic or Latino (226 | 4.2%), and Two or more Races (219 | 4.1%).
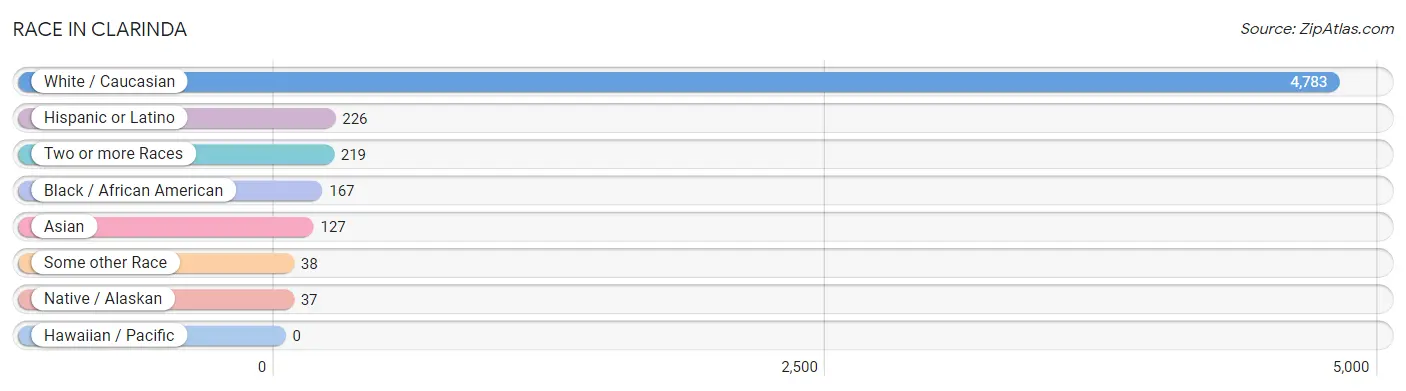
| Race | # Population | % Population |
| Asian | 127 | 2.4% |
| Black / African American | 167 | 3.1% |
| Hawaiian / Pacific | 0 | 0.0% |
| Hispanic or Latino | 226 | 4.2% |
| Native / Alaskan | 37 | 0.7% |
| White / Caucasian | 4,783 | 89.0% |
| Two or more Races | 219 | 4.1% |
| Some other Race | 38 | 0.7% |
| Total | 5,371 | 100.0% |
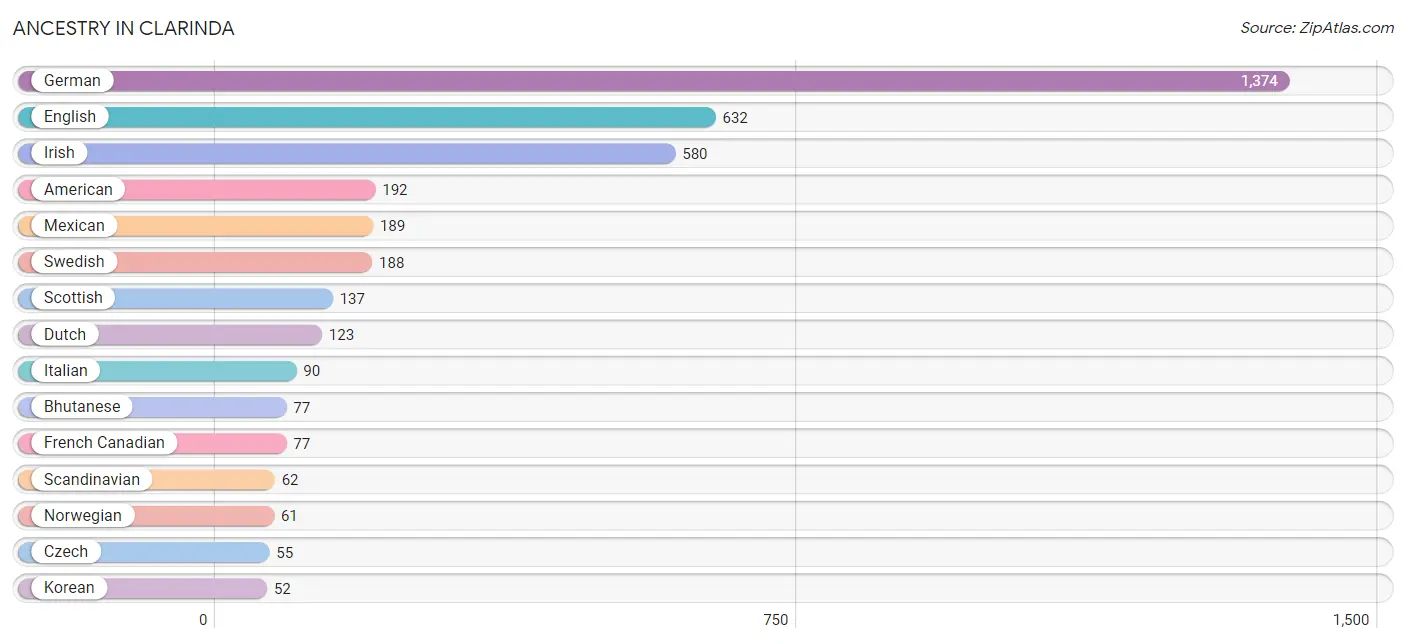
Ancestry in Clarinda
The most populous ancestries reported in Clarinda are German (1,374 | 25.6%), English (632 | 11.8%), Irish (580 | 10.8%), American (192 | 3.6%), and Mexican (189 | 3.5%), together accounting for 55.2% of all Clarinda residents.
| Ancestry | # Population | % Population |
| American | 192 | 3.6% |
| Arab | 9 | 0.2% |
| Bhutanese | 77 | 1.4% |
| Blackfeet | 2 | 0.0% |
| British | 7 | 0.1% |
| Burmese | 27 | 0.5% |
| Canadian | 7 | 0.1% |
| Central American | 10 | 0.2% |
| Cherokee | 29 | 0.5% |
| Crow | 3 | 0.1% |
| Cuban | 9 | 0.2% |
| Czech | 55 | 1.0% |
| Danish | 17 | 0.3% |
| Dutch | 123 | 2.3% |
| Eastern European | 13 | 0.2% |
| English | 632 | 11.8% |
| European | 37 | 0.7% |
| French | 18 | 0.3% |
| French Canadian | 77 | 1.4% |
| German | 1,374 | 25.6% |
| Guatemalan | 10 | 0.2% |
| Hungarian | 6 | 0.1% |
| Irish | 580 | 10.8% |
| Italian | 90 | 1.7% |
| Korean | 52 | 1.0% |
| Malaysian | 8 | 0.2% |
| Mexican | 189 | 3.5% |
| Northern European | 7 | 0.1% |
| Norwegian | 61 | 1.1% |
| Pakistani | 4 | 0.1% |
| Pennsylvania German | 6 | 0.1% |
| Polish | 23 | 0.4% |
| Potawatomi | 9 | 0.2% |
| Puerto Rican | 14 | 0.3% |
| Scandinavian | 62 | 1.1% |
| Scotch-Irish | 23 | 0.4% |
| Scottish | 137 | 2.5% |
| Sioux | 3 | 0.1% |
| Spaniard | 1 | 0.0% |
| Sri Lankan | 22 | 0.4% |
| Swedish | 188 | 3.5% |
| Swiss | 18 | 0.3% |
| Syrian | 9 | 0.2% |
| Welsh | 27 | 0.5% | View All 44 Rows |
Immigrants in Clarinda
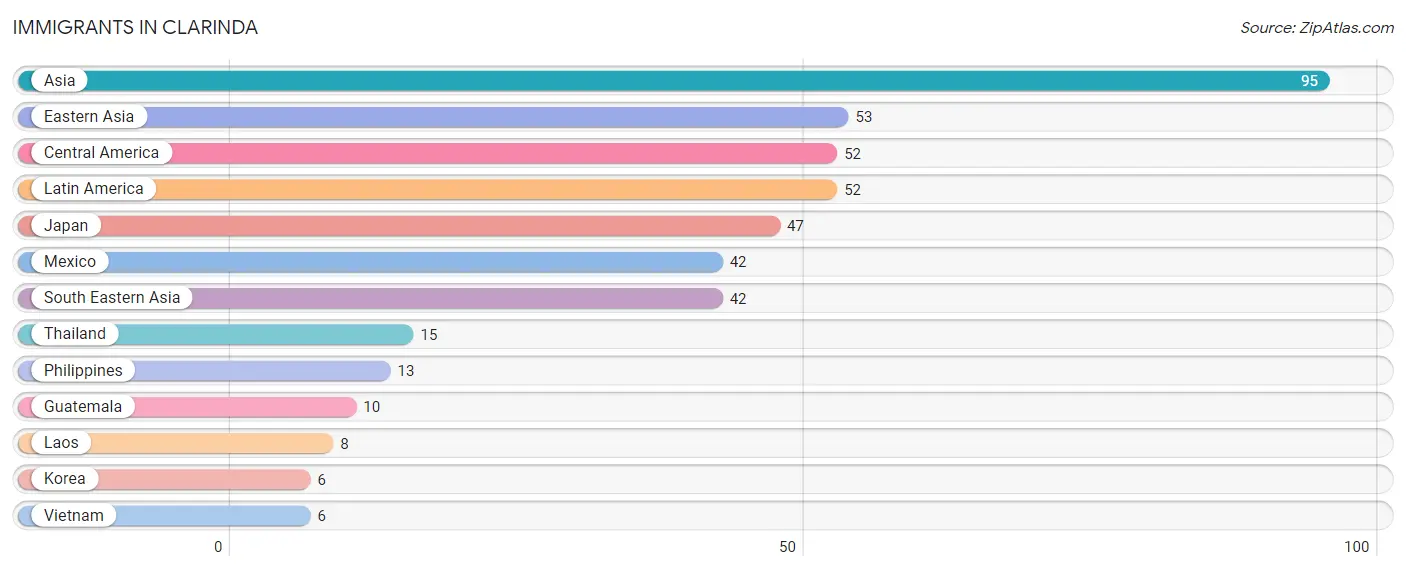
The most numerous immigrant groups reported in Clarinda came from Asia (95 | 1.8%), Eastern Asia (53 | 1.0%), Central America (52 | 1.0%), Latin America (52 | 1.0%), and Japan (47 | 0.9%), together accounting for 5.6% of all Clarinda residents.
| Immigration Origin | # Population | % Population |
| Asia | 95 | 1.8% |
| Central America | 52 | 1.0% |
| Eastern Asia | 53 | 1.0% |
| Guatemala | 10 | 0.2% |
| Japan | 47 | 0.9% |
| Korea | 6 | 0.1% |
| Laos | 8 | 0.2% |
| Latin America | 52 | 1.0% |
| Mexico | 42 | 0.8% |
| Philippines | 13 | 0.2% |
| South Eastern Asia | 42 | 0.8% |
| Thailand | 15 | 0.3% |
| Vietnam | 6 | 0.1% | View All 13 Rows |
Sex and Age in Clarinda
Sex and Age in Clarinda
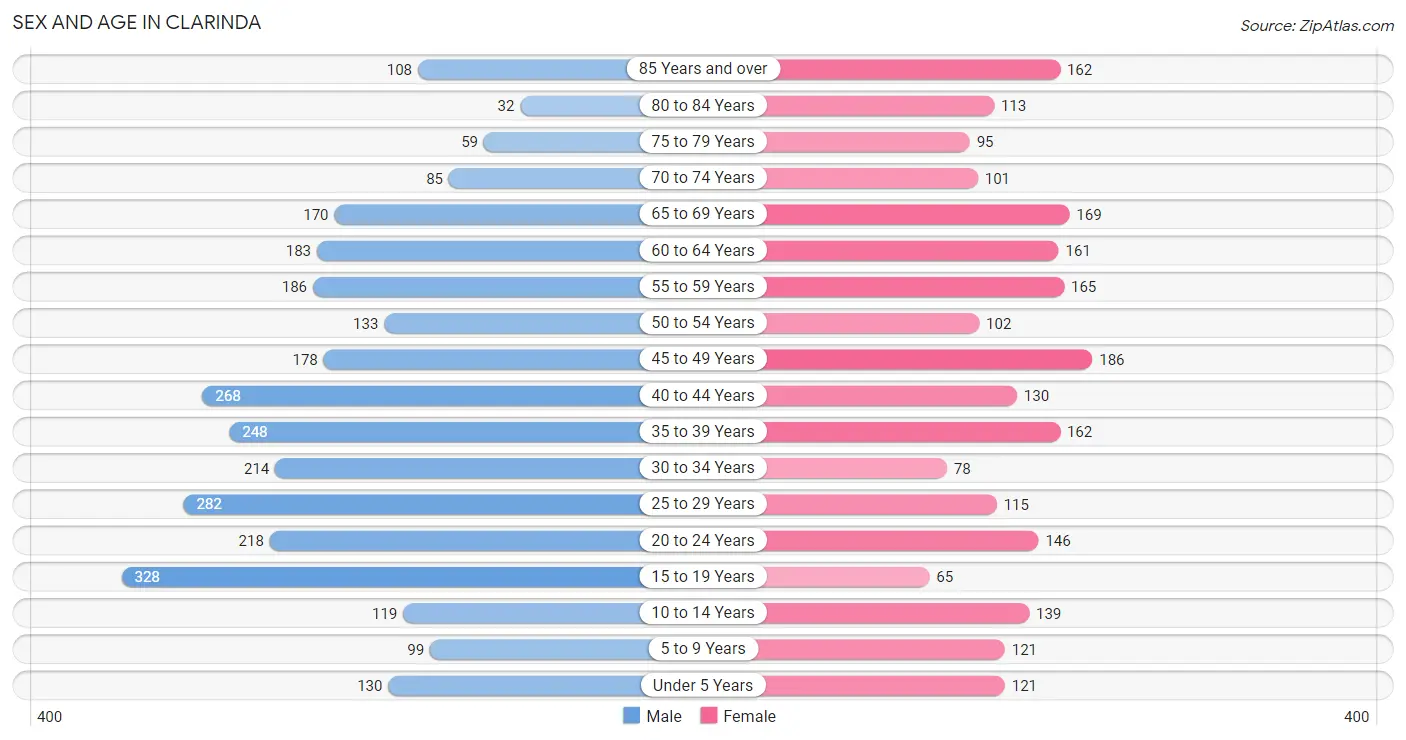
The most populous age groups in Clarinda are 15 to 19 Years (328 | 10.8%) for men and 45 to 49 Years (186 | 8.0%) for women.
| Age Bracket | Male | Female |
| Under 5 Years | 130 (4.3%) | 121 (5.2%) |
| 5 to 9 Years | 99 (3.3%) | 121 (5.2%) |
| 10 to 14 Years | 119 (3.9%) | 139 (6.0%) |
| 15 to 19 Years | 328 (10.8%) | 65 (2.8%) |
| 20 to 24 Years | 218 (7.2%) | 146 (6.3%) |
| 25 to 29 Years | 282 (9.3%) | 115 (4.9%) |
| 30 to 34 Years | 214 (7.0%) | 78 (3.4%) |
| 35 to 39 Years | 248 (8.2%) | 162 (7.0%) |
| 40 to 44 Years | 268 (8.8%) | 130 (5.6%) |
| 45 to 49 Years | 178 (5.9%) | 186 (8.0%) |
| 50 to 54 Years | 133 (4.4%) | 102 (4.4%) |
| 55 to 59 Years | 186 (6.1%) | 165 (7.1%) |
| 60 to 64 Years | 183 (6.0%) | 161 (6.9%) |
| 65 to 69 Years | 170 (5.6%) | 169 (7.2%) |
| 70 to 74 Years | 85 (2.8%) | 101 (4.3%) |
| 75 to 79 Years | 59 (1.9%) | 95 (4.1%) |
| 80 to 84 Years | 32 (1.1%) | 113 (4.9%) |
| 85 Years and over | 108 (3.5%) | 162 (7.0%) |
| Total | 3,040 (100.0%) | 2,331 (100.0%) |
Families and Households in Clarinda
Median Family Size in Clarinda
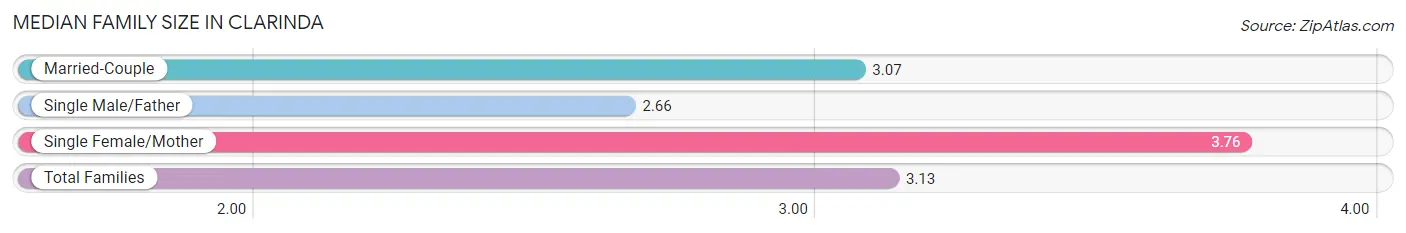
The median family size in Clarinda is 3.13 persons per family, with single female/mother families (165 | 14.9%) accounting for the largest median family size of 3.76 persons per family. On the other hand, single male/father families (120 | 10.8%) represent the smallest median family size with 2.66 persons per family.
| Family Type | # Families | Family Size |
| Married-Couple | 825 (74.3%) | 3.07 |
| Single Male/Father | 120 (10.8%) | 2.66 |
| Single Female/Mother | 165 (14.9%) | 3.76 |
| Total Families | 1,110 (100.0%) | 3.13 |
Median Household Size in Clarinda
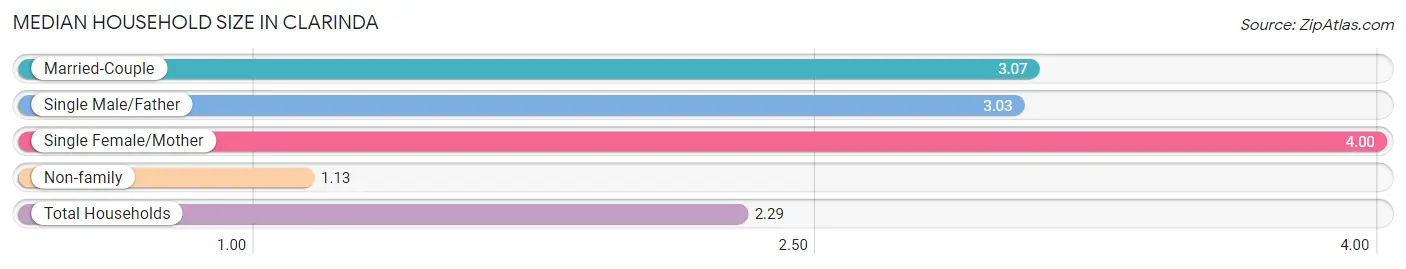
The median household size in Clarinda is 2.29 persons per household, with single female/mother households (165 | 8.3%) accounting for the largest median household size of 4 persons per household. non-family households (870 | 43.9%) represent the smallest median household size with 1.13 persons per household.
| Household Type | # Households | Household Size |
| Married-Couple | 825 (41.7%) | 3.07 |
| Single Male/Father | 120 (6.1%) | 3.03 |
| Single Female/Mother | 165 (8.3%) | 4.00 |
| Non-family | 870 (43.9%) | 1.13 |
| Total Households | 1,980 (100.0%) | 2.29 |
Household Size by Marriage Status in Clarinda
Out of a total of 1,980 households in Clarinda, 1,110 (56.1%) are family households, while 870 (43.9%) are nonfamily households. The most numerous type of family households are 2-person households, comprising 548, and the most common type of nonfamily households are 1-person households, comprising 775.
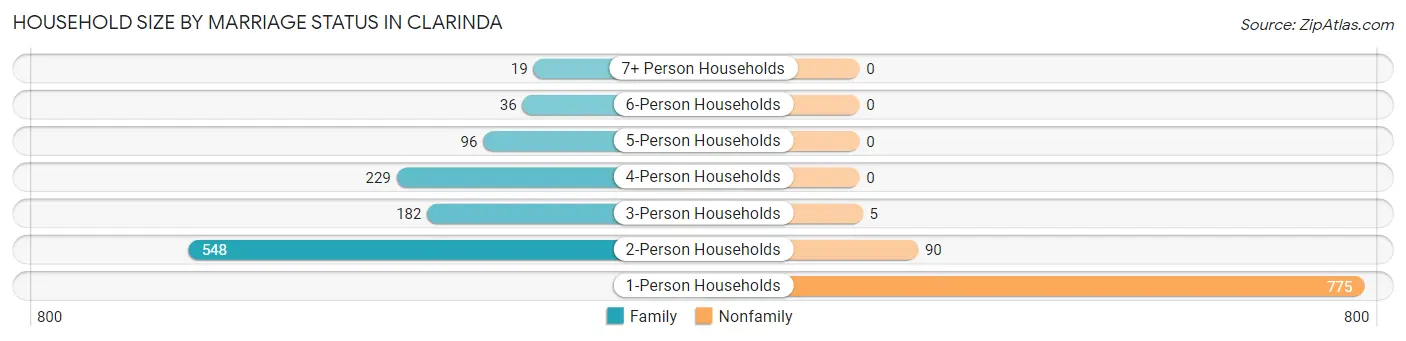
| Household Size | Family Households | Nonfamily Households |
| 1-Person Households | - | 775 (39.1%) |
| 2-Person Households | 548 (27.7%) | 90 (4.5%) |
| 3-Person Households | 182 (9.2%) | 5 (0.3%) |
| 4-Person Households | 229 (11.6%) | 0 (0.0%) |
| 5-Person Households | 96 (4.9%) | 0 (0.0%) |
| 6-Person Households | 36 (1.8%) | 0 (0.0%) |
| 7+ Person Households | 19 (1.0%) | 0 (0.0%) |
| Total | 1,110 (56.1%) | 870 (43.9%) |
Female Fertility in Clarinda
Fertility by Age in Clarinda
Average fertility rate in Clarinda is 23.0 births per 1,000 women. Women in the age bracket of 20 to 34 years have the highest fertility rate with 65.0 births per 1,000 women. Women in the age bracket of 20 to 34 years acount for 100.0% of all women with births.
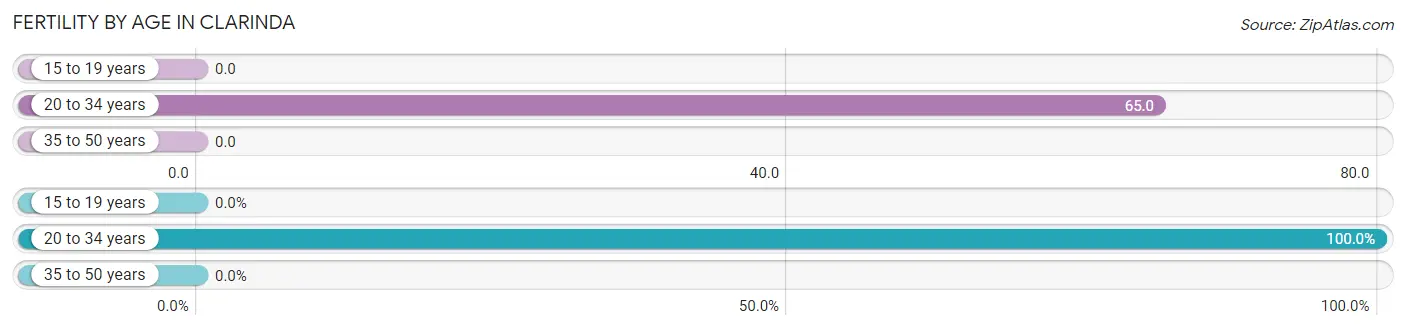
| Age Bracket | Women with Births | Births / 1,000 Women |
| 15 to 19 years | 0 (0.0%) | 0.0 |
| 20 to 34 years | 22 (100.0%) | 65.0 |
| 35 to 50 years | 0 (0.0%) | 0.0 |
| Total | 22 (100.0%) | 23.0 |
Fertility by Age by Marriage Status in Clarinda
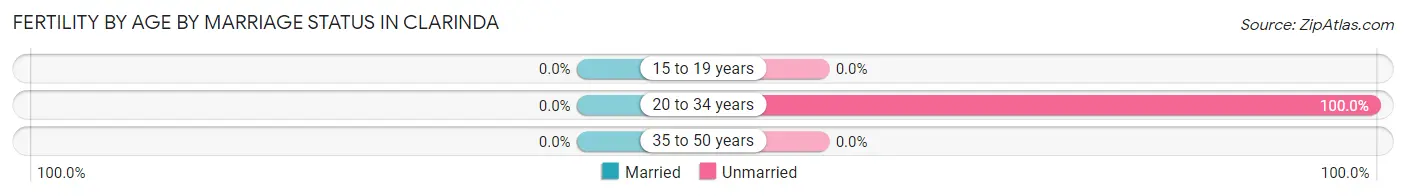
| Age Bracket | Married | Unmarried |
| 15 to 19 years | 0 (0.0%) | 0 (0.0%) |
| 20 to 34 years | 0 (0.0%) | 22 (100.0%) |
| 35 to 50 years | 0 (0.0%) | 0 (0.0%) |
| Total | 0 (0.0%) | 22 (100.0%) |
Fertility by Education in Clarinda
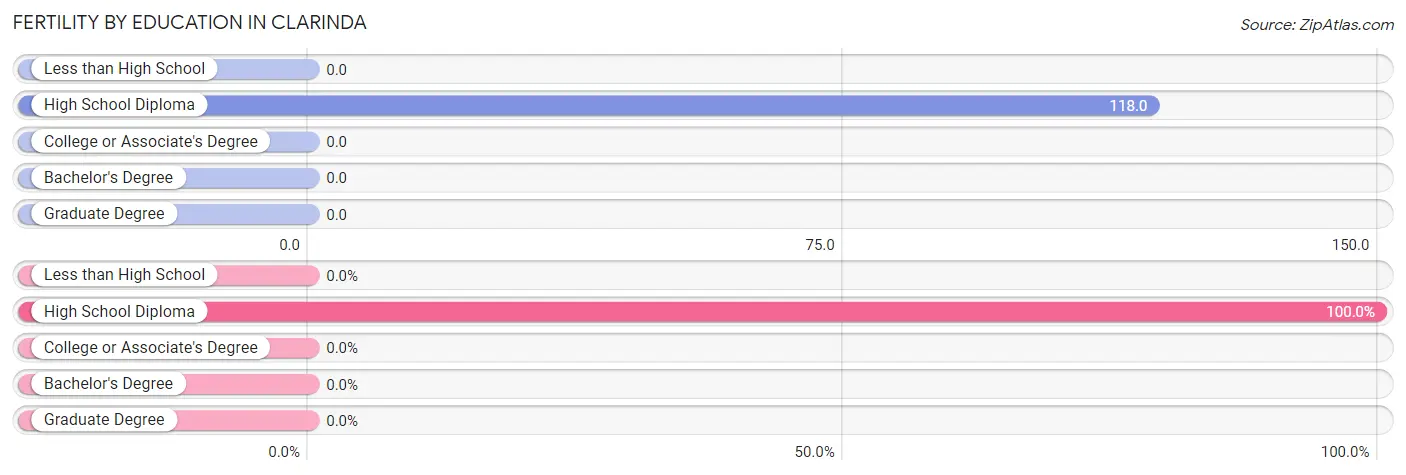
| Educational Attainment | Women with Births | Births / 1,000 Women |
| Less than High School | 0 (0.0%) | 0.0 |
| High School Diploma | 22 (100.0%) | 118.0 |
| College or Associate's Degree | 0 (0.0%) | 0.0 |
| Bachelor's Degree | 0 (0.0%) | 0.0 |
| Graduate Degree | 0 (0.0%) | 0.0 |
| Total | 22 (100.0%) | 23.0 |
Fertility by Education by Marriage Status in Clarinda
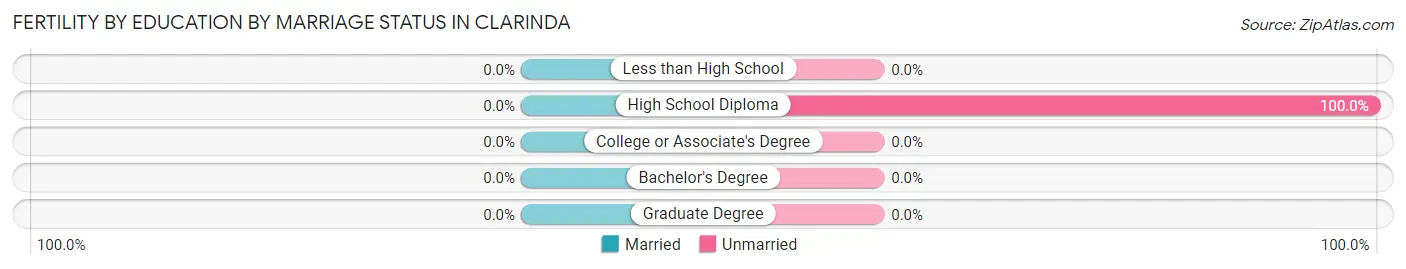
| Educational Attainment | Married | Unmarried |
| Less than High School | 0 (0.0%) | 0 (0.0%) |
| High School Diploma | 0 (0.0%) | 22 (100.0%) |
| College or Associate's Degree | 0 (0.0%) | 0 (0.0%) |
| Bachelor's Degree | 0 (0.0%) | 0 (0.0%) |
| Graduate Degree | 0 (0.0%) | 0 (0.0%) |
| Total | 0 (0.0%) | 22 (100.0%) |
Employment Characteristics in Clarinda
Employment by Class of Employer in Clarinda
Among the 2,070 employed individuals in Clarinda, private company employees (1,508 | 72.9%), not-for-profit organizations (150 | 7.2%), and local government employees (139 | 6.7%) make up the most common classes of employment.
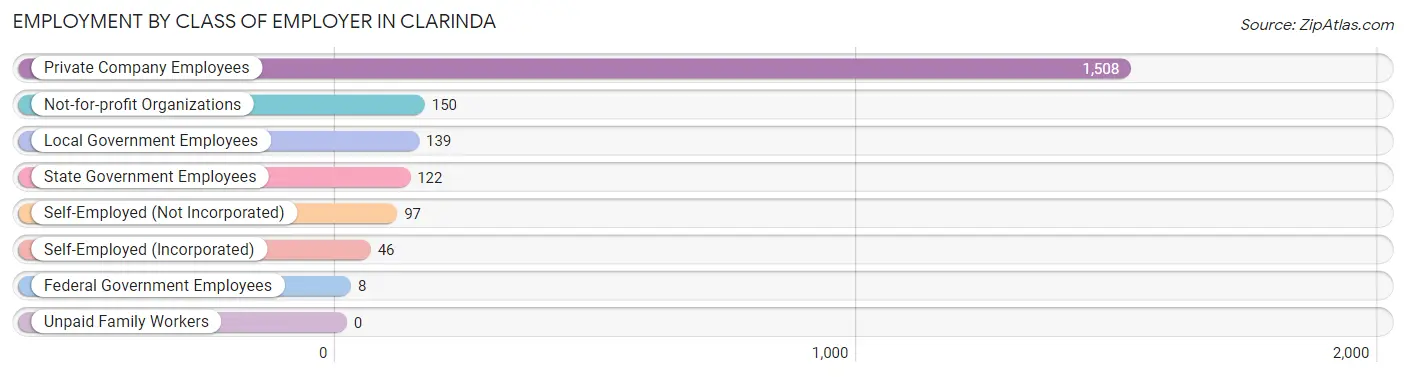
| Employer Class | # Employees | % Employees |
| Private Company Employees | 1,508 | 72.9% |
| Self-Employed (Incorporated) | 46 | 2.2% |
| Self-Employed (Not Incorporated) | 97 | 4.7% |
| Not-for-profit Organizations | 150 | 7.2% |
| Local Government Employees | 139 | 6.7% |
| State Government Employees | 122 | 5.9% |
| Federal Government Employees | 8 | 0.4% |
| Unpaid Family Workers | 0 | 0.0% |
| Total | 2,070 | 100.0% |
Employment Status by Age in Clarinda
According to the labor force statistics for Clarinda, out of the total population over 16 years of age (4,534), 51.3% or 2,326 individuals are in the labor force, with 11.0% or 256 of them unemployed. The age group with the highest labor force participation rate is 20 to 24 years, with 79.9% or 291 individuals in the labor force. Within the labor force, the 20 to 24 years age range has the highest percentage of unemployed individuals, with 35.4% or 103 of them being unemployed.
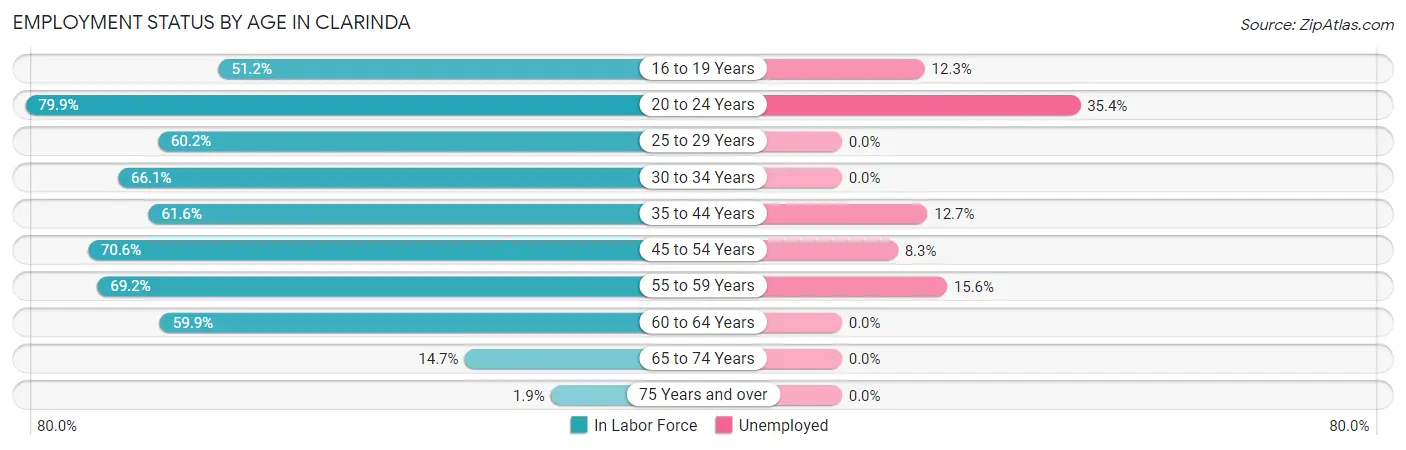
| Age Bracket | In Labor Force | Unemployed |
| 16 to 19 Years | 146 (51.2%) | 18 (12.3%) |
| 20 to 24 Years | 291 (79.9%) | 103 (35.4%) |
| 25 to 29 Years | 239 (60.2%) | 0 (0.0%) |
| 30 to 34 Years | 193 (66.1%) | 0 (0.0%) |
| 35 to 44 Years | 498 (61.6%) | 63 (12.7%) |
| 45 to 54 Years | 423 (70.6%) | 35 (8.3%) |
| 55 to 59 Years | 243 (69.2%) | 38 (15.6%) |
| 60 to 64 Years | 206 (59.9%) | 0 (0.0%) |
| 65 to 74 Years | 77 (14.7%) | 0 (0.0%) |
| 75 Years and over | 11 (1.9%) | 0 (0.0%) |
| Total | 2,326 (51.3%) | 256 (11.0%) |
Employment Status by Educational Attainment in Clarinda
According to labor force statistics for Clarinda, 64.6% of individuals (1,803) out of the total population between 25 and 64 years of age (2,791) are in the labor force, with 7.5% or 135 of them being unemployed. The group with the highest labor force participation rate are those with the educational attainment of bachelor's degree or higher, with 81.4% or 342 individuals in the labor force. Within the labor force, individuals with high school diploma education have the highest percentage of unemployment, with 14.9% or 82 of them being unemployed.
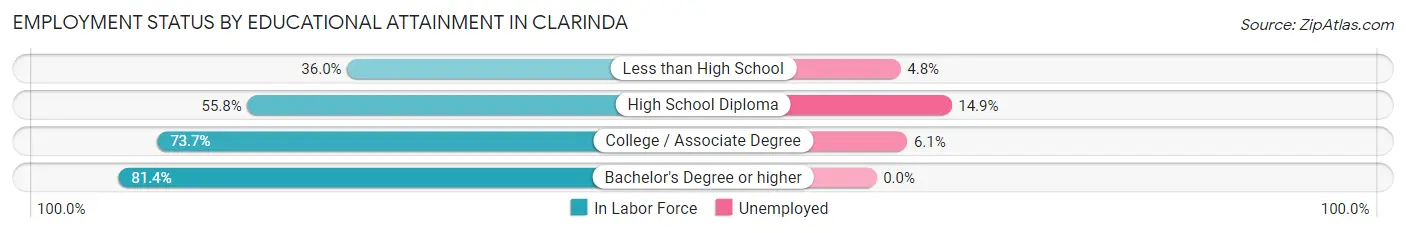
| Educational Attainment | In Labor Force | Unemployed |
| Less than High School | 105 (36.0%) | 14 (4.8%) |
| High School Diploma | 551 (55.8%) | 147 (14.9%) |
| College / Associate Degree | 804 (73.7%) | 67 (6.1%) |
| Bachelor's Degree or higher | 342 (81.4%) | 0 (0.0%) |
| Total | 1,803 (64.6%) | 209 (7.5%) |
Employment Occupations by Sex in Clarinda
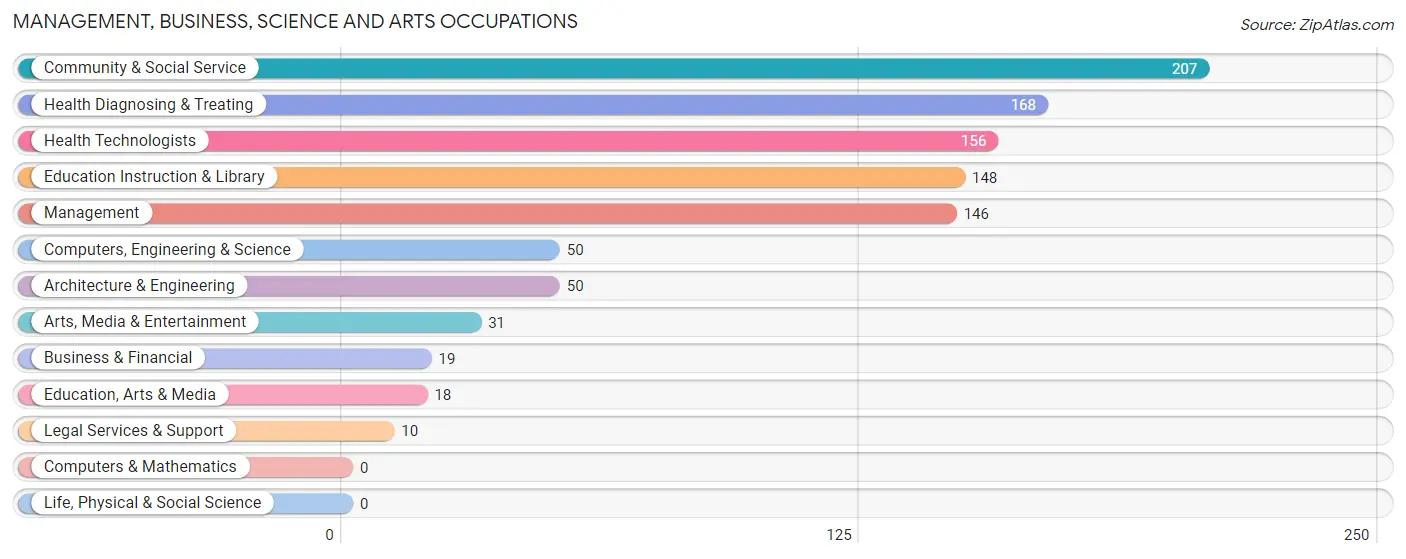
Management, Business, Science and Arts Occupations
The most common Management, Business, Science and Arts occupations in Clarinda are Community & Social Service (207 | 10.0%), Health Diagnosing & Treating (168 | 8.1%), Health Technologists (156 | 7.5%), Education Instruction & Library (148 | 7.1%), and Management (146 | 7.0%).
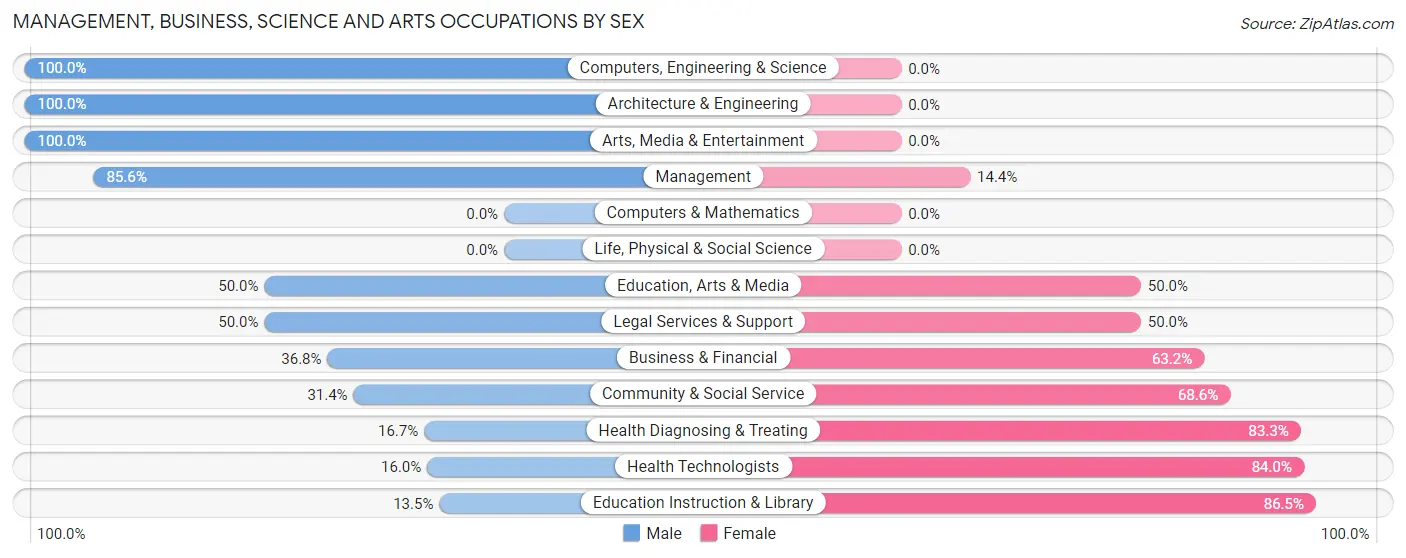
Management, Business, Science and Arts Occupations by Sex
Within the Management, Business, Science and Arts occupations in Clarinda, the most male-oriented occupations are Computers, Engineering & Science (100.0%), Architecture & Engineering (100.0%), and Arts, Media & Entertainment (100.0%), while the most female-oriented occupations are Education Instruction & Library (86.5%), Health Technologists (84.0%), and Health Diagnosing & Treating (83.3%).
| Occupation | Male | Female |
| Management | 125 (85.6%) | 21 (14.4%) |
| Business & Financial | 7 (36.8%) | 12 (63.2%) |
| Computers, Engineering & Science | 50 (100.0%) | 0 (0.0%) |
| Computers & Mathematics | 0 (0.0%) | 0 (0.0%) |
| Architecture & Engineering | 50 (100.0%) | 0 (0.0%) |
| Life, Physical & Social Science | 0 (0.0%) | 0 (0.0%) |
| Community & Social Service | 65 (31.4%) | 142 (68.6%) |
| Education, Arts & Media | 9 (50.0%) | 9 (50.0%) |
| Legal Services & Support | 5 (50.0%) | 5 (50.0%) |
| Education Instruction & Library | 20 (13.5%) | 128 (86.5%) |
| Arts, Media & Entertainment | 31 (100.0%) | 0 (0.0%) |
| Health Diagnosing & Treating | 28 (16.7%) | 140 (83.3%) |
| Health Technologists | 25 (16.0%) | 131 (84.0%) |
| Total (Category) | 275 (46.6%) | 315 (53.4%) |
| Total (Overall) | 1,176 (56.8%) | 894 (43.2%) |
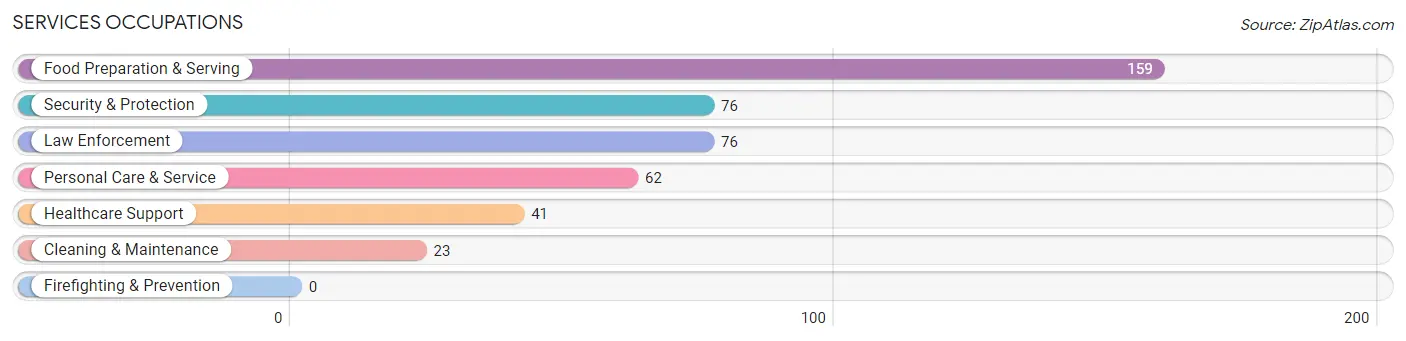
Services Occupations
The most common Services occupations in Clarinda are Food Preparation & Serving (159 | 7.7%), Security & Protection (76 | 3.7%), Law Enforcement (76 | 3.7%), Personal Care & Service (62 | 3.0%), and Healthcare Support (41 | 2.0%).
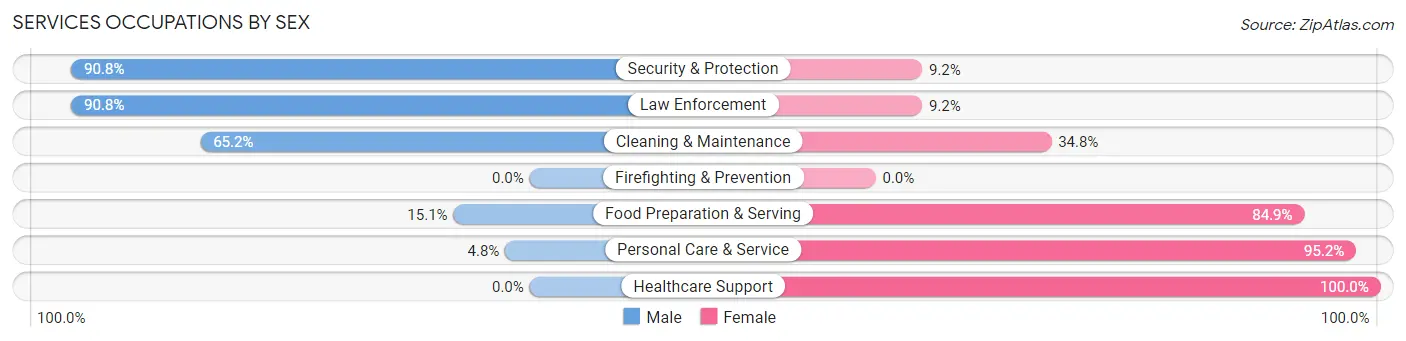
Services Occupations by Sex
Within the Services occupations in Clarinda, the most male-oriented occupations are Security & Protection (90.8%), Law Enforcement (90.8%), and Cleaning & Maintenance (65.2%), while the most female-oriented occupations are Healthcare Support (100.0%), Personal Care & Service (95.2%), and Food Preparation & Serving (84.9%).
| Occupation | Male | Female |
| Healthcare Support | 0 (0.0%) | 41 (100.0%) |
| Security & Protection | 69 (90.8%) | 7 (9.2%) |
| Firefighting & Prevention | 0 (0.0%) | 0 (0.0%) |
| Law Enforcement | 69 (90.8%) | 7 (9.2%) |
| Food Preparation & Serving | 24 (15.1%) | 135 (84.9%) |
| Cleaning & Maintenance | 15 (65.2%) | 8 (34.8%) |
| Personal Care & Service | 3 (4.8%) | 59 (95.2%) |
| Total (Category) | 111 (30.7%) | 250 (69.3%) |
| Total (Overall) | 1,176 (56.8%) | 894 (43.2%) |
Sales and Office Occupations
The most common Sales and Office occupations in Clarinda are Sales & Related (126 | 6.1%), and Office & Administration (108 | 5.2%).
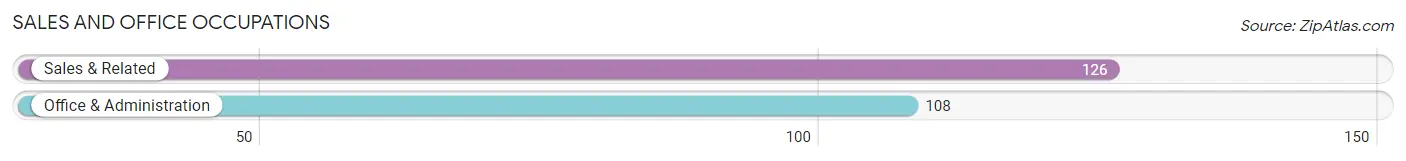
Sales and Office Occupations by Sex
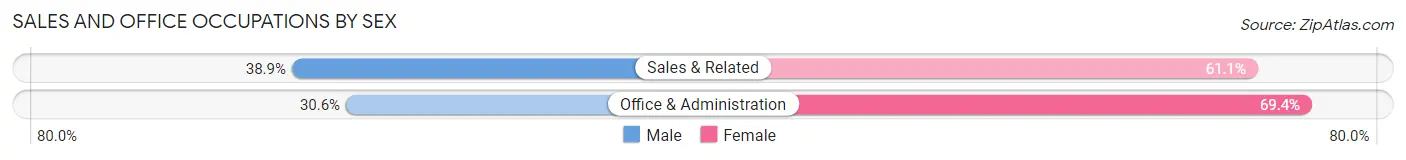
| Occupation | Male | Female |
| Sales & Related | 49 (38.9%) | 77 (61.1%) |
| Office & Administration | 33 (30.6%) | 75 (69.4%) |
| Total (Category) | 82 (35.0%) | 152 (65.0%) |
| Total (Overall) | 1,176 (56.8%) | 894 (43.2%) |
Natural Resources, Construction and Maintenance Occupations
The most common Natural Resources, Construction and Maintenance occupations in Clarinda are Construction & Extraction (53 | 2.6%), Farming, Fishing & Forestry (34 | 1.6%), and Installation, Maintenance & Repair (6 | 0.3%).
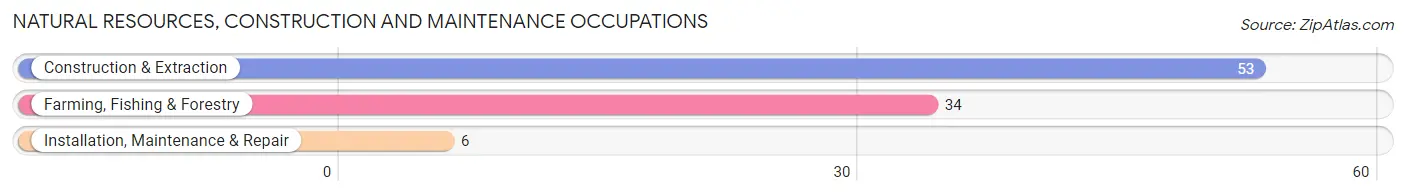
Natural Resources, Construction and Maintenance Occupations by Sex
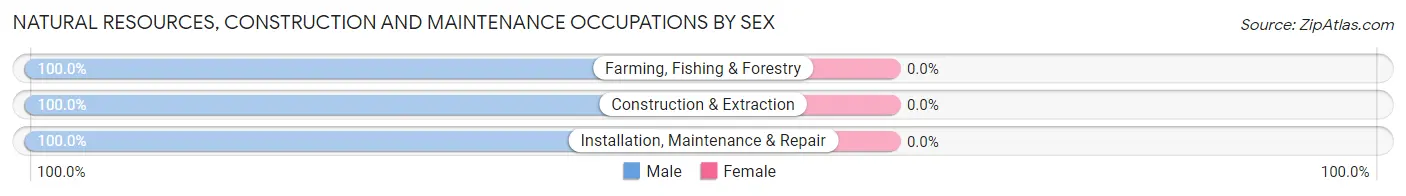
| Occupation | Male | Female |
| Farming, Fishing & Forestry | 34 (100.0%) | 0 (0.0%) |
| Construction & Extraction | 53 (100.0%) | 0 (0.0%) |
| Installation, Maintenance & Repair | 6 (100.0%) | 0 (0.0%) |
| Total (Category) | 93 (100.0%) | 0 (0.0%) |
| Total (Overall) | 1,176 (56.8%) | 894 (43.2%) |
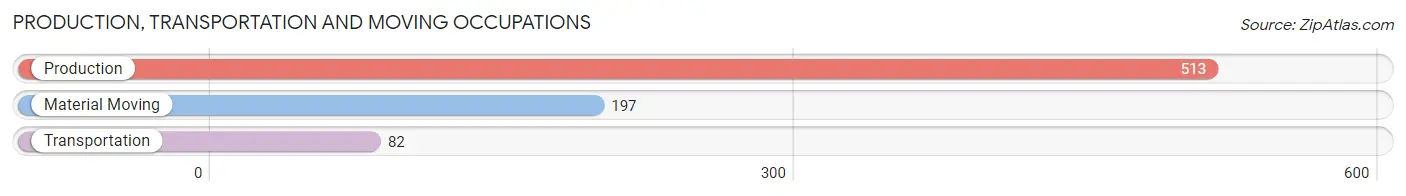
Production, Transportation and Moving Occupations
The most common Production, Transportation and Moving occupations in Clarinda are Production (513 | 24.8%), Material Moving (197 | 9.5%), and Transportation (82 | 4.0%).
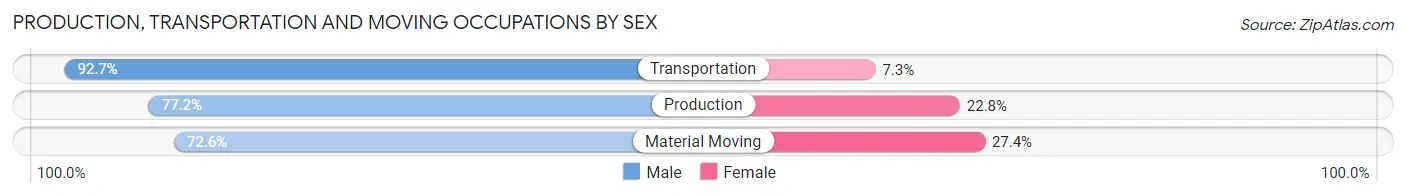
Production, Transportation and Moving Occupations by Sex
| Occupation | Male | Female |
| Production | 396 (77.2%) | 117 (22.8%) |
| Transportation | 76 (92.7%) | 6 (7.3%) |
| Material Moving | 143 (72.6%) | 54 (27.4%) |
| Total (Category) | 615 (77.6%) | 177 (22.4%) |
| Total (Overall) | 1,176 (56.8%) | 894 (43.2%) |
Employment Industries by Sex in Clarinda
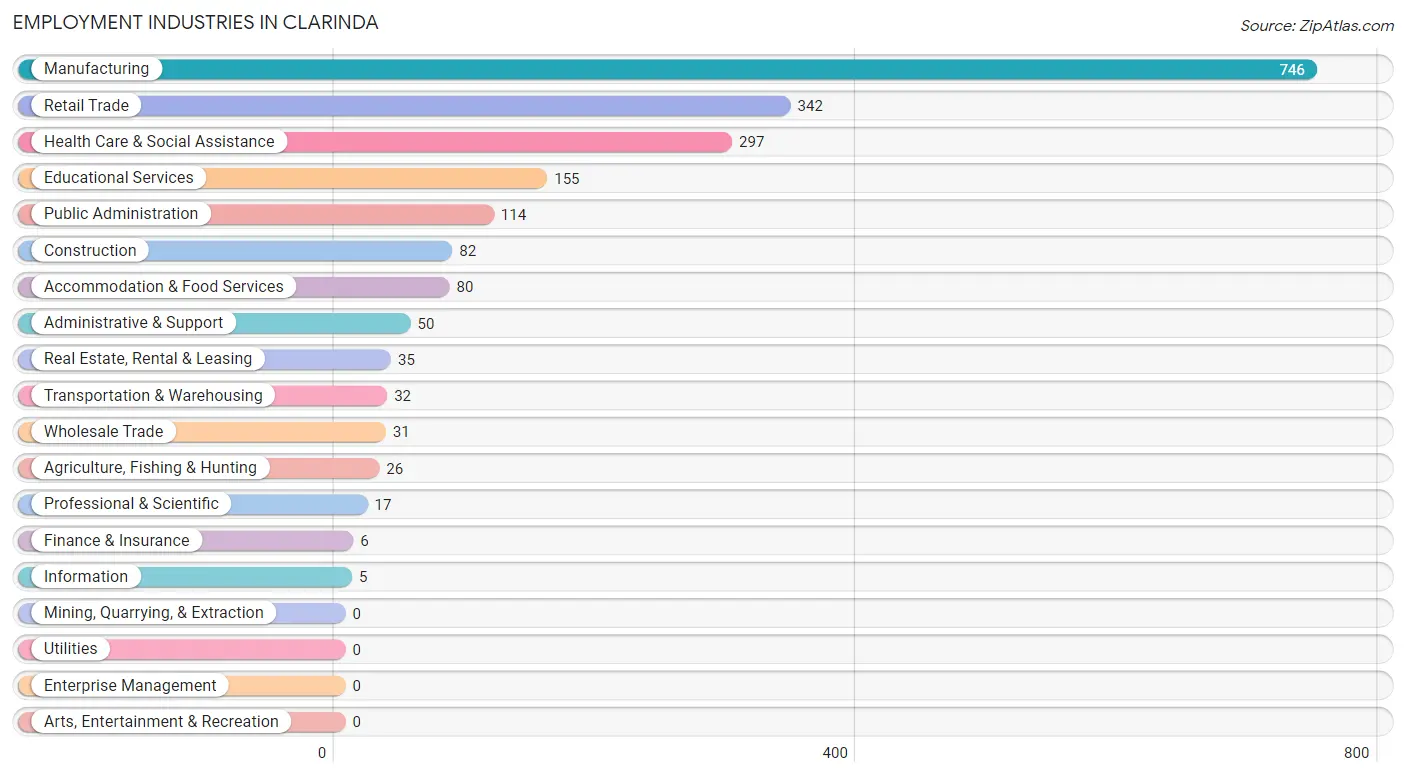
Employment Industries in Clarinda
The major employment industries in Clarinda include Manufacturing (746 | 36.0%), Retail Trade (342 | 16.5%), Health Care & Social Assistance (297 | 14.3%), Educational Services (155 | 7.5%), and Public Administration (114 | 5.5%).
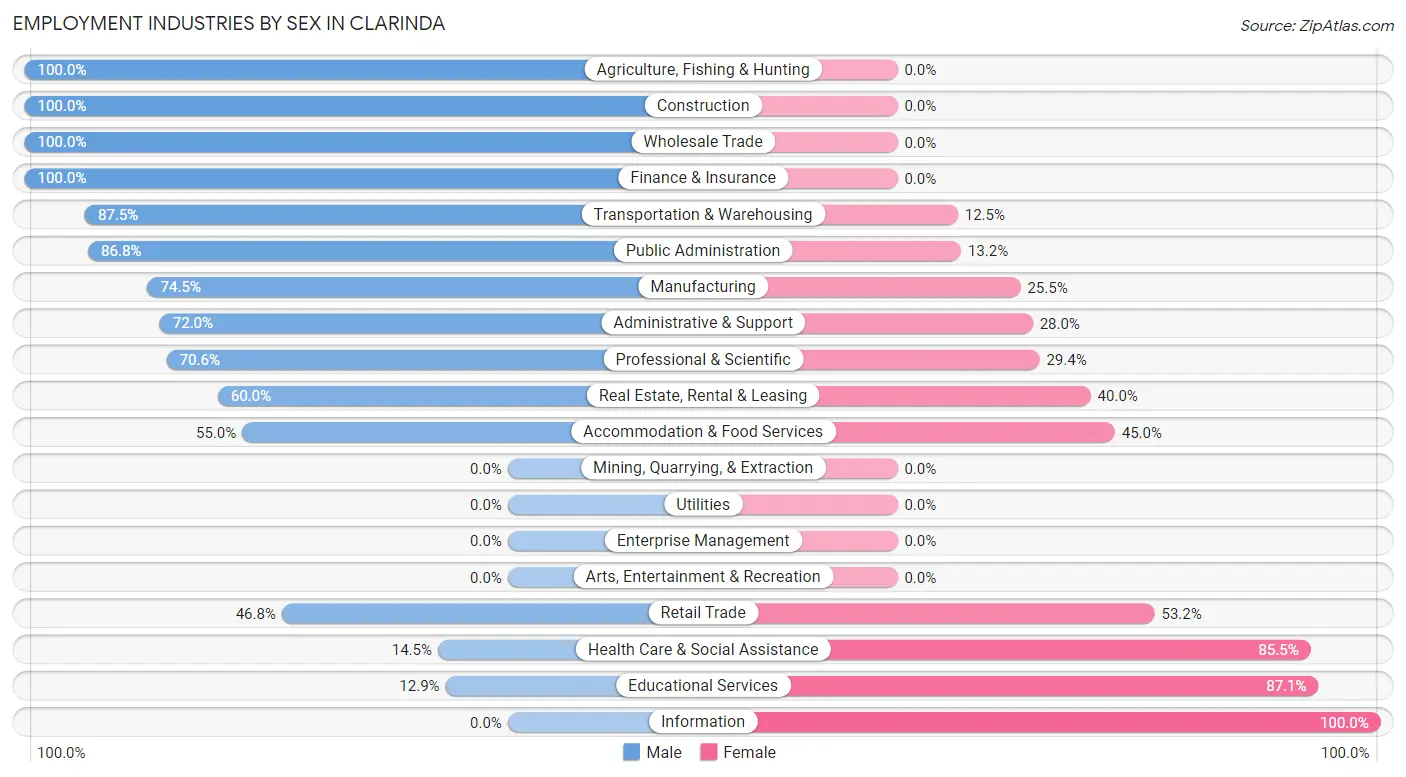
Employment Industries by Sex in Clarinda
The Clarinda industries that see more men than women are Agriculture, Fishing & Hunting (100.0%), Construction (100.0%), and Wholesale Trade (100.0%), whereas the industries that tend to have a higher number of women are Information (100.0%), Educational Services (87.1%), and Health Care & Social Assistance (85.5%).
| Industry | Male | Female |
| Agriculture, Fishing & Hunting | 26 (100.0%) | 0 (0.0%) |
| Mining, Quarrying, & Extraction | 0 (0.0%) | 0 (0.0%) |
| Construction | 82 (100.0%) | 0 (0.0%) |
| Manufacturing | 556 (74.5%) | 190 (25.5%) |
| Wholesale Trade | 31 (100.0%) | 0 (0.0%) |
| Retail Trade | 160 (46.8%) | 182 (53.2%) |
| Transportation & Warehousing | 28 (87.5%) | 4 (12.5%) |
| Utilities | 0 (0.0%) | 0 (0.0%) |
| Information | 0 (0.0%) | 5 (100.0%) |
| Finance & Insurance | 6 (100.0%) | 0 (0.0%) |
| Real Estate, Rental & Leasing | 21 (60.0%) | 14 (40.0%) |
| Professional & Scientific | 12 (70.6%) | 5 (29.4%) |
| Enterprise Management | 0 (0.0%) | 0 (0.0%) |
| Administrative & Support | 36 (72.0%) | 14 (28.0%) |
| Educational Services | 20 (12.9%) | 135 (87.1%) |
| Health Care & Social Assistance | 43 (14.5%) | 254 (85.5%) |
| Arts, Entertainment & Recreation | 0 (0.0%) | 0 (0.0%) |
| Accommodation & Food Services | 44 (55.0%) | 36 (45.0%) |
| Public Administration | 99 (86.8%) | 15 (13.2%) |
| Total | 1,176 (56.8%) | 894 (43.2%) |
Education in Clarinda
School Enrollment in Clarinda
The most common levels of schooling among the 1,095 students in Clarinda are high school (412 | 37.6%), middle school (237 | 21.6%), and elementary school (117 | 10.7%).
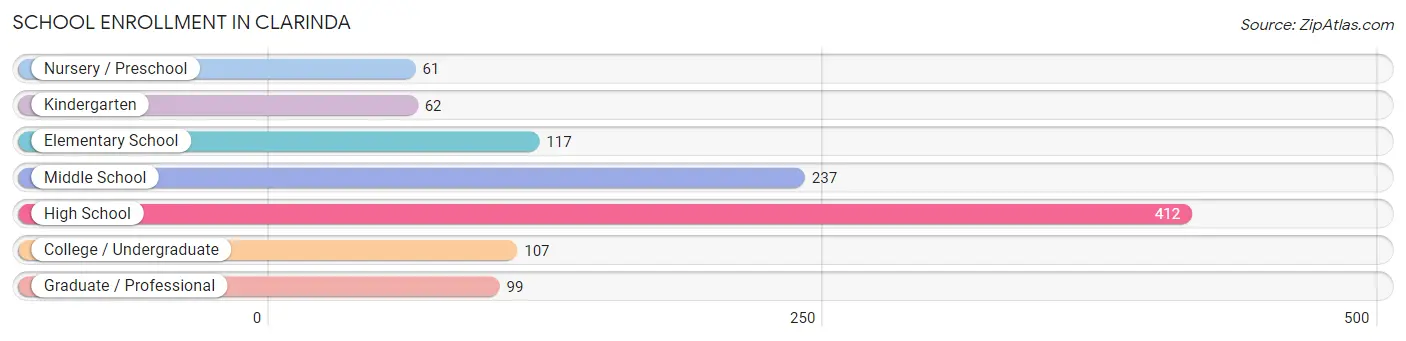
| School Level | # Students | % Students |
| Nursery / Preschool | 61 | 5.6% |
| Kindergarten | 62 | 5.7% |
| Elementary School | 117 | 10.7% |
| Middle School | 237 | 21.6% |
| High School | 412 | 37.6% |
| College / Undergraduate | 107 | 9.8% |
| Graduate / Professional | 99 | 9.0% |
| Total | 1,095 | 100.0% |
School Enrollment by Age by Funding Source in Clarinda
Out of a total of 1,095 students who are enrolled in schools in Clarinda, 124 (11.3%) attend a private institution, while the remaining 971 (88.7%) are enrolled in public schools. The age group of 35 years and over has the highest likelihood of being enrolled in private schools, with 30 (22.9% in the age bracket) enrolled. Conversely, the age group of 18 to 19 year olds has the lowest likelihood of being enrolled in a private school, with 51 (100.0% in the age bracket) attending a public institution.
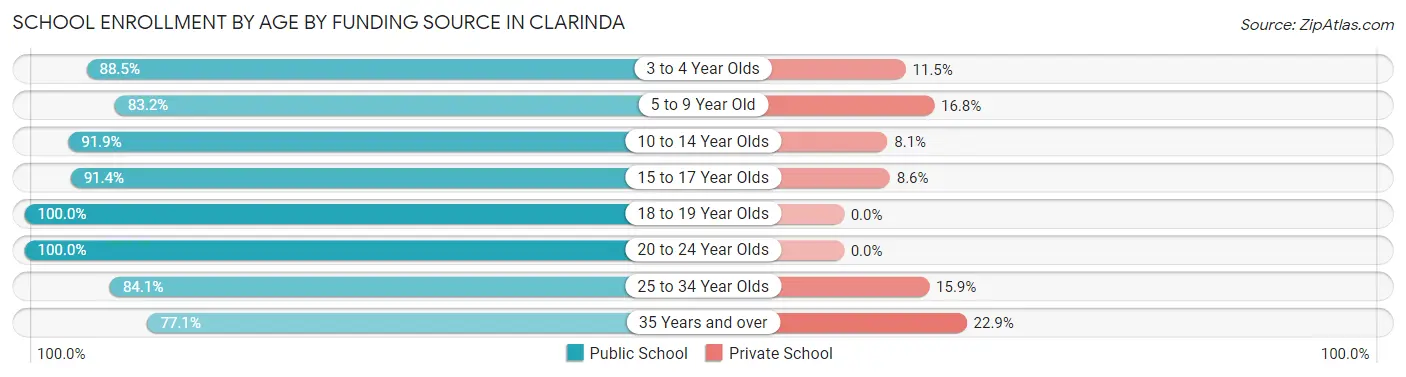
| Age Bracket | Public School | Private School |
| 3 to 4 Year Olds | 23 (88.5%) | 3 (11.5%) |
| 5 to 9 Year Old | 173 (83.2%) | 35 (16.8%) |
| 10 to 14 Year Olds | 237 (91.9%) | 21 (8.1%) |
| 15 to 17 Year Olds | 298 (91.4%) | 28 (8.6%) |
| 18 to 19 Year Olds | 51 (100.0%) | 0 (0.0%) |
| 20 to 24 Year Olds | 51 (100.0%) | 0 (0.0%) |
| 25 to 34 Year Olds | 37 (84.1%) | 7 (15.9%) |
| 35 Years and over | 101 (77.1%) | 30 (22.9%) |
| Total | 971 (88.7%) | 124 (11.3%) |
Educational Attainment by Field of Study in Clarinda
Education (192 | 28.8%), science & technology (131 | 19.6%), business (75 | 11.2%), bio, nature & agricultural (51 | 7.6%), and psychology (42 | 6.3%) are the most common fields of study among 667 individuals in Clarinda who have obtained a bachelor's degree or higher.
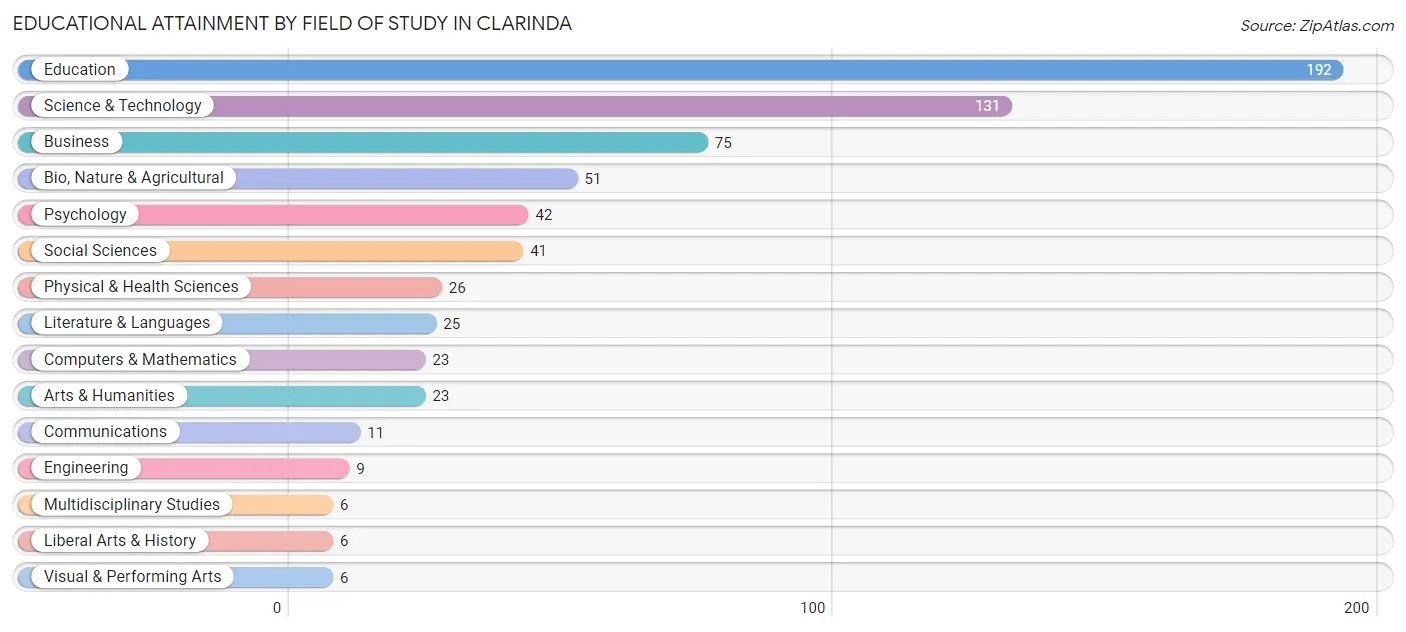
| Field of Study | # Graduates | % Graduates |
| Computers & Mathematics | 23 | 3.5% |
| Bio, Nature & Agricultural | 51 | 7.6% |
| Physical & Health Sciences | 26 | 3.9% |
| Psychology | 42 | 6.3% |
| Social Sciences | 41 | 6.1% |
| Engineering | 9 | 1.3% |
| Multidisciplinary Studies | 6 | 0.9% |
| Science & Technology | 131 | 19.6% |
| Business | 75 | 11.2% |
| Education | 192 | 28.8% |
| Literature & Languages | 25 | 3.7% |
| Liberal Arts & History | 6 | 0.9% |
| Visual & Performing Arts | 6 | 0.9% |
| Communications | 11 | 1.7% |
| Arts & Humanities | 23 | 3.5% |
| Total | 667 | 100.0% |
Transportation & Commute in Clarinda
Vehicle Availability by Sex in Clarinda
The most prevalent vehicle ownership categories in Clarinda are males with 2 vehicles (383, accounting for 32.7%) and females with 2 vehicles (222, making up 42.8%).
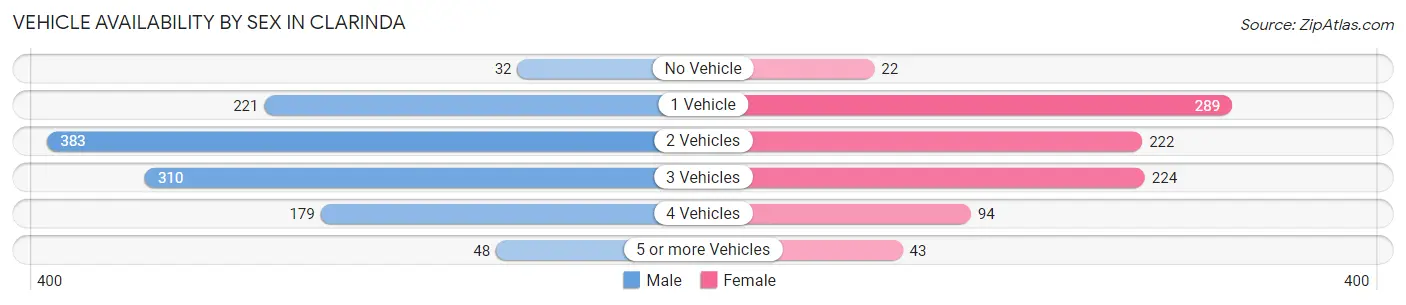
| Vehicles Available | Male | Female |
| No Vehicle | 32 (2.7%) | 22 (2.5%) |
| 1 Vehicle | 221 (18.8%) | 289 (32.3%) |
| 2 Vehicles | 383 (32.7%) | 222 (24.8%) |
| 3 Vehicles | 310 (26.4%) | 224 (25.1%) |
| 4 Vehicles | 179 (15.3%) | 94 (10.5%) |
| 5 or more Vehicles | 48 (4.1%) | 43 (4.8%) |
| Total | 1,173 (100.0%) | 894 (100.0%) |
Commute Time in Clarinda
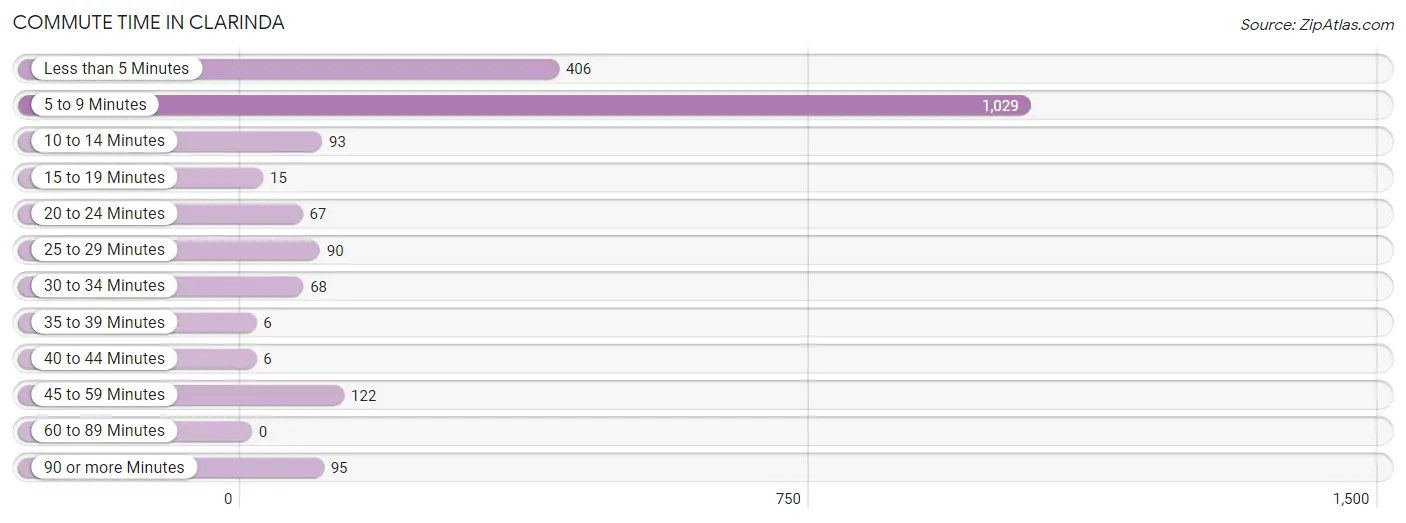
The most frequently occuring commute durations in Clarinda are 5 to 9 minutes (1,029 commuters, 51.5%), less than 5 minutes (406 commuters, 20.3%), and 45 to 59 minutes (122 commuters, 6.1%).
| Commute Time | # Commuters | % Commuters |
| Less than 5 Minutes | 406 | 20.3% |
| 5 to 9 Minutes | 1,029 | 51.5% |
| 10 to 14 Minutes | 93 | 4.7% |
| 15 to 19 Minutes | 15 | 0.7% |
| 20 to 24 Minutes | 67 | 3.4% |
| 25 to 29 Minutes | 90 | 4.5% |
| 30 to 34 Minutes | 68 | 3.4% |
| 35 to 39 Minutes | 6 | 0.3% |
| 40 to 44 Minutes | 6 | 0.3% |
| 45 to 59 Minutes | 122 | 6.1% |
| 60 to 89 Minutes | 0 | 0.0% |
| 90 or more Minutes | 95 | 4.8% |
Commute Time by Sex in Clarinda
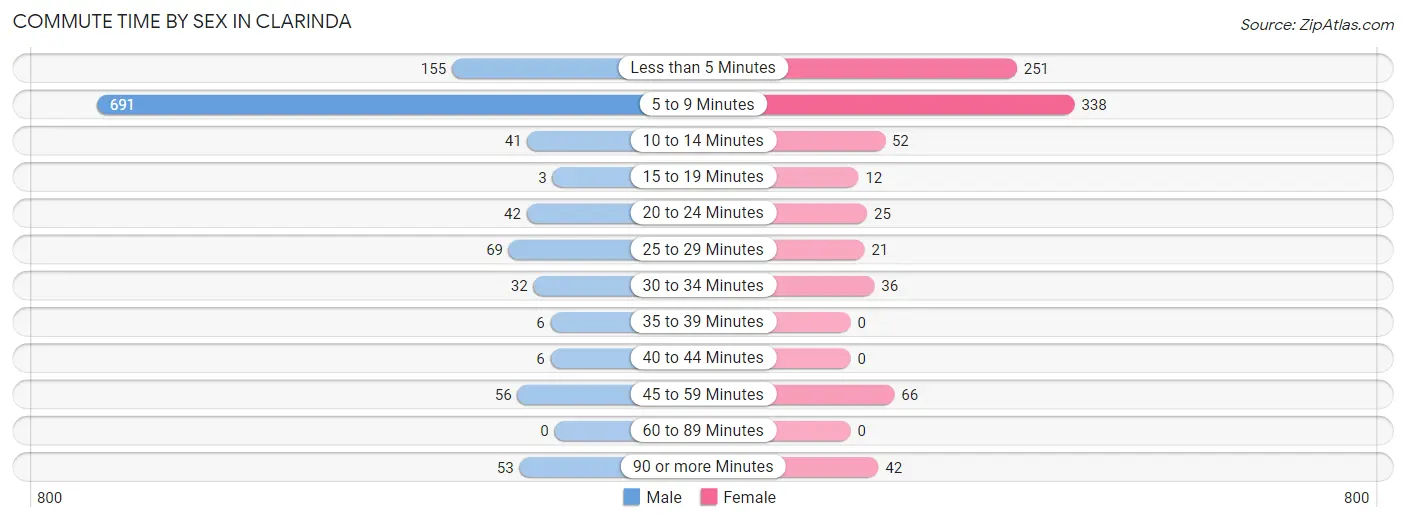
The most common commute times in Clarinda are 5 to 9 minutes (691 commuters, 59.9%) for males and 5 to 9 minutes (338 commuters, 40.1%) for females.
| Commute Time | Male | Female |
| Less than 5 Minutes | 155 (13.4%) | 251 (29.8%) |
| 5 to 9 Minutes | 691 (59.9%) | 338 (40.1%) |
| 10 to 14 Minutes | 41 (3.5%) | 52 (6.2%) |
| 15 to 19 Minutes | 3 (0.3%) | 12 (1.4%) |
| 20 to 24 Minutes | 42 (3.6%) | 25 (3.0%) |
| 25 to 29 Minutes | 69 (6.0%) | 21 (2.5%) |
| 30 to 34 Minutes | 32 (2.8%) | 36 (4.3%) |
| 35 to 39 Minutes | 6 (0.5%) | 0 (0.0%) |
| 40 to 44 Minutes | 6 (0.5%) | 0 (0.0%) |
| 45 to 59 Minutes | 56 (4.9%) | 66 (7.8%) |
| 60 to 89 Minutes | 0 (0.0%) | 0 (0.0%) |
| 90 or more Minutes | 53 (4.6%) | 42 (5.0%) |
Time of Departure to Work by Sex in Clarinda
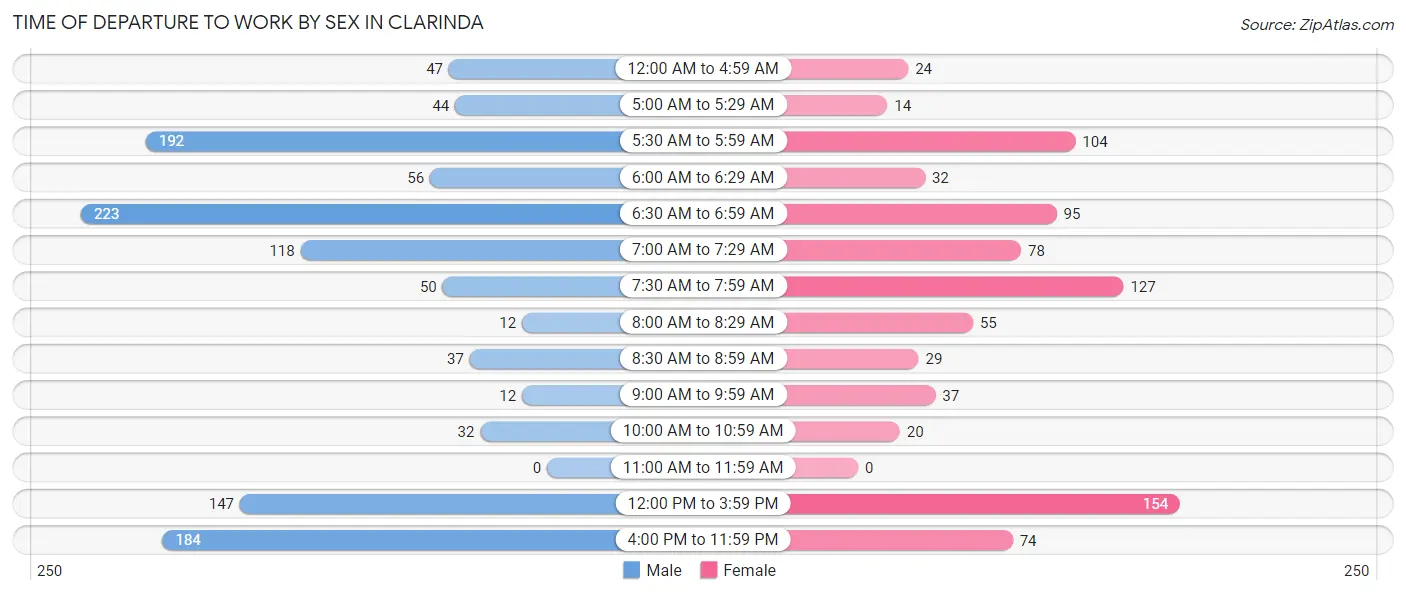
The most frequent times of departure to work in Clarinda are 6:30 AM to 6:59 AM (223, 19.3%) for males and 12:00 PM to 3:59 PM (154, 18.3%) for females.
| Time of Departure | Male | Female |
| 12:00 AM to 4:59 AM | 47 (4.1%) | 24 (2.9%) |
| 5:00 AM to 5:29 AM | 44 (3.8%) | 14 (1.7%) |
| 5:30 AM to 5:59 AM | 192 (16.6%) | 104 (12.3%) |
| 6:00 AM to 6:29 AM | 56 (4.9%) | 32 (3.8%) |
| 6:30 AM to 6:59 AM | 223 (19.3%) | 95 (11.3%) |
| 7:00 AM to 7:29 AM | 118 (10.2%) | 78 (9.2%) |
| 7:30 AM to 7:59 AM | 50 (4.3%) | 127 (15.1%) |
| 8:00 AM to 8:29 AM | 12 (1.0%) | 55 (6.5%) |
| 8:30 AM to 8:59 AM | 37 (3.2%) | 29 (3.4%) |
| 9:00 AM to 9:59 AM | 12 (1.0%) | 37 (4.4%) |
| 10:00 AM to 10:59 AM | 32 (2.8%) | 20 (2.4%) |
| 11:00 AM to 11:59 AM | 0 (0.0%) | 0 (0.0%) |
| 12:00 PM to 3:59 PM | 147 (12.7%) | 154 (18.3%) |
| 4:00 PM to 11:59 PM | 184 (15.9%) | 74 (8.8%) |
| Total | 1,154 (100.0%) | 843 (100.0%) |
Housing Occupancy in Clarinda
Occupancy by Ownership in Clarinda
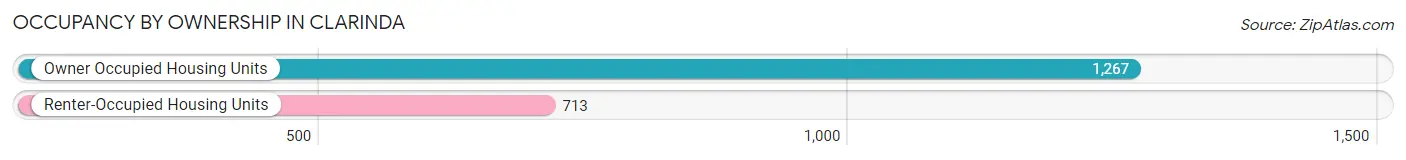
Of the total 1,980 dwellings in Clarinda, owner-occupied units account for 1,267 (64.0%), while renter-occupied units make up 713 (36.0%).
| Occupancy | # Housing Units | % Housing Units |
| Owner Occupied Housing Units | 1,267 | 64.0% |
| Renter-Occupied Housing Units | 713 | 36.0% |
| Total Occupied Housing Units | 1,980 | 100.0% |
Occupancy by Household Size in Clarinda
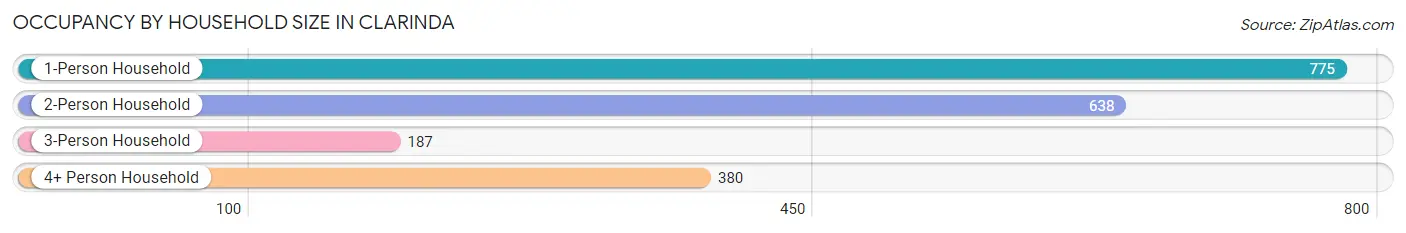
| Household Size | # Housing Units | % Housing Units |
| 1-Person Household | 775 | 39.1% |
| 2-Person Household | 638 | 32.2% |
| 3-Person Household | 187 | 9.4% |
| 4+ Person Household | 380 | 19.2% |
| Total Housing Units | 1,980 | 100.0% |
Occupancy by Ownership by Household Size in Clarinda
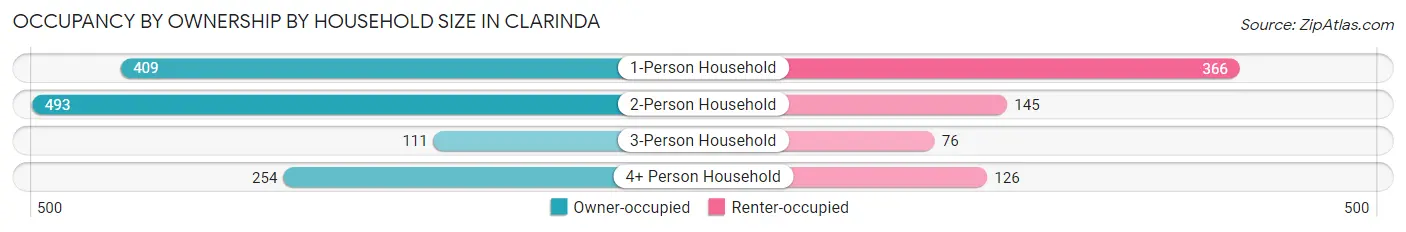
| Household Size | Owner-occupied | Renter-occupied |
| 1-Person Household | 409 (52.8%) | 366 (47.2%) |
| 2-Person Household | 493 (77.3%) | 145 (22.7%) |
| 3-Person Household | 111 (59.4%) | 76 (40.6%) |
| 4+ Person Household | 254 (66.8%) | 126 (33.2%) |
| Total Housing Units | 1,267 (64.0%) | 713 (36.0%) |
Occupancy by Educational Attainment in Clarinda
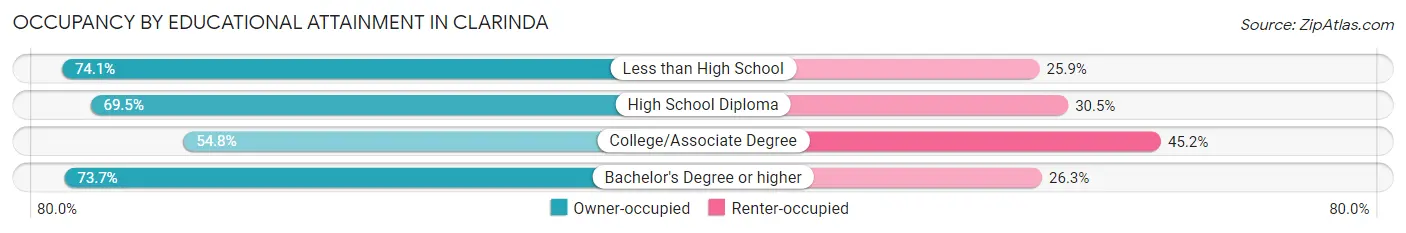
| Household Size | Owner-occupied | Renter-occupied |
| Less than High School | 40 (74.1%) | 14 (25.9%) |
| High School Diploma | 436 (69.5%) | 191 (30.5%) |
| College/Associate Degree | 483 (54.8%) | 398 (45.2%) |
| Bachelor's Degree or higher | 308 (73.7%) | 110 (26.3%) |
Occupancy by Age of Householder in Clarinda
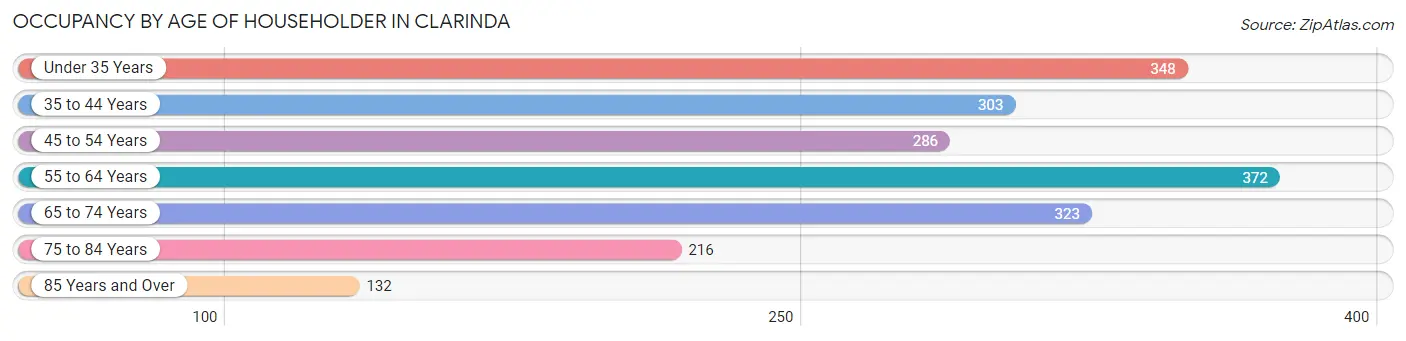
| Age Bracket | # Households | % Households |
| Under 35 Years | 348 | 17.6% |
| 35 to 44 Years | 303 | 15.3% |
| 45 to 54 Years | 286 | 14.4% |
| 55 to 64 Years | 372 | 18.8% |
| 65 to 74 Years | 323 | 16.3% |
| 75 to 84 Years | 216 | 10.9% |
| 85 Years and Over | 132 | 6.7% |
| Total | 1,980 | 100.0% |
Housing Finances in Clarinda
Median Income by Occupancy in Clarinda
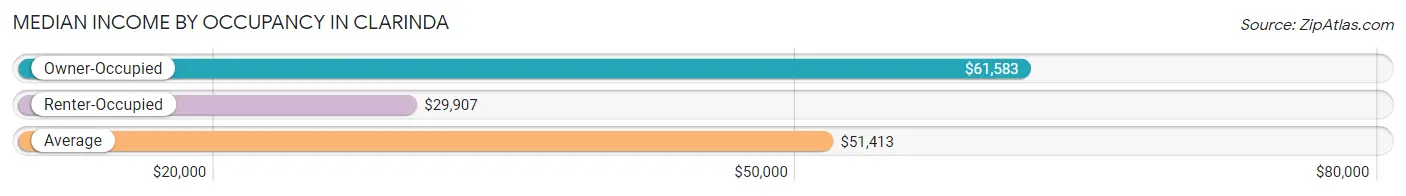
| Occupancy Type | # Households | Median Income |
| Owner-Occupied | 1,267 (64.0%) | $61,583 |
| Renter-Occupied | 713 (36.0%) | $29,907 |
| Average | 1,980 (100.0%) | $51,413 |
Occupancy by Householder Income Bracket in Clarinda
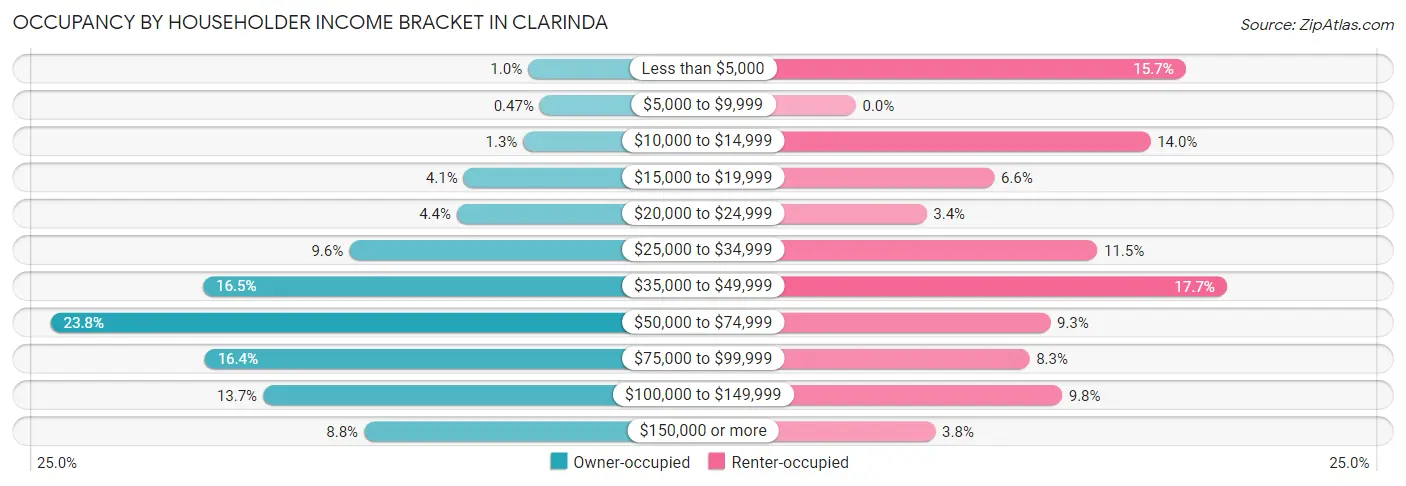
| Income Bracket | Owner-occupied | Renter-occupied |
| Less than $5,000 | 13 (1.0%) | 112 (15.7%) |
| $5,000 to $9,999 | 6 (0.5%) | 0 (0.0%) |
| $10,000 to $14,999 | 16 (1.3%) | 100 (14.0%) |
| $15,000 to $19,999 | 52 (4.1%) | 47 (6.6%) |
| $20,000 to $24,999 | 56 (4.4%) | 24 (3.4%) |
| $25,000 to $34,999 | 121 (9.6%) | 82 (11.5%) |
| $35,000 to $49,999 | 209 (16.5%) | 126 (17.7%) |
| $50,000 to $74,999 | 301 (23.8%) | 66 (9.3%) |
| $75,000 to $99,999 | 208 (16.4%) | 59 (8.3%) |
| $100,000 to $149,999 | 173 (13.7%) | 70 (9.8%) |
| $150,000 or more | 112 (8.8%) | 27 (3.8%) |
| Total | 1,267 (100.0%) | 713 (100.0%) |
Monthly Housing Cost Tiers in Clarinda
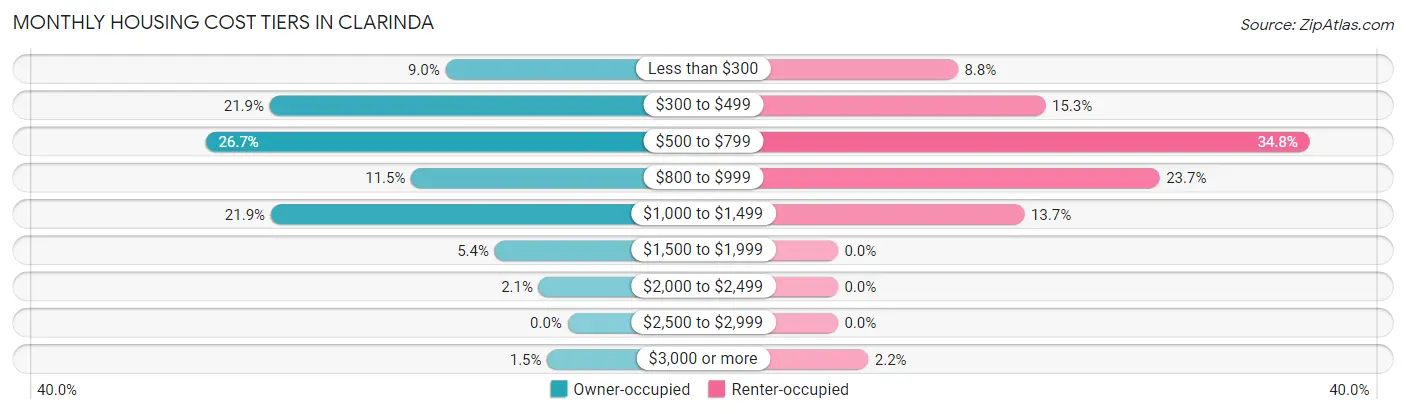
| Monthly Cost | Owner-occupied | Renter-occupied |
| Less than $300 | 114 (9.0%) | 63 (8.8%) |
| $300 to $499 | 278 (21.9%) | 109 (15.3%) |
| $500 to $799 | 338 (26.7%) | 248 (34.8%) |
| $800 to $999 | 146 (11.5%) | 169 (23.7%) |
| $1,000 to $1,499 | 277 (21.9%) | 98 (13.7%) |
| $1,500 to $1,999 | 68 (5.4%) | 0 (0.0%) |
| $2,000 to $2,499 | 27 (2.1%) | 0 (0.0%) |
| $2,500 to $2,999 | 0 (0.0%) | 0 (0.0%) |
| $3,000 or more | 19 (1.5%) | 16 (2.2%) |
| Total | 1,267 (100.0%) | 713 (100.0%) |
Physical Housing Characteristics in Clarinda
Housing Structures in Clarinda
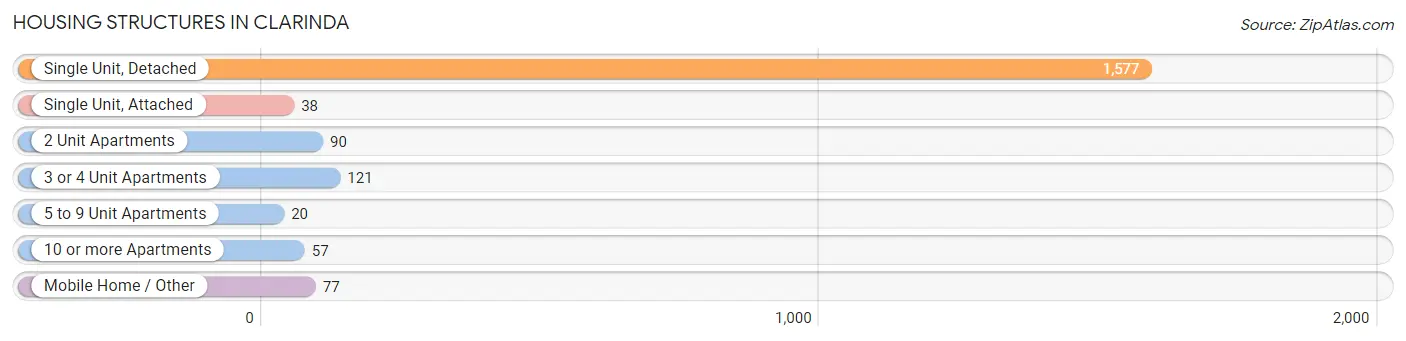
| Structure Type | # Housing Units | % Housing Units |
| Single Unit, Detached | 1,577 | 79.6% |
| Single Unit, Attached | 38 | 1.9% |
| 2 Unit Apartments | 90 | 4.5% |
| 3 or 4 Unit Apartments | 121 | 6.1% |
| 5 to 9 Unit Apartments | 20 | 1.0% |
| 10 or more Apartments | 57 | 2.9% |
| Mobile Home / Other | 77 | 3.9% |
| Total | 1,980 | 100.0% |
Housing Structures by Occupancy in Clarinda
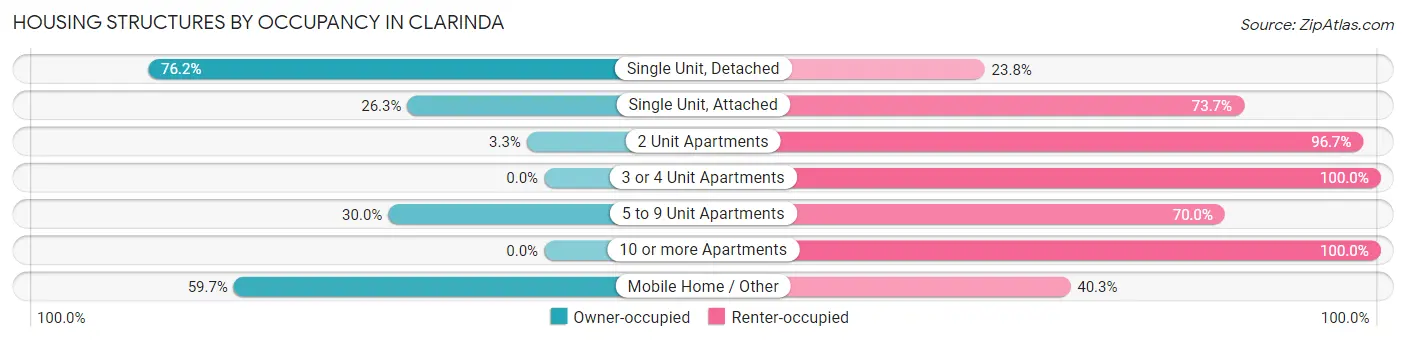
| Structure Type | Owner-occupied | Renter-occupied |
| Single Unit, Detached | 1,202 (76.2%) | 375 (23.8%) |
| Single Unit, Attached | 10 (26.3%) | 28 (73.7%) |
| 2 Unit Apartments | 3 (3.3%) | 87 (96.7%) |
| 3 or 4 Unit Apartments | 0 (0.0%) | 121 (100.0%) |
| 5 to 9 Unit Apartments | 6 (30.0%) | 14 (70.0%) |
| 10 or more Apartments | 0 (0.0%) | 57 (100.0%) |
| Mobile Home / Other | 46 (59.7%) | 31 (40.3%) |
| Total | 1,267 (64.0%) | 713 (36.0%) |
Housing Structures by Number of Rooms in Clarinda
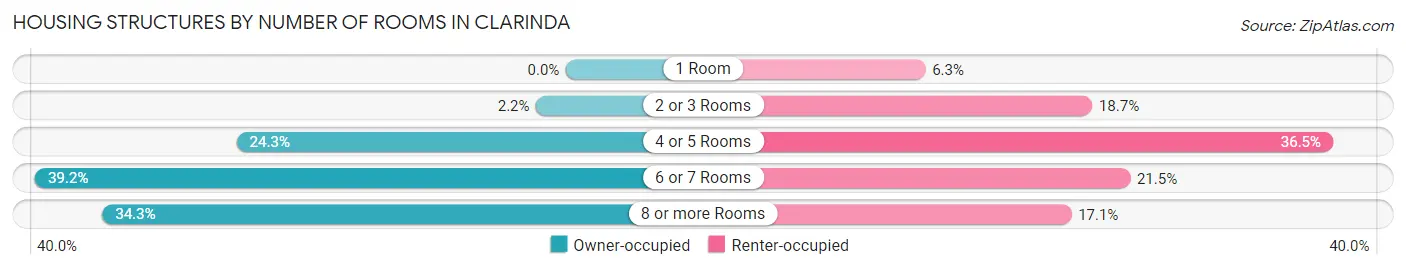
| Number of Rooms | Owner-occupied | Renter-occupied |
| 1 Room | 0 (0.0%) | 45 (6.3%) |
| 2 or 3 Rooms | 28 (2.2%) | 133 (18.6%) |
| 4 or 5 Rooms | 308 (24.3%) | 260 (36.5%) |
| 6 or 7 Rooms | 497 (39.2%) | 153 (21.5%) |
| 8 or more Rooms | 434 (34.3%) | 122 (17.1%) |
| Total | 1,267 (100.0%) | 713 (100.0%) |
Housing Structure by Heating Type in Clarinda
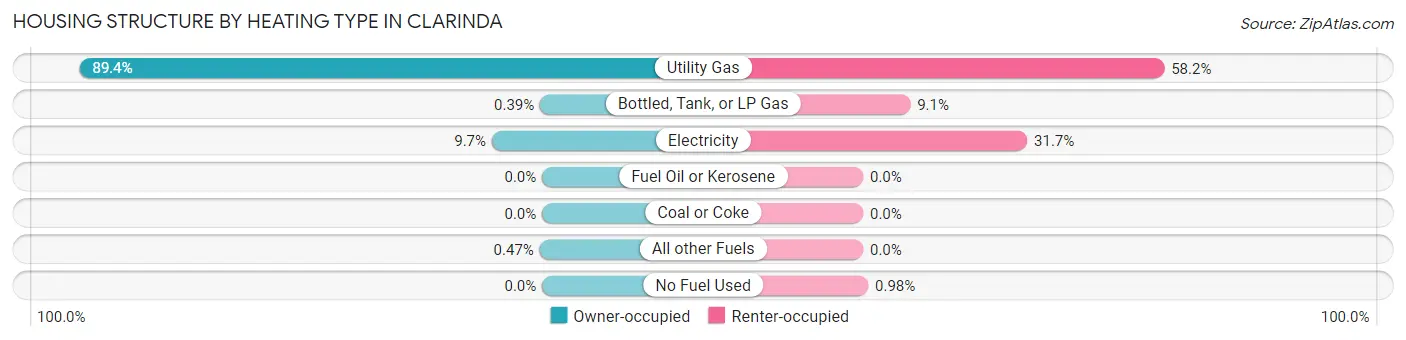
| Heating Type | Owner-occupied | Renter-occupied |
| Utility Gas | 1,133 (89.4%) | 415 (58.2%) |
| Bottled, Tank, or LP Gas | 5 (0.4%) | 65 (9.1%) |
| Electricity | 123 (9.7%) | 226 (31.7%) |
| Fuel Oil or Kerosene | 0 (0.0%) | 0 (0.0%) |
| Coal or Coke | 0 (0.0%) | 0 (0.0%) |
| All other Fuels | 6 (0.5%) | 0 (0.0%) |
| No Fuel Used | 0 (0.0%) | 7 (1.0%) |
| Total | 1,267 (100.0%) | 713 (100.0%) |
Household Vehicle Usage in Clarinda
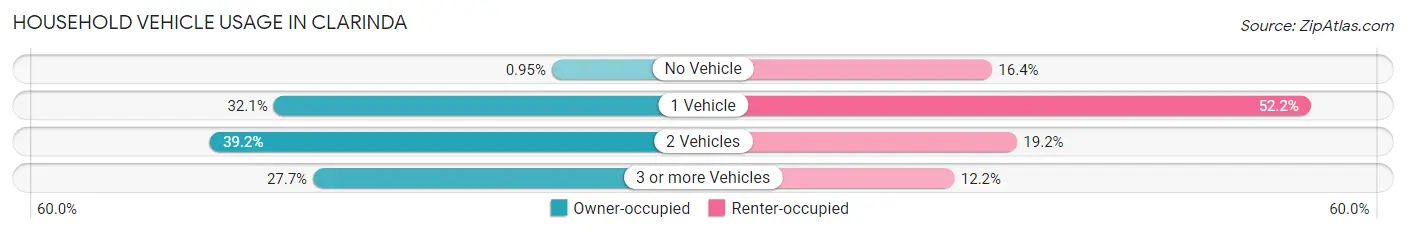
| Vehicles per Household | Owner-occupied | Renter-occupied |
| No Vehicle | 12 (0.9%) | 117 (16.4%) |
| 1 Vehicle | 407 (32.1%) | 372 (52.2%) |
| 2 Vehicles | 497 (39.2%) | 137 (19.2%) |
| 3 or more Vehicles | 351 (27.7%) | 87 (12.2%) |
| Total | 1,267 (100.0%) | 713 (100.0%) |
Real Estate & Mortgages in Clarinda
Real Estate and Mortgage Overview in Clarinda
| Characteristic | Without Mortgage | With Mortgage |
| Housing Units | 642 | 625 |
| Median Property Value | $98,700 | $120,400 |
| Median Household Income | $55,962 | $56 |
| Monthly Housing Costs | $458 | $8 |
| Real Estate Taxes | $1,690 | $29 |
Property Value by Mortgage Status in Clarinda
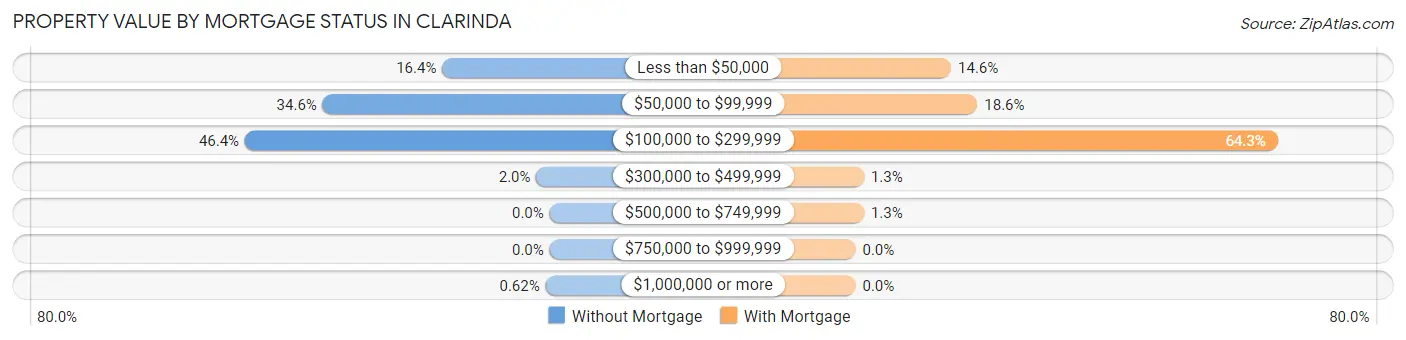
| Property Value | Without Mortgage | With Mortgage |
| Less than $50,000 | 105 (16.4%) | 91 (14.6%) |
| $50,000 to $99,999 | 222 (34.6%) | 116 (18.6%) |
| $100,000 to $299,999 | 298 (46.4%) | 402 (64.3%) |
| $300,000 to $499,999 | 13 (2.0%) | 8 (1.3%) |
| $500,000 to $749,999 | 0 (0.0%) | 8 (1.3%) |
| $750,000 to $999,999 | 0 (0.0%) | 0 (0.0%) |
| $1,000,000 or more | 4 (0.6%) | 0 (0.0%) |
| Total | 642 (100.0%) | 625 (100.0%) |
Household Income by Mortgage Status in Clarinda
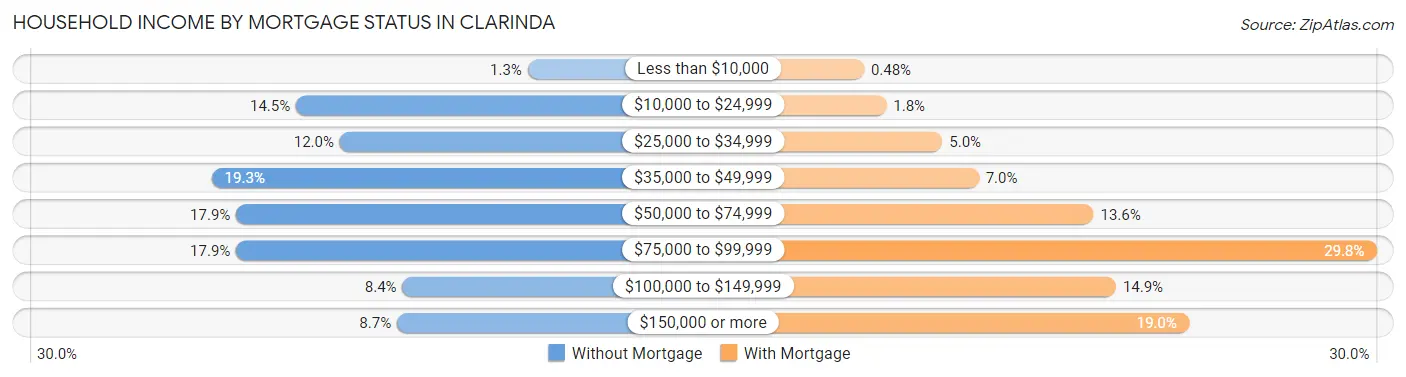
| Household Income | Without Mortgage | With Mortgage |
| Less than $10,000 | 8 (1.3%) | 3 (0.5%) |
| $10,000 to $24,999 | 93 (14.5%) | 11 (1.8%) |
| $25,000 to $34,999 | 77 (12.0%) | 31 (5.0%) |
| $35,000 to $49,999 | 124 (19.3%) | 44 (7.0%) |
| $50,000 to $74,999 | 115 (17.9%) | 85 (13.6%) |
| $75,000 to $99,999 | 115 (17.9%) | 186 (29.8%) |
| $100,000 to $149,999 | 54 (8.4%) | 93 (14.9%) |
| $150,000 or more | 56 (8.7%) | 119 (19.0%) |
| Total | 642 (100.0%) | 625 (100.0%) |
Property Value to Household Income Ratio in Clarinda
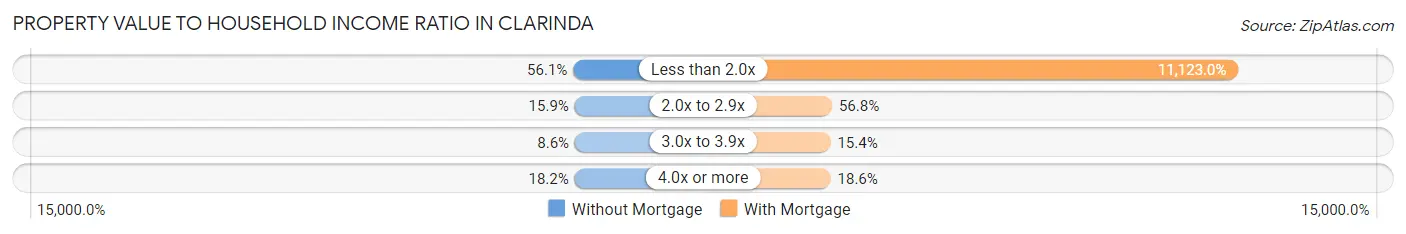
| Value-to-Income Ratio | Without Mortgage | With Mortgage |
| Less than 2.0x | 360 (56.1%) | 69,519 (11,123.0%) |
| 2.0x to 2.9x | 102 (15.9%) | 355 (56.8%) |
| 3.0x to 3.9x | 55 (8.6%) | 96 (15.4%) |
| 4.0x or more | 117 (18.2%) | 116 (18.6%) |
| Total | 642 (100.0%) | 625 (100.0%) |
Real Estate Taxes by Mortgage Status in Clarinda
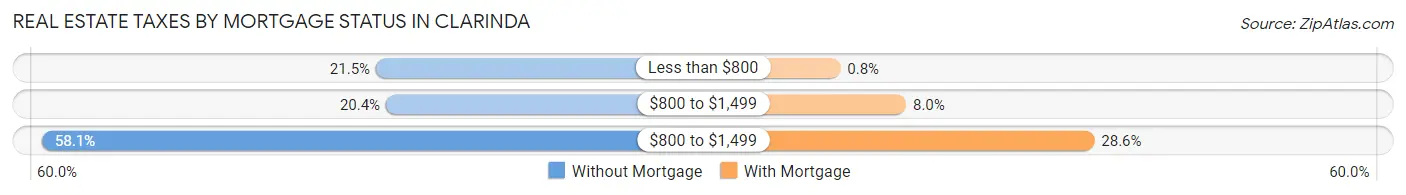
| Property Taxes | Without Mortgage | With Mortgage |
| Less than $800 | 138 (21.5%) | 5 (0.8%) |
| $800 to $1,499 | 131 (20.4%) | 50 (8.0%) |
| $800 to $1,499 | 373 (58.1%) | 179 (28.6%) |
| Total | 642 (100.0%) | 625 (100.0%) |
Health & Disability in Clarinda
Health Insurance Coverage by Age in Clarinda
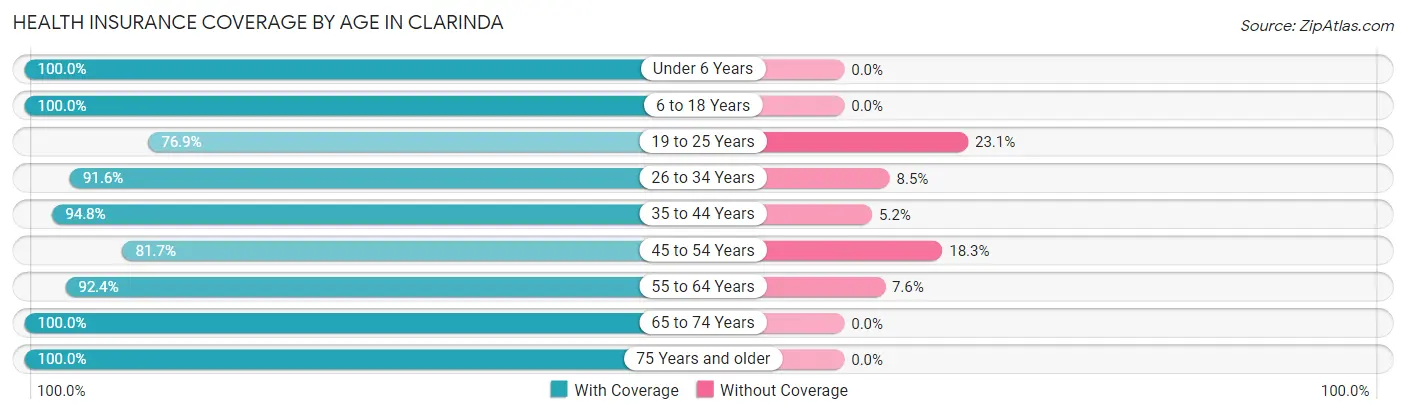
| Age Bracket | With Coverage | Without Coverage |
| Under 6 Years | 313 (100.0%) | 0 (0.0%) |
| 6 to 18 Years | 674 (100.0%) | 0 (0.0%) |
| 19 to 25 Years | 310 (76.9%) | 93 (23.1%) |
| 26 to 34 Years | 401 (91.5%) | 37 (8.5%) |
| 35 to 44 Years | 549 (94.8%) | 30 (5.2%) |
| 45 to 54 Years | 425 (81.7%) | 95 (18.3%) |
| 55 to 64 Years | 572 (92.4%) | 47 (7.6%) |
| 65 to 74 Years | 502 (100.0%) | 0 (0.0%) |
| 75 Years and older | 528 (100.0%) | 0 (0.0%) |
| Total | 4,274 (93.4%) | 302 (6.6%) |
Health Insurance Coverage by Citizenship Status in Clarinda
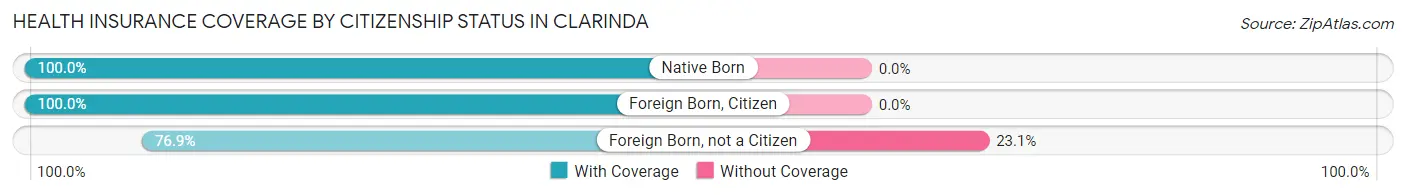
| Citizenship Status | With Coverage | Without Coverage |
| Native Born | 313 (100.0%) | 0 (0.0%) |
| Foreign Born, Citizen | 674 (100.0%) | 0 (0.0%) |
| Foreign Born, not a Citizen | 310 (76.9%) | 93 (23.1%) |
Health Insurance Coverage by Household Income in Clarinda
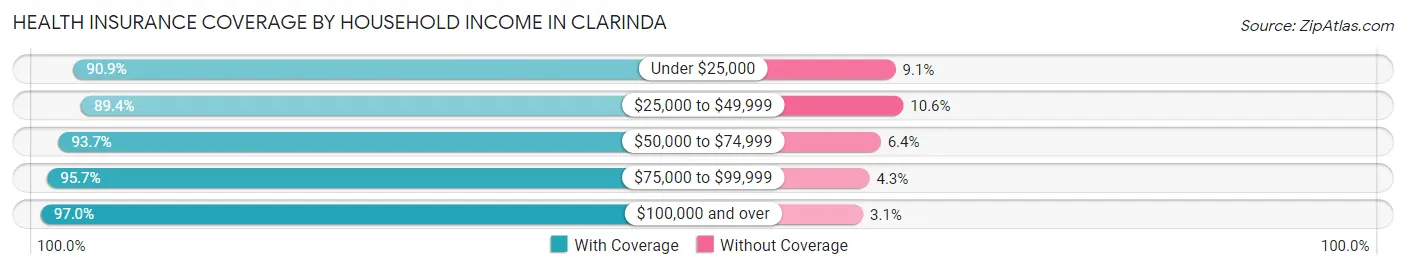
| Household Income | With Coverage | Without Coverage |
| Under $25,000 | 547 (90.9%) | 55 (9.1%) |
| $25,000 to $49,999 | 987 (89.4%) | 117 (10.6%) |
| $50,000 to $74,999 | 973 (93.6%) | 66 (6.4%) |
| $75,000 to $99,999 | 651 (95.7%) | 29 (4.3%) |
| $100,000 and over | 1,082 (97.0%) | 34 (3.0%) |
Public vs Private Health Insurance Coverage by Age in Clarinda
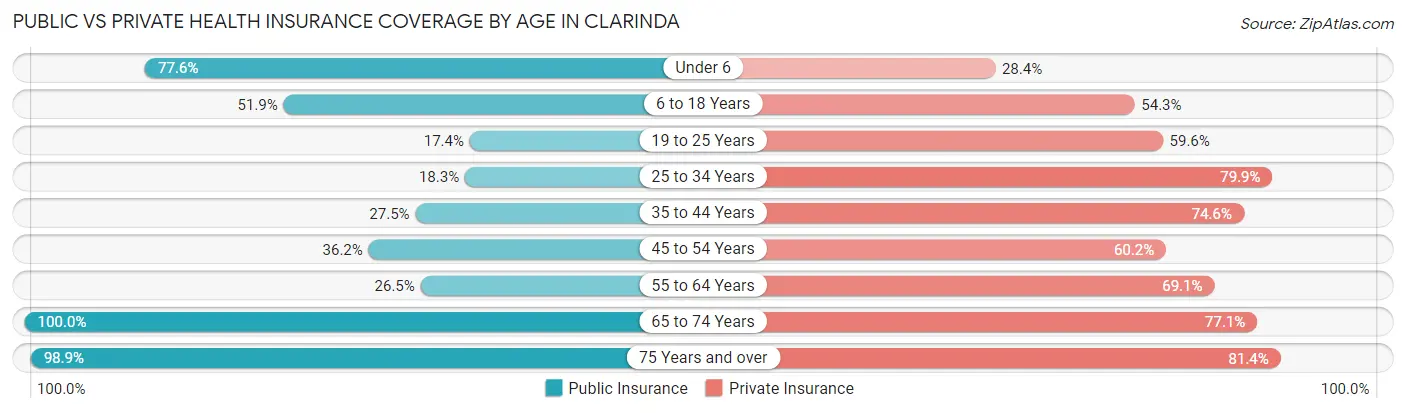
| Age Bracket | Public Insurance | Private Insurance |
| Under 6 | 243 (77.6%) | 89 (28.4%) |
| 6 to 18 Years | 350 (51.9%) | 366 (54.3%) |
| 19 to 25 Years | 70 (17.4%) | 240 (59.6%) |
| 25 to 34 Years | 80 (18.3%) | 350 (79.9%) |
| 35 to 44 Years | 159 (27.5%) | 432 (74.6%) |
| 45 to 54 Years | 188 (36.1%) | 313 (60.2%) |
| 55 to 64 Years | 164 (26.5%) | 428 (69.1%) |
| 65 to 74 Years | 502 (100.0%) | 387 (77.1%) |
| 75 Years and over | 522 (98.9%) | 430 (81.4%) |
| Total | 2,278 (49.8%) | 3,035 (66.3%) |
Disability Status by Sex by Age in Clarinda
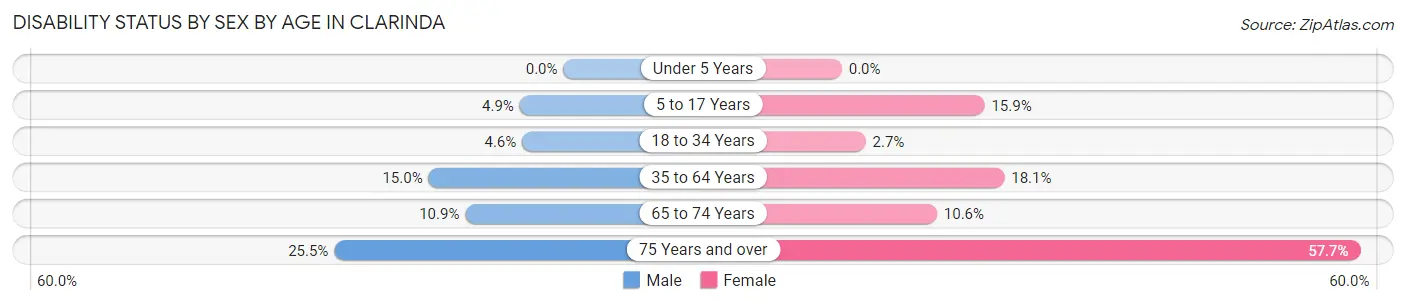
| Age Bracket | Male | Female |
| Under 5 Years | 0 (0.0%) | 0 (0.0%) |
| 5 to 17 Years | 19 (4.9%) | 48 (15.9%) |
| 18 to 34 Years | 25 (4.6%) | 9 (2.6%) |
| 35 to 64 Years | 122 (15.0%) | 164 (18.1%) |
| 65 to 74 Years | 27 (10.9%) | 27 (10.6%) |
| 75 Years and over | 49 (25.5%) | 194 (57.7%) |
Disability Class by Sex by Age in Clarinda
Disability Class: Hearing Difficulty
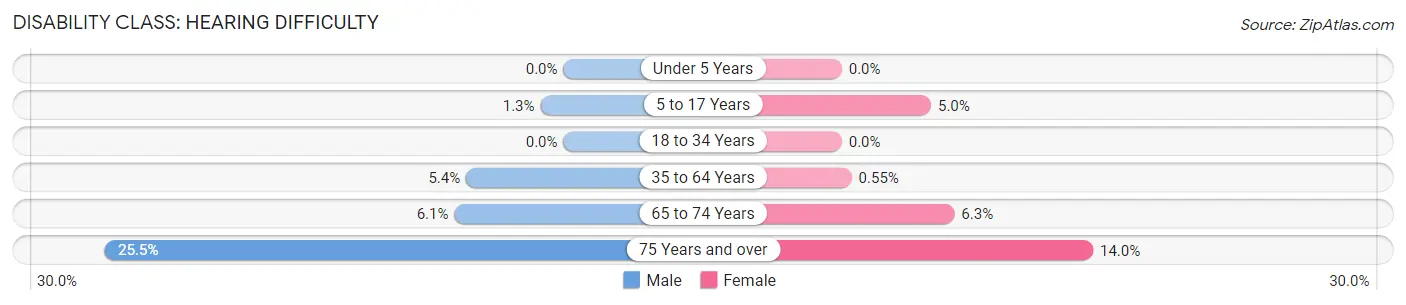
| Age Bracket | Male | Female |
| Under 5 Years | 0 (0.0%) | 0 (0.0%) |
| 5 to 17 Years | 5 (1.3%) | 15 (5.0%) |
| 18 to 34 Years | 0 (0.0%) | 0 (0.0%) |
| 35 to 64 Years | 44 (5.4%) | 5 (0.5%) |
| 65 to 74 Years | 15 (6.1%) | 16 (6.3%) |
| 75 Years and over | 49 (25.5%) | 47 (14.0%) |
Disability Class: Vision Difficulty
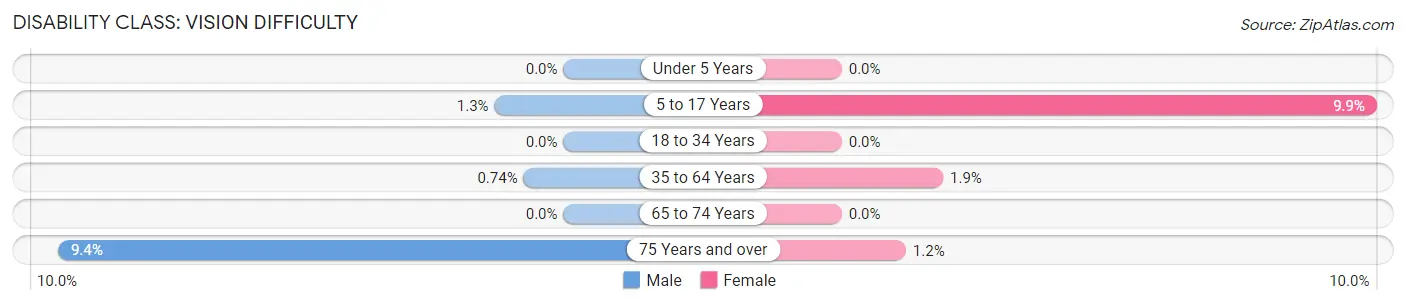
| Age Bracket | Male | Female |
| Under 5 Years | 0 (0.0%) | 0 (0.0%) |
| 5 to 17 Years | 5 (1.3%) | 30 (9.9%) |
| 18 to 34 Years | 0 (0.0%) | 0 (0.0%) |
| 35 to 64 Years | 6 (0.7%) | 17 (1.9%) |
| 65 to 74 Years | 0 (0.0%) | 0 (0.0%) |
| 75 Years and over | 18 (9.4%) | 4 (1.2%) |
Disability Class: Cognitive Difficulty
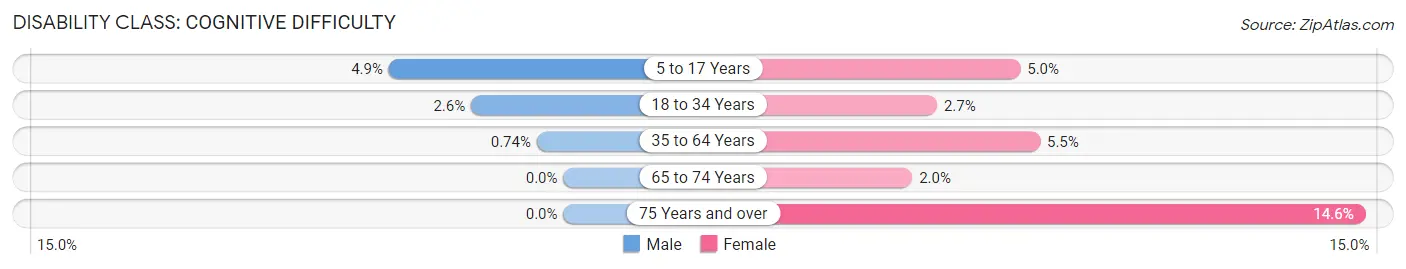
| Age Bracket | Male | Female |
| 5 to 17 Years | 19 (4.9%) | 15 (5.0%) |
| 18 to 34 Years | 14 (2.6%) | 9 (2.6%) |
| 35 to 64 Years | 6 (0.7%) | 50 (5.5%) |
| 65 to 74 Years | 0 (0.0%) | 5 (2.0%) |
| 75 Years and over | 0 (0.0%) | 49 (14.6%) |
Disability Class: Ambulatory Difficulty
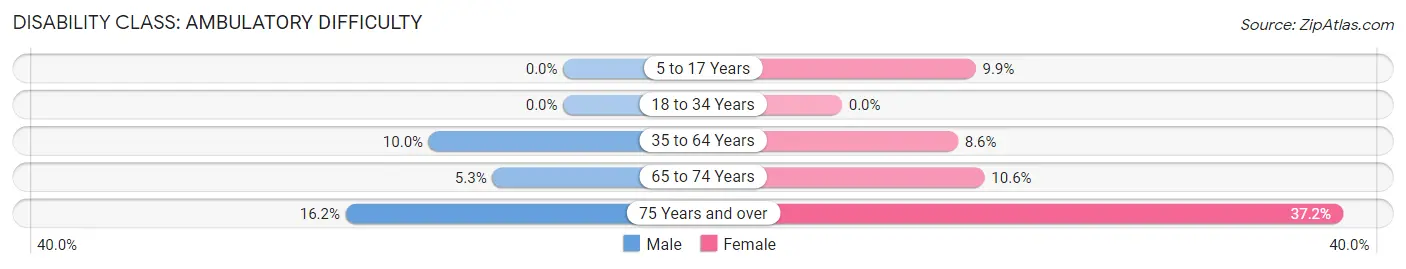
| Age Bracket | Male | Female |
| 5 to 17 Years | 0 (0.0%) | 30 (9.9%) |
| 18 to 34 Years | 0 (0.0%) | 0 (0.0%) |
| 35 to 64 Years | 81 (10.0%) | 78 (8.6%) |
| 65 to 74 Years | 13 (5.3%) | 27 (10.6%) |
| 75 Years and over | 31 (16.2%) | 125 (37.2%) |
Disability Class: Self-Care Difficulty
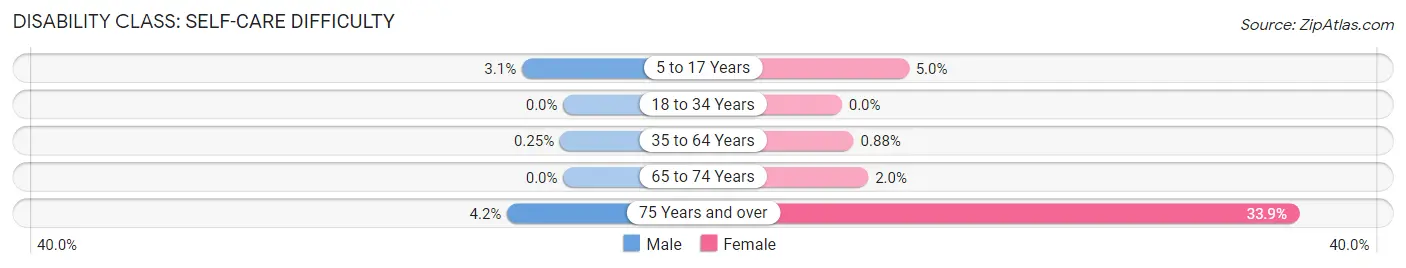
| Age Bracket | Male | Female |
| 5 to 17 Years | 12 (3.1%) | 15 (5.0%) |
| 18 to 34 Years | 0 (0.0%) | 0 (0.0%) |
| 35 to 64 Years | 2 (0.3%) | 8 (0.9%) |
| 65 to 74 Years | 0 (0.0%) | 5 (2.0%) |
| 75 Years and over | 8 (4.2%) | 114 (33.9%) |
Technology Access in Clarinda
Computing Device Access in Clarinda
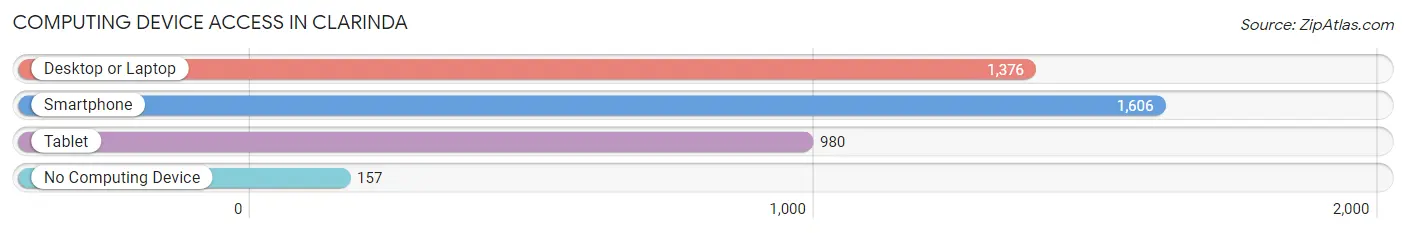
| Device Type | # Households | % Households |
| Desktop or Laptop | 1,376 | 69.5% |
| Smartphone | 1,606 | 81.1% |
| Tablet | 980 | 49.5% |
| No Computing Device | 157 | 7.9% |
| Total | 1,980 | 100.0% |
Internet Access in Clarinda
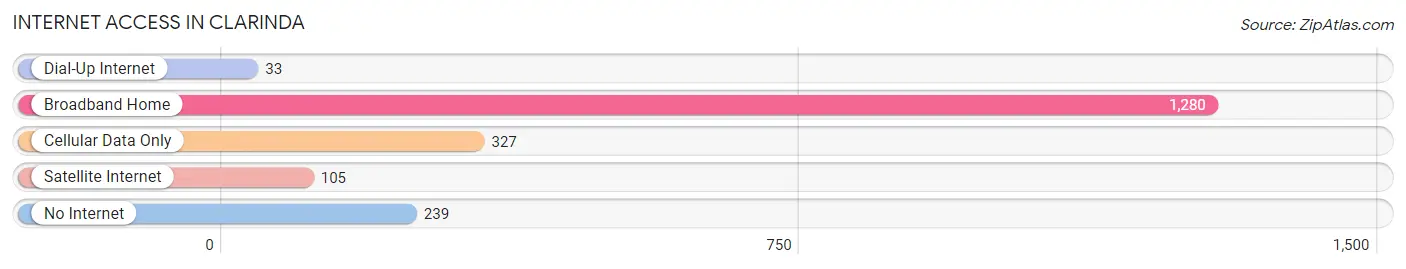
| Internet Type | # Households | % Households |
| Dial-Up Internet | 33 | 1.7% |
| Broadband Home | 1,280 | 64.6% |
| Cellular Data Only | 327 | 16.5% |
| Satellite Internet | 105 | 5.3% |
| No Internet | 239 | 12.1% |
| Total | 1,980 | 100.0% |
Clarinda Summary
Clara, Iowa is a small city located in the southwestern corner of the state, in Page County. It is situated along the East Nishnabotna River, and is the county seat. The city has a population of 5,022, according to the 2010 census.
History
Clara was founded in 1851 by a group of settlers from Ohio. The city was named after Clara Page, the daughter of one of the settlers. The city was incorporated in 1856, and the first post office was established in 1857.
The city was an important stop on the Chicago, Rock Island and Pacific Railroad, which ran through the city from 1871 to 1980. The railroad was a major factor in the growth of the city, and it was also the site of a major Civil War battle in 1864.
Geography
Clara is located in the southwestern corner of Page County, at the intersection of U.S. Route 34 and Iowa Highway 2. The city is situated along the East Nishnabotna River, and is surrounded by rolling hills and farmland. The city has a total area of 2.2 square miles, all of which is land.
Economy
The economy of Clara is largely based on agriculture and manufacturing. The city is home to several large manufacturing companies, including John Deere, Case IH, and Cargill. The city also has a thriving retail sector, with several stores and restaurants located in the downtown area.
Demographics
According to the 2010 census, Clara has a population of 5,022. The racial makeup of the city is 95.3% White, 0.7% African American, 0.3% Native American, 0.7% Asian, 0.1% Pacific Islander, 1.2% from other races, and 1.7% from two or more races. Hispanic or Latino of any race were 3.2% of the population.
The median income for a household in Clara was $41,944, and the median income for a family was $50,938. The per capita income for the city was $20,845. About 8.2% of families and 10.2% of the population were below the poverty line, including 14.2% of those under age 18 and 8.3% of those age 65 or over.
Common Questions
What is Per Capita Income in Clarinda?
Per Capita income in Clarinda is $26,662.
What is the Median Family Income in Clarinda?
Median Family Income in Clarinda is $69,375.
What is the Median Household income in Clarinda?
Median Household Income in Clarinda is $51,413.
What is Income or Wage Gap in Clarinda?
Income or Wage Gap in Clarinda is 26.7%.
Women in Clarinda earn 73.3 cents for every dollar earned by a man.
What is Inequality or Gini Index in Clarinda?
Inequality or Gini Index in Clarinda is 0.43.
What is the Total Population of Clarinda?
Total Population of Clarinda is 5,371.
What is the Total Male Population of Clarinda?
Total Male Population of Clarinda is 3,040.
What is the Total Female Population of Clarinda?
Total Female Population of Clarinda is 2,331.
What is the Ratio of Males per 100 Females in Clarinda?
There are 130.42 Males per 100 Females in Clarinda.
What is the Ratio of Females per 100 Males in Clarinda?
There are 76.68 Females per 100 Males in Clarinda.
What is the Median Population Age in Clarinda?
Median Population Age in Clarinda is 41.0 Years.
What is the Average Family Size in Clarinda
Average Family Size in Clarinda is 3.1 People.
What is the Average Household Size in Clarinda
Average Household Size in Clarinda is 2.3 People.
How Large is the Labor Force in Clarinda?
There are 2,326 People in the Labor Forcein in Clarinda.
What is the Percentage of People in the Labor Force in Clarinda?
51.3% of People are in the Labor Force in Clarinda.
What is the Unemployment Rate in Clarinda?
Unemployment Rate in Clarinda is 11.0%.