Toledo, IA Map & Demographics
Toledo Map
Toledo Overview
$27,988
PER CAPITA INCOME
$69,023
AVG FAMILY INCOME
$51,574
AVG HOUSEHOLD INCOME
40.8%
WAGE / INCOME GAP [ % ]
59.2¢/ $1
WAGE / INCOME GAP [ $ ]
$9,250
FAMILY INCOME DEFICIT
0.42
INEQUALITY / GINI INDEX
2,047
TOTAL POPULATION
934
MALE POPULATION
1,113
FEMALE POPULATION
83.92
MALES / 100 FEMALES
119.16
FEMALES / 100 MALES
40.3
MEDIAN AGE
2.7
AVG FAMILY SIZE
2.3
AVG HOUSEHOLD SIZE
933
LABOR FORCE [ PEOPLE ]
57.2%
PERCENT IN LABOR FORCE
10.5%
UNEMPLOYMENT RATE
Toledo Zip Codes
Toledo Area Codes
Income in Toledo
Income Overview in Toledo
Per Capita Income in Toledo is $27,988, while median incomes of families and households are $69,023 and $51,574 respectively.
| Characteristic | Number | Measure |
| Per Capita Income | 2,047 | $27,988 |
| Median Family Income | 525 | $69,023 |
| Mean Family Income | 525 | $78,141 |
| Median Household Income | 828 | $51,574 |
| Mean Household Income | 828 | $66,231 |
| Income Deficit | 525 | $9,250 |
| Wage / Income Gap (%) | 2,047 | 40.75% |
| Wage / Income Gap ($) | 2,047 | 59.25¢ per $1 |
| Gini / Inequality Index | 2,047 | 0.42 |
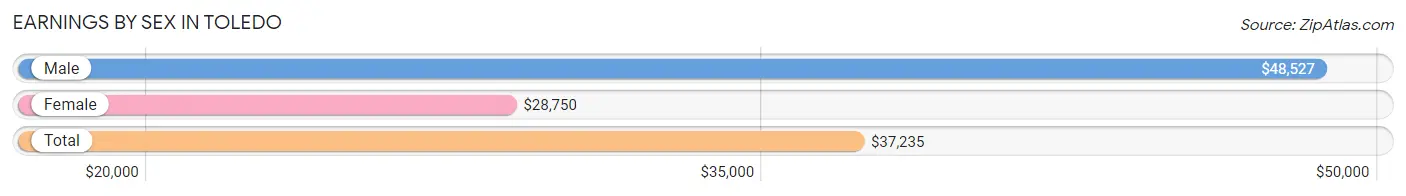
Earnings by Sex in Toledo
Average Earnings in Toledo are $37,235, $48,527 for men and $28,750 for women, a difference of 40.7%.
| Sex | Number | Average Earnings |
| Male | 459 (49.6%) | $48,527 |
| Female | 466 (50.4%) | $28,750 |
| Total | 925 (100.0%) | $37,235 |
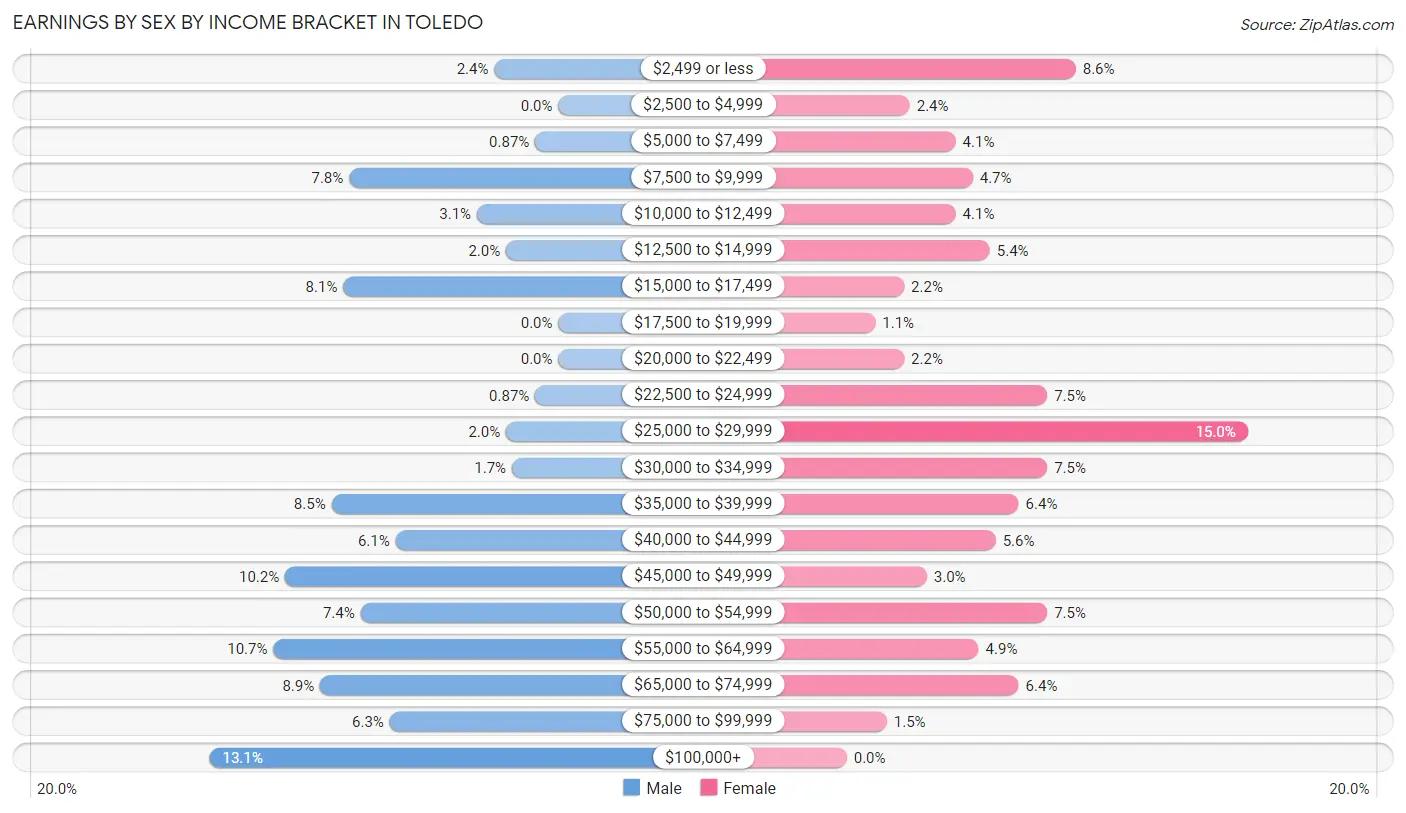
Earnings by Sex by Income Bracket in Toledo
The most common earnings brackets in Toledo are $100,000+ for men (60 | 13.1%) and $25,000 to $29,999 for women (70 | 15.0%).
| Income | Male | Female |
| $2,499 or less | 11 (2.4%) | 40 (8.6%) |
| $2,500 to $4,999 | 0 (0.0%) | 11 (2.4%) |
| $5,000 to $7,499 | 4 (0.9%) | 19 (4.1%) |
| $7,500 to $9,999 | 36 (7.8%) | 22 (4.7%) |
| $10,000 to $12,499 | 14 (3.0%) | 19 (4.1%) |
| $12,500 to $14,999 | 9 (2.0%) | 25 (5.4%) |
| $15,000 to $17,499 | 37 (8.1%) | 10 (2.1%) |
| $17,500 to $19,999 | 0 (0.0%) | 5 (1.1%) |
| $20,000 to $22,499 | 0 (0.0%) | 10 (2.1%) |
| $22,500 to $24,999 | 4 (0.9%) | 35 (7.5%) |
| $25,000 to $29,999 | 9 (2.0%) | 70 (15.0%) |
| $30,000 to $34,999 | 8 (1.7%) | 35 (7.5%) |
| $35,000 to $39,999 | 39 (8.5%) | 30 (6.4%) |
| $40,000 to $44,999 | 28 (6.1%) | 26 (5.6%) |
| $45,000 to $49,999 | 47 (10.2%) | 14 (3.0%) |
| $50,000 to $54,999 | 34 (7.4%) | 35 (7.5%) |
| $55,000 to $64,999 | 49 (10.7%) | 23 (4.9%) |
| $65,000 to $74,999 | 41 (8.9%) | 30 (6.4%) |
| $75,000 to $99,999 | 29 (6.3%) | 7 (1.5%) |
| $100,000+ | 60 (13.1%) | 0 (0.0%) |
| Total | 459 (100.0%) | 466 (100.0%) |
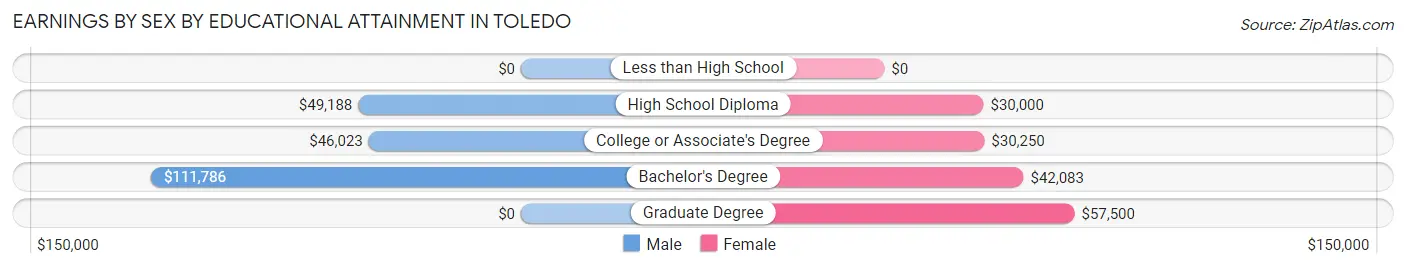
Earnings by Sex by Educational Attainment in Toledo
Average earnings in Toledo are $49,420 for men and $30,625 for women, a difference of 38.0%. Men with an educational attainment of bachelor's degree enjoy the highest average annual earnings of $111,786, while those with college or associate's degree education earn the least with $46,023. Women with an educational attainment of graduate degree earn the most with the average annual earnings of $57,500, while those with high school diploma education have the smallest earnings of $30,000.
| Educational Attainment | Male Income | Female Income |
| Less than High School | - | - |
| High School Diploma | $49,188 | $30,000 |
| College or Associate's Degree | $46,023 | $30,250 |
| Bachelor's Degree | $111,786 | $42,083 |
| Graduate Degree | - | - |
| Total | $49,420 | $30,625 |
Family Income in Toledo
Family Income Brackets in Toledo
According to the Toledo family income data, there are 91 families falling into the $100,000 to $149,999 income range, which is the most common income bracket and makes up 17.3% of all families. Conversely, the $15,000 to $24,999 income bracket is the least frequent group with only 12 families (2.3%) belonging to this category.
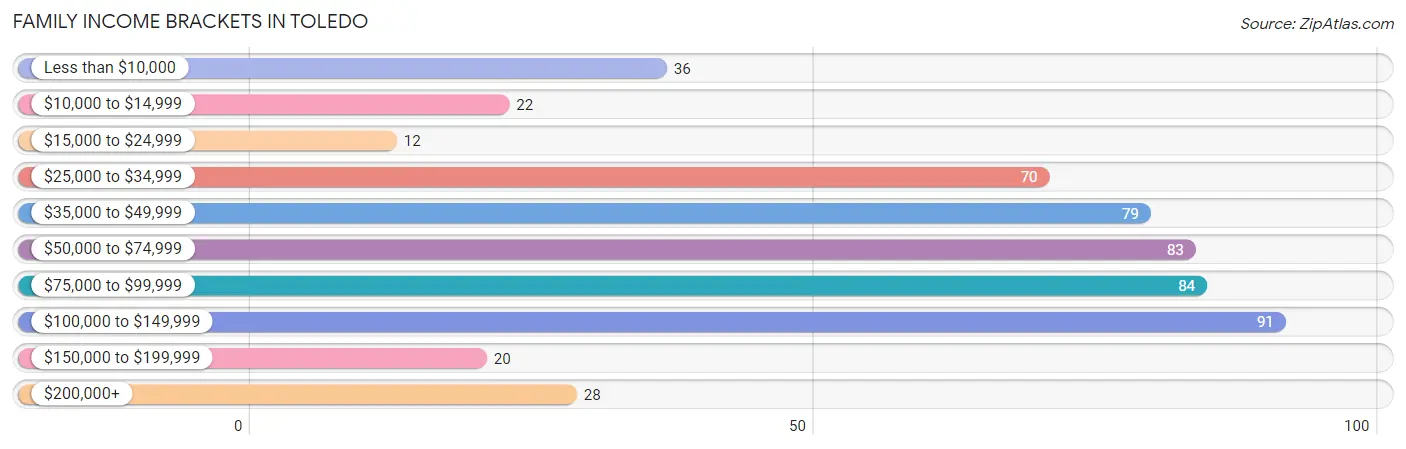
| Income Bracket | # Families | % Families |
| Less than $10,000 | 36 | 6.9% |
| $10,000 to $14,999 | 22 | 4.2% |
| $15,000 to $24,999 | 12 | 2.3% |
| $25,000 to $34,999 | 70 | 13.3% |
| $35,000 to $49,999 | 79 | 15.0% |
| $50,000 to $74,999 | 83 | 15.8% |
| $75,000 to $99,999 | 84 | 16.0% |
| $100,000 to $149,999 | 91 | 17.3% |
| $150,000 to $199,999 | 20 | 3.8% |
| $200,000+ | 28 | 5.3% |
Family Income by Famaliy Size in Toledo
5-person families (61 | 11.6%) account for the highest median family income in Toledo with $111,250 per family, while 2-person families (310 | 59.1%) have the highest median income of $36,354 per family member.
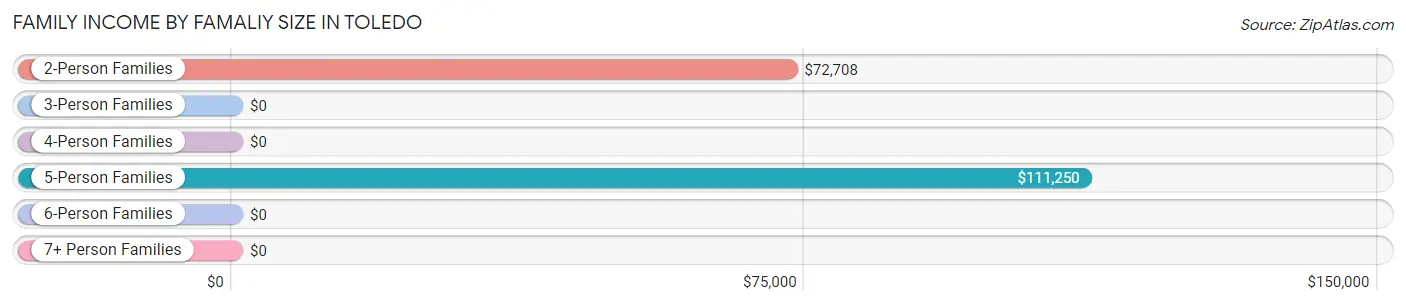
| Income Bracket | # Families | Median Income |
| 2-Person Families | 310 (59.1%) | $72,708 |
| 3-Person Families | 86 (16.4%) | $0 |
| 4-Person Families | 55 (10.5%) | $0 |
| 5-Person Families | 61 (11.6%) | $111,250 |
| 6-Person Families | 13 (2.5%) | $0 |
| 7+ Person Families | 0 (0.0%) | $0 |
| Total | 525 (100.0%) | $69,023 |
Family Income by Number of Earners in Toledo
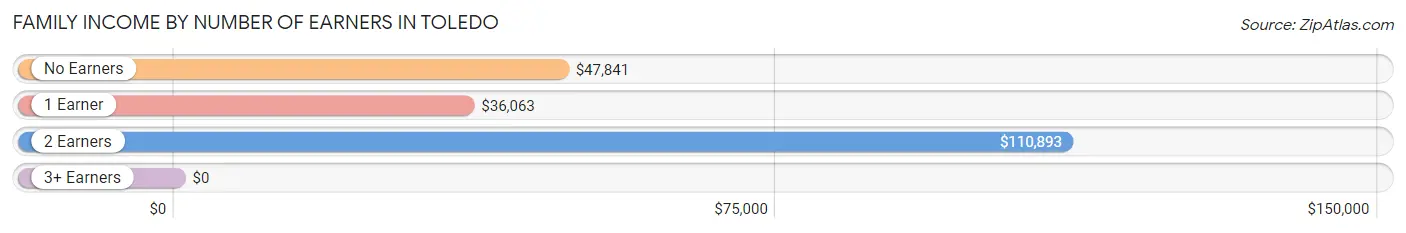
| Number of Earners | # Families | Median Income |
| No Earners | 121 (23.1%) | $47,841 |
| 1 Earner | 193 (36.8%) | $36,063 |
| 2 Earners | 207 (39.4%) | $110,893 |
| 3+ Earners | 4 (0.8%) | $0 |
| Total | 525 (100.0%) | $69,023 |
Household Income in Toledo
Household Income Brackets in Toledo
With 182 households falling in the category, the $50,000 to $74,999 income range is the most frequent in Toledo, accounting for 22.0% of all households. In contrast, only 27 households (3.3%) fall into the $150,000 to $199,999 income bracket, making it the least populous group.
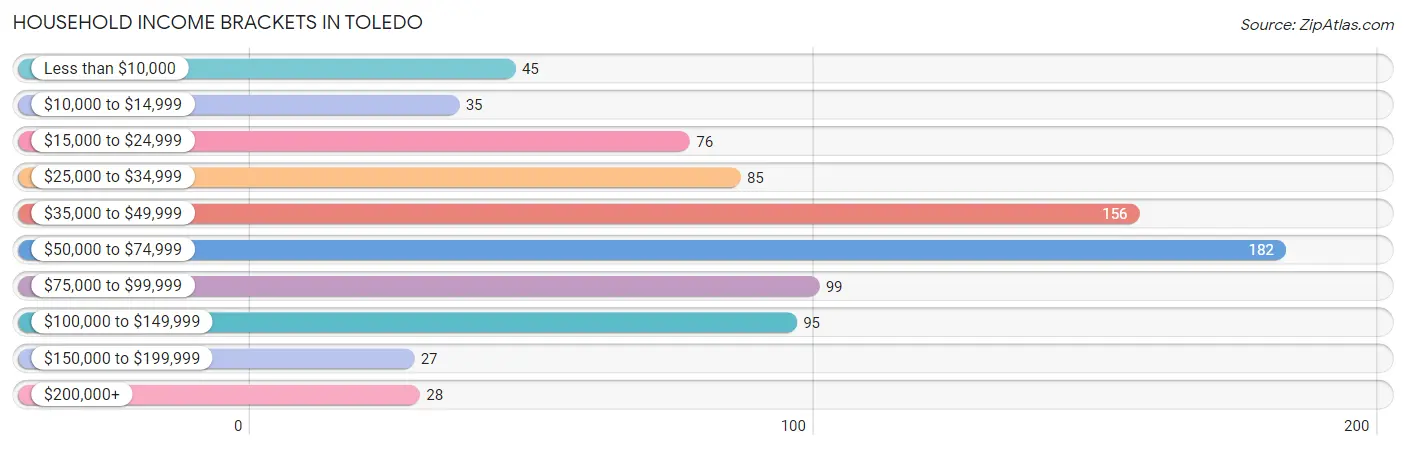
| Income Bracket | # Households | % Households |
| Less than $10,000 | 45 | 5.4% |
| $10,000 to $14,999 | 35 | 4.2% |
| $15,000 to $24,999 | 76 | 9.2% |
| $25,000 to $34,999 | 85 | 10.3% |
| $35,000 to $49,999 | 156 | 18.8% |
| $50,000 to $74,999 | 182 | 22.0% |
| $75,000 to $99,999 | 99 | 12.0% |
| $100,000 to $149,999 | 95 | 11.5% |
| $150,000 to $199,999 | 27 | 3.3% |
| $200,000+ | 28 | 3.4% |
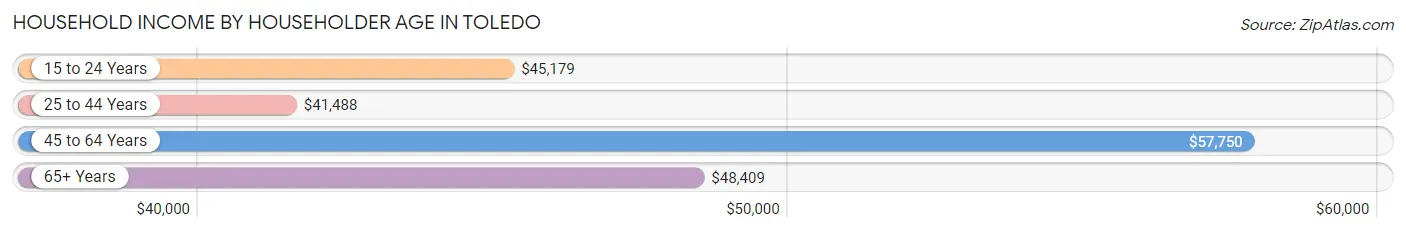
Household Income by Householder Age in Toledo
The median household income in Toledo is $51,574, with the highest median household income of $57,750 found in the 45 to 64 years age bracket for the primary householder. A total of 297 households (35.9%) fall into this category. Meanwhile, the 25 to 44 years age bracket for the primary householder has the lowest median household income of $41,488, with 209 households (25.2%) in this group.
| Income Bracket | # Households | Median Income |
| 15 to 24 Years | 102 (12.3%) | $45,179 |
| 25 to 44 Years | 209 (25.2%) | $41,488 |
| 45 to 64 Years | 297 (35.9%) | $57,750 |
| 65+ Years | 220 (26.6%) | $48,409 |
| Total | 828 (100.0%) | $51,574 |
Poverty in Toledo
Income Below Poverty by Sex and Age in Toledo
With 10.9% poverty level for males and 33.0% for females among the residents of Toledo, 6 to 11 year old males and 5 year old females are the most vulnerable to poverty, with 19 males (51.3%) and 8 females (100.0%) in their respective age groups living below the poverty level.
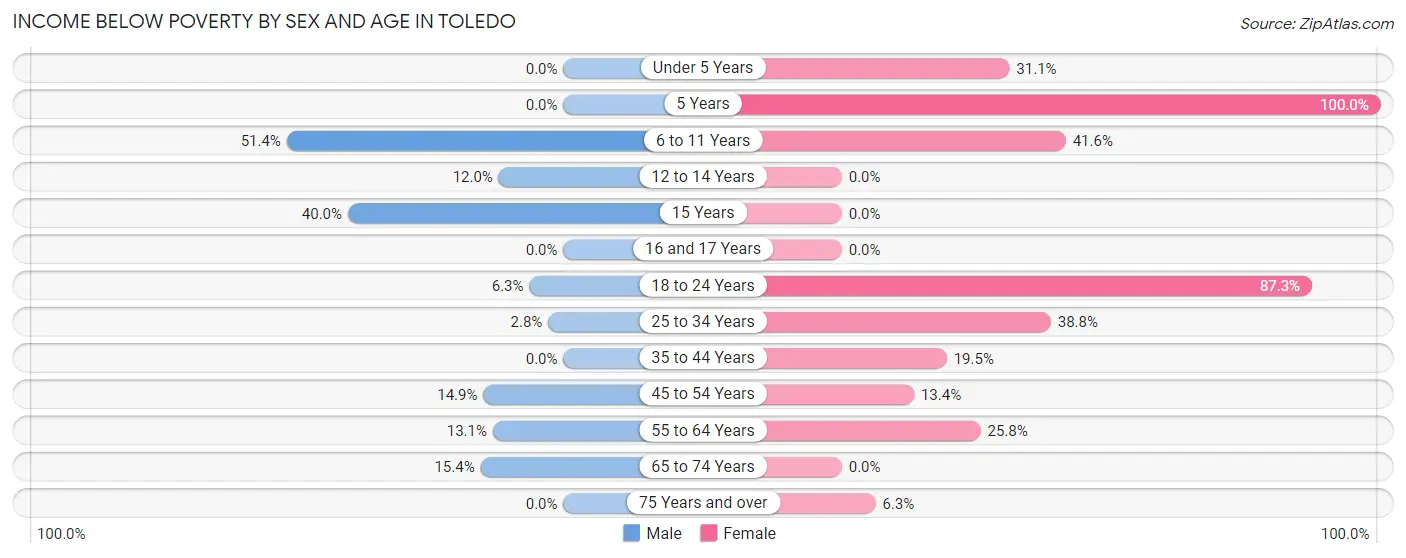
| Age Bracket | Male | Female |
| Under 5 Years | 0 (0.0%) | 28 (31.1%) |
| 5 Years | 0 (0.0%) | 8 (100.0%) |
| 6 to 11 Years | 19 (51.3%) | 37 (41.6%) |
| 12 to 14 Years | 6 (12.0%) | 0 (0.0%) |
| 15 Years | 6 (40.0%) | 0 (0.0%) |
| 16 and 17 Years | 0 (0.0%) | 0 (0.0%) |
| 18 to 24 Years | 7 (6.3%) | 137 (87.3%) |
| 25 to 34 Years | 2 (2.8%) | 45 (38.8%) |
| 35 to 44 Years | 0 (0.0%) | 15 (19.5%) |
| 45 to 54 Years | 11 (14.9%) | 13 (13.4%) |
| 55 to 64 Years | 25 (13.1%) | 51 (25.8%) |
| 65 to 74 Years | 16 (15.4%) | 0 (0.0%) |
| 75 Years and over | 0 (0.0%) | 5 (6.2%) |
| Total | 92 (10.9%) | 339 (33.0%) |
Income Above Poverty by Sex and Age in Toledo
According to the poverty statistics in Toledo, males aged under 5 years and females aged 12 to 14 years are the age groups that are most secure financially, with 100.0% of males and 100.0% of females in these age groups living above the poverty line.
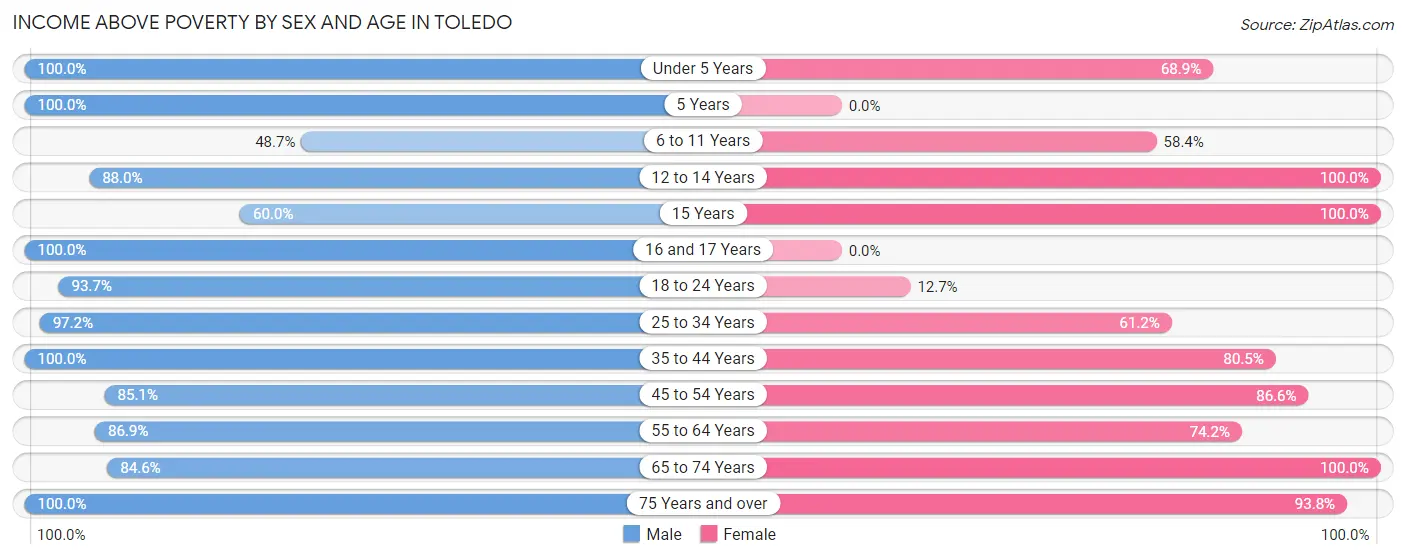
| Age Bracket | Male | Female |
| Under 5 Years | 22 (100.0%) | 62 (68.9%) |
| 5 Years | 16 (100.0%) | 0 (0.0%) |
| 6 to 11 Years | 18 (48.6%) | 52 (58.4%) |
| 12 to 14 Years | 44 (88.0%) | 14 (100.0%) |
| 15 Years | 9 (60.0%) | 16 (100.0%) |
| 16 and 17 Years | 8 (100.0%) | 0 (0.0%) |
| 18 to 24 Years | 104 (93.7%) | 20 (12.7%) |
| 25 to 34 Years | 69 (97.2%) | 71 (61.2%) |
| 35 to 44 Years | 76 (100.0%) | 62 (80.5%) |
| 45 to 54 Years | 63 (85.1%) | 84 (86.6%) |
| 55 to 64 Years | 166 (86.9%) | 147 (74.2%) |
| 65 to 74 Years | 88 (84.6%) | 86 (100.0%) |
| 75 Years and over | 71 (100.0%) | 75 (93.8%) |
| Total | 754 (89.1%) | 689 (67.0%) |
Income Below Poverty Among Married-Couple Families in Toledo
The poverty statistics for married-couple families in Toledo show that 8.6% or 32 of the total 370 families live below the poverty line. Families with 3 or 4 children have the highest poverty rate of 10.9%, comprising of 6 families. On the other hand, families with 1 or 2 children have the lowest poverty rate of 0.0%, which includes 0 families.
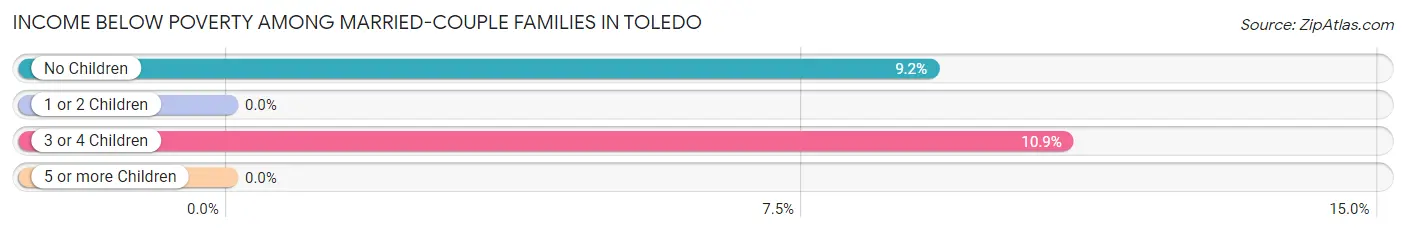
| Children | Above Poverty | Below Poverty |
| No Children | 258 (90.8%) | 26 (9.1%) |
| 1 or 2 Children | 31 (100.0%) | 0 (0.0%) |
| 3 or 4 Children | 49 (89.1%) | 6 (10.9%) |
| 5 or more Children | 0 (0.0%) | 0 (0.0%) |
| Total | 338 (91.3%) | 32 (8.6%) |
Income Below Poverty Among Single-Parent Households in Toledo
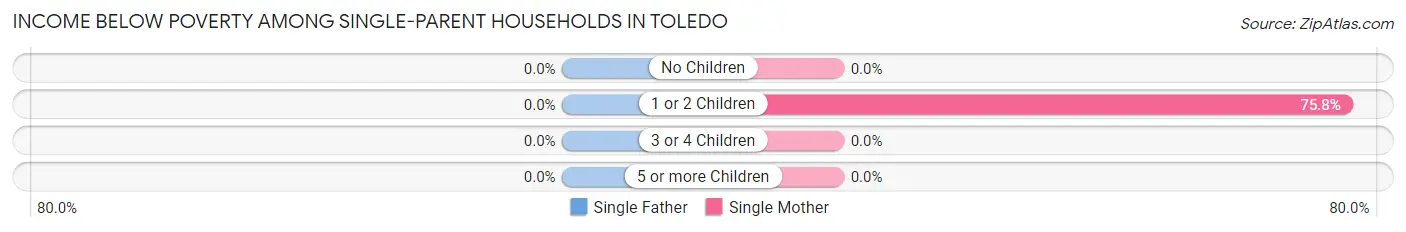
| Children | Single Father | Single Mother |
| No Children | 0 (0.0%) | 0 (0.0%) |
| 1 or 2 Children | 0 (0.0%) | 69 (75.8%) |
| 3 or 4 Children | 0 (0.0%) | 0 (0.0%) |
| 5 or more Children | 0 (0.0%) | 0 (0.0%) |
| Total | 0 (0.0%) | 69 (68.3%) |
Income Below Poverty Among Married-Couple vs Single-Parent Households in Toledo
The poverty data for Toledo shows that 32 of the married-couple family households (8.6%) and 69 of the single-parent households (44.5%) are living below the poverty level. Within the married-couple family households, those with 3 or 4 children have the highest poverty rate, with 6 households (10.9%) falling below the poverty line. Among the single-parent households, those with 1 or 2 children have the highest poverty rate, with 69 household (51.5%) living below poverty.
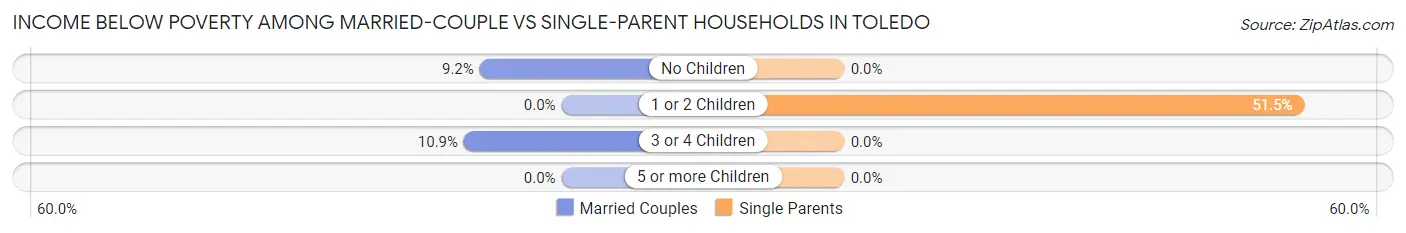
| Children | Married-Couple Families | Single-Parent Households |
| No Children | 26 (9.1%) | 0 (0.0%) |
| 1 or 2 Children | 0 (0.0%) | 69 (51.5%) |
| 3 or 4 Children | 6 (10.9%) | 0 (0.0%) |
| 5 or more Children | 0 (0.0%) | 0 (0.0%) |
| Total | 32 (8.6%) | 69 (44.5%) |
Race in Toledo
The most populous races in Toledo are White / Caucasian (1,742 | 85.1%), Native / Alaskan (176 | 8.6%), and Hispanic or Latino (159 | 7.8%).
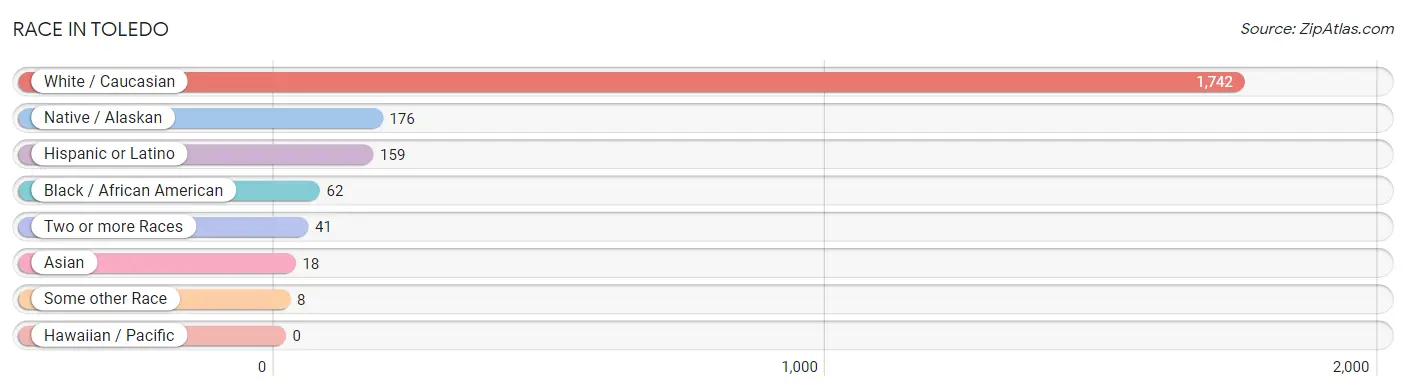
| Race | # Population | % Population |
| Asian | 18 | 0.9% |
| Black / African American | 62 | 3.0% |
| Hawaiian / Pacific | 0 | 0.0% |
| Hispanic or Latino | 159 | 7.8% |
| Native / Alaskan | 176 | 8.6% |
| White / Caucasian | 1,742 | 85.1% |
| Two or more Races | 41 | 2.0% |
| Some other Race | 8 | 0.4% |
| Total | 2,047 | 100.0% |
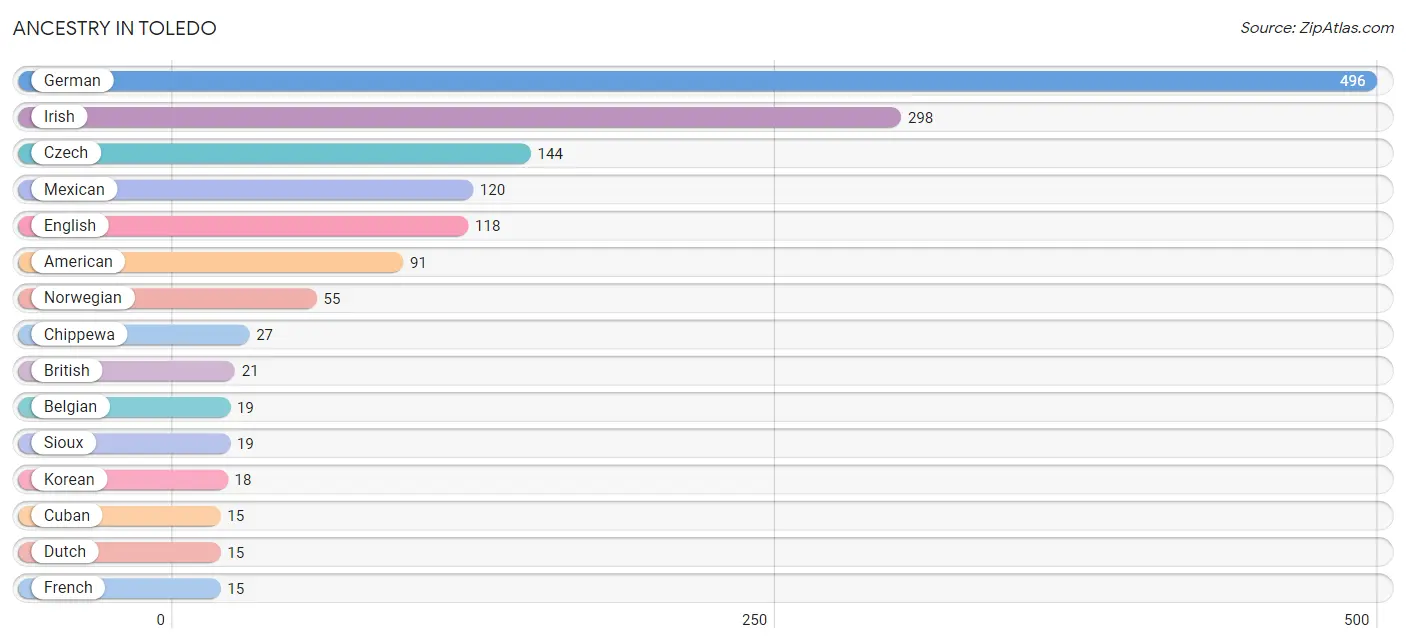
Ancestry in Toledo
The most populous ancestries reported in Toledo are German (496 | 24.2%), Irish (298 | 14.6%), Czech (144 | 7.0%), Mexican (120 | 5.9%), and English (118 | 5.8%), together accounting for 57.4% of all Toledo residents.
| Ancestry | # Population | % Population |
| American | 91 | 4.4% |
| Belgian | 19 | 0.9% |
| Bhutanese | 5 | 0.2% |
| British | 21 | 1.0% |
| Central American | 12 | 0.6% |
| Cherokee | 14 | 0.7% |
| Chippewa | 27 | 1.3% |
| Cuban | 15 | 0.7% |
| Czech | 144 | 7.0% |
| Czechoslovakian | 8 | 0.4% |
| Danish | 10 | 0.5% |
| Dutch | 15 | 0.7% |
| English | 118 | 5.8% |
| European | 2 | 0.1% |
| French | 15 | 0.7% |
| French Canadian | 5 | 0.2% |
| German | 496 | 24.2% |
| Guatemalan | 12 | 0.6% |
| Irish | 298 | 14.6% |
| Italian | 2 | 0.1% |
| Korean | 18 | 0.9% |
| Mexican | 120 | 5.9% |
| Norwegian | 55 | 2.7% |
| Polish | 7 | 0.3% |
| Puerto Rican | 12 | 0.6% |
| Scandinavian | 7 | 0.3% |
| Scotch-Irish | 13 | 0.6% |
| Scottish | 13 | 0.6% |
| Sioux | 19 | 0.9% |
| Slavic | 6 | 0.3% |
| Somali | 1 | 0.1% |
| Subsaharan African | 1 | 0.1% |
| Welsh | 5 | 0.2% | View All 33 Rows |
Immigrants in Toledo
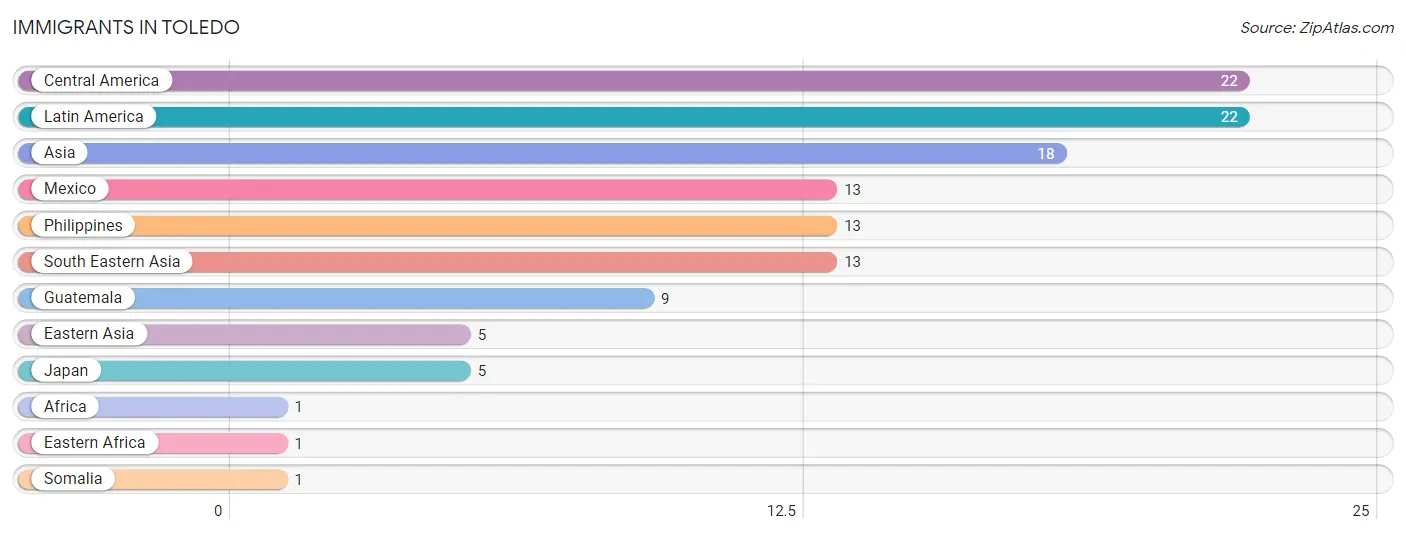
The most numerous immigrant groups reported in Toledo came from Central America (22 | 1.1%), Latin America (22 | 1.1%), Asia (18 | 0.9%), Mexico (13 | 0.6%), and Philippines (13 | 0.6%), together accounting for 4.3% of all Toledo residents.
| Immigration Origin | # Population | % Population |
| Africa | 1 | 0.1% |
| Asia | 18 | 0.9% |
| Central America | 22 | 1.1% |
| Eastern Africa | 1 | 0.1% |
| Eastern Asia | 5 | 0.2% |
| Guatemala | 9 | 0.4% |
| Japan | 5 | 0.2% |
| Latin America | 22 | 1.1% |
| Mexico | 13 | 0.6% |
| Philippines | 13 | 0.6% |
| Somalia | 1 | 0.1% |
| South Eastern Asia | 13 | 0.6% | View All 12 Rows |
Sex and Age in Toledo
Sex and Age in Toledo
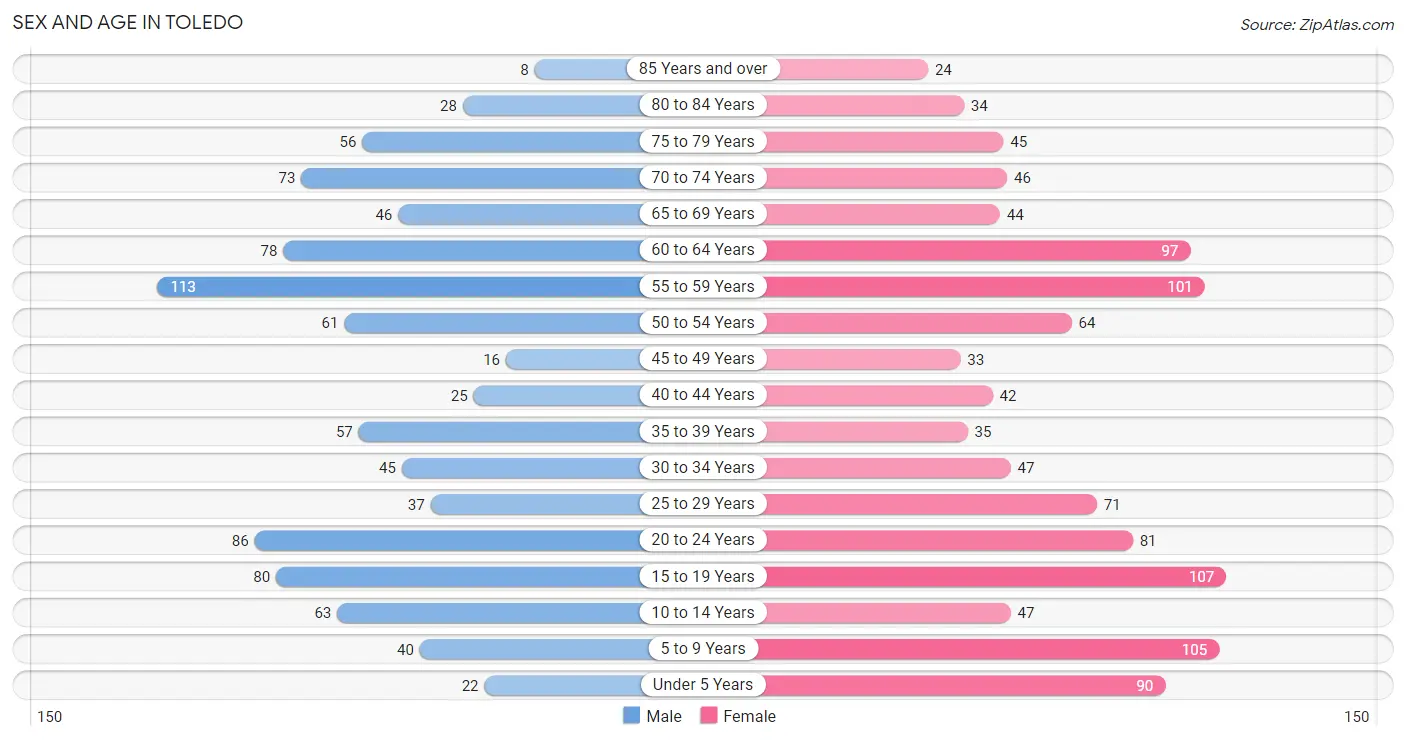
The most populous age groups in Toledo are 55 to 59 Years (113 | 12.1%) for men and 15 to 19 Years (107 | 9.6%) for women.
| Age Bracket | Male | Female |
| Under 5 Years | 22 (2.4%) | 90 (8.1%) |
| 5 to 9 Years | 40 (4.3%) | 105 (9.4%) |
| 10 to 14 Years | 63 (6.8%) | 47 (4.2%) |
| 15 to 19 Years | 80 (8.6%) | 107 (9.6%) |
| 20 to 24 Years | 86 (9.2%) | 81 (7.3%) |
| 25 to 29 Years | 37 (4.0%) | 71 (6.4%) |
| 30 to 34 Years | 45 (4.8%) | 47 (4.2%) |
| 35 to 39 Years | 57 (6.1%) | 35 (3.1%) |
| 40 to 44 Years | 25 (2.7%) | 42 (3.8%) |
| 45 to 49 Years | 16 (1.7%) | 33 (3.0%) |
| 50 to 54 Years | 61 (6.5%) | 64 (5.8%) |
| 55 to 59 Years | 113 (12.1%) | 101 (9.1%) |
| 60 to 64 Years | 78 (8.4%) | 97 (8.7%) |
| 65 to 69 Years | 46 (4.9%) | 44 (4.0%) |
| 70 to 74 Years | 73 (7.8%) | 46 (4.1%) |
| 75 to 79 Years | 56 (6.0%) | 45 (4.0%) |
| 80 to 84 Years | 28 (3.0%) | 34 (3.0%) |
| 85 Years and over | 8 (0.9%) | 24 (2.2%) |
| Total | 934 (100.0%) | 1,113 (100.0%) |
Families and Households in Toledo
Median Family Size in Toledo
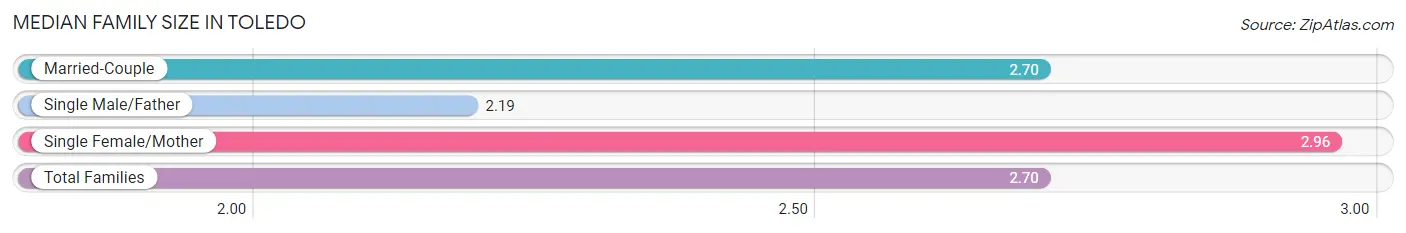
The median family size in Toledo is 2.70 persons per family, with single female/mother families (101 | 19.2%) accounting for the largest median family size of 2.96 persons per family. On the other hand, single male/father families (54 | 10.3%) represent the smallest median family size with 2.19 persons per family.
| Family Type | # Families | Family Size |
| Married-Couple | 370 (70.5%) | 2.70 |
| Single Male/Father | 54 (10.3%) | 2.19 |
| Single Female/Mother | 101 (19.2%) | 2.96 |
| Total Families | 525 (100.0%) | 2.70 |
Median Household Size in Toledo
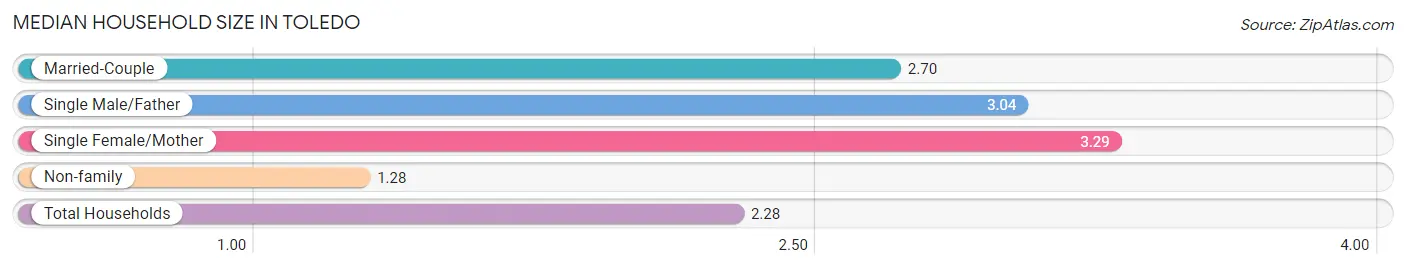
The median household size in Toledo is 2.28 persons per household, with single female/mother households (101 | 12.2%) accounting for the largest median household size of 3.29 persons per household. non-family households (303 | 36.6%) represent the smallest median household size with 1.28 persons per household.
| Household Type | # Households | Household Size |
| Married-Couple | 370 (44.7%) | 2.70 |
| Single Male/Father | 54 (6.5%) | 3.04 |
| Single Female/Mother | 101 (12.2%) | 3.29 |
| Non-family | 303 (36.6%) | 1.28 |
| Total Households | 828 (100.0%) | 2.28 |
Household Size by Marriage Status in Toledo
Out of a total of 828 households in Toledo, 525 (63.4%) are family households, while 303 (36.6%) are nonfamily households. The most numerous type of family households are 2-person households, comprising 293, and the most common type of nonfamily households are 1-person households, comprising 228.
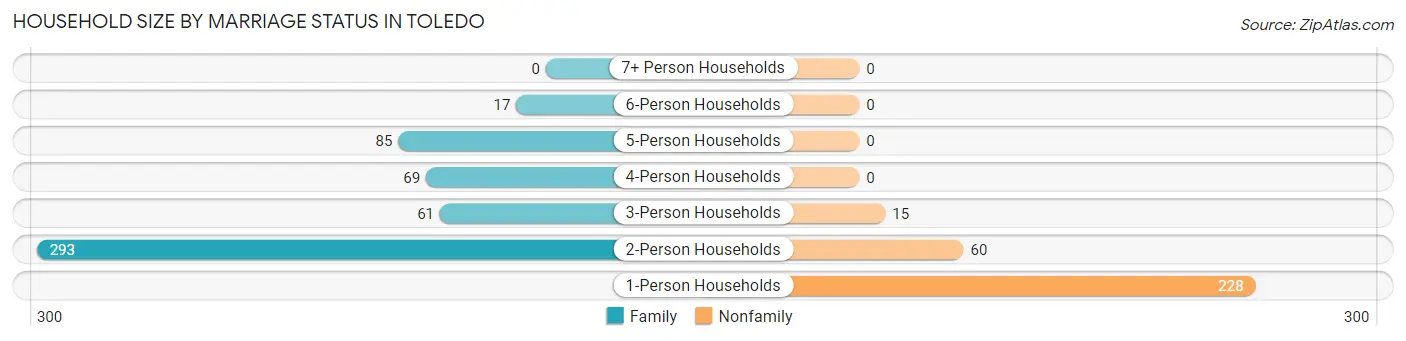
| Household Size | Family Households | Nonfamily Households |
| 1-Person Households | - | 228 (27.5%) |
| 2-Person Households | 293 (35.4%) | 60 (7.2%) |
| 3-Person Households | 61 (7.4%) | 15 (1.8%) |
| 4-Person Households | 69 (8.3%) | 0 (0.0%) |
| 5-Person Households | 85 (10.3%) | 0 (0.0%) |
| 6-Person Households | 17 (2.1%) | 0 (0.0%) |
| 7+ Person Households | 0 (0.0%) | 0 (0.0%) |
| Total | 525 (63.4%) | 303 (36.6%) |
Female Fertility in Toledo
Fertility by Age in Toledo
Average fertility rate in Toledo is 135.0 births per 1,000 women. Women in the age bracket of 15 to 19 years have the highest fertility rate with 299.0 births per 1,000 women. Women in the age bracket of 15 to 19 years acount for 55.2% of all women with births.
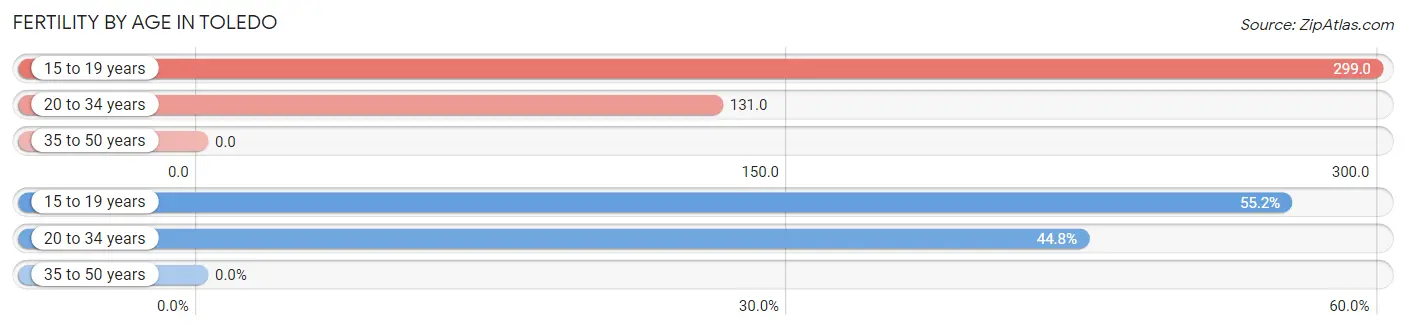
| Age Bracket | Women with Births | Births / 1,000 Women |
| 15 to 19 years | 32 (55.2%) | 299.0 |
| 20 to 34 years | 26 (44.8%) | 131.0 |
| 35 to 50 years | 0 (0.0%) | 0.0 |
| Total | 58 (100.0%) | 135.0 |
Fertility by Age by Marriage Status in Toledo
41.4% of women with births (58) in Toledo are married. The highest percentage of unmarried women with births falls into 15 to 19 years age bracket with 100.0% of them unmarried at the time of birth, while the lowest percentage of unmarried women with births belong to 20 to 34 years age bracket with 7.7% of them unmarried.
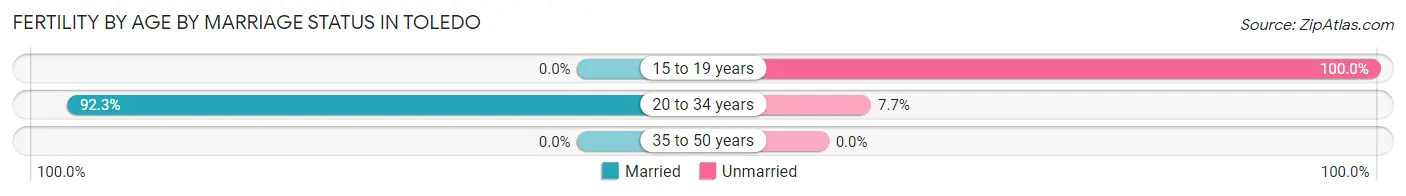
| Age Bracket | Married | Unmarried |
| 15 to 19 years | 0 (0.0%) | 32 (100.0%) |
| 20 to 34 years | 24 (92.3%) | 2 (7.7%) |
| 35 to 50 years | 0 (0.0%) | 0 (0.0%) |
| Total | 24 (41.4%) | 34 (58.6%) |
Fertility by Education in Toledo
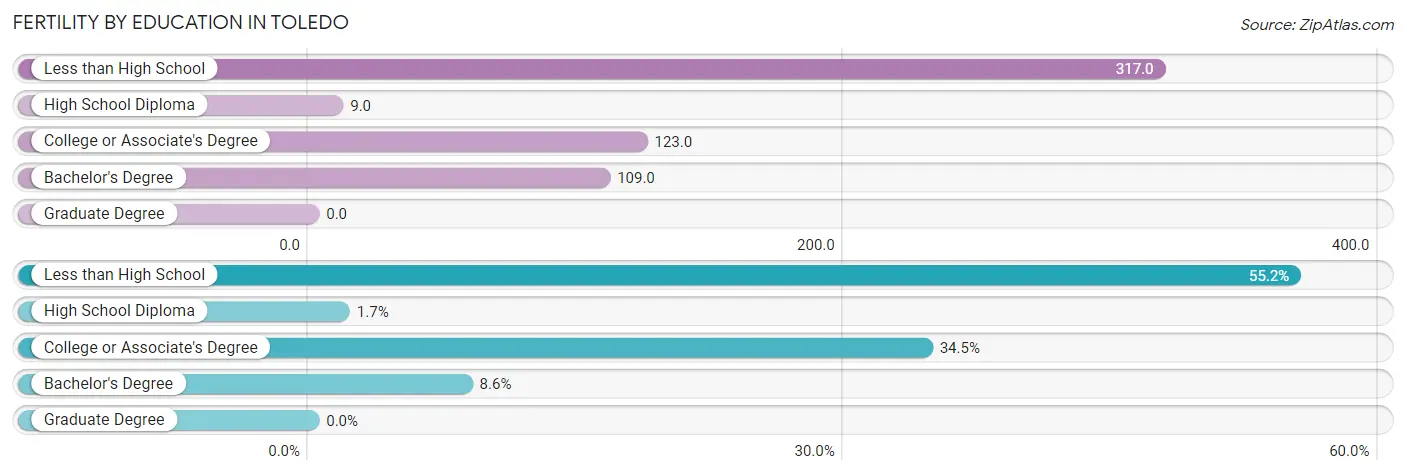
| Educational Attainment | Women with Births | Births / 1,000 Women |
| Less than High School | 32 (55.2%) | 317.0 |
| High School Diploma | 1 (1.7%) | 9.0 |
| College or Associate's Degree | 20 (34.5%) | 123.0 |
| Bachelor's Degree | 5 (8.6%) | 109.0 |
| Graduate Degree | 0 (0.0%) | 0.0 |
| Total | 58 (100.0%) | 135.0 |
Fertility by Education by Marriage Status in Toledo
58.6% of women with births in Toledo are unmarried. Women with the educational attainment of high school diploma are most likely to be married with 100.0% of them married at childbirth, while women with the educational attainment of less than high school are least likely to be married with 100.0% of them unmarried at childbirth.
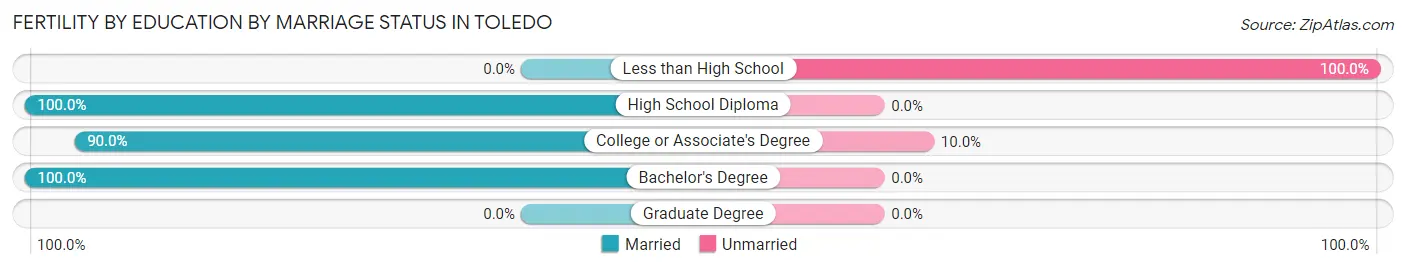
| Educational Attainment | Married | Unmarried |
| Less than High School | 0 (0.0%) | 32 (100.0%) |
| High School Diploma | 1 (100.0%) | 0 (0.0%) |
| College or Associate's Degree | 18 (90.0%) | 2 (10.0%) |
| Bachelor's Degree | 5 (100.0%) | 0 (0.0%) |
| Graduate Degree | 0 (0.0%) | 0 (0.0%) |
| Total | 24 (41.4%) | 34 (58.6%) |
Employment Characteristics in Toledo
Employment by Class of Employer in Toledo
Among the 812 employed individuals in Toledo, private company employees (556 | 68.5%), local government employees (87 | 10.7%), and state government employees (50 | 6.2%) make up the most common classes of employment.
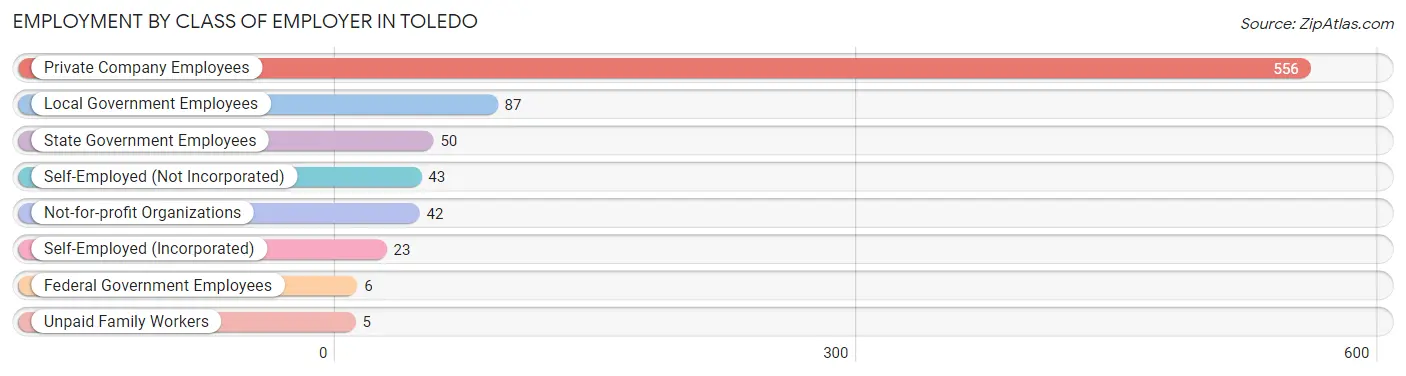
| Employer Class | # Employees | % Employees |
| Private Company Employees | 556 | 68.5% |
| Self-Employed (Incorporated) | 23 | 2.8% |
| Self-Employed (Not Incorporated) | 43 | 5.3% |
| Not-for-profit Organizations | 42 | 5.2% |
| Local Government Employees | 87 | 10.7% |
| State Government Employees | 50 | 6.2% |
| Federal Government Employees | 6 | 0.7% |
| Unpaid Family Workers | 5 | 0.6% |
| Total | 812 | 100.0% |
Employment Status by Age in Toledo
According to the labor force statistics for Toledo, out of the total population over 16 years of age (1,631), 57.2% or 933 individuals are in the labor force, with 10.5% or 98 of them unemployed. The age group with the highest labor force participation rate is 30 to 34 years, with 92.4% or 85 individuals in the labor force. Within the labor force, the 16 to 19 years age range has the highest percentage of unemployed individuals, with 65.6% or 42 of them being unemployed.
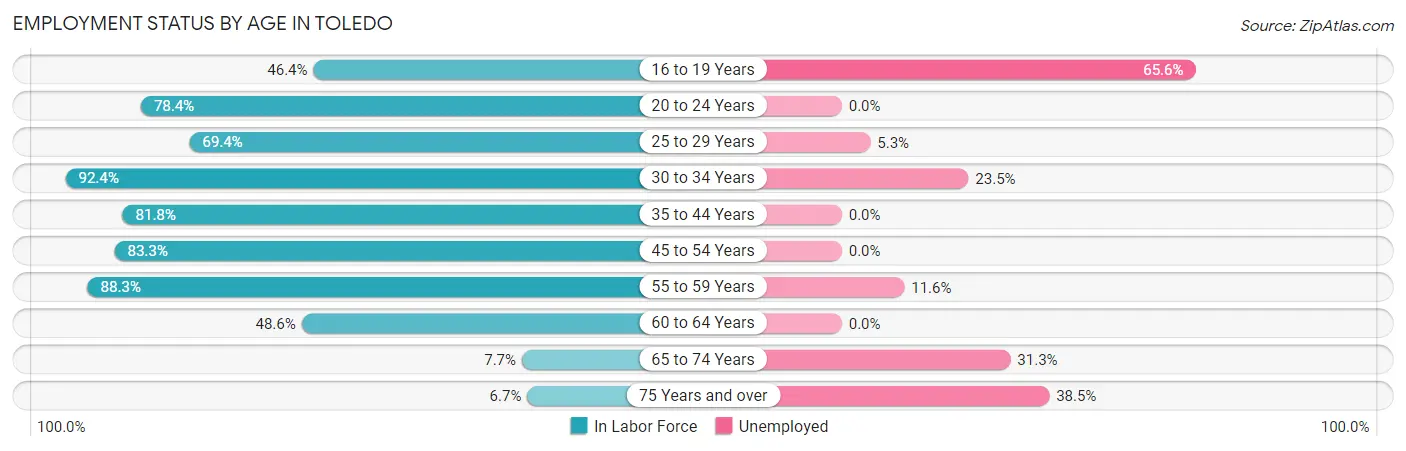
| Age Bracket | In Labor Force | Unemployed |
| 16 to 19 Years | 64 (46.4%) | 42 (65.6%) |
| 20 to 24 Years | 131 (78.4%) | 0 (0.0%) |
| 25 to 29 Years | 75 (69.4%) | 4 (5.3%) |
| 30 to 34 Years | 85 (92.4%) | 20 (23.5%) |
| 35 to 44 Years | 130 (81.8%) | 0 (0.0%) |
| 45 to 54 Years | 145 (83.3%) | 0 (0.0%) |
| 55 to 59 Years | 189 (88.3%) | 22 (11.6%) |
| 60 to 64 Years | 85 (48.6%) | 0 (0.0%) |
| 65 to 74 Years | 16 (7.7%) | 5 (31.3%) |
| 75 Years and over | 13 (6.7%) | 5 (38.5%) |
| Total | 933 (57.2%) | 98 (10.5%) |
Employment Status by Educational Attainment in Toledo
According to labor force statistics for Toledo, 76.9% of individuals (709) out of the total population between 25 and 64 years of age (922) are in the labor force, with 6.5% or 46 of them being unemployed. The group with the highest labor force participation rate are those with the educational attainment of bachelor's degree or higher, with 90.8% or 99 individuals in the labor force. Within the labor force, individuals with high school diploma education have the highest percentage of unemployment, with 14.6% or 46 of them being unemployed.
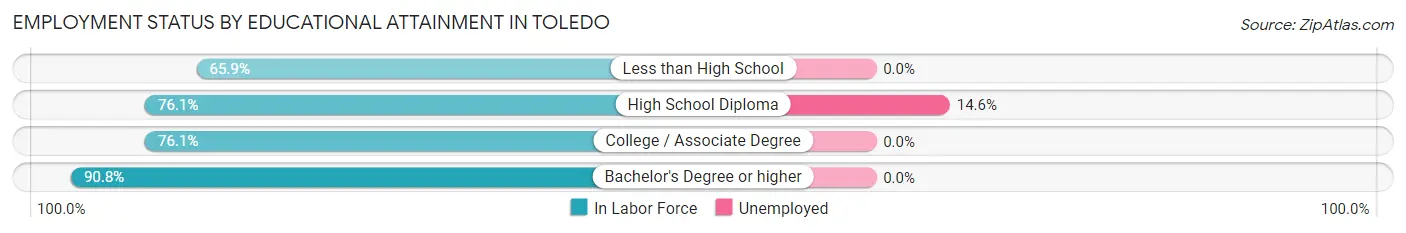
| Educational Attainment | In Labor Force | Unemployed |
| Less than High School | 56 (65.9%) | 0 (0.0%) |
| High School Diploma | 315 (76.1%) | 60 (14.6%) |
| College / Associate Degree | 239 (76.1%) | 0 (0.0%) |
| Bachelor's Degree or higher | 99 (90.8%) | 0 (0.0%) |
| Total | 709 (76.9%) | 60 (6.5%) |
Employment Occupations by Sex in Toledo
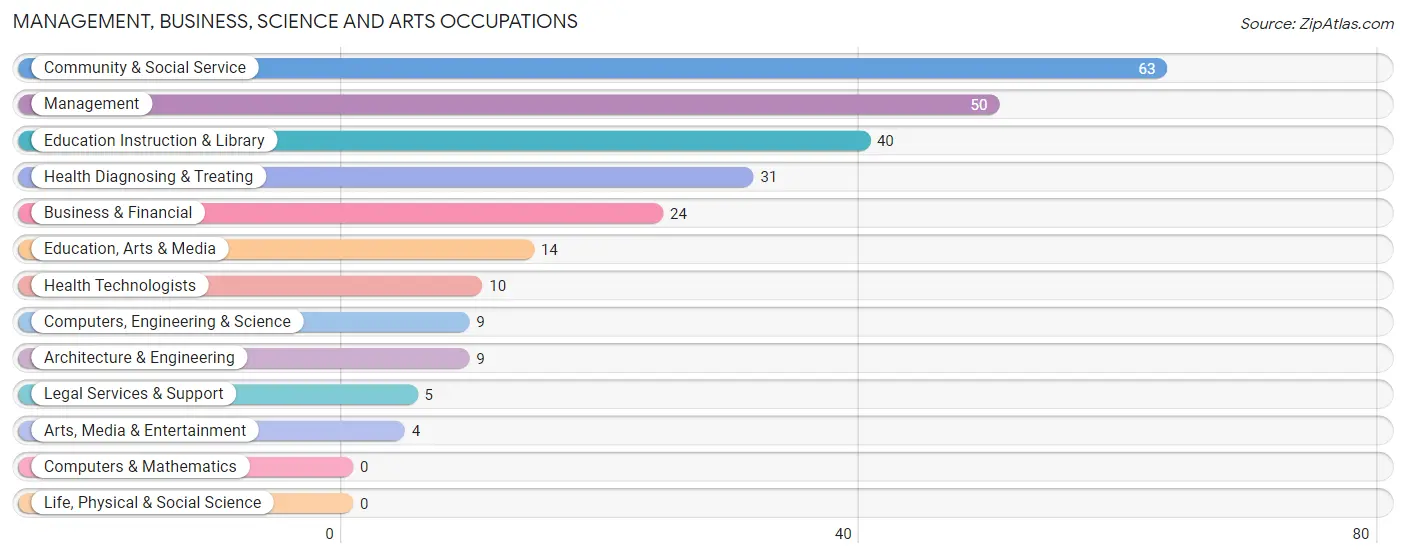
Management, Business, Science and Arts Occupations
The most common Management, Business, Science and Arts occupations in Toledo are Community & Social Service (63 | 7.5%), Management (50 | 6.0%), Education Instruction & Library (40 | 4.8%), Health Diagnosing & Treating (31 | 3.7%), and Business & Financial (24 | 2.9%).
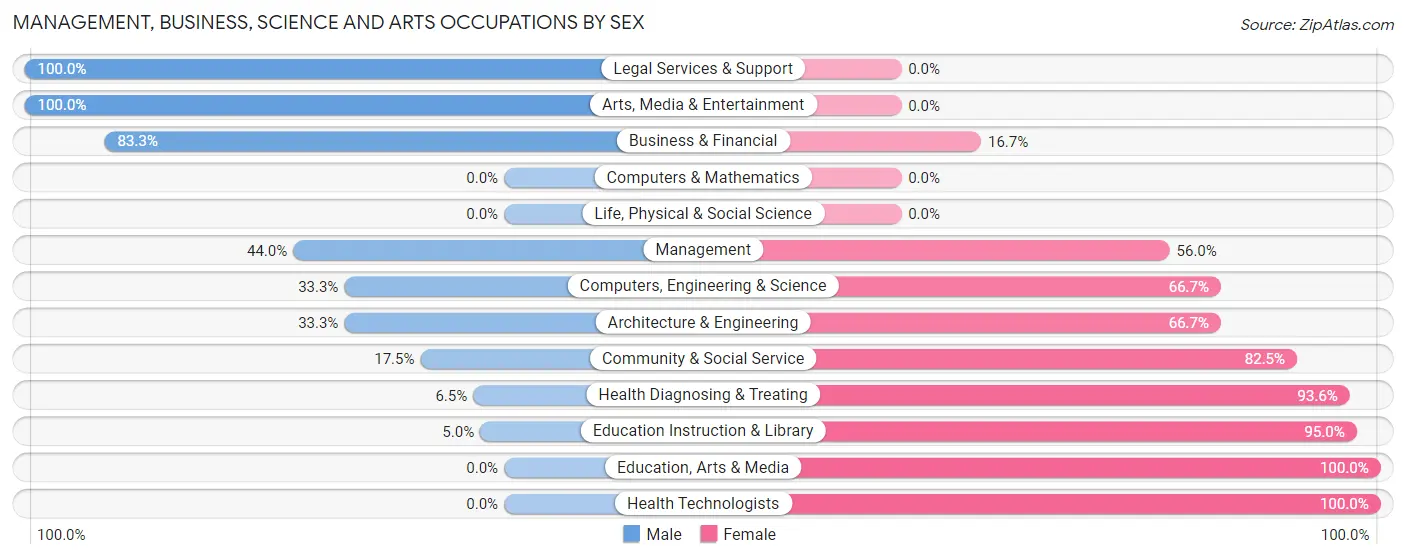
Management, Business, Science and Arts Occupations by Sex
Within the Management, Business, Science and Arts occupations in Toledo, the most male-oriented occupations are Legal Services & Support (100.0%), Arts, Media & Entertainment (100.0%), and Business & Financial (83.3%), while the most female-oriented occupations are Education, Arts & Media (100.0%), Health Technologists (100.0%), and Education Instruction & Library (95.0%).
| Occupation | Male | Female |
| Management | 22 (44.0%) | 28 (56.0%) |
| Business & Financial | 20 (83.3%) | 4 (16.7%) |
| Computers, Engineering & Science | 3 (33.3%) | 6 (66.7%) |
| Computers & Mathematics | 0 (0.0%) | 0 (0.0%) |
| Architecture & Engineering | 3 (33.3%) | 6 (66.7%) |
| Life, Physical & Social Science | 0 (0.0%) | 0 (0.0%) |
| Community & Social Service | 11 (17.5%) | 52 (82.5%) |
| Education, Arts & Media | 0 (0.0%) | 14 (100.0%) |
| Legal Services & Support | 5 (100.0%) | 0 (0.0%) |
| Education Instruction & Library | 2 (5.0%) | 38 (95.0%) |
| Arts, Media & Entertainment | 4 (100.0%) | 0 (0.0%) |
| Health Diagnosing & Treating | 2 (6.5%) | 29 (93.5%) |
| Health Technologists | 0 (0.0%) | 10 (100.0%) |
| Total (Category) | 58 (32.8%) | 119 (67.2%) |
| Total (Overall) | 409 (49.0%) | 426 (51.0%) |
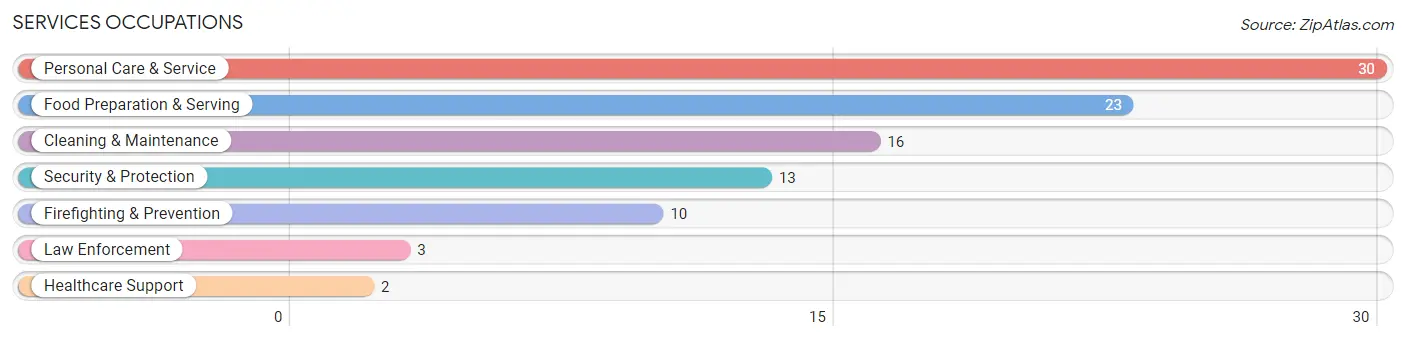
Services Occupations
The most common Services occupations in Toledo are Personal Care & Service (30 | 3.6%), Food Preparation & Serving (23 | 2.8%), Cleaning & Maintenance (16 | 1.9%), Security & Protection (13 | 1.6%), and Firefighting & Prevention (10 | 1.2%).
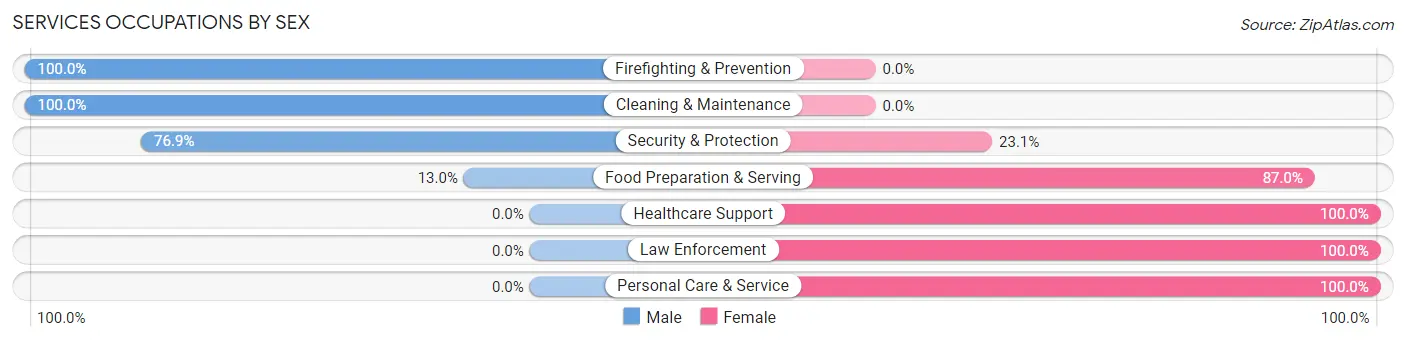
Services Occupations by Sex
Within the Services occupations in Toledo, the most male-oriented occupations are Firefighting & Prevention (100.0%), Cleaning & Maintenance (100.0%), and Security & Protection (76.9%), while the most female-oriented occupations are Healthcare Support (100.0%), Law Enforcement (100.0%), and Personal Care & Service (100.0%).
| Occupation | Male | Female |
| Healthcare Support | 0 (0.0%) | 2 (100.0%) |
| Security & Protection | 10 (76.9%) | 3 (23.1%) |
| Firefighting & Prevention | 10 (100.0%) | 0 (0.0%) |
| Law Enforcement | 0 (0.0%) | 3 (100.0%) |
| Food Preparation & Serving | 3 (13.0%) | 20 (87.0%) |
| Cleaning & Maintenance | 16 (100.0%) | 0 (0.0%) |
| Personal Care & Service | 0 (0.0%) | 30 (100.0%) |
| Total (Category) | 29 (34.5%) | 55 (65.5%) |
| Total (Overall) | 409 (49.0%) | 426 (51.0%) |
Sales and Office Occupations
The most common Sales and Office occupations in Toledo are Office & Administration (130 | 15.6%), and Sales & Related (89 | 10.7%).

Sales and Office Occupations by Sex

| Occupation | Male | Female |
| Sales & Related | 53 (59.6%) | 36 (40.5%) |
| Office & Administration | 11 (8.5%) | 119 (91.5%) |
| Total (Category) | 64 (29.2%) | 155 (70.8%) |
| Total (Overall) | 409 (49.0%) | 426 (51.0%) |
Natural Resources, Construction and Maintenance Occupations
The most common Natural Resources, Construction and Maintenance occupations in Toledo are Construction & Extraction (72 | 8.6%), and Installation, Maintenance & Repair (20 | 2.4%).
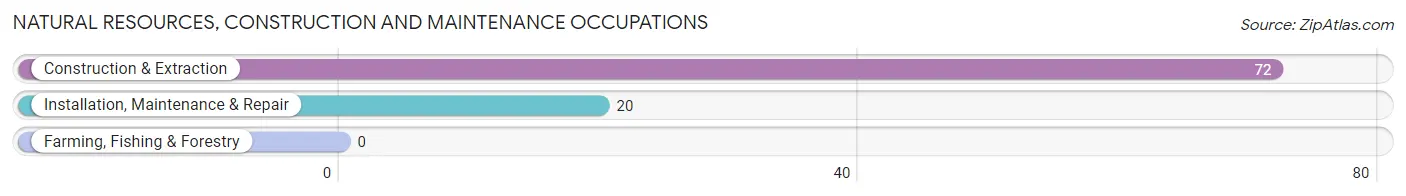
Natural Resources, Construction and Maintenance Occupations by Sex

| Occupation | Male | Female |
| Farming, Fishing & Forestry | 0 (0.0%) | 0 (0.0%) |
| Construction & Extraction | 72 (100.0%) | 0 (0.0%) |
| Installation, Maintenance & Repair | 20 (100.0%) | 0 (0.0%) |
| Total (Category) | 92 (100.0%) | 0 (0.0%) |
| Total (Overall) | 409 (49.0%) | 426 (51.0%) |
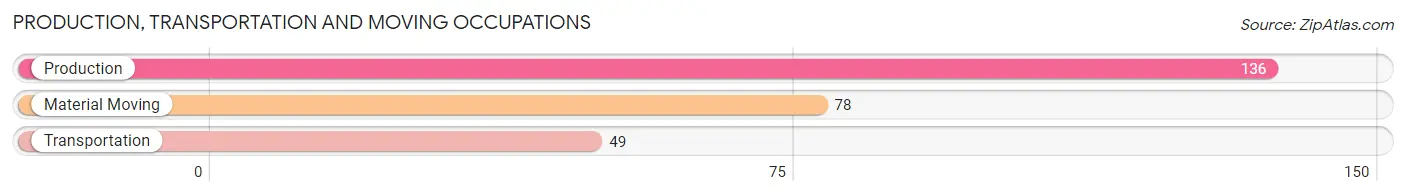
Production, Transportation and Moving Occupations
The most common Production, Transportation and Moving occupations in Toledo are Production (136 | 16.3%), Material Moving (78 | 9.3%), and Transportation (49 | 5.9%).
Production, Transportation and Moving Occupations by Sex
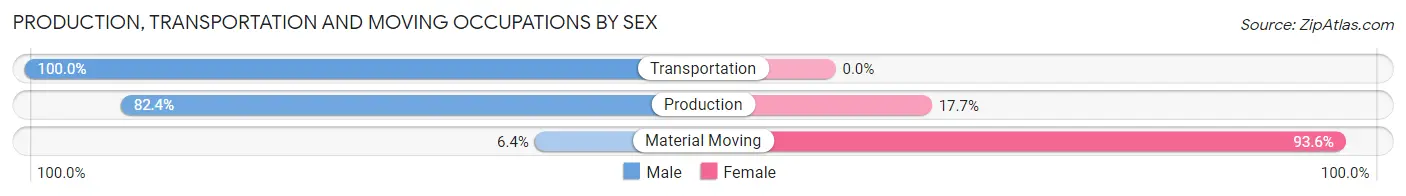
| Occupation | Male | Female |
| Production | 112 (82.4%) | 24 (17.6%) |
| Transportation | 49 (100.0%) | 0 (0.0%) |
| Material Moving | 5 (6.4%) | 73 (93.6%) |
| Total (Category) | 166 (63.1%) | 97 (36.9%) |
| Total (Overall) | 409 (49.0%) | 426 (51.0%) |
Employment Industries by Sex in Toledo
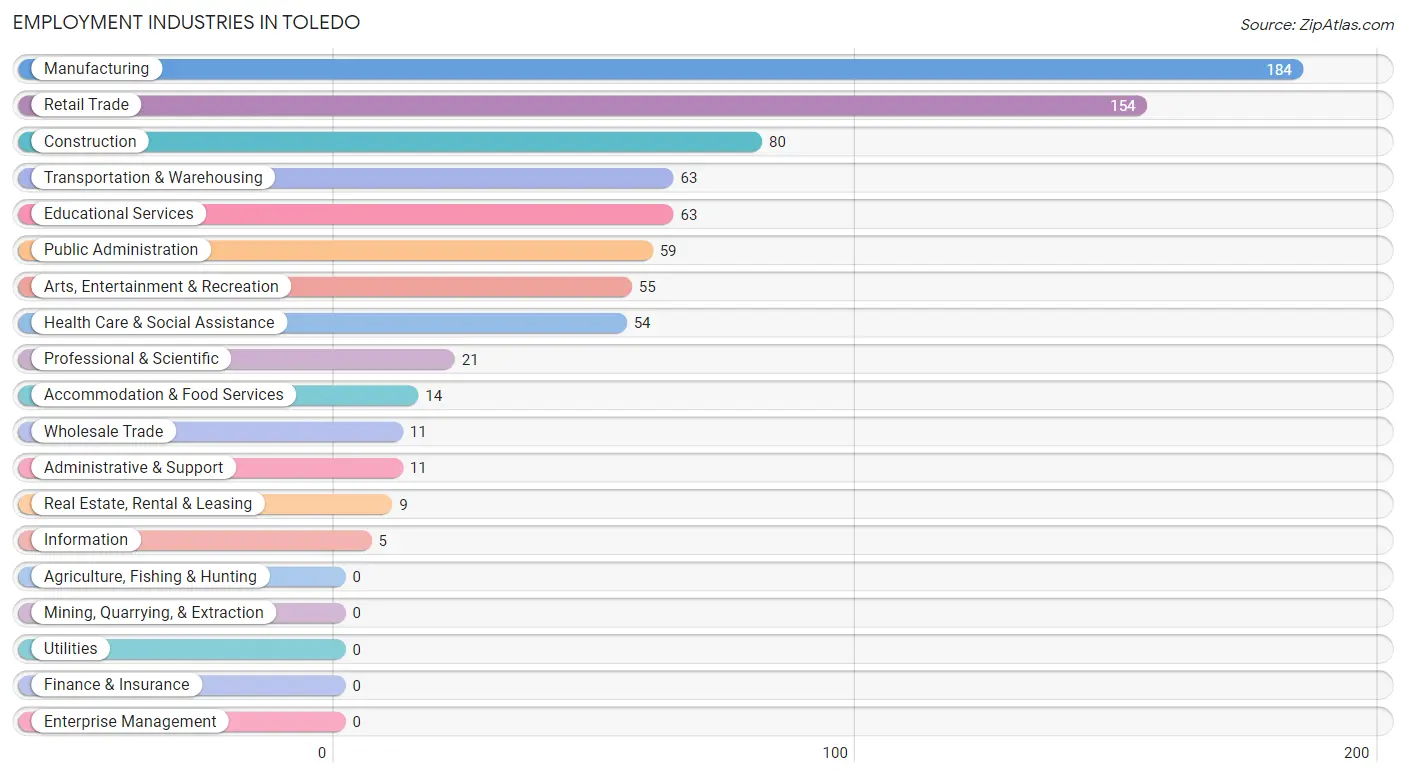
Employment Industries in Toledo
The major employment industries in Toledo include Manufacturing (184 | 22.0%), Retail Trade (154 | 18.4%), Construction (80 | 9.6%), Transportation & Warehousing (63 | 7.5%), and Educational Services (63 | 7.5%).
Employment Industries by Sex in Toledo
The Toledo industries that see more men than women are Wholesale Trade (100.0%), Transportation & Warehousing (100.0%), and Real Estate, Rental & Leasing (100.0%), whereas the industries that tend to have a higher number of women are Information (100.0%), Health Care & Social Assistance (87.0%), and Public Administration (86.4%).
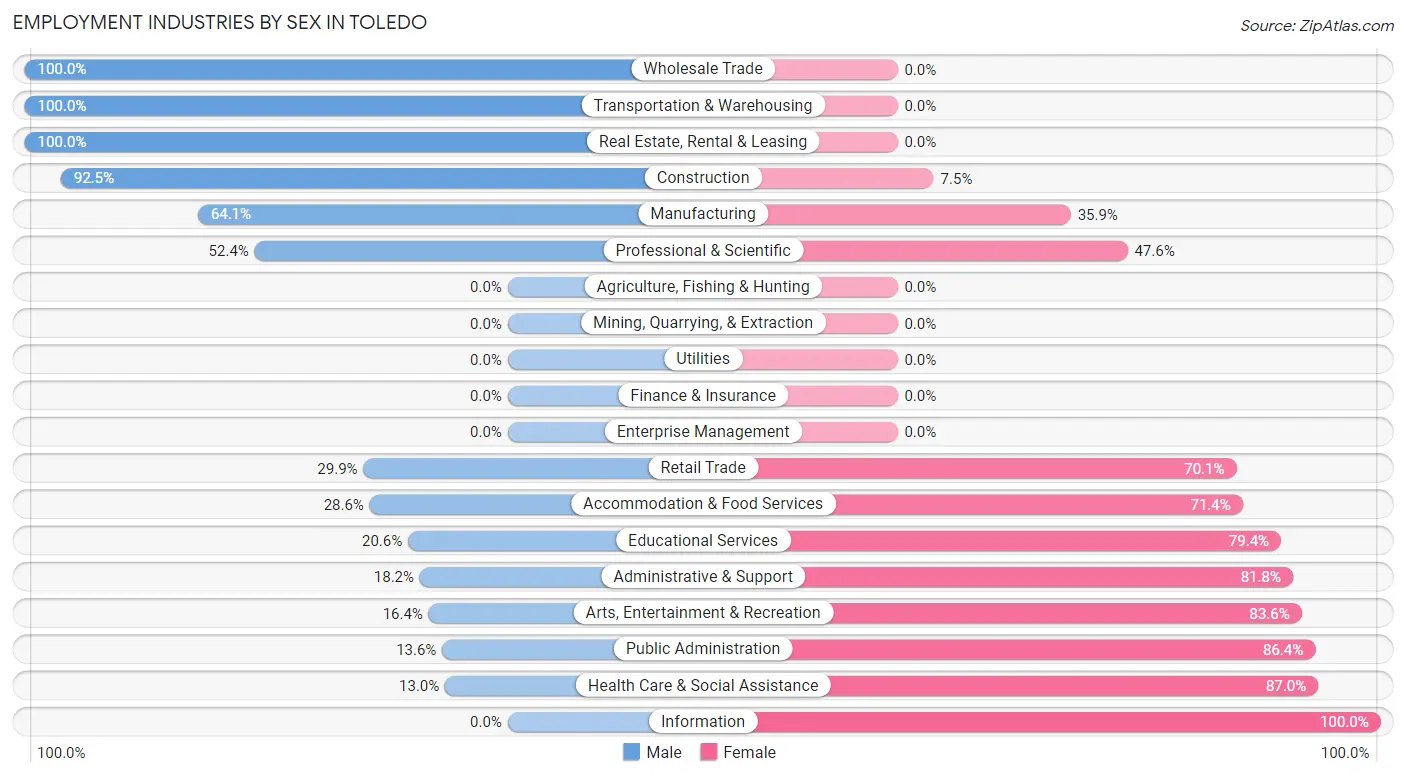
| Industry | Male | Female |
| Agriculture, Fishing & Hunting | 0 (0.0%) | 0 (0.0%) |
| Mining, Quarrying, & Extraction | 0 (0.0%) | 0 (0.0%) |
| Construction | 74 (92.5%) | 6 (7.5%) |
| Manufacturing | 118 (64.1%) | 66 (35.9%) |
| Wholesale Trade | 11 (100.0%) | 0 (0.0%) |
| Retail Trade | 46 (29.9%) | 108 (70.1%) |
| Transportation & Warehousing | 63 (100.0%) | 0 (0.0%) |
| Utilities | 0 (0.0%) | 0 (0.0%) |
| Information | 0 (0.0%) | 5 (100.0%) |
| Finance & Insurance | 0 (0.0%) | 0 (0.0%) |
| Real Estate, Rental & Leasing | 9 (100.0%) | 0 (0.0%) |
| Professional & Scientific | 11 (52.4%) | 10 (47.6%) |
| Enterprise Management | 0 (0.0%) | 0 (0.0%) |
| Administrative & Support | 2 (18.2%) | 9 (81.8%) |
| Educational Services | 13 (20.6%) | 50 (79.4%) |
| Health Care & Social Assistance | 7 (13.0%) | 47 (87.0%) |
| Arts, Entertainment & Recreation | 9 (16.4%) | 46 (83.6%) |
| Accommodation & Food Services | 4 (28.6%) | 10 (71.4%) |
| Public Administration | 8 (13.6%) | 51 (86.4%) |
| Total | 409 (49.0%) | 426 (51.0%) |
Education in Toledo
School Enrollment in Toledo
The most common levels of schooling among the 397 students in Toledo are high school (118 | 29.7%), elementary school (104 | 26.2%), and middle school (81 | 20.4%).
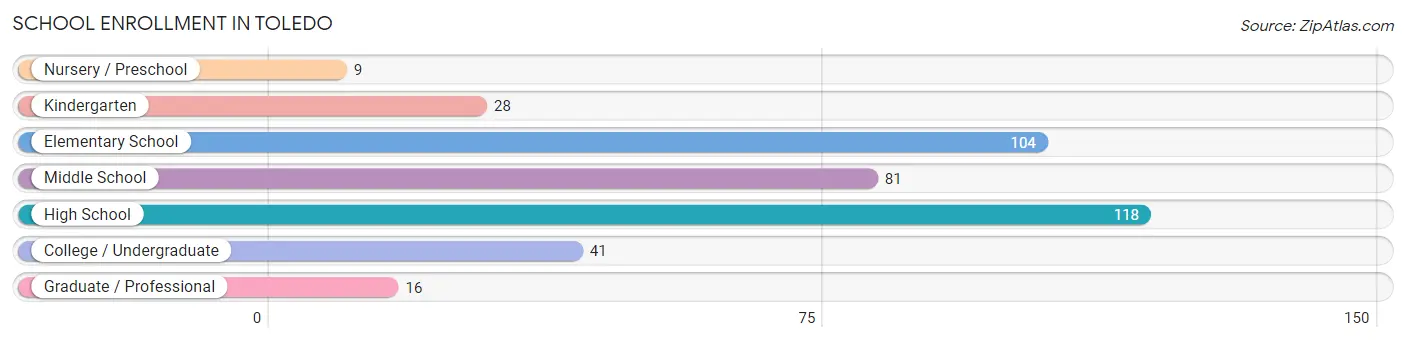
| School Level | # Students | % Students |
| Nursery / Preschool | 9 | 2.3% |
| Kindergarten | 28 | 7.0% |
| Elementary School | 104 | 26.2% |
| Middle School | 81 | 20.4% |
| High School | 118 | 29.7% |
| College / Undergraduate | 41 | 10.3% |
| Graduate / Professional | 16 | 4.0% |
| Total | 397 | 100.0% |
School Enrollment by Age by Funding Source in Toledo
Out of a total of 397 students who are enrolled in schools in Toledo, 45 (11.3%) attend a private institution, while the remaining 352 (88.7%) are enrolled in public schools. The age group of 35 years and over has the highest likelihood of being enrolled in private schools, with 15 (53.6% in the age bracket) enrolled. Conversely, the age group of 3 to 4 year olds has the lowest likelihood of being enrolled in a private school, with 2 (100.0% in the age bracket) attending a public institution.
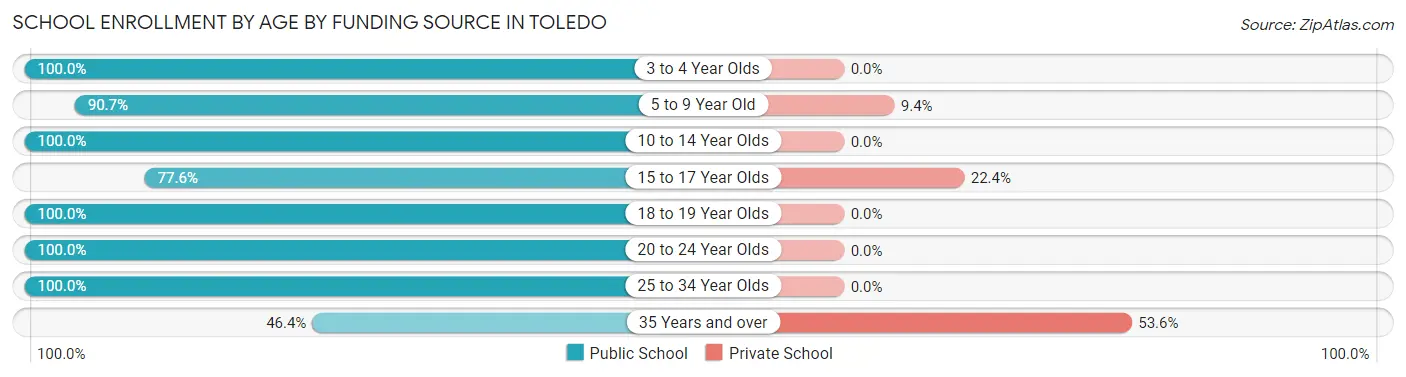
| Age Bracket | Public School | Private School |
| 3 to 4 Year Olds | 2 (100.0%) | 0 (0.0%) |
| 5 to 9 Year Old | 126 (90.6%) | 13 (9.3%) |
| 10 to 14 Year Olds | 110 (100.0%) | 0 (0.0%) |
| 15 to 17 Year Olds | 59 (77.6%) | 17 (22.4%) |
| 18 to 19 Year Olds | 13 (100.0%) | 0 (0.0%) |
| 20 to 24 Year Olds | 7 (100.0%) | 0 (0.0%) |
| 25 to 34 Year Olds | 22 (100.0%) | 0 (0.0%) |
| 35 Years and over | 13 (46.4%) | 15 (53.6%) |
| Total | 352 (88.7%) | 45 (11.3%) |
Educational Attainment by Field of Study in Toledo
Business (51 | 28.5%), education (30 | 16.8%), science & technology (20 | 11.2%), engineering (15 | 8.4%), and arts & humanities (15 | 8.4%) are the most common fields of study among 179 individuals in Toledo who have obtained a bachelor's degree or higher.
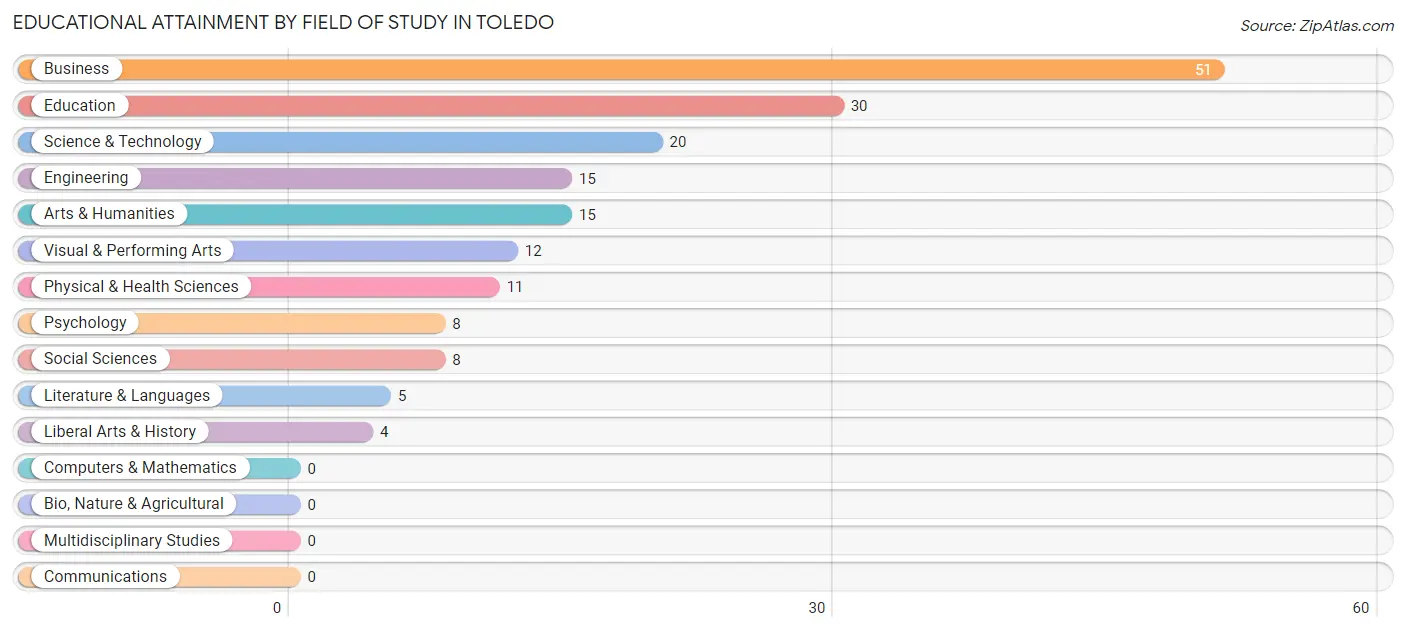
| Field of Study | # Graduates | % Graduates |
| Computers & Mathematics | 0 | 0.0% |
| Bio, Nature & Agricultural | 0 | 0.0% |
| Physical & Health Sciences | 11 | 6.1% |
| Psychology | 8 | 4.5% |
| Social Sciences | 8 | 4.5% |
| Engineering | 15 | 8.4% |
| Multidisciplinary Studies | 0 | 0.0% |
| Science & Technology | 20 | 11.2% |
| Business | 51 | 28.5% |
| Education | 30 | 16.8% |
| Literature & Languages | 5 | 2.8% |
| Liberal Arts & History | 4 | 2.2% |
| Visual & Performing Arts | 12 | 6.7% |
| Communications | 0 | 0.0% |
| Arts & Humanities | 15 | 8.4% |
| Total | 179 | 100.0% |
Transportation & Commute in Toledo
Vehicle Availability by Sex in Toledo
The most prevalent vehicle ownership categories in Toledo are males with 2 vehicles (180, accounting for 44.6%) and females with 2 vehicles (131, making up 44.1%).
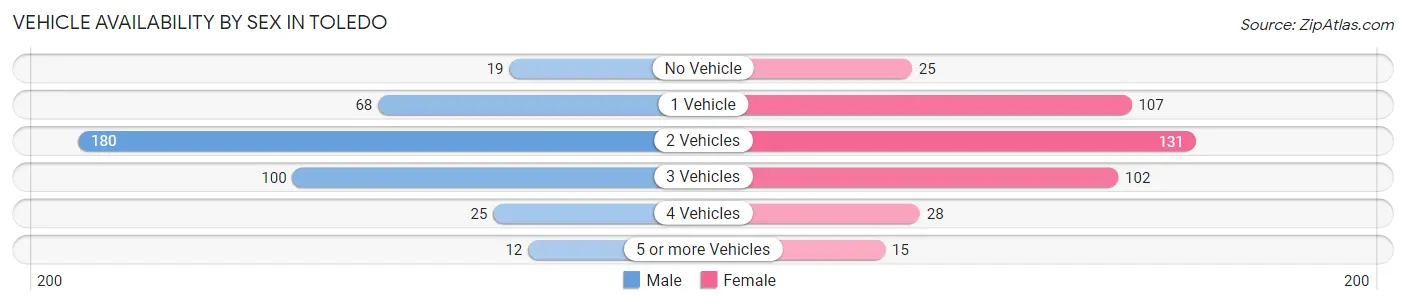
| Vehicles Available | Male | Female |
| No Vehicle | 19 (4.7%) | 25 (6.1%) |
| 1 Vehicle | 68 (16.8%) | 107 (26.2%) |
| 2 Vehicles | 180 (44.6%) | 131 (32.1%) |
| 3 Vehicles | 100 (24.7%) | 102 (25.0%) |
| 4 Vehicles | 25 (6.2%) | 28 (6.9%) |
| 5 or more Vehicles | 12 (3.0%) | 15 (3.7%) |
| Total | 404 (100.0%) | 408 (100.0%) |
Commute Time in Toledo
The most frequently occuring commute durations in Toledo are 5 to 9 minutes (228 commuters, 28.4%), 10 to 14 minutes (117 commuters, 14.6%), and less than 5 minutes (79 commuters, 9.8%).
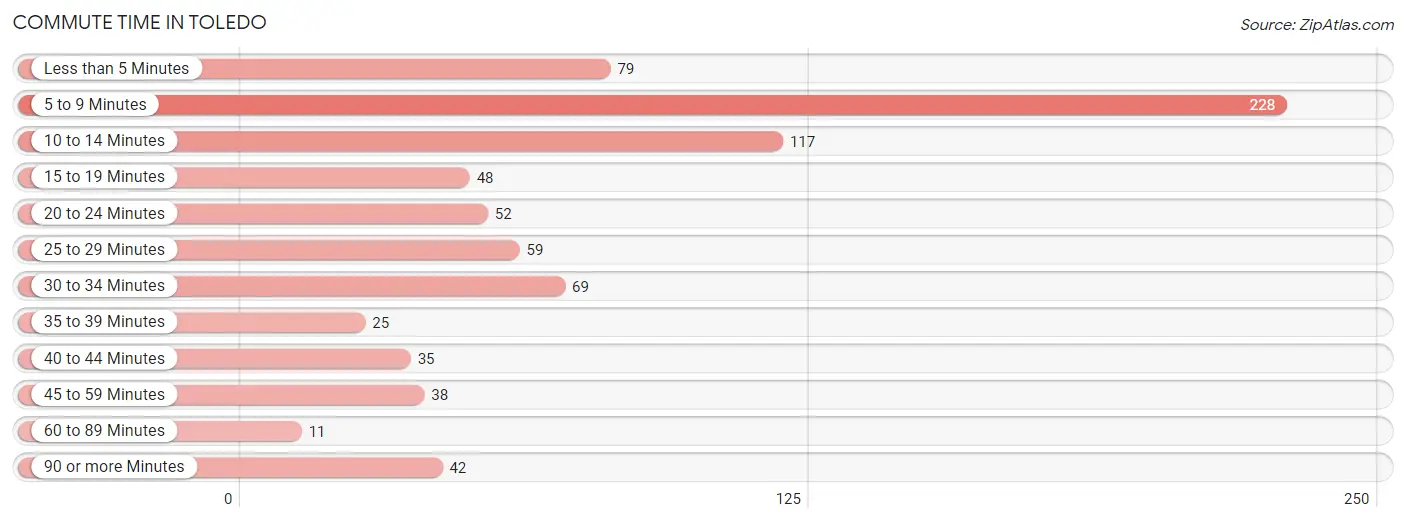
| Commute Time | # Commuters | % Commuters |
| Less than 5 Minutes | 79 | 9.8% |
| 5 to 9 Minutes | 228 | 28.4% |
| 10 to 14 Minutes | 117 | 14.6% |
| 15 to 19 Minutes | 48 | 6.0% |
| 20 to 24 Minutes | 52 | 6.5% |
| 25 to 29 Minutes | 59 | 7.3% |
| 30 to 34 Minutes | 69 | 8.6% |
| 35 to 39 Minutes | 25 | 3.1% |
| 40 to 44 Minutes | 35 | 4.4% |
| 45 to 59 Minutes | 38 | 4.7% |
| 60 to 89 Minutes | 11 | 1.4% |
| 90 or more Minutes | 42 | 5.2% |
Commute Time by Sex in Toledo
The most common commute times in Toledo are 5 to 9 minutes (111 commuters, 27.8%) for males and 5 to 9 minutes (117 commuters, 29.0%) for females.
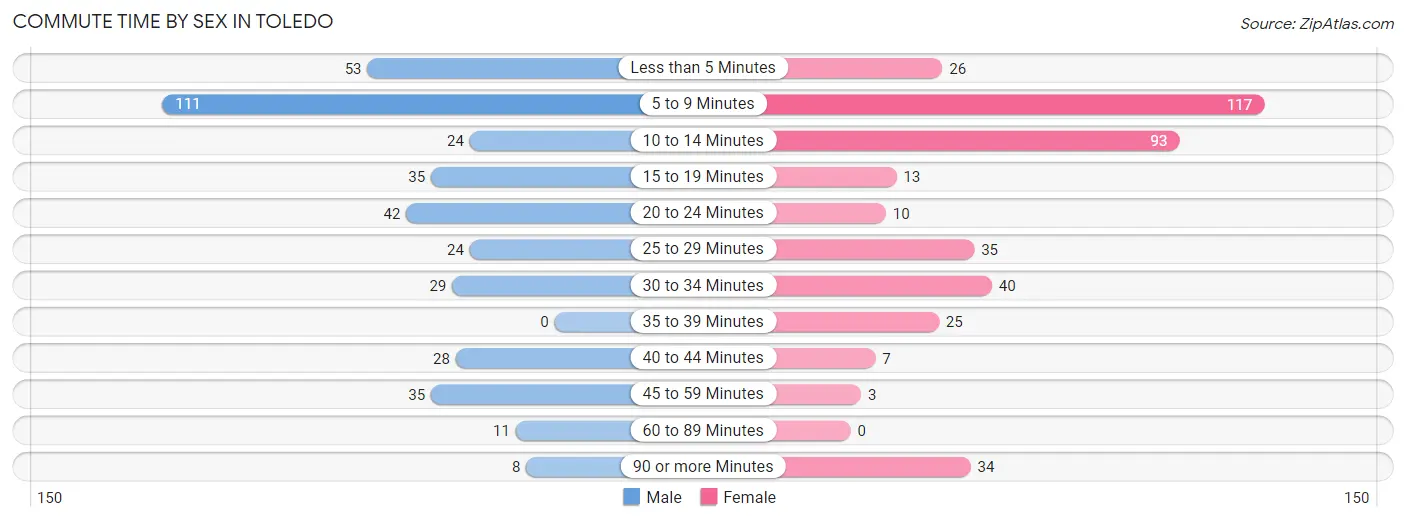
| Commute Time | Male | Female |
| Less than 5 Minutes | 53 (13.3%) | 26 (6.5%) |
| 5 to 9 Minutes | 111 (27.8%) | 117 (29.0%) |
| 10 to 14 Minutes | 24 (6.0%) | 93 (23.1%) |
| 15 to 19 Minutes | 35 (8.7%) | 13 (3.2%) |
| 20 to 24 Minutes | 42 (10.5%) | 10 (2.5%) |
| 25 to 29 Minutes | 24 (6.0%) | 35 (8.7%) |
| 30 to 34 Minutes | 29 (7.2%) | 40 (9.9%) |
| 35 to 39 Minutes | 0 (0.0%) | 25 (6.2%) |
| 40 to 44 Minutes | 28 (7.0%) | 7 (1.7%) |
| 45 to 59 Minutes | 35 (8.7%) | 3 (0.7%) |
| 60 to 89 Minutes | 11 (2.8%) | 0 (0.0%) |
| 90 or more Minutes | 8 (2.0%) | 34 (8.4%) |
Time of Departure to Work by Sex in Toledo
The most frequent times of departure to work in Toledo are 6:30 AM to 6:59 AM (81, 20.3%) for males and 7:30 AM to 7:59 AM (116, 28.8%) for females.
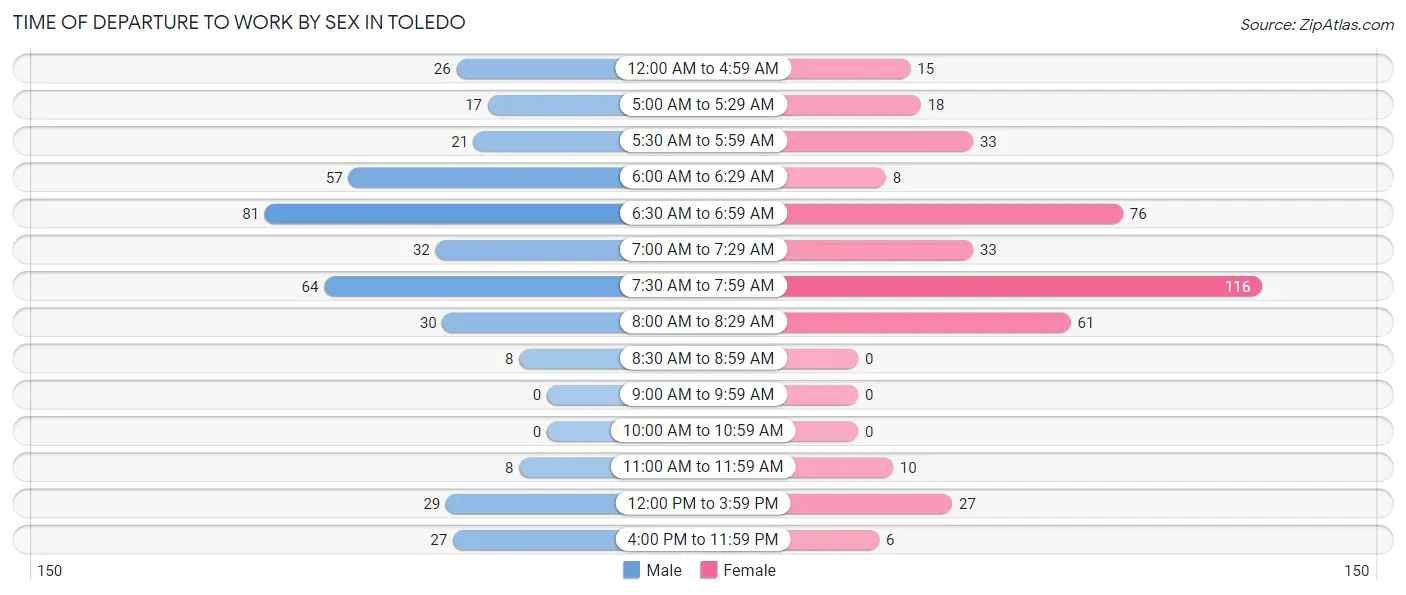
| Time of Departure | Male | Female |
| 12:00 AM to 4:59 AM | 26 (6.5%) | 15 (3.7%) |
| 5:00 AM to 5:29 AM | 17 (4.3%) | 18 (4.5%) |
| 5:30 AM to 5:59 AM | 21 (5.2%) | 33 (8.2%) |
| 6:00 AM to 6:29 AM | 57 (14.2%) | 8 (2.0%) |
| 6:30 AM to 6:59 AM | 81 (20.3%) | 76 (18.9%) |
| 7:00 AM to 7:29 AM | 32 (8.0%) | 33 (8.2%) |
| 7:30 AM to 7:59 AM | 64 (16.0%) | 116 (28.8%) |
| 8:00 AM to 8:29 AM | 30 (7.5%) | 61 (15.1%) |
| 8:30 AM to 8:59 AM | 8 (2.0%) | 0 (0.0%) |
| 9:00 AM to 9:59 AM | 0 (0.0%) | 0 (0.0%) |
| 10:00 AM to 10:59 AM | 0 (0.0%) | 0 (0.0%) |
| 11:00 AM to 11:59 AM | 8 (2.0%) | 10 (2.5%) |
| 12:00 PM to 3:59 PM | 29 (7.2%) | 27 (6.7%) |
| 4:00 PM to 11:59 PM | 27 (6.8%) | 6 (1.5%) |
| Total | 400 (100.0%) | 403 (100.0%) |
Housing Occupancy in Toledo
Occupancy by Ownership in Toledo
Of the total 828 dwellings in Toledo, owner-occupied units account for 552 (66.7%), while renter-occupied units make up 276 (33.3%).
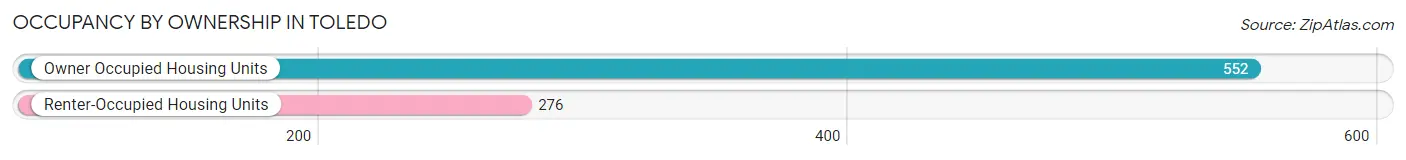
| Occupancy | # Housing Units | % Housing Units |
| Owner Occupied Housing Units | 552 | 66.7% |
| Renter-Occupied Housing Units | 276 | 33.3% |
| Total Occupied Housing Units | 828 | 100.0% |
Occupancy by Household Size in Toledo
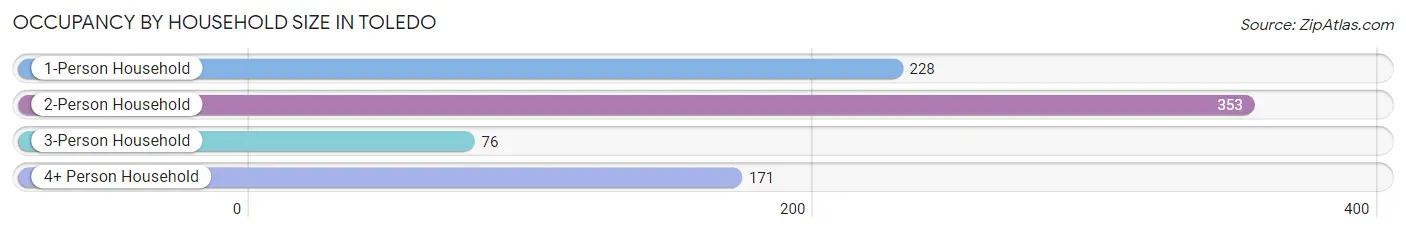
| Household Size | # Housing Units | % Housing Units |
| 1-Person Household | 228 | 27.5% |
| 2-Person Household | 353 | 42.6% |
| 3-Person Household | 76 | 9.2% |
| 4+ Person Household | 171 | 20.6% |
| Total Housing Units | 828 | 100.0% |
Occupancy by Ownership by Household Size in Toledo
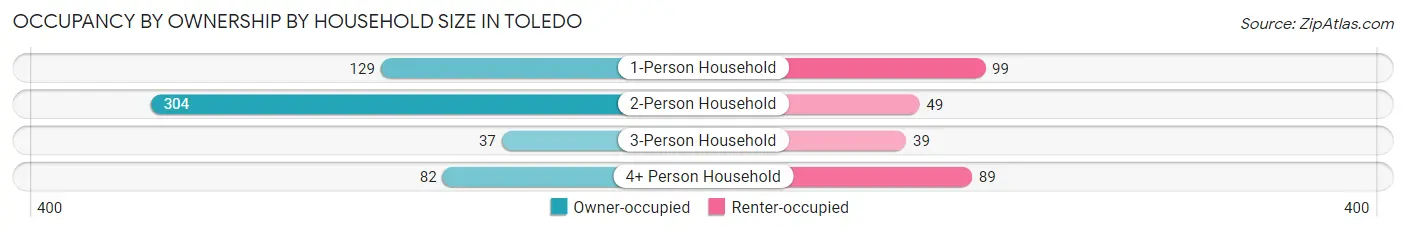
| Household Size | Owner-occupied | Renter-occupied |
| 1-Person Household | 129 (56.6%) | 99 (43.4%) |
| 2-Person Household | 304 (86.1%) | 49 (13.9%) |
| 3-Person Household | 37 (48.7%) | 39 (51.3%) |
| 4+ Person Household | 82 (47.9%) | 89 (52.0%) |
| Total Housing Units | 552 (66.7%) | 276 (33.3%) |
Occupancy by Educational Attainment in Toledo
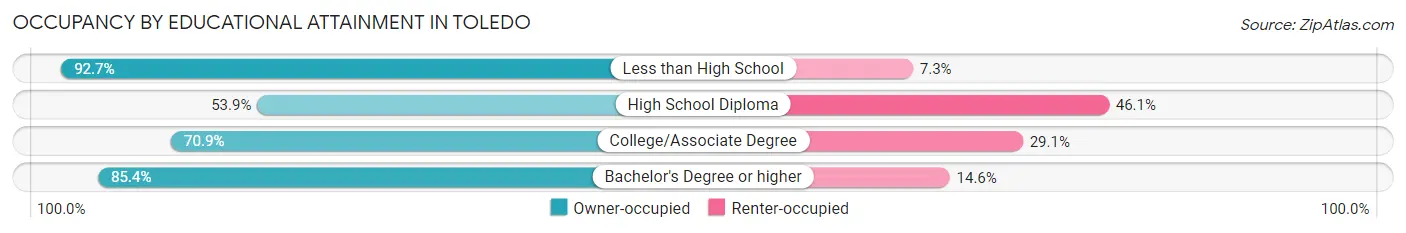
| Household Size | Owner-occupied | Renter-occupied |
| Less than High School | 51 (92.7%) | 4 (7.3%) |
| High School Diploma | 222 (53.9%) | 190 (46.1%) |
| College/Associate Degree | 144 (70.9%) | 59 (29.1%) |
| Bachelor's Degree or higher | 135 (85.4%) | 23 (14.6%) |
Occupancy by Age of Householder in Toledo
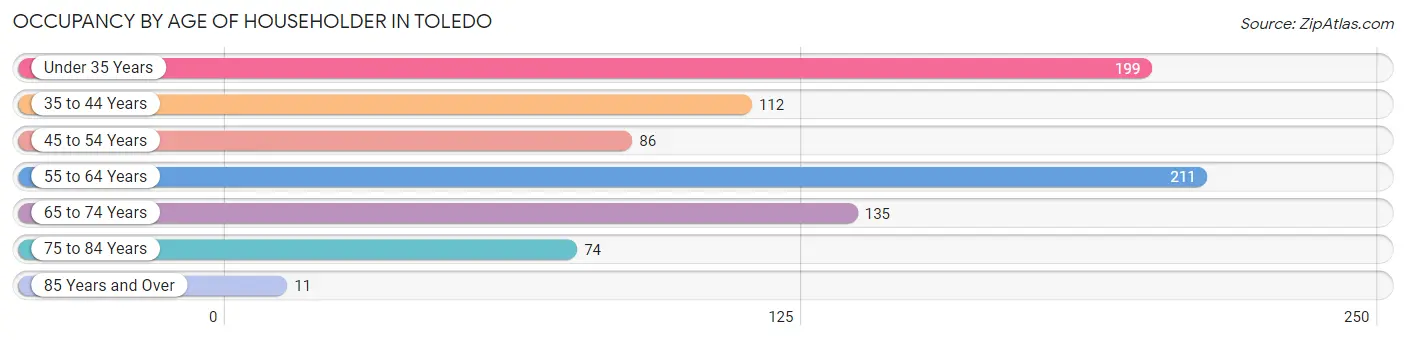
| Age Bracket | # Households | % Households |
| Under 35 Years | 199 | 24.0% |
| 35 to 44 Years | 112 | 13.5% |
| 45 to 54 Years | 86 | 10.4% |
| 55 to 64 Years | 211 | 25.5% |
| 65 to 74 Years | 135 | 16.3% |
| 75 to 84 Years | 74 | 8.9% |
| 85 Years and Over | 11 | 1.3% |
| Total | 828 | 100.0% |
Housing Finances in Toledo
Median Income by Occupancy in Toledo
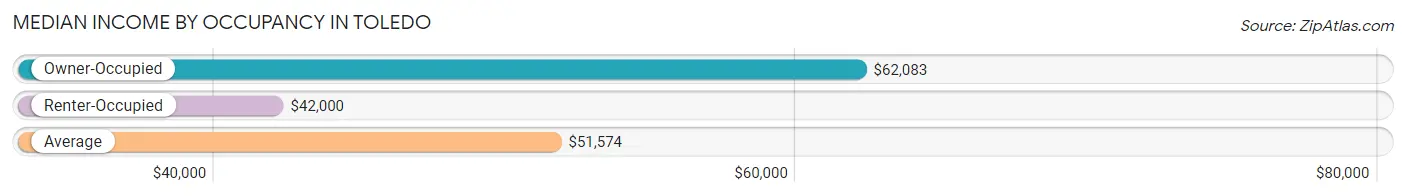
| Occupancy Type | # Households | Median Income |
| Owner-Occupied | 552 (66.7%) | $62,083 |
| Renter-Occupied | 276 (33.3%) | $42,000 |
| Average | 828 (100.0%) | $51,574 |
Occupancy by Householder Income Bracket in Toledo
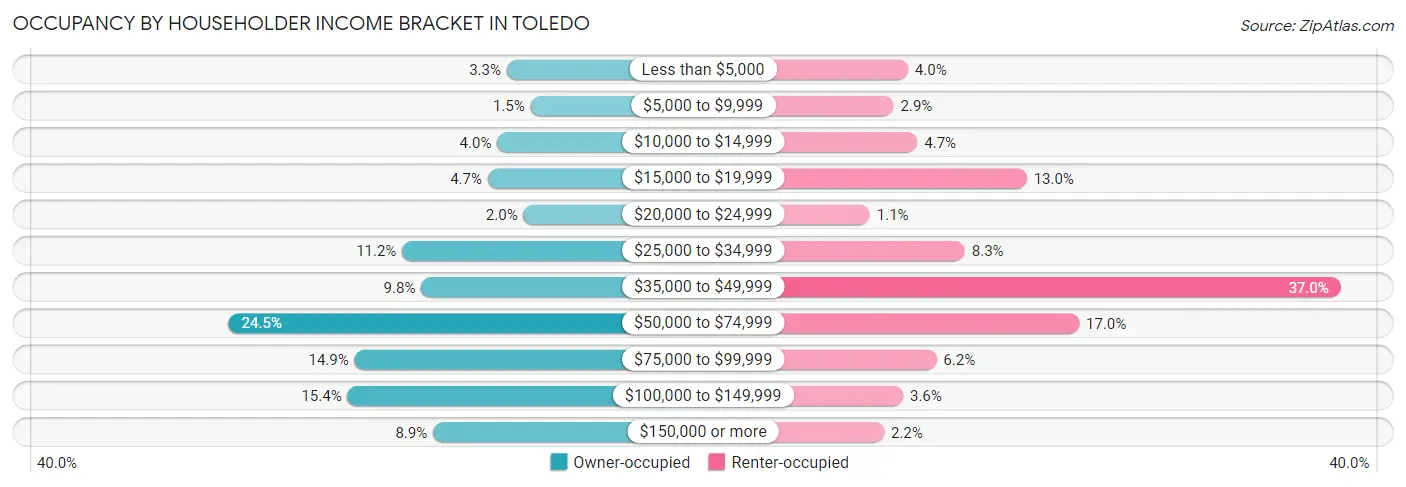
| Income Bracket | Owner-occupied | Renter-occupied |
| Less than $5,000 | 18 (3.3%) | 11 (4.0%) |
| $5,000 to $9,999 | 8 (1.5%) | 8 (2.9%) |
| $10,000 to $14,999 | 22 (4.0%) | 13 (4.7%) |
| $15,000 to $19,999 | 26 (4.7%) | 36 (13.0%) |
| $20,000 to $24,999 | 11 (2.0%) | 3 (1.1%) |
| $25,000 to $34,999 | 62 (11.2%) | 23 (8.3%) |
| $35,000 to $49,999 | 54 (9.8%) | 102 (37.0%) |
| $50,000 to $74,999 | 135 (24.5%) | 47 (17.0%) |
| $75,000 to $99,999 | 82 (14.9%) | 17 (6.2%) |
| $100,000 to $149,999 | 85 (15.4%) | 10 (3.6%) |
| $150,000 or more | 49 (8.9%) | 6 (2.2%) |
| Total | 552 (100.0%) | 276 (100.0%) |
Monthly Housing Cost Tiers in Toledo
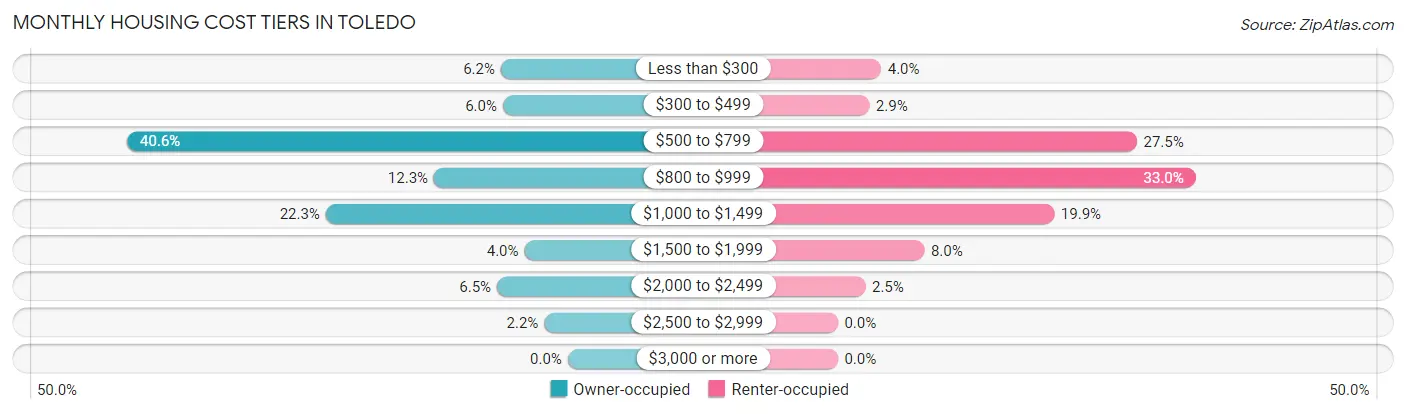
| Monthly Cost | Owner-occupied | Renter-occupied |
| Less than $300 | 34 (6.2%) | 11 (4.0%) |
| $300 to $499 | 33 (6.0%) | 8 (2.9%) |
| $500 to $799 | 224 (40.6%) | 76 (27.5%) |
| $800 to $999 | 68 (12.3%) | 91 (33.0%) |
| $1,000 to $1,499 | 123 (22.3%) | 55 (19.9%) |
| $1,500 to $1,999 | 22 (4.0%) | 22 (8.0%) |
| $2,000 to $2,499 | 36 (6.5%) | 7 (2.5%) |
| $2,500 to $2,999 | 12 (2.2%) | 0 (0.0%) |
| $3,000 or more | 0 (0.0%) | 0 (0.0%) |
| Total | 552 (100.0%) | 276 (100.0%) |
Physical Housing Characteristics in Toledo
Housing Structures in Toledo
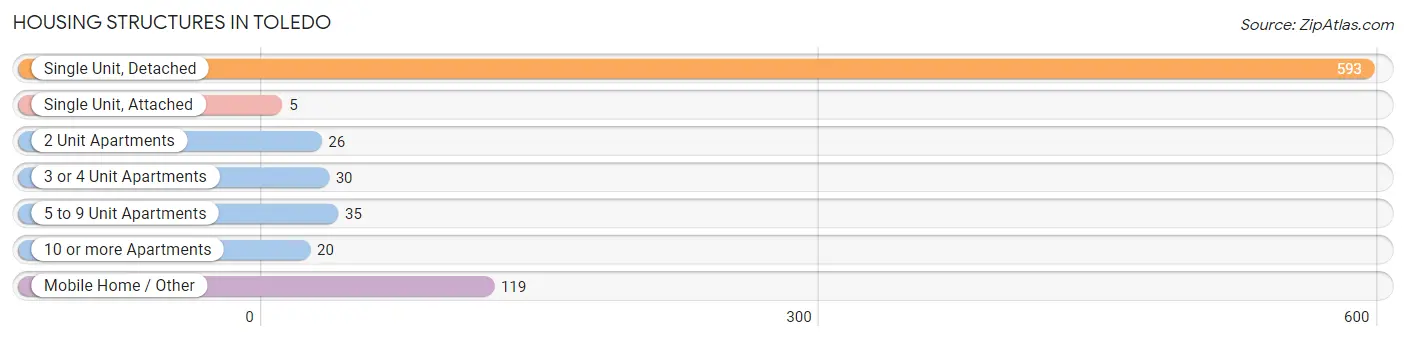
| Structure Type | # Housing Units | % Housing Units |
| Single Unit, Detached | 593 | 71.6% |
| Single Unit, Attached | 5 | 0.6% |
| 2 Unit Apartments | 26 | 3.1% |
| 3 or 4 Unit Apartments | 30 | 3.6% |
| 5 to 9 Unit Apartments | 35 | 4.2% |
| 10 or more Apartments | 20 | 2.4% |
| Mobile Home / Other | 119 | 14.4% |
| Total | 828 | 100.0% |
Housing Structures by Occupancy in Toledo
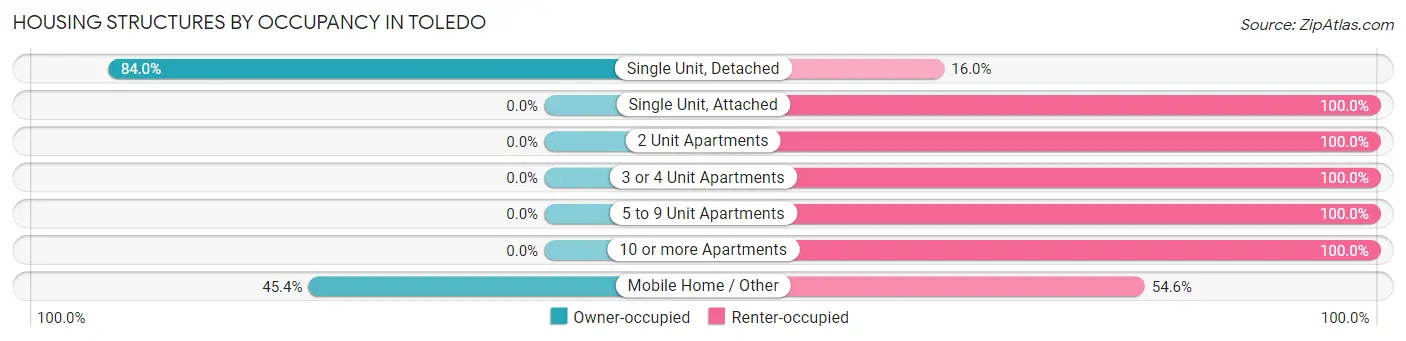
| Structure Type | Owner-occupied | Renter-occupied |
| Single Unit, Detached | 498 (84.0%) | 95 (16.0%) |
| Single Unit, Attached | 0 (0.0%) | 5 (100.0%) |
| 2 Unit Apartments | 0 (0.0%) | 26 (100.0%) |
| 3 or 4 Unit Apartments | 0 (0.0%) | 30 (100.0%) |
| 5 to 9 Unit Apartments | 0 (0.0%) | 35 (100.0%) |
| 10 or more Apartments | 0 (0.0%) | 20 (100.0%) |
| Mobile Home / Other | 54 (45.4%) | 65 (54.6%) |
| Total | 552 (66.7%) | 276 (33.3%) |
Housing Structures by Number of Rooms in Toledo
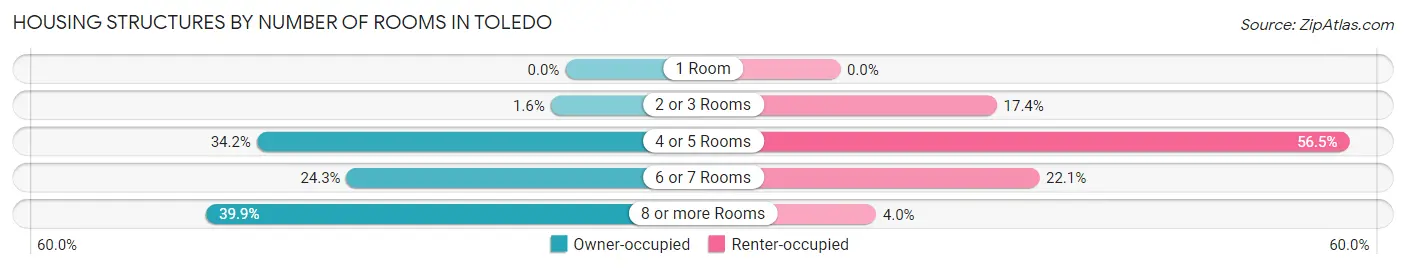
| Number of Rooms | Owner-occupied | Renter-occupied |
| 1 Room | 0 (0.0%) | 0 (0.0%) |
| 2 or 3 Rooms | 9 (1.6%) | 48 (17.4%) |
| 4 or 5 Rooms | 189 (34.2%) | 156 (56.5%) |
| 6 or 7 Rooms | 134 (24.3%) | 61 (22.1%) |
| 8 or more Rooms | 220 (39.9%) | 11 (4.0%) |
| Total | 552 (100.0%) | 276 (100.0%) |
Housing Structure by Heating Type in Toledo
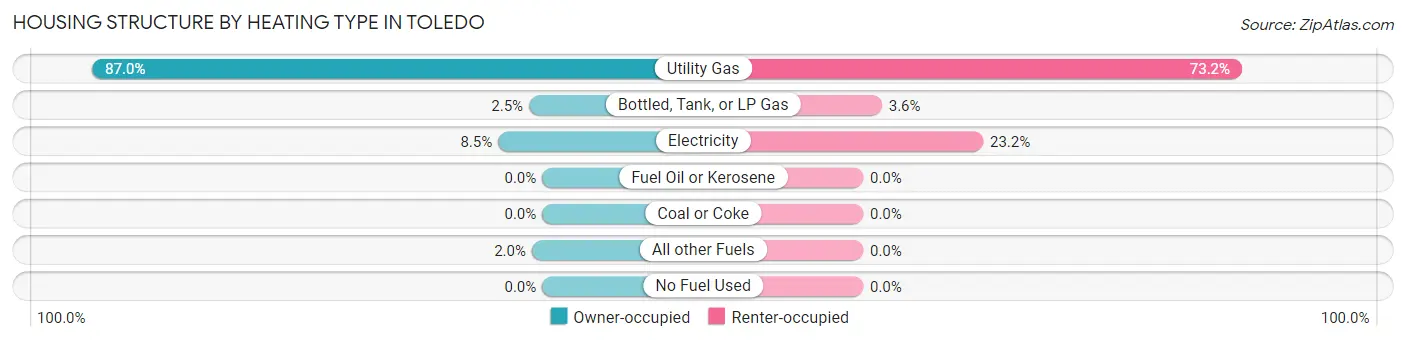
| Heating Type | Owner-occupied | Renter-occupied |
| Utility Gas | 480 (87.0%) | 202 (73.2%) |
| Bottled, Tank, or LP Gas | 14 (2.5%) | 10 (3.6%) |
| Electricity | 47 (8.5%) | 64 (23.2%) |
| Fuel Oil or Kerosene | 0 (0.0%) | 0 (0.0%) |
| Coal or Coke | 0 (0.0%) | 0 (0.0%) |
| All other Fuels | 11 (2.0%) | 0 (0.0%) |
| No Fuel Used | 0 (0.0%) | 0 (0.0%) |
| Total | 552 (100.0%) | 276 (100.0%) |
Household Vehicle Usage in Toledo
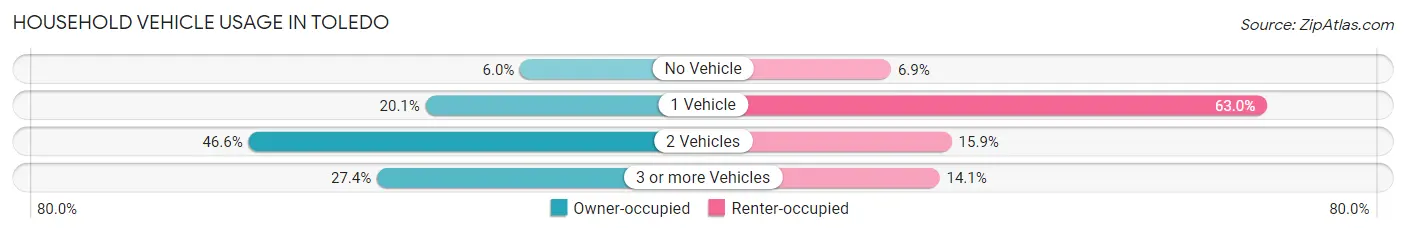
| Vehicles per Household | Owner-occupied | Renter-occupied |
| No Vehicle | 33 (6.0%) | 19 (6.9%) |
| 1 Vehicle | 111 (20.1%) | 174 (63.0%) |
| 2 Vehicles | 257 (46.6%) | 44 (15.9%) |
| 3 or more Vehicles | 151 (27.4%) | 39 (14.1%) |
| Total | 552 (100.0%) | 276 (100.0%) |
Real Estate & Mortgages in Toledo
Real Estate and Mortgage Overview in Toledo
| Characteristic | Without Mortgage | With Mortgage |
| Housing Units | 298 | 254 |
| Median Property Value | $107,600 | $126,400 |
| Median Household Income | $48,750 | $34 |
| Monthly Housing Costs | $614 | $0 |
| Real Estate Taxes | $2,326 | $0 |
Property Value by Mortgage Status in Toledo
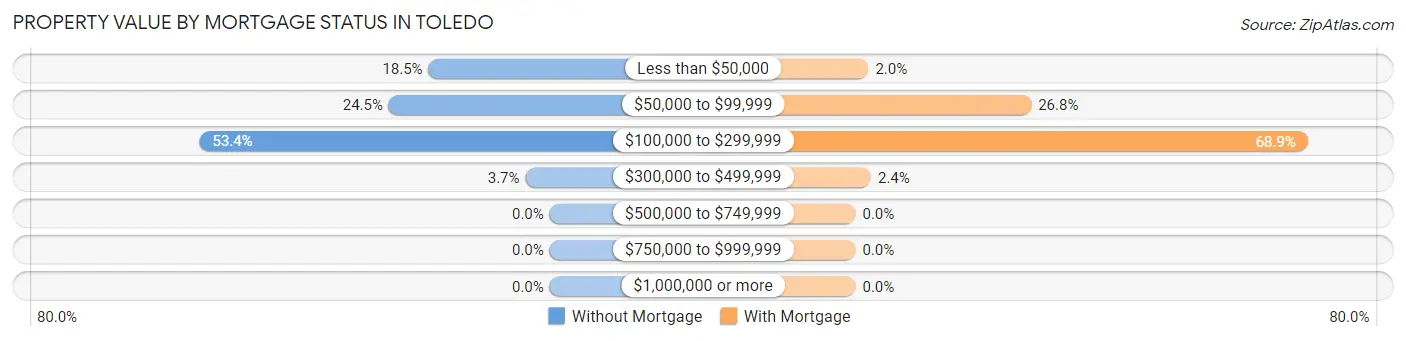
| Property Value | Without Mortgage | With Mortgage |
| Less than $50,000 | 55 (18.5%) | 5 (2.0%) |
| $50,000 to $99,999 | 73 (24.5%) | 68 (26.8%) |
| $100,000 to $299,999 | 159 (53.4%) | 175 (68.9%) |
| $300,000 to $499,999 | 11 (3.7%) | 6 (2.4%) |
| $500,000 to $749,999 | 0 (0.0%) | 0 (0.0%) |
| $750,000 to $999,999 | 0 (0.0%) | 0 (0.0%) |
| $1,000,000 or more | 0 (0.0%) | 0 (0.0%) |
| Total | 298 (100.0%) | 254 (100.0%) |
Household Income by Mortgage Status in Toledo
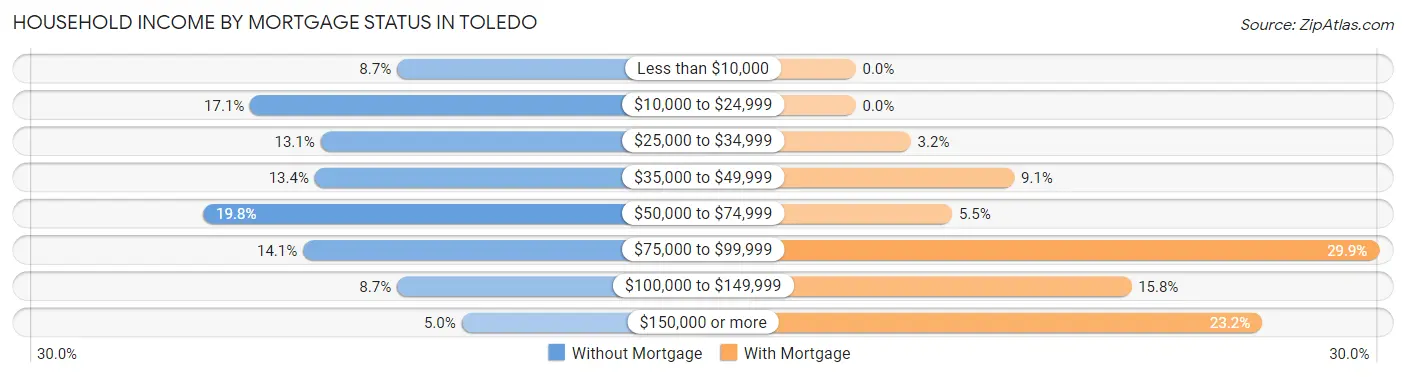
| Household Income | Without Mortgage | With Mortgage |
| Less than $10,000 | 26 (8.7%) | 0 (0.0%) |
| $10,000 to $24,999 | 51 (17.1%) | 0 (0.0%) |
| $25,000 to $34,999 | 39 (13.1%) | 8 (3.2%) |
| $35,000 to $49,999 | 40 (13.4%) | 23 (9.1%) |
| $50,000 to $74,999 | 59 (19.8%) | 14 (5.5%) |
| $75,000 to $99,999 | 42 (14.1%) | 76 (29.9%) |
| $100,000 to $149,999 | 26 (8.7%) | 40 (15.8%) |
| $150,000 or more | 15 (5.0%) | 59 (23.2%) |
| Total | 298 (100.0%) | 254 (100.0%) |
Property Value to Household Income Ratio in Toledo
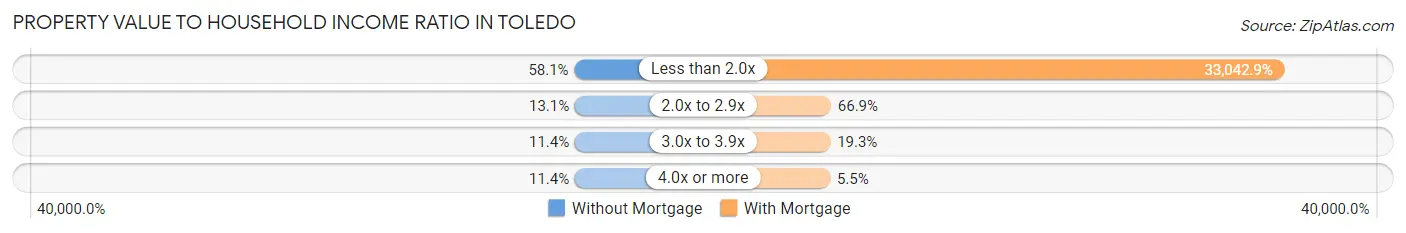
| Value-to-Income Ratio | Without Mortgage | With Mortgage |
| Less than 2.0x | 173 (58.1%) | 83,929 (33,042.9%) |
| 2.0x to 2.9x | 39 (13.1%) | 170 (66.9%) |
| 3.0x to 3.9x | 34 (11.4%) | 49 (19.3%) |
| 4.0x or more | 34 (11.4%) | 14 (5.5%) |
| Total | 298 (100.0%) | 254 (100.0%) |
Real Estate Taxes by Mortgage Status in Toledo
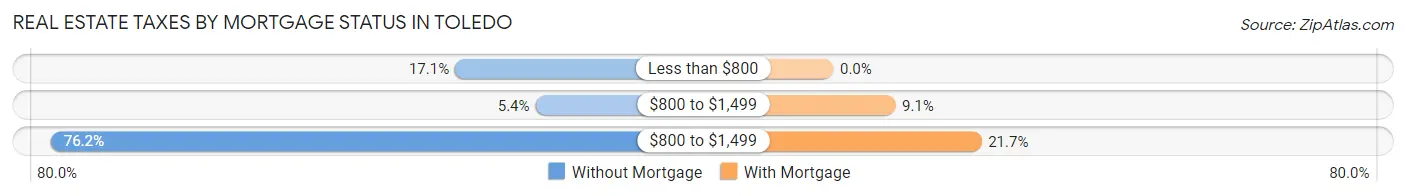
| Property Taxes | Without Mortgage | With Mortgage |
| Less than $800 | 51 (17.1%) | 0 (0.0%) |
| $800 to $1,499 | 16 (5.4%) | 23 (9.1%) |
| $800 to $1,499 | 227 (76.2%) | 55 (21.6%) |
| Total | 298 (100.0%) | 254 (100.0%) |
Health & Disability in Toledo
Health Insurance Coverage by Age in Toledo
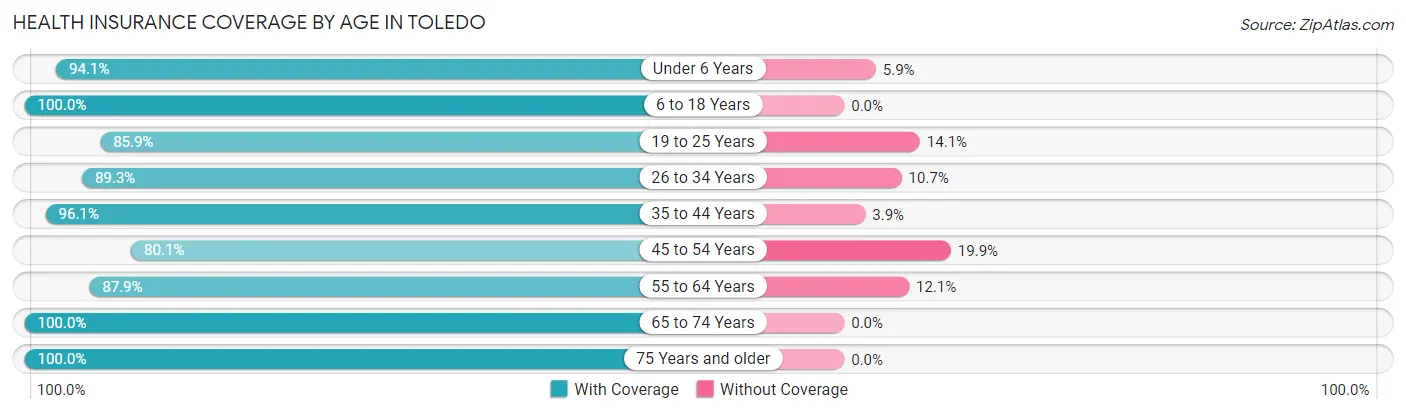
| Age Bracket | With Coverage | Without Coverage |
| Under 6 Years | 128 (94.1%) | 8 (5.9%) |
| 6 to 18 Years | 283 (100.0%) | 0 (0.0%) |
| 19 to 25 Years | 195 (85.9%) | 32 (14.1%) |
| 26 to 34 Years | 167 (89.3%) | 20 (10.7%) |
| 35 to 44 Years | 147 (96.1%) | 6 (3.9%) |
| 45 to 54 Years | 137 (80.1%) | 34 (19.9%) |
| 55 to 64 Years | 342 (87.9%) | 47 (12.1%) |
| 65 to 74 Years | 190 (100.0%) | 0 (0.0%) |
| 75 Years and older | 151 (100.0%) | 0 (0.0%) |
| Total | 1,740 (92.2%) | 147 (7.8%) |
Health Insurance Coverage by Citizenship Status in Toledo
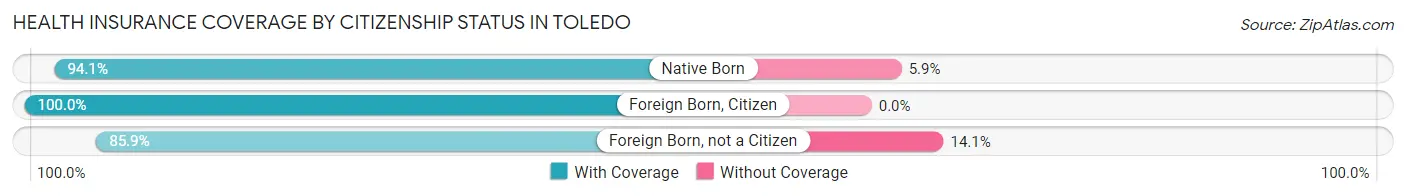
| Citizenship Status | With Coverage | Without Coverage |
| Native Born | 128 (94.1%) | 8 (5.9%) |
| Foreign Born, Citizen | 283 (100.0%) | 0 (0.0%) |
| Foreign Born, not a Citizen | 195 (85.9%) | 32 (14.1%) |
Health Insurance Coverage by Household Income in Toledo
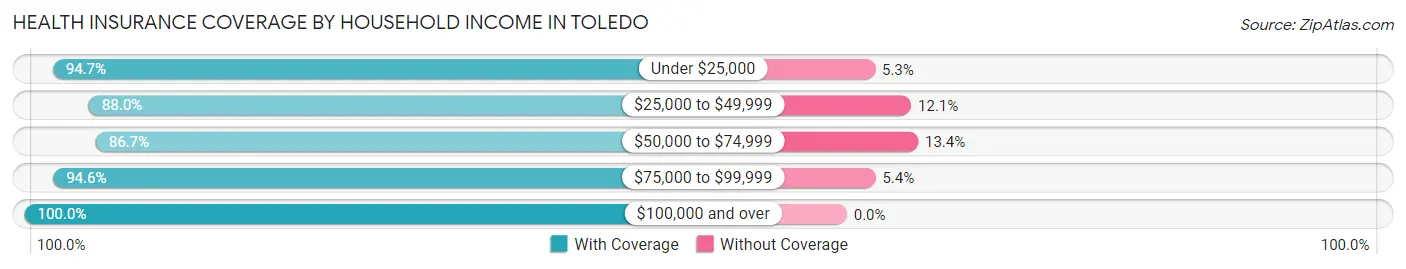
| Household Income | With Coverage | Without Coverage |
| Under $25,000 | 215 (94.7%) | 12 (5.3%) |
| $25,000 to $49,999 | 518 (87.9%) | 71 (12.0%) |
| $50,000 to $74,999 | 331 (86.7%) | 51 (13.4%) |
| $75,000 to $99,999 | 229 (94.6%) | 13 (5.4%) |
| $100,000 and over | 444 (100.0%) | 0 (0.0%) |
Public vs Private Health Insurance Coverage by Age in Toledo
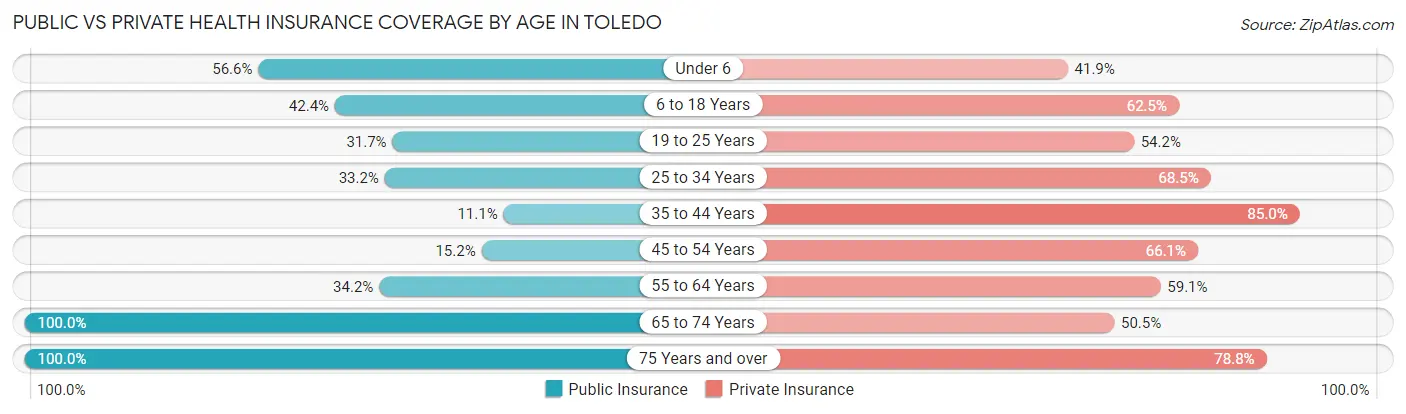
| Age Bracket | Public Insurance | Private Insurance |
| Under 6 | 77 (56.6%) | 57 (41.9%) |
| 6 to 18 Years | 120 (42.4%) | 177 (62.5%) |
| 19 to 25 Years | 72 (31.7%) | 123 (54.2%) |
| 25 to 34 Years | 62 (33.2%) | 128 (68.4%) |
| 35 to 44 Years | 17 (11.1%) | 130 (85.0%) |
| 45 to 54 Years | 26 (15.2%) | 113 (66.1%) |
| 55 to 64 Years | 133 (34.2%) | 230 (59.1%) |
| 65 to 74 Years | 190 (100.0%) | 96 (50.5%) |
| 75 Years and over | 151 (100.0%) | 119 (78.8%) |
| Total | 848 (44.9%) | 1,173 (62.2%) |
Disability Status by Sex by Age in Toledo
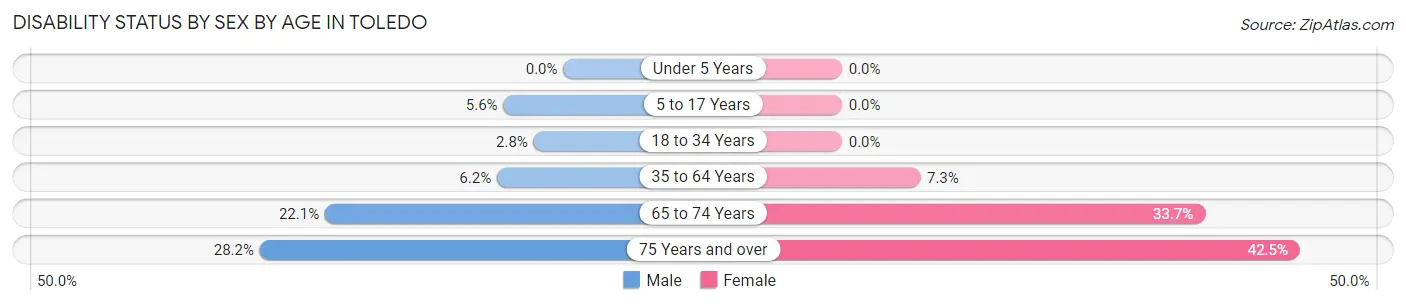
| Age Bracket | Male | Female |
| Under 5 Years | 0 (0.0%) | 0 (0.0%) |
| 5 to 17 Years | 7 (5.6%) | 0 (0.0%) |
| 18 to 34 Years | 5 (2.8%) | 0 (0.0%) |
| 35 to 64 Years | 21 (6.2%) | 27 (7.3%) |
| 65 to 74 Years | 23 (22.1%) | 29 (33.7%) |
| 75 Years and over | 20 (28.2%) | 34 (42.5%) |
Disability Class by Sex by Age in Toledo
Disability Class: Hearing Difficulty
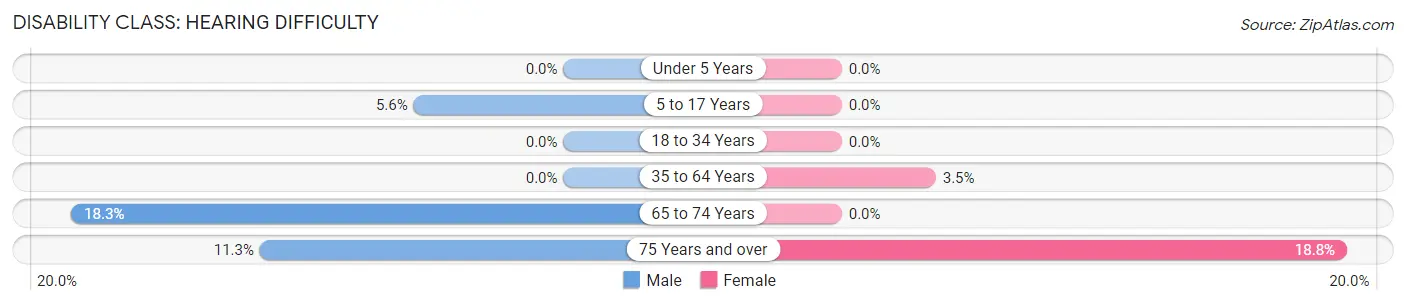
| Age Bracket | Male | Female |
| Under 5 Years | 0 (0.0%) | 0 (0.0%) |
| 5 to 17 Years | 7 (5.6%) | 0 (0.0%) |
| 18 to 34 Years | 0 (0.0%) | 0 (0.0%) |
| 35 to 64 Years | 0 (0.0%) | 13 (3.5%) |
| 65 to 74 Years | 19 (18.3%) | 0 (0.0%) |
| 75 Years and over | 8 (11.3%) | 15 (18.8%) |
Disability Class: Vision Difficulty
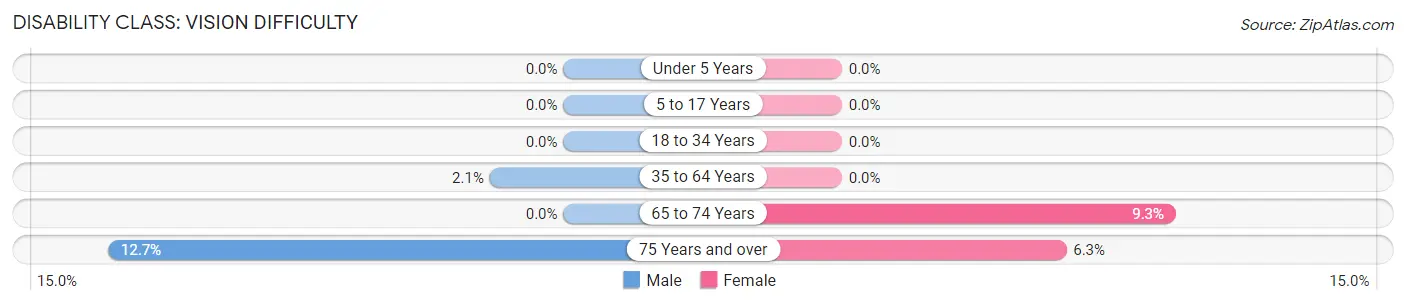
| Age Bracket | Male | Female |
| Under 5 Years | 0 (0.0%) | 0 (0.0%) |
| 5 to 17 Years | 0 (0.0%) | 0 (0.0%) |
| 18 to 34 Years | 0 (0.0%) | 0 (0.0%) |
| 35 to 64 Years | 7 (2.1%) | 0 (0.0%) |
| 65 to 74 Years | 0 (0.0%) | 8 (9.3%) |
| 75 Years and over | 9 (12.7%) | 5 (6.2%) |
Disability Class: Cognitive Difficulty
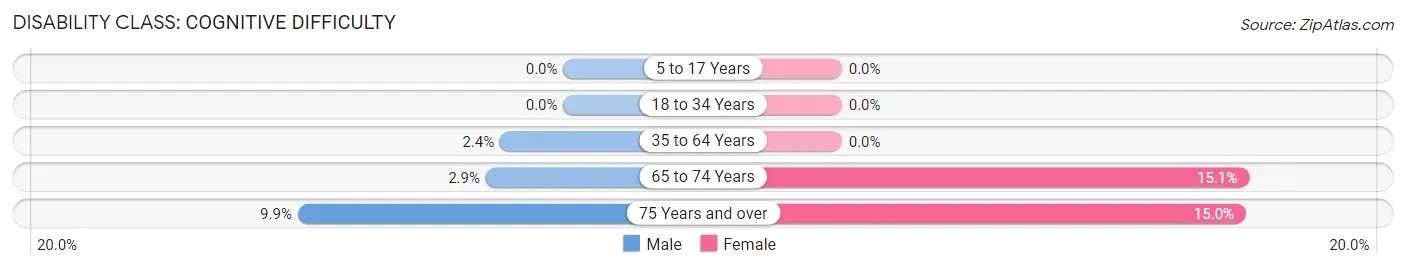
| Age Bracket | Male | Female |
| 5 to 17 Years | 0 (0.0%) | 0 (0.0%) |
| 18 to 34 Years | 0 (0.0%) | 0 (0.0%) |
| 35 to 64 Years | 8 (2.4%) | 0 (0.0%) |
| 65 to 74 Years | 3 (2.9%) | 13 (15.1%) |
| 75 Years and over | 7 (9.9%) | 12 (15.0%) |
Disability Class: Ambulatory Difficulty
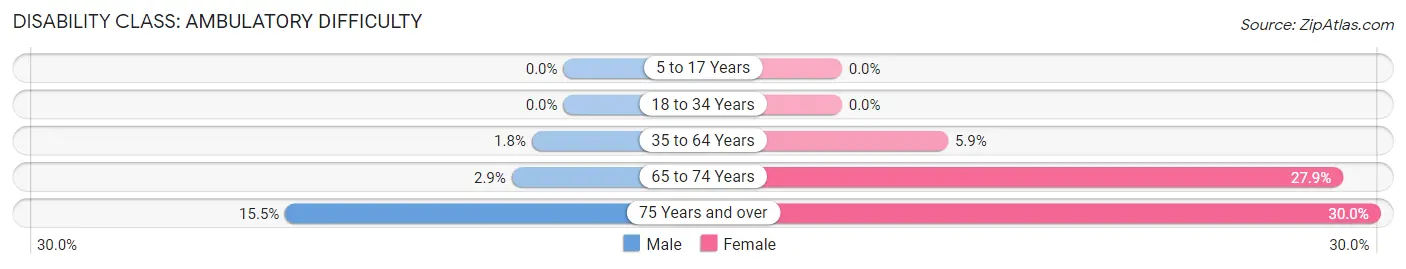
| Age Bracket | Male | Female |
| 5 to 17 Years | 0 (0.0%) | 0 (0.0%) |
| 18 to 34 Years | 0 (0.0%) | 0 (0.0%) |
| 35 to 64 Years | 6 (1.8%) | 22 (5.9%) |
| 65 to 74 Years | 3 (2.9%) | 24 (27.9%) |
| 75 Years and over | 11 (15.5%) | 24 (30.0%) |
Disability Class: Self-Care Difficulty
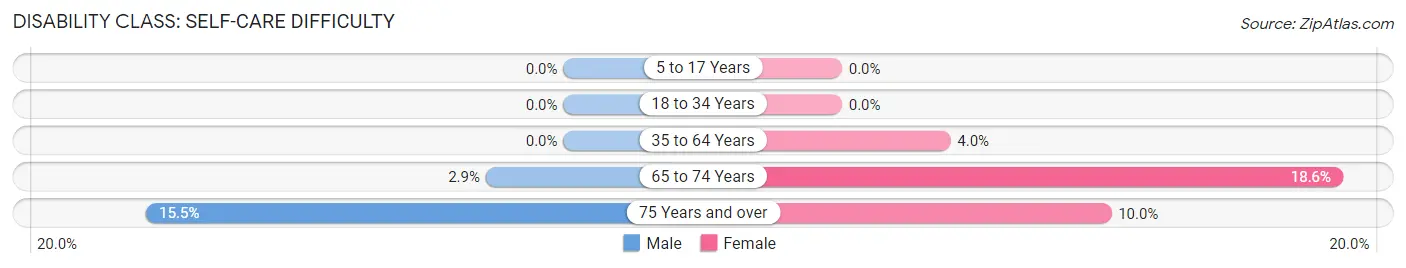
| Age Bracket | Male | Female |
| 5 to 17 Years | 0 (0.0%) | 0 (0.0%) |
| 18 to 34 Years | 0 (0.0%) | 0 (0.0%) |
| 35 to 64 Years | 0 (0.0%) | 15 (4.0%) |
| 65 to 74 Years | 3 (2.9%) | 16 (18.6%) |
| 75 Years and over | 11 (15.5%) | 8 (10.0%) |
Technology Access in Toledo
Computing Device Access in Toledo
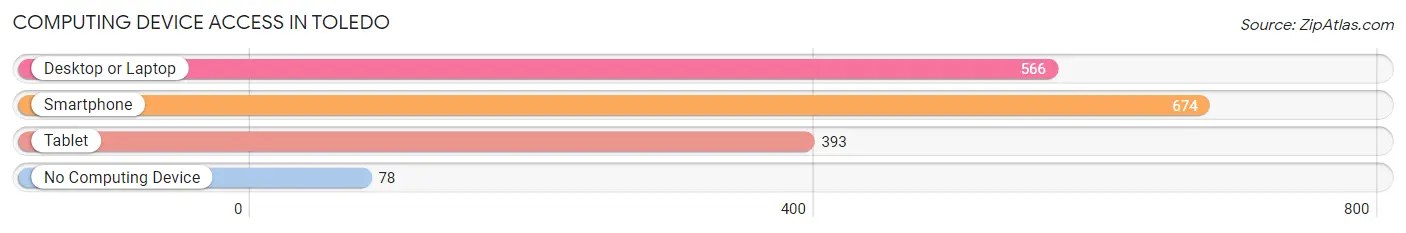
| Device Type | # Households | % Households |
| Desktop or Laptop | 566 | 68.4% |
| Smartphone | 674 | 81.4% |
| Tablet | 393 | 47.5% |
| No Computing Device | 78 | 9.4% |
| Total | 828 | 100.0% |
Internet Access in Toledo
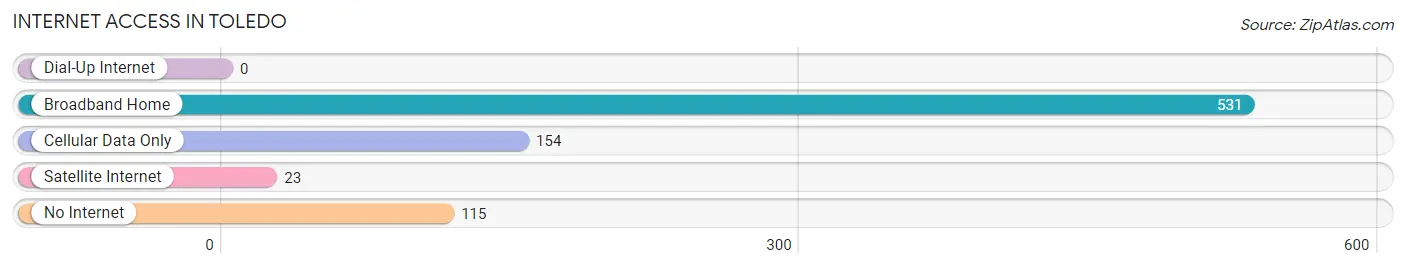
| Internet Type | # Households | % Households |
| Dial-Up Internet | 0 | 0.0% |
| Broadband Home | 531 | 64.1% |
| Cellular Data Only | 154 | 18.6% |
| Satellite Internet | 23 | 2.8% |
| No Internet | 115 | 13.9% |
| Total | 828 | 100.0% |
Toledo Summary
Toledo, Iowa is a small city located in Tama County, Iowa, United States. It is situated along the Iowa River, approximately 30 miles east of Cedar Rapids. The population of Toledo was 2,845 at the 2010 census, making it the largest city in Tama County.
History
Toledo was founded in 1853 by a group of settlers from Ohio. The city was named after the city of Toledo, Ohio. The first post office was established in 1854. The city was incorporated in 1858.
Toledo was a major stop on the Chicago, Rock Island and Pacific Railroad, which ran through the city from 1866 to 1980. The railroad was a major factor in the growth of the city, as it provided transportation for goods and people.
In the late 19th century, Toledo was a major center for the production of agricultural equipment. The city was home to several factories, including the Toledo Plow Company, which was founded in 1876. The company was one of the largest manufacturers of plows in the United States.
Geography
Toledo is located at 41°45'25" North, 92°25'45" West (41.756944, -92.429167). The city is situated along the Iowa River, approximately 30 miles east of Cedar Rapids.
The city has a total area of 2.2 square miles, all of which is land. The terrain is mostly flat, with some rolling hills.
Economy
Toledo's economy is largely based on agriculture and manufacturing. The city is home to several factories, including the Toledo Plow Company, which produces agricultural equipment. The city is also home to several food processing plants, including the Iowa Beef Processors plant, which produces beef products.
The city is also home to several retail stores, including a Walmart Supercenter, a Hy-Vee grocery store, and several other smaller stores.
Demographics
As of the 2010 census, there were 2,845 people, 1,093 households, and 717 families residing in the city. The population density was 1,288.2 people per square mile. The racial makeup of the city was 95.2% White, 0.3% African American, 0.3% Native American, 0.3% Asian, 0.1% Pacific Islander, 2.2% from other races, and 1.6% from two or more races. Hispanic or Latino of any race were 4.2% of the population.
The median income for a household in the city was $41,250, and the median income for a family was $50,000. The per capita income for the city was $19,845. About 8.2% of families and 10.2% of the population were below the poverty line, including 14.2% of those under age 18 and 8.2% of those age 65 or over.
Common Questions
What is Per Capita Income in Toledo?
Per Capita income in Toledo is $27,988.
What is the Median Family Income in Toledo?
Median Family Income in Toledo is $69,023.
What is the Median Household income in Toledo?
Median Household Income in Toledo is $51,574.
What is Income or Wage Gap in Toledo?
Income or Wage Gap in Toledo is 40.8%.
Women in Toledo earn 59.2 cents for every dollar earned by a man.
What is Family Income Deficit in Toledo?
Family Income Deficit in Toledo is $9,250.
Families that are below poverty line in Toledo earn $9,250 less on average than the poverty threshold level.
What is Inequality or Gini Index in Toledo?
Inequality or Gini Index in Toledo is 0.42.
What is the Total Population of Toledo?
Total Population of Toledo is 2,047.
What is the Total Male Population of Toledo?
Total Male Population of Toledo is 934.
What is the Total Female Population of Toledo?
Total Female Population of Toledo is 1,113.
What is the Ratio of Males per 100 Females in Toledo?
There are 83.92 Males per 100 Females in Toledo.
What is the Ratio of Females per 100 Males in Toledo?
There are 119.16 Females per 100 Males in Toledo.
What is the Median Population Age in Toledo?
Median Population Age in Toledo is 40.3 Years.
What is the Average Family Size in Toledo
Average Family Size in Toledo is 2.7 People.
What is the Average Household Size in Toledo
Average Household Size in Toledo is 2.3 People.
How Large is the Labor Force in Toledo?
There are 933 People in the Labor Forcein in Toledo.
What is the Percentage of People in the Labor Force in Toledo?
57.2% of People are in the Labor Force in Toledo.
What is the Unemployment Rate in Toledo?
Unemployment Rate in Toledo is 10.5%.