Okoboji, IA Map & Demographics
Okoboji Map
Okoboji Overview
$59,195
PER CAPITA INCOME
$98,438
AVG FAMILY INCOME
$56,845
AVG HOUSEHOLD INCOME
54.7%
WAGE / INCOME GAP [ % ]
45.3¢/ $1
WAGE / INCOME GAP [ $ ]
0.57
INEQUALITY / GINI INDEX
784
TOTAL POPULATION
357
MALE POPULATION
427
FEMALE POPULATION
83.61
MALES / 100 FEMALES
119.61
FEMALES / 100 MALES
57.0
MEDIAN AGE
2.6
AVG FAMILY SIZE
1.8
AVG HOUSEHOLD SIZE
427
LABOR FORCE [ PEOPLE ]
62.0%
PERCENT IN LABOR FORCE
2.1%
UNEMPLOYMENT RATE
Okoboji Zip Codes
Okoboji Area Codes
Income in Okoboji
Income Overview in Okoboji
Per Capita Income in Okoboji is $59,195, while median incomes of families and households are $98,438 and $56,845 respectively.
| Characteristic | Number | Measure |
| Per Capita Income | 784 | $59,195 |
| Median Family Income | 165 | $98,438 |
| Mean Family Income | 165 | $185,961 |
| Median Household Income | 427 | $56,845 |
| Mean Household Income | 427 | $105,225 |
| Income Deficit | 165 | $0 |
| Wage / Income Gap (%) | 784 | 54.70% |
| Wage / Income Gap ($) | 784 | 45.30¢ per $1 |
| Gini / Inequality Index | 784 | 0.57 |
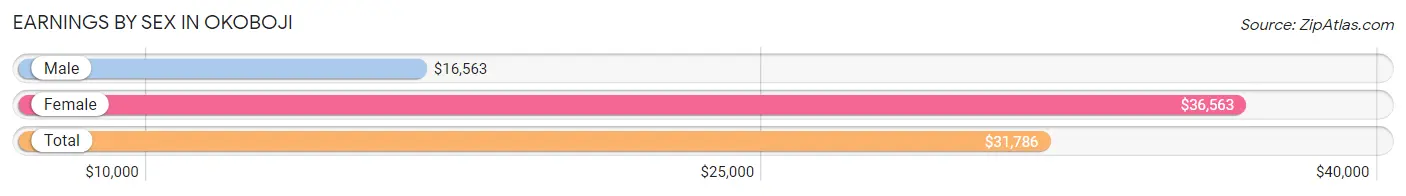
Earnings by Sex in Okoboji
Average Earnings in Okoboji are $31,786, $16,563 for men and $36,563 for women, a difference of 54.7%.
| Sex | Number | Average Earnings |
| Male | 241 (54.3%) | $16,563 |
| Female | 203 (45.7%) | $36,563 |
| Total | 444 (100.0%) | $31,786 |
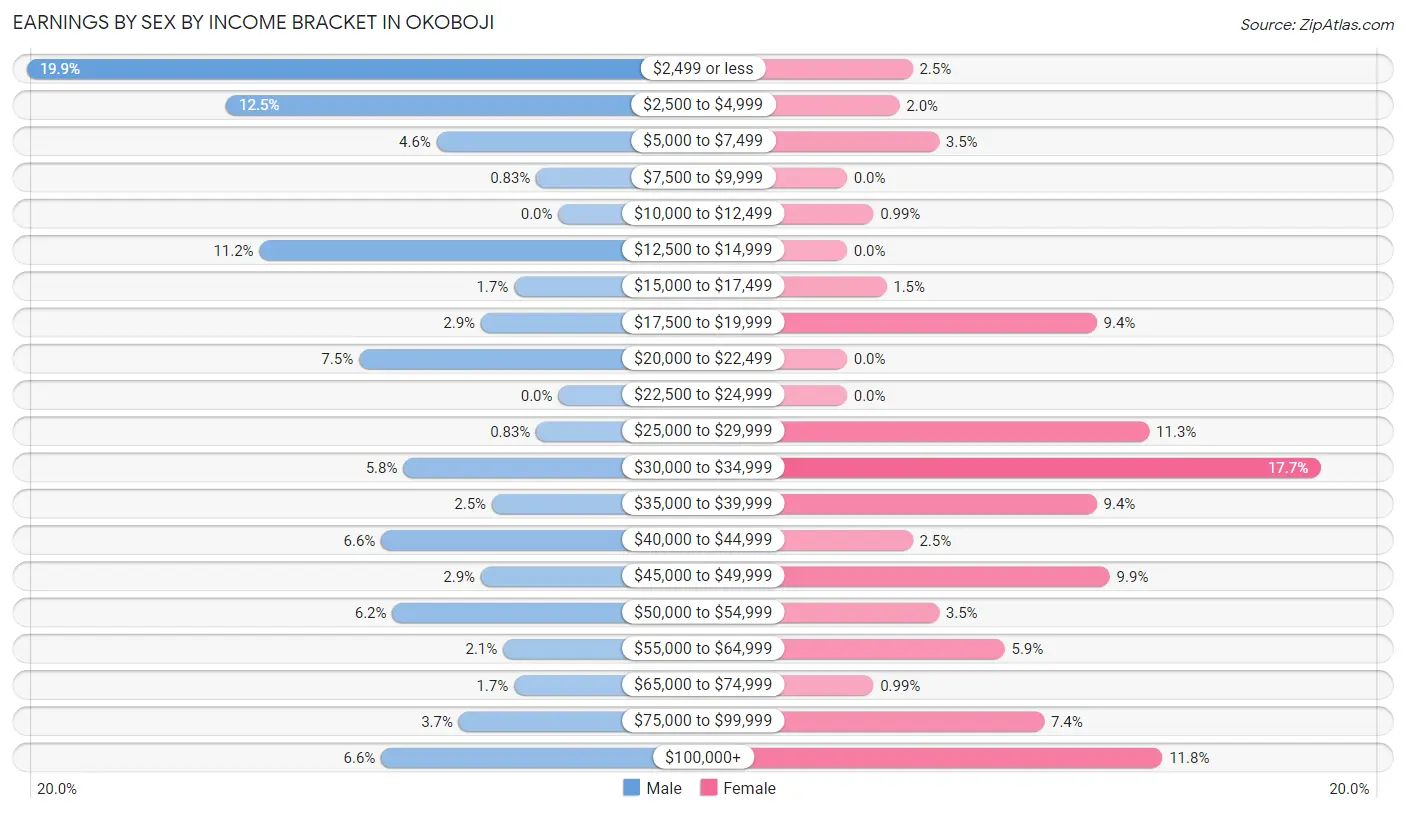
Earnings by Sex by Income Bracket in Okoboji
The most common earnings brackets in Okoboji are $2,499 or less for men (48 | 19.9%) and $30,000 to $34,999 for women (36 | 17.7%).
| Income | Male | Female |
| $2,499 or less | 48 (19.9%) | 5 (2.5%) |
| $2,500 to $4,999 | 30 (12.4%) | 4 (2.0%) |
| $5,000 to $7,499 | 11 (4.6%) | 7 (3.5%) |
| $7,500 to $9,999 | 2 (0.8%) | 0 (0.0%) |
| $10,000 to $12,499 | 0 (0.0%) | 2 (1.0%) |
| $12,500 to $14,999 | 27 (11.2%) | 0 (0.0%) |
| $15,000 to $17,499 | 4 (1.7%) | 3 (1.5%) |
| $17,500 to $19,999 | 7 (2.9%) | 19 (9.4%) |
| $20,000 to $22,499 | 18 (7.5%) | 0 (0.0%) |
| $22,500 to $24,999 | 0 (0.0%) | 0 (0.0%) |
| $25,000 to $29,999 | 2 (0.8%) | 23 (11.3%) |
| $30,000 to $34,999 | 14 (5.8%) | 36 (17.7%) |
| $35,000 to $39,999 | 6 (2.5%) | 19 (9.4%) |
| $40,000 to $44,999 | 16 (6.6%) | 5 (2.5%) |
| $45,000 to $49,999 | 7 (2.9%) | 20 (9.9%) |
| $50,000 to $54,999 | 15 (6.2%) | 7 (3.5%) |
| $55,000 to $64,999 | 5 (2.1%) | 12 (5.9%) |
| $65,000 to $74,999 | 4 (1.7%) | 2 (1.0%) |
| $75,000 to $99,999 | 9 (3.7%) | 15 (7.4%) |
| $100,000+ | 16 (6.6%) | 24 (11.8%) |
| Total | 241 (100.0%) | 203 (100.0%) |
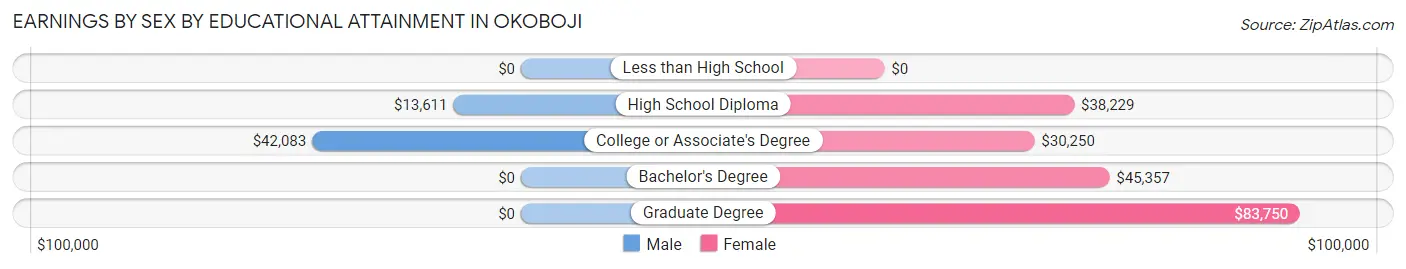
Earnings by Sex by Educational Attainment in Okoboji
Average earnings in Okoboji are $32,679 for men and $37,500 for women, a difference of 12.9%. Men with an educational attainment of college or associate's degree enjoy the highest average annual earnings of $42,083, while those with high school diploma education earn the least with $13,611. Women with an educational attainment of graduate degree earn the most with the average annual earnings of $83,750, while those with college or associate's degree education have the smallest earnings of $30,250.
| Educational Attainment | Male Income | Female Income |
| Less than High School | - | - |
| High School Diploma | $13,611 | $38,229 |
| College or Associate's Degree | $42,083 | $30,250 |
| Bachelor's Degree | - | - |
| Graduate Degree | - | - |
| Total | $32,679 | $37,500 |
Family Income in Okoboji
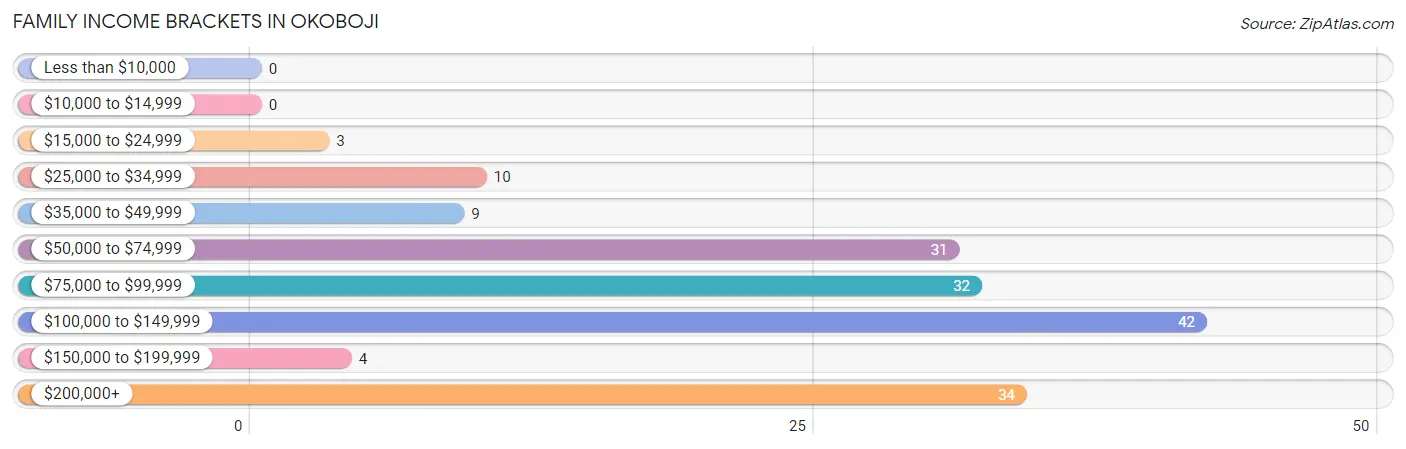
Family Income Brackets in Okoboji
According to the Okoboji family income data, there are 42 families falling into the $100,000 to $149,999 income range, which is the most common income bracket and makes up 25.5% of all families.
| Income Bracket | # Families | % Families |
| Less than $10,000 | 0 | 0.0% |
| $10,000 to $14,999 | 0 | 0.0% |
| $15,000 to $24,999 | 3 | 1.8% |
| $25,000 to $34,999 | 10 | 6.1% |
| $35,000 to $49,999 | 9 | 5.5% |
| $50,000 to $74,999 | 31 | 18.8% |
| $75,000 to $99,999 | 32 | 19.4% |
| $100,000 to $149,999 | 42 | 25.5% |
| $150,000 to $199,999 | 4 | 2.4% |
| $200,000+ | 34 | 20.6% |
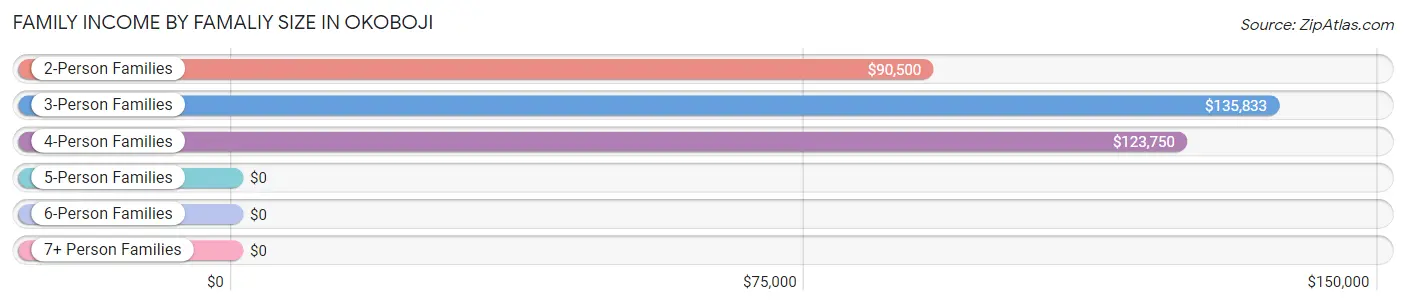
Family Income by Famaliy Size in Okoboji
3-person families (14 | 8.5%) account for the highest median family income in Okoboji with $135,833 per family, while 3-person families (14 | 8.5%) have the highest median income of $45,278 per family member.
| Income Bracket | # Families | Median Income |
| 2-Person Families | 126 (76.4%) | $90,500 |
| 3-Person Families | 14 (8.5%) | $135,833 |
| 4-Person Families | 16 (9.7%) | $123,750 |
| 5-Person Families | 9 (5.4%) | $0 |
| 6-Person Families | 0 (0.0%) | $0 |
| 7+ Person Families | 0 (0.0%) | $0 |
| Total | 165 (100.0%) | $98,438 |
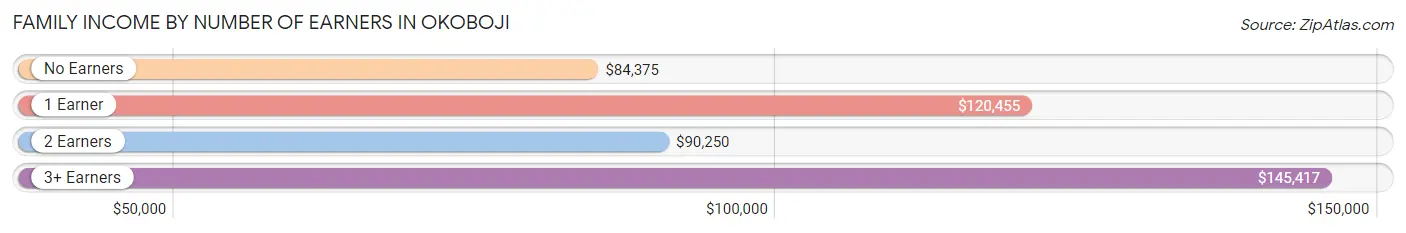
Family Income by Number of Earners in Okoboji
The median family income in Okoboji is $98,438, with families comprising 3+ earners (11) having the highest median family income of $145,417, while families with no earners (51) have the lowest median family income of $84,375, accounting for 6.7% and 30.9% of families, respectively.
| Number of Earners | # Families | Median Income |
| No Earners | 51 (30.9%) | $84,375 |
| 1 Earner | 24 (14.5%) | $120,455 |
| 2 Earners | 79 (47.9%) | $90,250 |
| 3+ Earners | 11 (6.7%) | $145,417 |
| Total | 165 (100.0%) | $98,438 |
Household Income in Okoboji
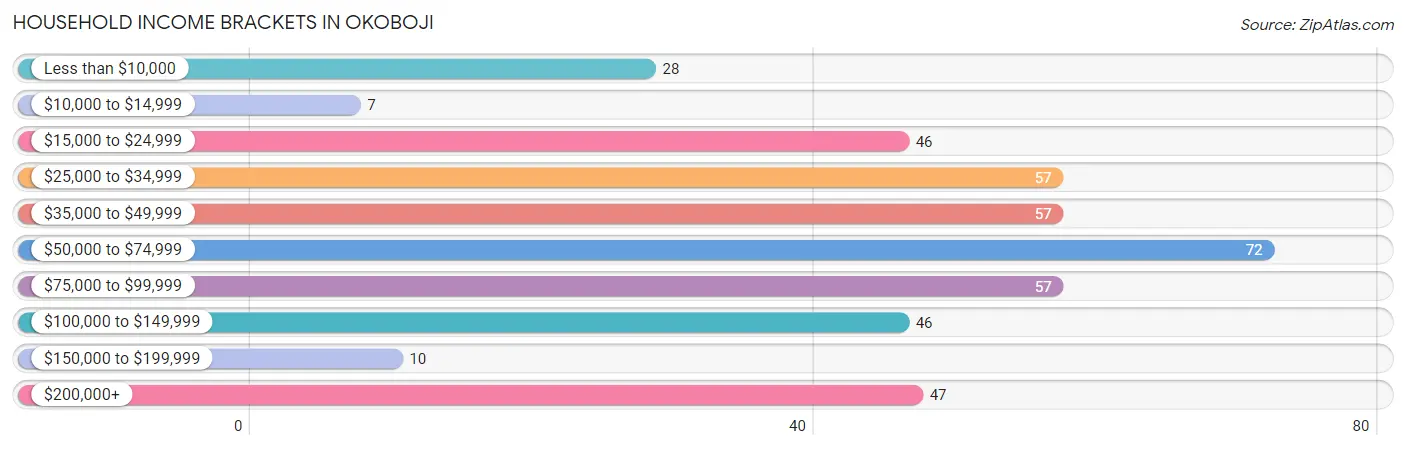
Household Income Brackets in Okoboji
With 72 households falling in the category, the $50,000 to $74,999 income range is the most frequent in Okoboji, accounting for 16.9% of all households. In contrast, only 7 households (1.6%) fall into the $10,000 to $14,999 income bracket, making it the least populous group.
| Income Bracket | # Households | % Households |
| Less than $10,000 | 28 | 6.6% |
| $10,000 to $14,999 | 7 | 1.6% |
| $15,000 to $24,999 | 46 | 10.8% |
| $25,000 to $34,999 | 57 | 13.3% |
| $35,000 to $49,999 | 57 | 13.3% |
| $50,000 to $74,999 | 72 | 16.9% |
| $75,000 to $99,999 | 57 | 13.3% |
| $100,000 to $149,999 | 46 | 10.8% |
| $150,000 to $199,999 | 10 | 2.3% |
| $200,000+ | 47 | 11.0% |
Household Income by Householder Age in Okoboji
The median household income in Okoboji is $56,845, with the highest median household income of $61,979 found in the 45 to 64 years age bracket for the primary householder. A total of 85 households (19.9%) fall into this category. Meanwhile, the 15 to 24 years age bracket for the primary householder has the lowest median household income of $0, with 31 households (7.3%) in this group.
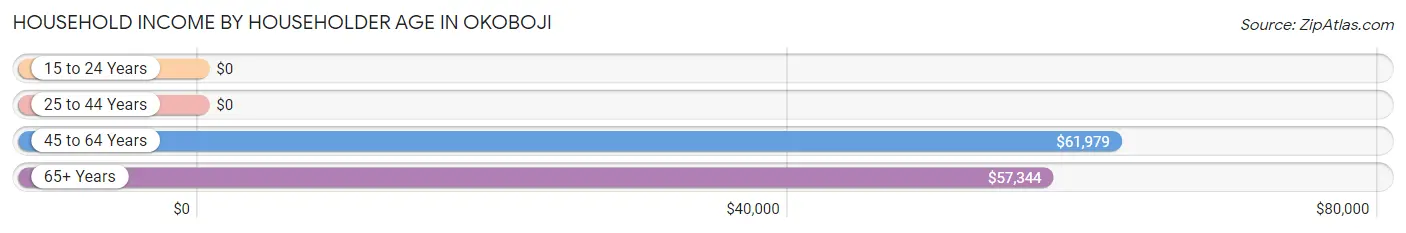
| Income Bracket | # Households | Median Income |
| 15 to 24 Years | 31 (7.3%) | $0 |
| 25 to 44 Years | 95 (22.3%) | $0 |
| 45 to 64 Years | 85 (19.9%) | $61,979 |
| 65+ Years | 216 (50.6%) | $57,344 |
| Total | 427 (100.0%) | $56,845 |
Poverty in Okoboji
Income Below Poverty by Sex and Age in Okoboji
With 24.6% poverty level for males and 7.5% for females among the residents of Okoboji, 18 to 24 year old males and 18 to 24 year old females are the most vulnerable to poverty, with 50 males (86.2%) and 3 females (100.0%) in their respective age groups living below the poverty level.
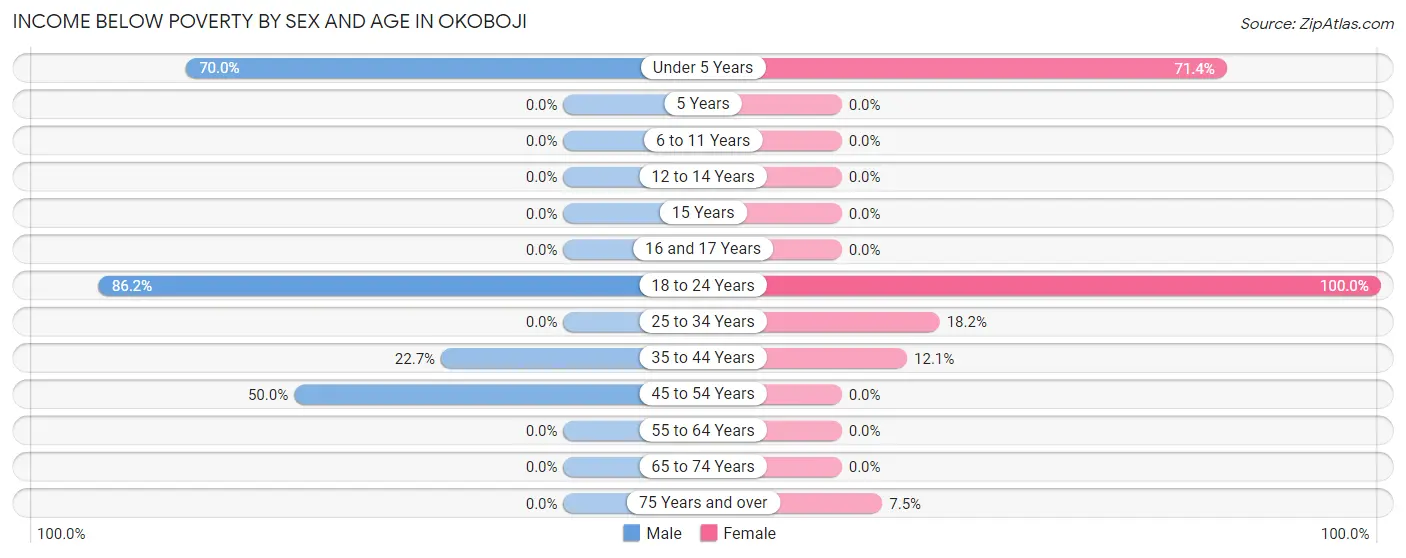
| Age Bracket | Male | Female |
| Under 5 Years | 7 (70.0%) | 10 (71.4%) |
| 5 Years | 0 (0.0%) | 0 (0.0%) |
| 6 to 11 Years | 0 (0.0%) | 0 (0.0%) |
| 12 to 14 Years | 0 (0.0%) | 0 (0.0%) |
| 15 Years | 0 (0.0%) | 0 (0.0%) |
| 16 and 17 Years | 0 (0.0%) | 0 (0.0%) |
| 18 to 24 Years | 50 (86.2%) | 3 (100.0%) |
| 25 to 34 Years | 0 (0.0%) | 8 (18.2%) |
| 35 to 44 Years | 15 (22.7%) | 4 (12.1%) |
| 45 to 54 Years | 9 (50.0%) | 0 (0.0%) |
| 55 to 64 Years | 0 (0.0%) | 0 (0.0%) |
| 65 to 74 Years | 0 (0.0%) | 0 (0.0%) |
| 75 Years and over | 0 (0.0%) | 7 (7.5%) |
| Total | 81 (24.6%) | 32 (7.5%) |
Income Above Poverty by Sex and Age in Okoboji
According to the poverty statistics in Okoboji, males aged 5 years and females aged 6 to 11 years are the age groups that are most secure financially, with 100.0% of males and 100.0% of females in these age groups living above the poverty line.
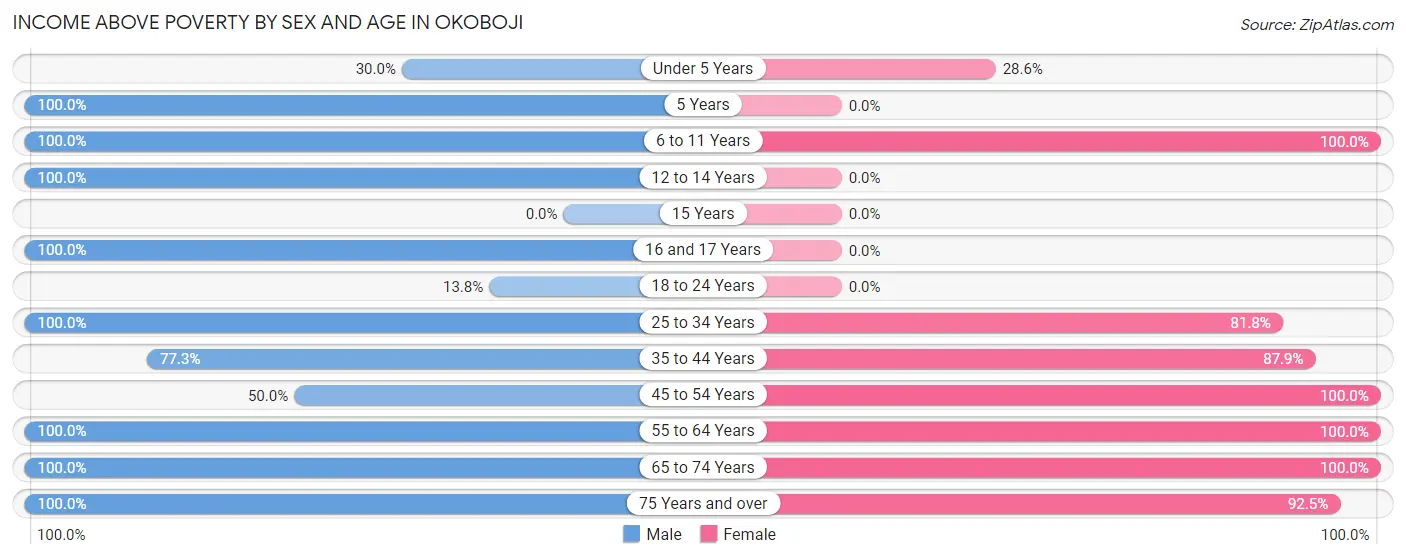
| Age Bracket | Male | Female |
| Under 5 Years | 3 (30.0%) | 4 (28.6%) |
| 5 Years | 2 (100.0%) | 0 (0.0%) |
| 6 to 11 Years | 13 (100.0%) | 38 (100.0%) |
| 12 to 14 Years | 4 (100.0%) | 0 (0.0%) |
| 15 Years | 0 (0.0%) | 0 (0.0%) |
| 16 and 17 Years | 3 (100.0%) | 0 (0.0%) |
| 18 to 24 Years | 8 (13.8%) | 0 (0.0%) |
| 25 to 34 Years | 18 (100.0%) | 36 (81.8%) |
| 35 to 44 Years | 51 (77.3%) | 29 (87.9%) |
| 45 to 54 Years | 9 (50.0%) | 32 (100.0%) |
| 55 to 64 Years | 33 (100.0%) | 71 (100.0%) |
| 65 to 74 Years | 71 (100.0%) | 98 (100.0%) |
| 75 Years and over | 33 (100.0%) | 86 (92.5%) |
| Total | 248 (75.4%) | 394 (92.5%) |
Income Below Poverty Among Married-Couple Families in Okoboji
The poverty statistics for married-couple families in Okoboji show that 2.5% or 4 of the total 157 families live below the poverty line. Families with 3 or 4 children have the highest poverty rate of 66.7%, comprising of 4 families. On the other hand, families with no children have the lowest poverty rate of 0.0%, which includes 0 families.
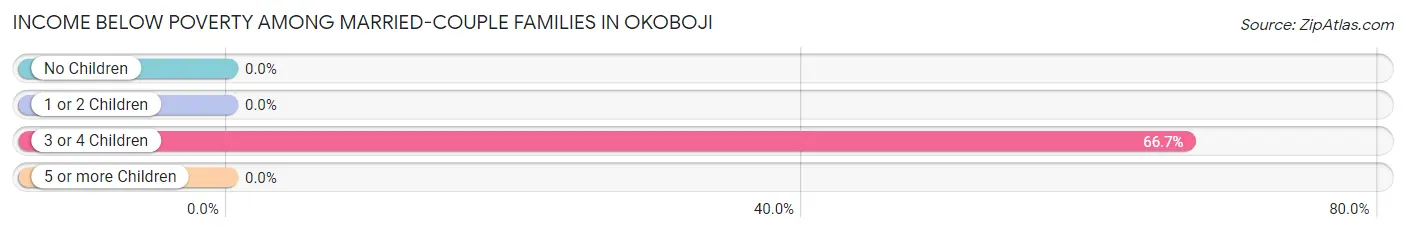
| Children | Above Poverty | Below Poverty |
| No Children | 127 (100.0%) | 0 (0.0%) |
| 1 or 2 Children | 24 (100.0%) | 0 (0.0%) |
| 3 or 4 Children | 2 (33.3%) | 4 (66.7%) |
| 5 or more Children | 0 (0.0%) | 0 (0.0%) |
| Total | 153 (97.5%) | 4 (2.5%) |
Income Below Poverty Among Single-Parent Households in Okoboji
| Children | Single Father | Single Mother |
| No Children | 0 (0.0%) | 0 (0.0%) |
| 1 or 2 Children | 0 (0.0%) | 0 (0.0%) |
| 3 or 4 Children | 0 (0.0%) | 0 (0.0%) |
| 5 or more Children | 0 (0.0%) | 0 (0.0%) |
| Total | 0 (0.0%) | 0 (0.0%) |
Income Below Poverty Among Married-Couple vs Single-Parent Households in Okoboji
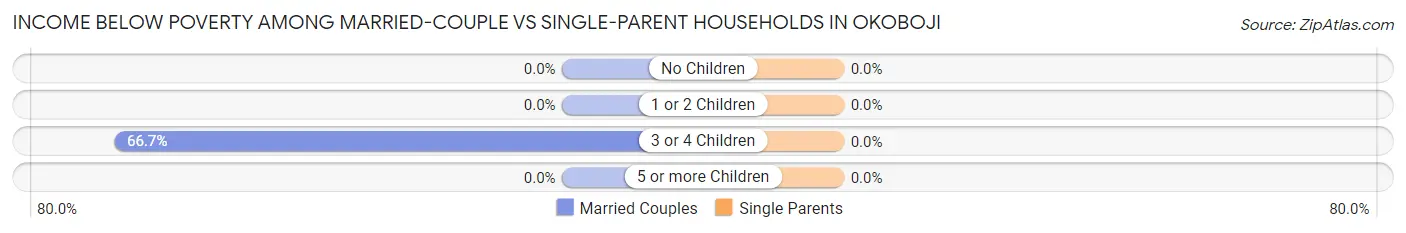
| Children | Married-Couple Families | Single-Parent Households |
| No Children | 0 (0.0%) | 0 (0.0%) |
| 1 or 2 Children | 0 (0.0%) | 0 (0.0%) |
| 3 or 4 Children | 4 (66.7%) | 0 (0.0%) |
| 5 or more Children | 0 (0.0%) | 0 (0.0%) |
| Total | 4 (2.5%) | 0 (0.0%) |
Race in Okoboji
The most populous races in Okoboji are White / Caucasian (717 | 91.4%), Asian (35 | 4.5%), and Two or more Races (31 | 4.0%).
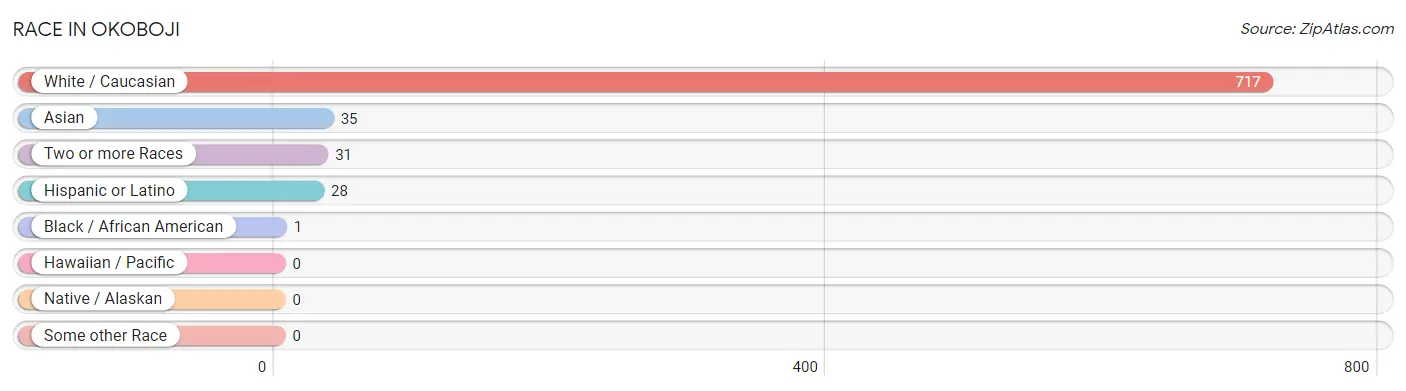
| Race | # Population | % Population |
| Asian | 35 | 4.5% |
| Black / African American | 1 | 0.1% |
| Hawaiian / Pacific | 0 | 0.0% |
| Hispanic or Latino | 28 | 3.6% |
| Native / Alaskan | 0 | 0.0% |
| White / Caucasian | 717 | 91.4% |
| Two or more Races | 31 | 4.0% |
| Some other Race | 0 | 0.0% |
| Total | 784 | 100.0% |
Ancestry in Okoboji
The most populous ancestries reported in Okoboji are German (318 | 40.6%), Irish (144 | 18.4%), English (102 | 13.0%), Norwegian (73 | 9.3%), and Dutch (44 | 5.6%), together accounting for 86.9% of all Okoboji residents.
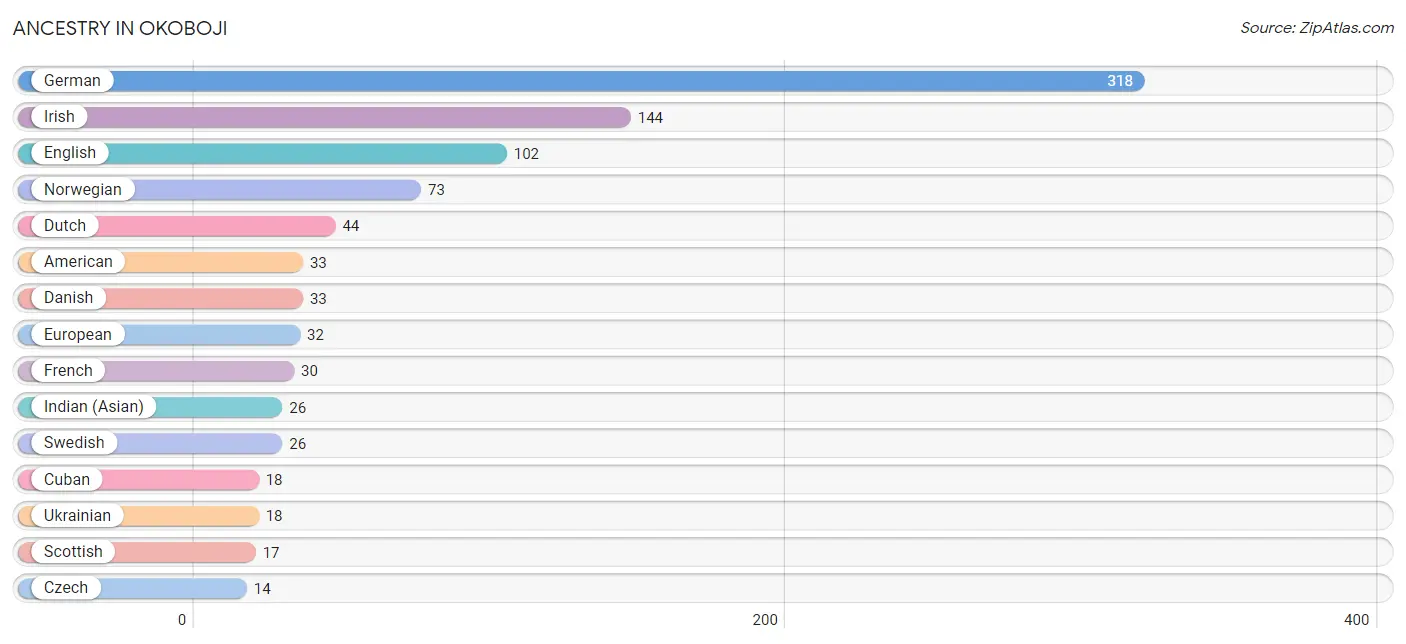
| Ancestry | # Population | % Population |
| American | 33 | 4.2% |
| Austrian | 1 | 0.1% |
| Belgian | 4 | 0.5% |
| Burmese | 1 | 0.1% |
| Cuban | 18 | 2.3% |
| Czech | 14 | 1.8% |
| Danish | 33 | 4.2% |
| Dutch | 44 | 5.6% |
| Eastern European | 7 | 0.9% |
| English | 102 | 13.0% |
| European | 32 | 4.1% |
| French | 30 | 3.8% |
| French Canadian | 2 | 0.3% |
| German | 318 | 40.6% |
| Indian (Asian) | 26 | 3.3% |
| Irish | 144 | 18.4% |
| Korean | 8 | 1.0% |
| Northern European | 3 | 0.4% |
| Norwegian | 73 | 9.3% |
| Polish | 2 | 0.3% |
| Puerto Rican | 10 | 1.3% |
| Scotch-Irish | 11 | 1.4% |
| Scottish | 17 | 2.2% |
| Swedish | 26 | 3.3% |
| Turkish | 13 | 1.7% |
| Ukrainian | 18 | 2.3% | View All 26 Rows |
Immigrants in Okoboji
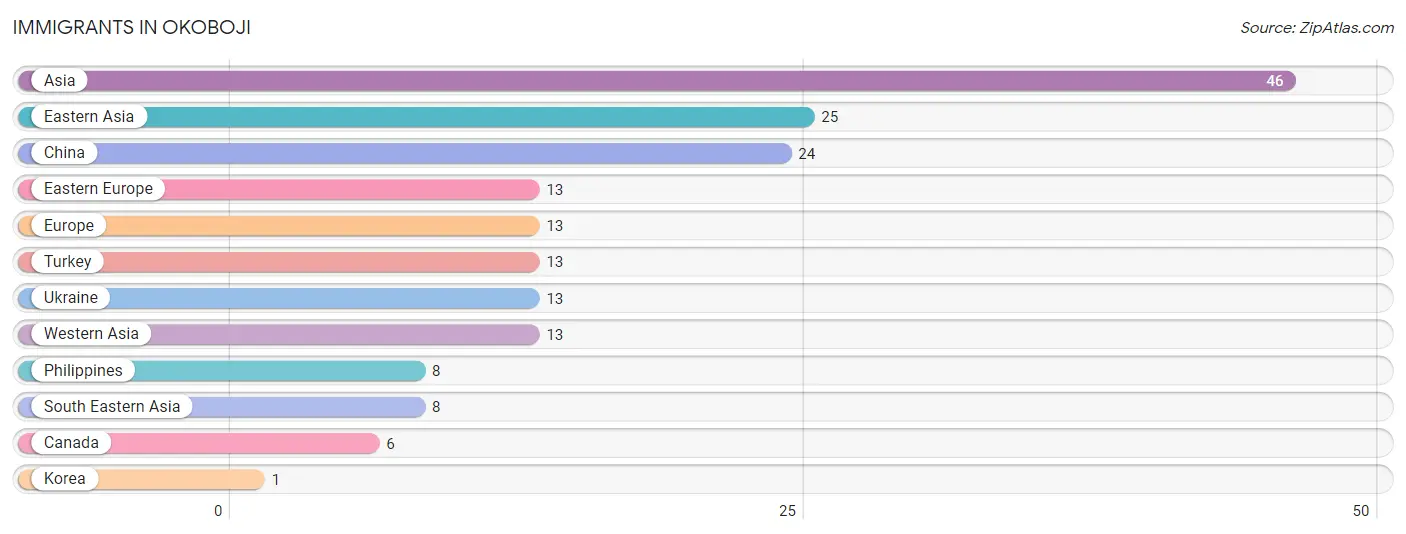
The most numerous immigrant groups reported in Okoboji came from Asia (46 | 5.9%), Eastern Asia (25 | 3.2%), China (24 | 3.1%), Eastern Europe (13 | 1.7%), and Europe (13 | 1.7%), together accounting for 15.4% of all Okoboji residents.
| Immigration Origin | # Population | % Population |
| Asia | 46 | 5.9% |
| Canada | 6 | 0.8% |
| China | 24 | 3.1% |
| Eastern Asia | 25 | 3.2% |
| Eastern Europe | 13 | 1.7% |
| Europe | 13 | 1.7% |
| Korea | 1 | 0.1% |
| Philippines | 8 | 1.0% |
| South Eastern Asia | 8 | 1.0% |
| Turkey | 13 | 1.7% |
| Ukraine | 13 | 1.7% |
| Western Asia | 13 | 1.7% | View All 12 Rows |
Sex and Age in Okoboji
Sex and Age in Okoboji
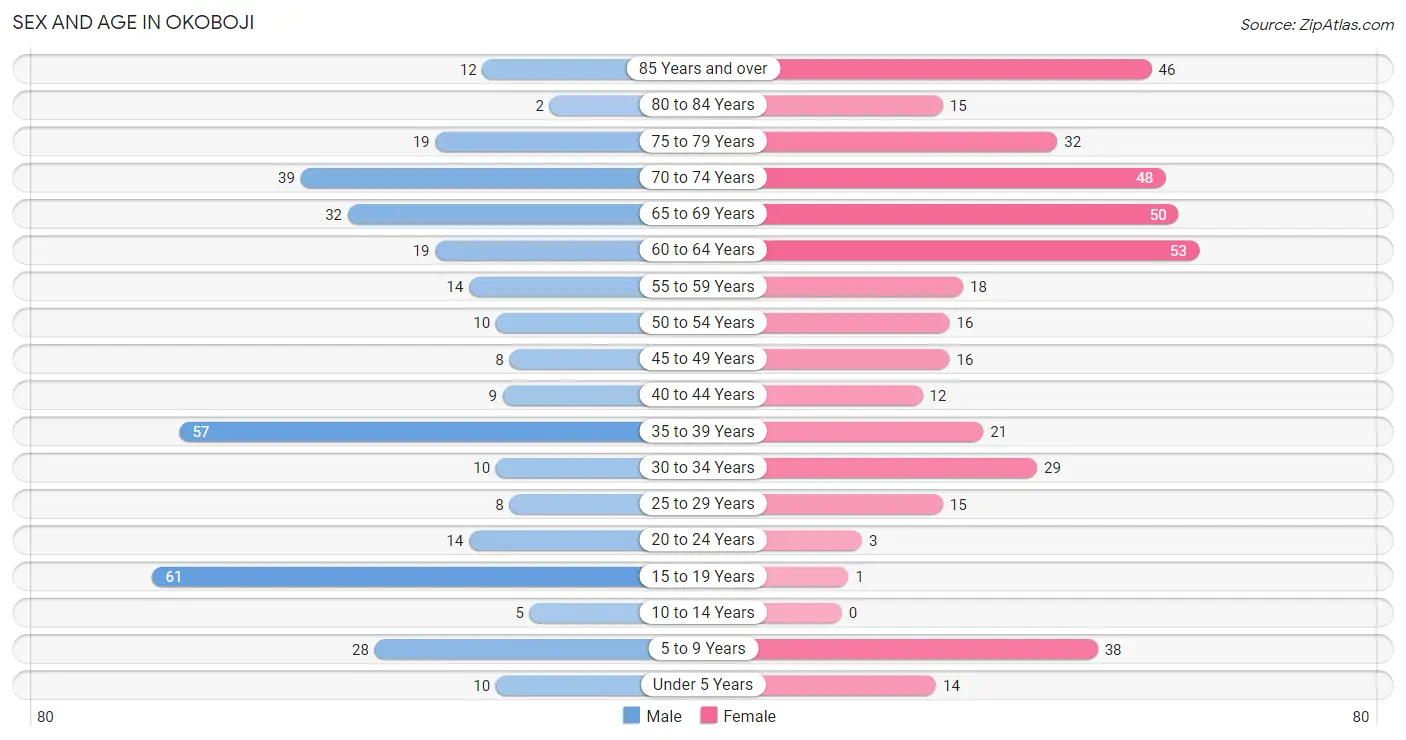
The most populous age groups in Okoboji are 15 to 19 Years (61 | 17.1%) for men and 60 to 64 Years (53 | 12.4%) for women.
| Age Bracket | Male | Female |
| Under 5 Years | 10 (2.8%) | 14 (3.3%) |
| 5 to 9 Years | 28 (7.8%) | 38 (8.9%) |
| 10 to 14 Years | 5 (1.4%) | 0 (0.0%) |
| 15 to 19 Years | 61 (17.1%) | 1 (0.2%) |
| 20 to 24 Years | 14 (3.9%) | 3 (0.7%) |
| 25 to 29 Years | 8 (2.2%) | 15 (3.5%) |
| 30 to 34 Years | 10 (2.8%) | 29 (6.8%) |
| 35 to 39 Years | 57 (16.0%) | 21 (4.9%) |
| 40 to 44 Years | 9 (2.5%) | 12 (2.8%) |
| 45 to 49 Years | 8 (2.2%) | 16 (3.7%) |
| 50 to 54 Years | 10 (2.8%) | 16 (3.7%) |
| 55 to 59 Years | 14 (3.9%) | 18 (4.2%) |
| 60 to 64 Years | 19 (5.3%) | 53 (12.4%) |
| 65 to 69 Years | 32 (9.0%) | 50 (11.7%) |
| 70 to 74 Years | 39 (10.9%) | 48 (11.2%) |
| 75 to 79 Years | 19 (5.3%) | 32 (7.5%) |
| 80 to 84 Years | 2 (0.6%) | 15 (3.5%) |
| 85 Years and over | 12 (3.4%) | 46 (10.8%) |
| Total | 357 (100.0%) | 427 (100.0%) |
Families and Households in Okoboji
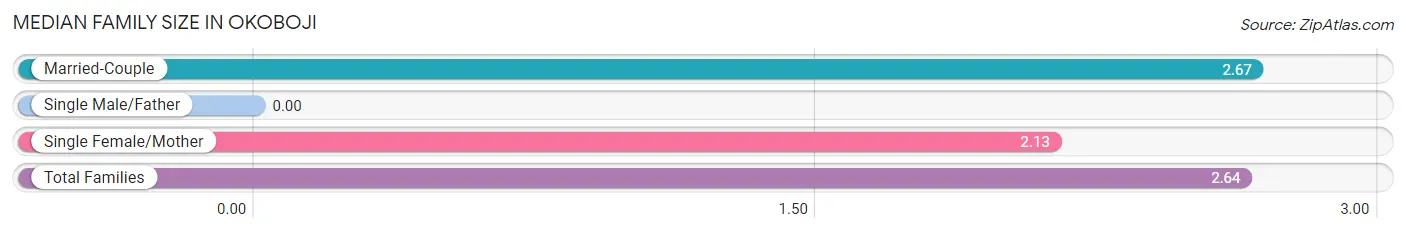
Median Family Size in Okoboji
| Family Type | # Families | Family Size |
| Married-Couple | 157 (95.2%) | 2.67 |
| Single Male/Father | 0 (0.0%) | - |
| Single Female/Mother | 8 (4.9%) | 2.13 |
| Total Families | 165 (100.0%) | 2.64 |
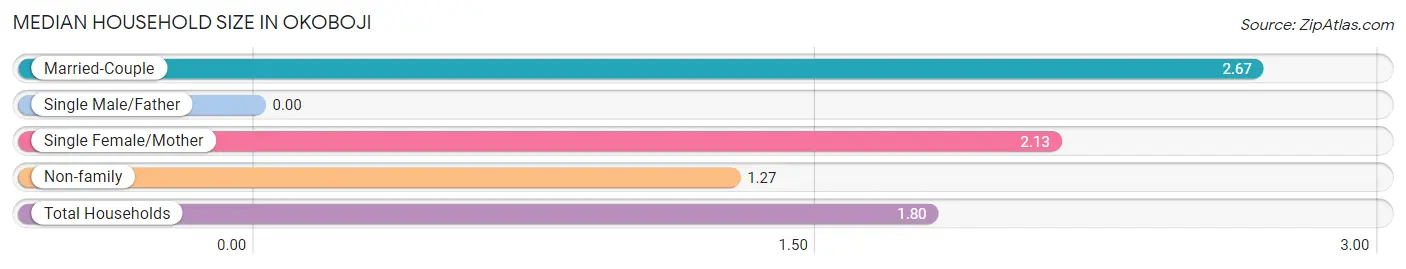
Median Household Size in Okoboji
| Household Type | # Households | Household Size |
| Married-Couple | 157 (36.8%) | 2.67 |
| Single Male/Father | 0 (0.0%) | - |
| Single Female/Mother | 8 (1.9%) | 2.13 |
| Non-family | 262 (61.4%) | 1.27 |
| Total Households | 427 (100.0%) | 1.80 |
Household Size by Marriage Status in Okoboji
Out of a total of 427 households in Okoboji, 165 (38.6%) are family households, while 262 (61.4%) are nonfamily households. The most numerous type of family households are 2-person households, comprising 126, and the most common type of nonfamily households are 1-person households, comprising 226.
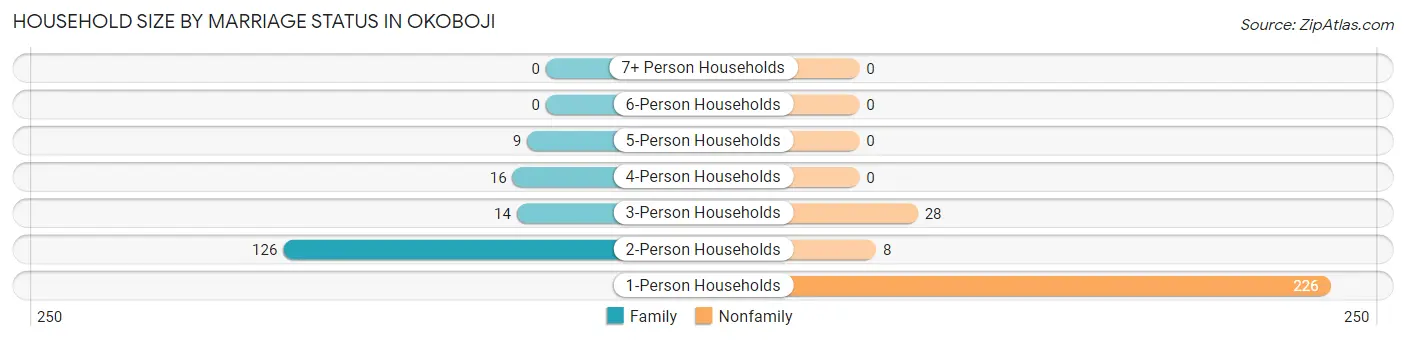
| Household Size | Family Households | Nonfamily Households |
| 1-Person Households | - | 226 (52.9%) |
| 2-Person Households | 126 (29.5%) | 8 (1.9%) |
| 3-Person Households | 14 (3.3%) | 28 (6.6%) |
| 4-Person Households | 16 (3.7%) | 0 (0.0%) |
| 5-Person Households | 9 (2.1%) | 0 (0.0%) |
| 6-Person Households | 0 (0.0%) | 0 (0.0%) |
| 7+ Person Households | 0 (0.0%) | 0 (0.0%) |
| Total | 165 (38.6%) | 262 (61.4%) |
Female Fertility in Okoboji
Fertility by Age in Okoboji
Average fertility rate in Okoboji is 70.0 births per 1,000 women. Women in the age bracket of 20 to 34 years have the highest fertility rate with 85.0 births per 1,000 women. Women in the age bracket of 20 to 34 years acount for 57.1% of all women with births.
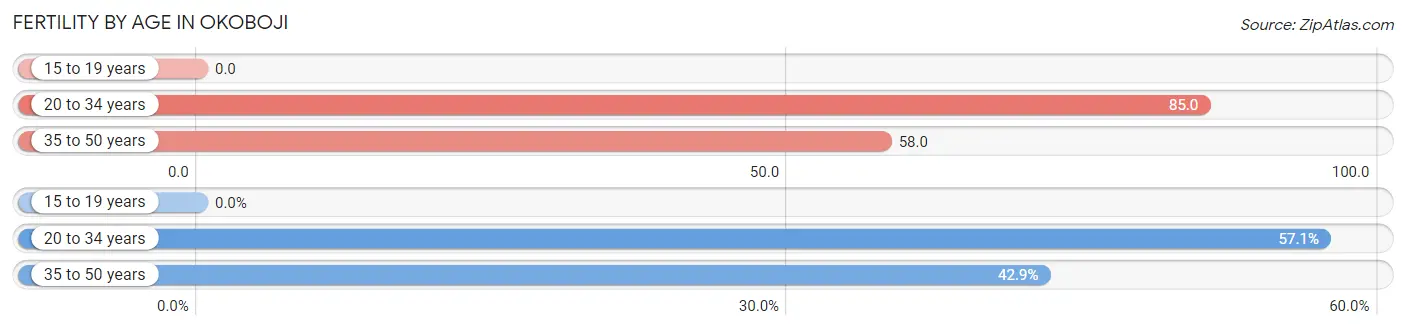
| Age Bracket | Women with Births | Births / 1,000 Women |
| 15 to 19 years | 0 (0.0%) | 0.0 |
| 20 to 34 years | 4 (57.1%) | 85.0 |
| 35 to 50 years | 3 (42.9%) | 58.0 |
| Total | 7 (100.0%) | 70.0 |
Fertility by Age by Marriage Status in Okoboji
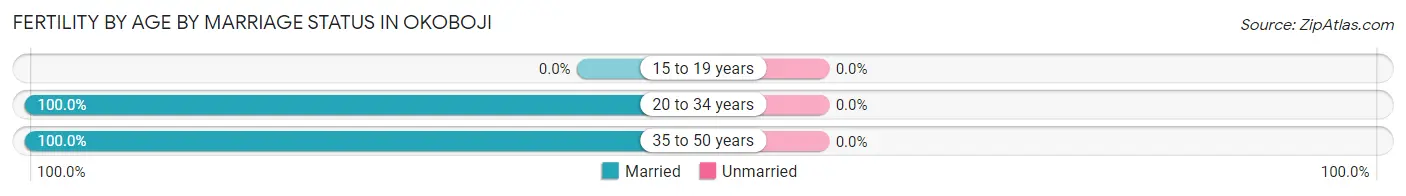
| Age Bracket | Married | Unmarried |
| 15 to 19 years | 0 (0.0%) | 0 (0.0%) |
| 20 to 34 years | 4 (100.0%) | 0 (0.0%) |
| 35 to 50 years | 3 (100.0%) | 0 (0.0%) |
| Total | 7 (100.0%) | 0 (0.0%) |
Fertility by Education in Okoboji
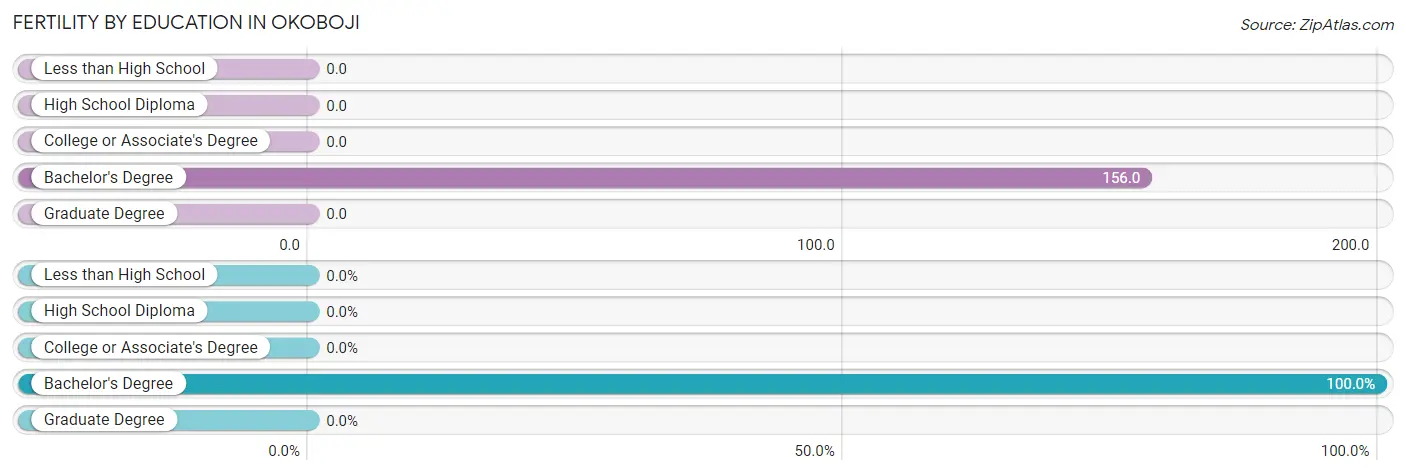
| Educational Attainment | Women with Births | Births / 1,000 Women |
| Less than High School | 0 (0.0%) | 0.0 |
| High School Diploma | 0 (0.0%) | 0.0 |
| College or Associate's Degree | 0 (0.0%) | 0.0 |
| Bachelor's Degree | 7 (100.0%) | 156.0 |
| Graduate Degree | 0 (0.0%) | 0.0 |
| Total | 7 (100.0%) | 70.0 |
Fertility by Education by Marriage Status in Okoboji
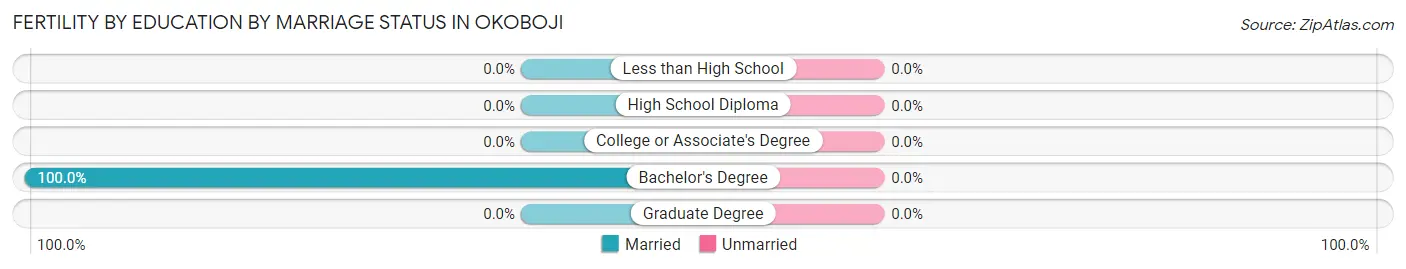
| Educational Attainment | Married | Unmarried |
| Less than High School | 0 (0.0%) | 0 (0.0%) |
| High School Diploma | 0 (0.0%) | 0 (0.0%) |
| College or Associate's Degree | 0 (0.0%) | 0 (0.0%) |
| Bachelor's Degree | 7 (100.0%) | 0 (0.0%) |
| Graduate Degree | 0 (0.0%) | 0 (0.0%) |
| Total | 7 (100.0%) | 0 (0.0%) |
Employment Characteristics in Okoboji
Employment by Class of Employer in Okoboji
Among the 407 employed individuals in Okoboji, private company employees (248 | 60.9%), self-employed (not incorporated) (53 | 13.0%), and not-for-profit organizations (37 | 9.1%) make up the most common classes of employment.
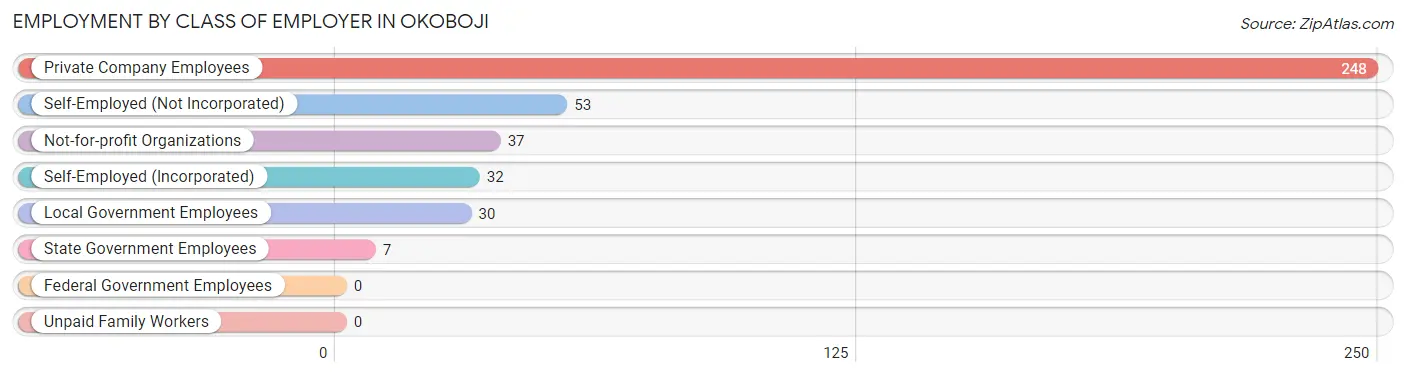
| Employer Class | # Employees | % Employees |
| Private Company Employees | 248 | 60.9% |
| Self-Employed (Incorporated) | 32 | 7.9% |
| Self-Employed (Not Incorporated) | 53 | 13.0% |
| Not-for-profit Organizations | 37 | 9.1% |
| Local Government Employees | 30 | 7.4% |
| State Government Employees | 7 | 1.7% |
| Federal Government Employees | 0 | 0.0% |
| Unpaid Family Workers | 0 | 0.0% |
| Total | 407 | 100.0% |
Employment Status by Age in Okoboji
According to the labor force statistics for Okoboji, out of the total population over 16 years of age (689), 62.0% or 427 individuals are in the labor force, with 2.1% or 9 of them unemployed. The age group with the highest labor force participation rate is 25 to 29 years, with 100.0% or 23 individuals in the labor force. Within the labor force, the 30 to 34 years age range has the highest percentage of unemployed individuals, with 20.5% or 8 of them being unemployed.
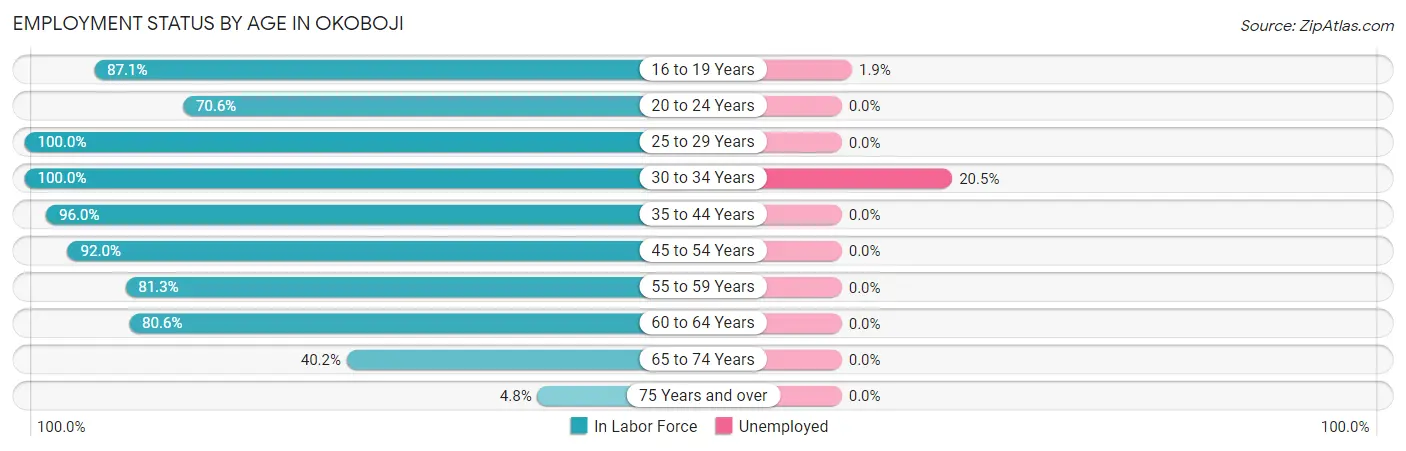
| Age Bracket | In Labor Force | Unemployed |
| 16 to 19 Years | 54 (87.1%) | 1 (1.9%) |
| 20 to 24 Years | 12 (70.6%) | 0 (0.0%) |
| 25 to 29 Years | 23 (100.0%) | 0 (0.0%) |
| 30 to 34 Years | 39 (100.0%) | 8 (20.5%) |
| 35 to 44 Years | 95 (96.0%) | 0 (0.0%) |
| 45 to 54 Years | 46 (92.0%) | 0 (0.0%) |
| 55 to 59 Years | 26 (81.3%) | 0 (0.0%) |
| 60 to 64 Years | 58 (80.6%) | 0 (0.0%) |
| 65 to 74 Years | 68 (40.2%) | 0 (0.0%) |
| 75 Years and over | 6 (4.8%) | 0 (0.0%) |
| Total | 427 (62.0%) | 9 (2.1%) |
Employment Status by Educational Attainment in Okoboji
According to labor force statistics for Okoboji, 91.1% of individuals (287) out of the total population between 25 and 64 years of age (315) are in the labor force, with 2.8% or 8 of them being unemployed. The group with the highest labor force participation rate are those with the educational attainment of bachelor's degree or higher, with 93.8% or 121 individuals in the labor force. Within the labor force, individuals with college / associate degree education have the highest percentage of unemployment, with 8.9% or 8 of them being unemployed.
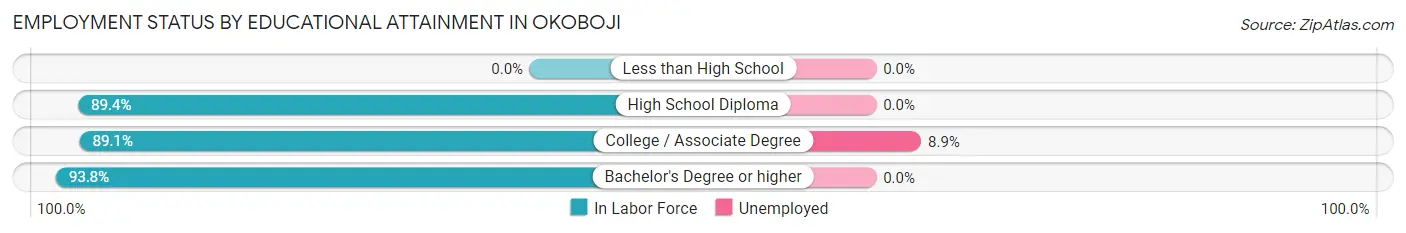
| Educational Attainment | In Labor Force | Unemployed |
| Less than High School | 0 (0.0%) | 0 (0.0%) |
| High School Diploma | 76 (89.4%) | 0 (0.0%) |
| College / Associate Degree | 90 (89.1%) | 9 (8.9%) |
| Bachelor's Degree or higher | 121 (93.8%) | 0 (0.0%) |
| Total | 287 (91.1%) | 9 (2.8%) |
Employment Occupations by Sex in Okoboji
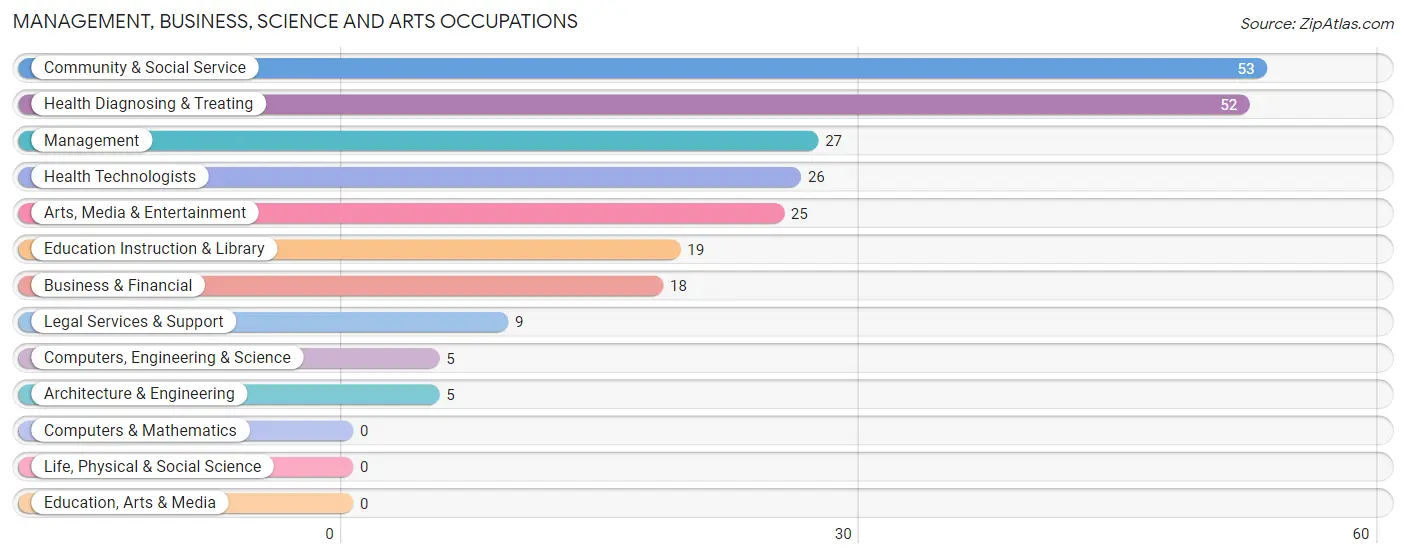
Management, Business, Science and Arts Occupations
The most common Management, Business, Science and Arts occupations in Okoboji are Community & Social Service (53 | 12.7%), Health Diagnosing & Treating (52 | 12.4%), Management (27 | 6.5%), Health Technologists (26 | 6.2%), and Arts, Media & Entertainment (25 | 6.0%).
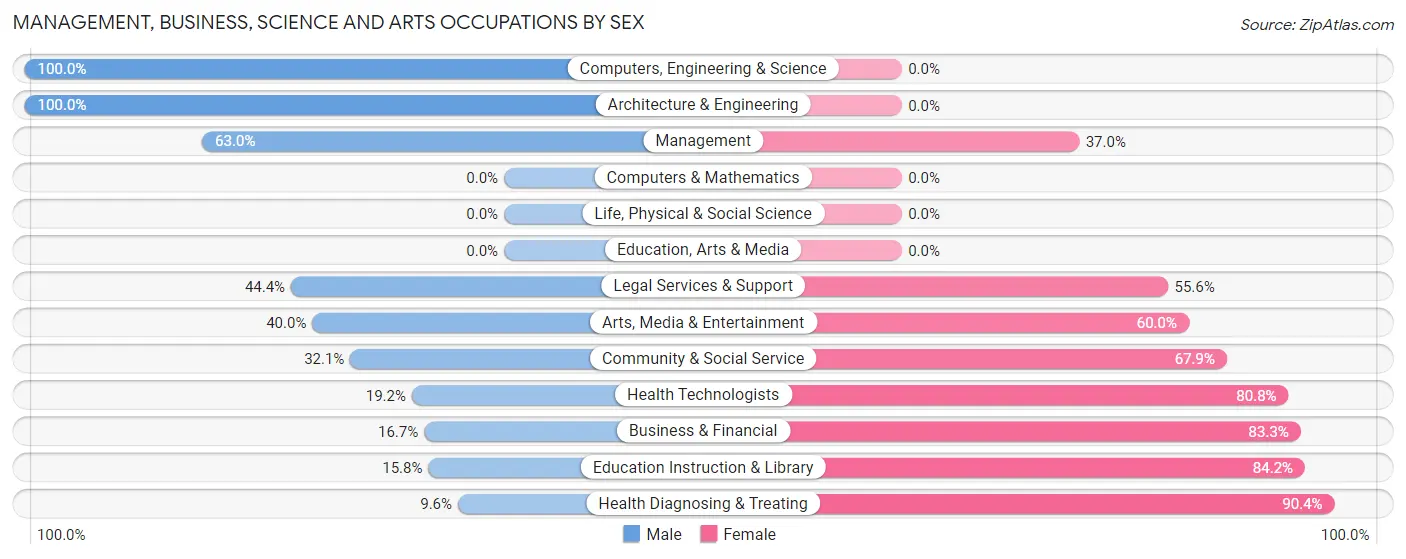
Management, Business, Science and Arts Occupations by Sex
Within the Management, Business, Science and Arts occupations in Okoboji, the most male-oriented occupations are Computers, Engineering & Science (100.0%), Architecture & Engineering (100.0%), and Management (63.0%), while the most female-oriented occupations are Health Diagnosing & Treating (90.4%), Education Instruction & Library (84.2%), and Business & Financial (83.3%).
| Occupation | Male | Female |
| Management | 17 (63.0%) | 10 (37.0%) |
| Business & Financial | 3 (16.7%) | 15 (83.3%) |
| Computers, Engineering & Science | 5 (100.0%) | 0 (0.0%) |
| Computers & Mathematics | 0 (0.0%) | 0 (0.0%) |
| Architecture & Engineering | 5 (100.0%) | 0 (0.0%) |
| Life, Physical & Social Science | 0 (0.0%) | 0 (0.0%) |
| Community & Social Service | 17 (32.1%) | 36 (67.9%) |
| Education, Arts & Media | 0 (0.0%) | 0 (0.0%) |
| Legal Services & Support | 4 (44.4%) | 5 (55.6%) |
| Education Instruction & Library | 3 (15.8%) | 16 (84.2%) |
| Arts, Media & Entertainment | 10 (40.0%) | 15 (60.0%) |
| Health Diagnosing & Treating | 5 (9.6%) | 47 (90.4%) |
| Health Technologists | 5 (19.2%) | 21 (80.8%) |
| Total (Category) | 47 (30.3%) | 108 (69.7%) |
| Total (Overall) | 228 (54.5%) | 190 (45.5%) |
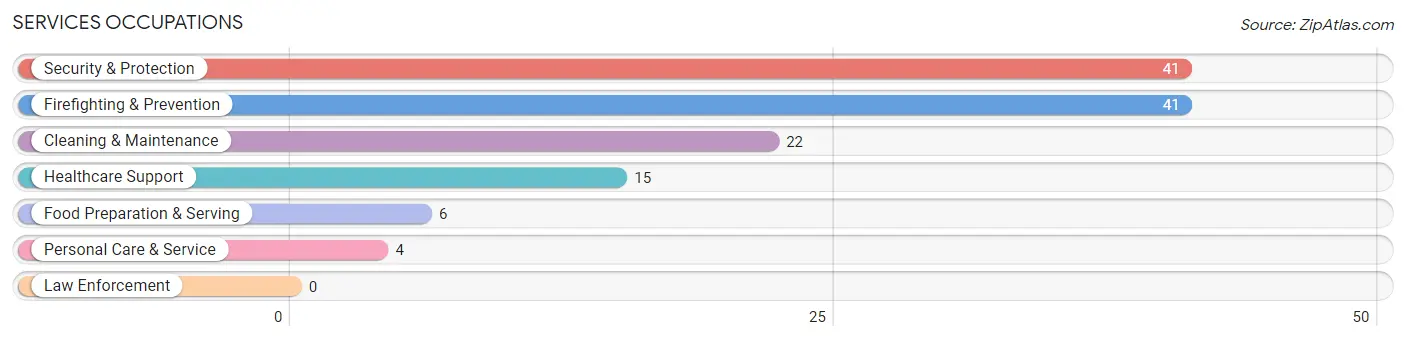
Services Occupations
The most common Services occupations in Okoboji are Security & Protection (41 | 9.8%), Firefighting & Prevention (41 | 9.8%), Cleaning & Maintenance (22 | 5.3%), Healthcare Support (15 | 3.6%), and Food Preparation & Serving (6 | 1.4%).
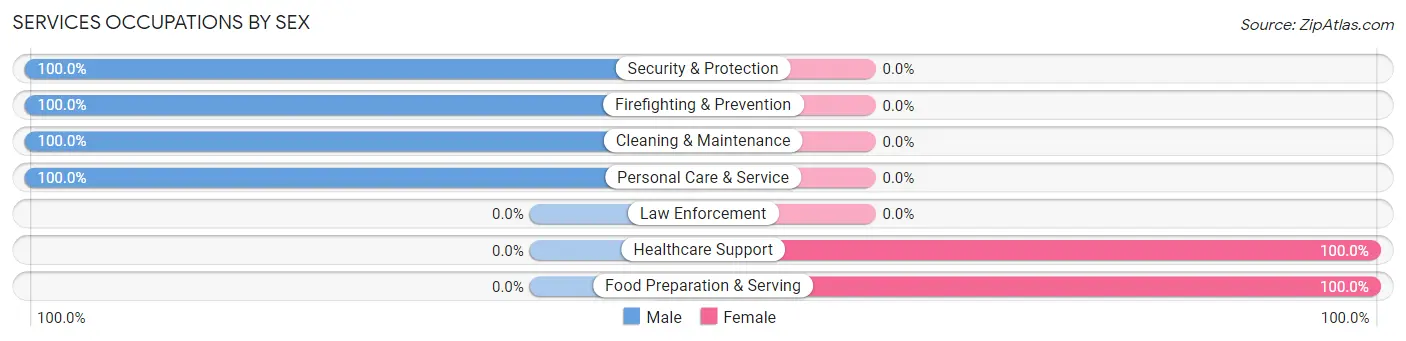
Services Occupations by Sex
Within the Services occupations in Okoboji, the most male-oriented occupations are Security & Protection (100.0%), Firefighting & Prevention (100.0%), and Cleaning & Maintenance (100.0%), while the most female-oriented occupations are Healthcare Support (100.0%), and Food Preparation & Serving (100.0%).
| Occupation | Male | Female |
| Healthcare Support | 0 (0.0%) | 15 (100.0%) |
| Security & Protection | 41 (100.0%) | 0 (0.0%) |
| Firefighting & Prevention | 41 (100.0%) | 0 (0.0%) |
| Law Enforcement | 0 (0.0%) | 0 (0.0%) |
| Food Preparation & Serving | 0 (0.0%) | 6 (100.0%) |
| Cleaning & Maintenance | 22 (100.0%) | 0 (0.0%) |
| Personal Care & Service | 4 (100.0%) | 0 (0.0%) |
| Total (Category) | 67 (76.1%) | 21 (23.9%) |
| Total (Overall) | 228 (54.5%) | 190 (45.5%) |
Sales and Office Occupations
The most common Sales and Office occupations in Okoboji are Sales & Related (69 | 16.5%), and Office & Administration (14 | 3.4%).
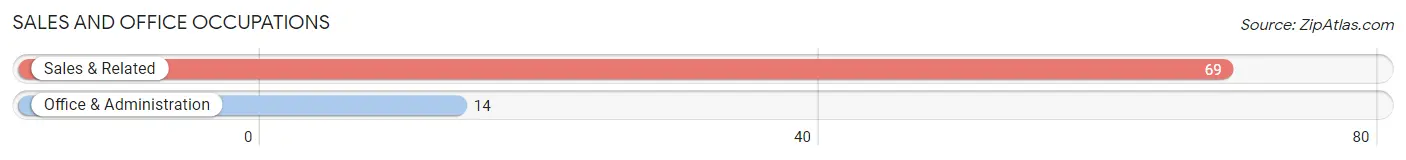
Sales and Office Occupations by Sex
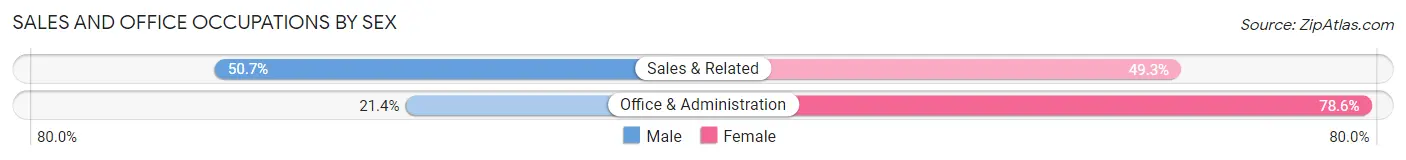
| Occupation | Male | Female |
| Sales & Related | 35 (50.7%) | 34 (49.3%) |
| Office & Administration | 3 (21.4%) | 11 (78.6%) |
| Total (Category) | 38 (45.8%) | 45 (54.2%) |
| Total (Overall) | 228 (54.5%) | 190 (45.5%) |
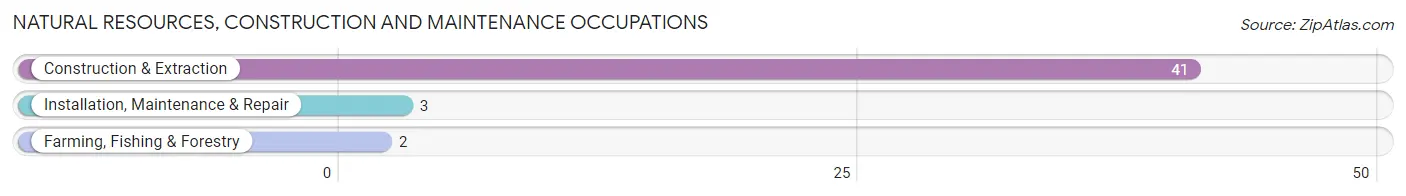
Natural Resources, Construction and Maintenance Occupations
The most common Natural Resources, Construction and Maintenance occupations in Okoboji are Construction & Extraction (41 | 9.8%), Installation, Maintenance & Repair (3 | 0.7%), and Farming, Fishing & Forestry (2 | 0.5%).
Natural Resources, Construction and Maintenance Occupations by Sex
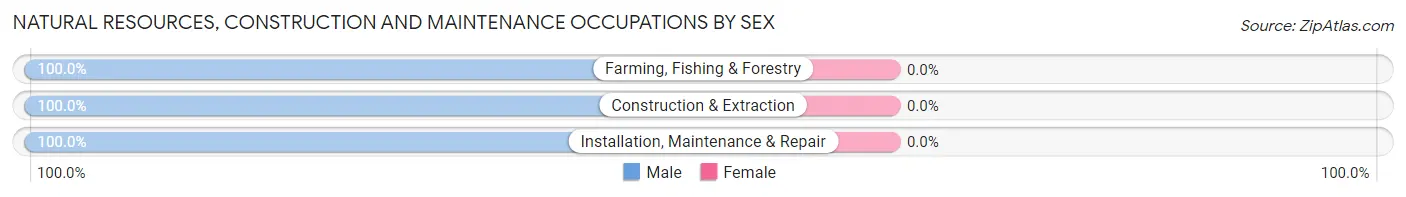
| Occupation | Male | Female |
| Farming, Fishing & Forestry | 2 (100.0%) | 0 (0.0%) |
| Construction & Extraction | 41 (100.0%) | 0 (0.0%) |
| Installation, Maintenance & Repair | 3 (100.0%) | 0 (0.0%) |
| Total (Category) | 46 (100.0%) | 0 (0.0%) |
| Total (Overall) | 228 (54.5%) | 190 (45.5%) |
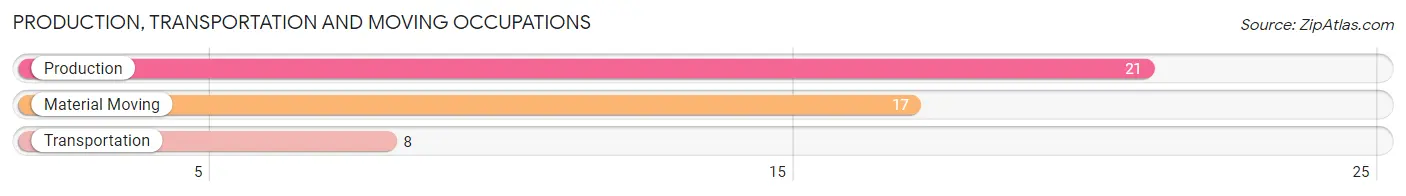
Production, Transportation and Moving Occupations
The most common Production, Transportation and Moving occupations in Okoboji are Production (21 | 5.0%), Material Moving (17 | 4.1%), and Transportation (8 | 1.9%).
Production, Transportation and Moving Occupations by Sex
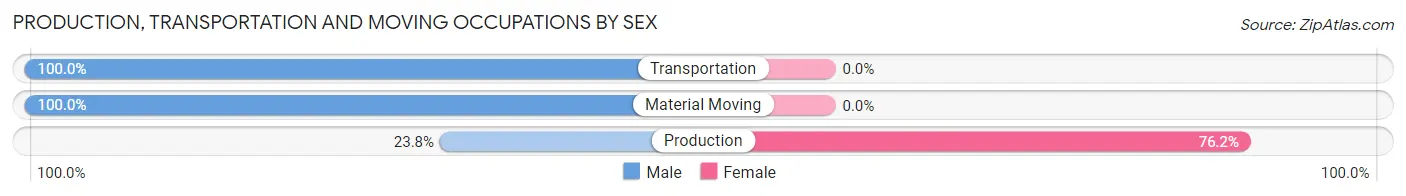
| Occupation | Male | Female |
| Production | 5 (23.8%) | 16 (76.2%) |
| Transportation | 8 (100.0%) | 0 (0.0%) |
| Material Moving | 17 (100.0%) | 0 (0.0%) |
| Total (Category) | 30 (65.2%) | 16 (34.8%) |
| Total (Overall) | 228 (54.5%) | 190 (45.5%) |
Employment Industries by Sex in Okoboji
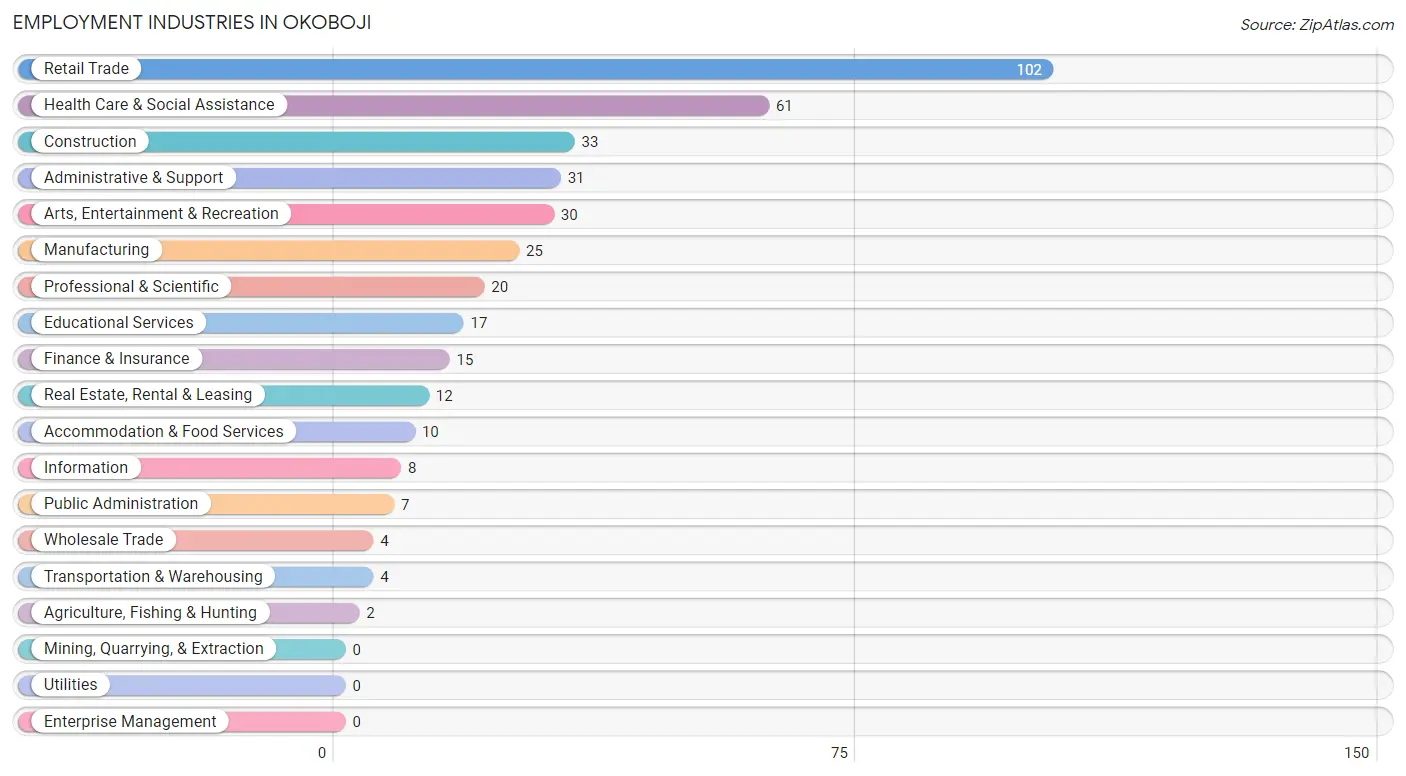
Employment Industries in Okoboji
The major employment industries in Okoboji include Retail Trade (102 | 24.4%), Health Care & Social Assistance (61 | 14.6%), Construction (33 | 7.9%), Administrative & Support (31 | 7.4%), and Arts, Entertainment & Recreation (30 | 7.2%).
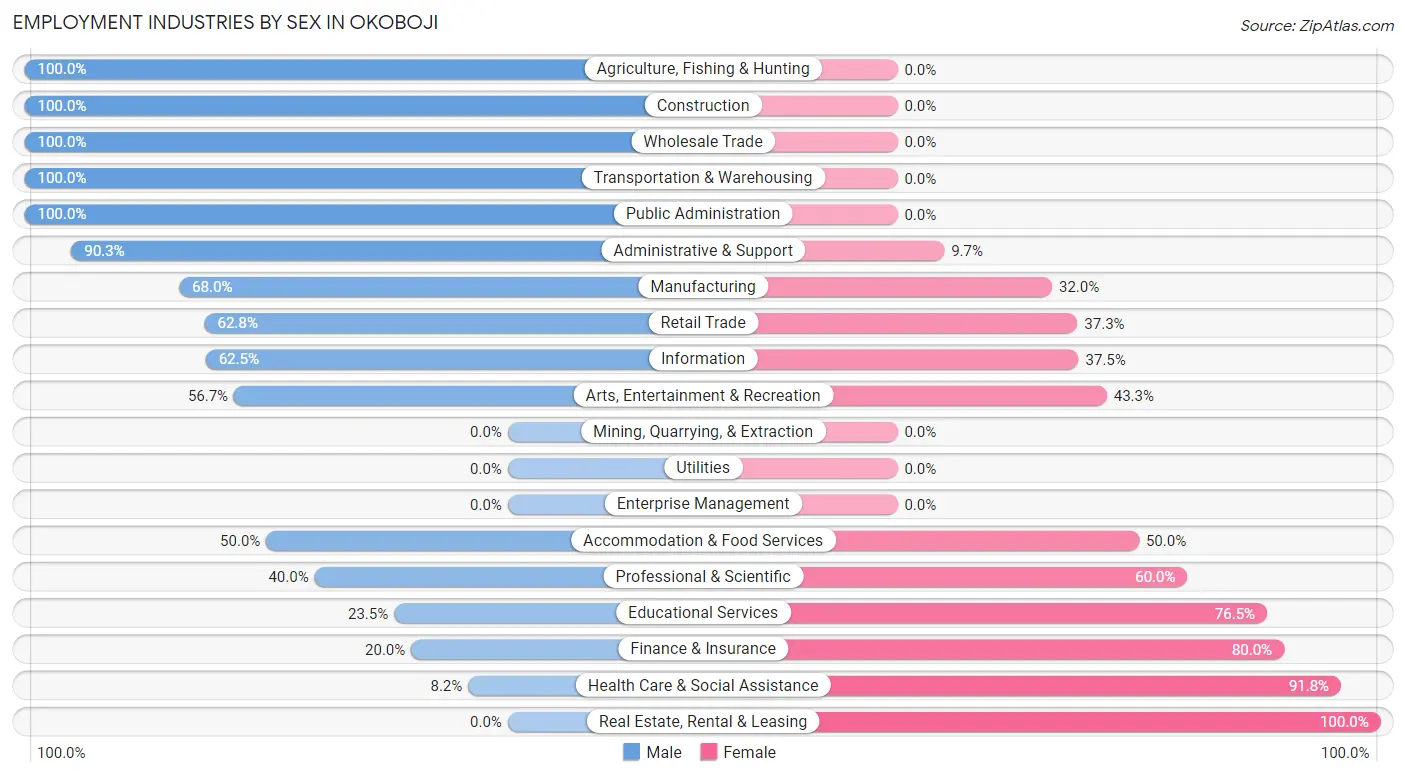
Employment Industries by Sex in Okoboji
The Okoboji industries that see more men than women are Agriculture, Fishing & Hunting (100.0%), Construction (100.0%), and Wholesale Trade (100.0%), whereas the industries that tend to have a higher number of women are Real Estate, Rental & Leasing (100.0%), Health Care & Social Assistance (91.8%), and Finance & Insurance (80.0%).
| Industry | Male | Female |
| Agriculture, Fishing & Hunting | 2 (100.0%) | 0 (0.0%) |
| Mining, Quarrying, & Extraction | 0 (0.0%) | 0 (0.0%) |
| Construction | 33 (100.0%) | 0 (0.0%) |
| Manufacturing | 17 (68.0%) | 8 (32.0%) |
| Wholesale Trade | 4 (100.0%) | 0 (0.0%) |
| Retail Trade | 64 (62.7%) | 38 (37.2%) |
| Transportation & Warehousing | 4 (100.0%) | 0 (0.0%) |
| Utilities | 0 (0.0%) | 0 (0.0%) |
| Information | 5 (62.5%) | 3 (37.5%) |
| Finance & Insurance | 3 (20.0%) | 12 (80.0%) |
| Real Estate, Rental & Leasing | 0 (0.0%) | 12 (100.0%) |
| Professional & Scientific | 8 (40.0%) | 12 (60.0%) |
| Enterprise Management | 0 (0.0%) | 0 (0.0%) |
| Administrative & Support | 28 (90.3%) | 3 (9.7%) |
| Educational Services | 4 (23.5%) | 13 (76.5%) |
| Health Care & Social Assistance | 5 (8.2%) | 56 (91.8%) |
| Arts, Entertainment & Recreation | 17 (56.7%) | 13 (43.3%) |
| Accommodation & Food Services | 5 (50.0%) | 5 (50.0%) |
| Public Administration | 7 (100.0%) | 0 (0.0%) |
| Total | 228 (54.5%) | 190 (45.5%) |
Education in Okoboji
School Enrollment in Okoboji
The most common levels of schooling among the 109 students in Okoboji are college / undergraduate (50 | 45.9%), elementary school (35 | 32.1%), and kindergarten (13 | 11.9%).
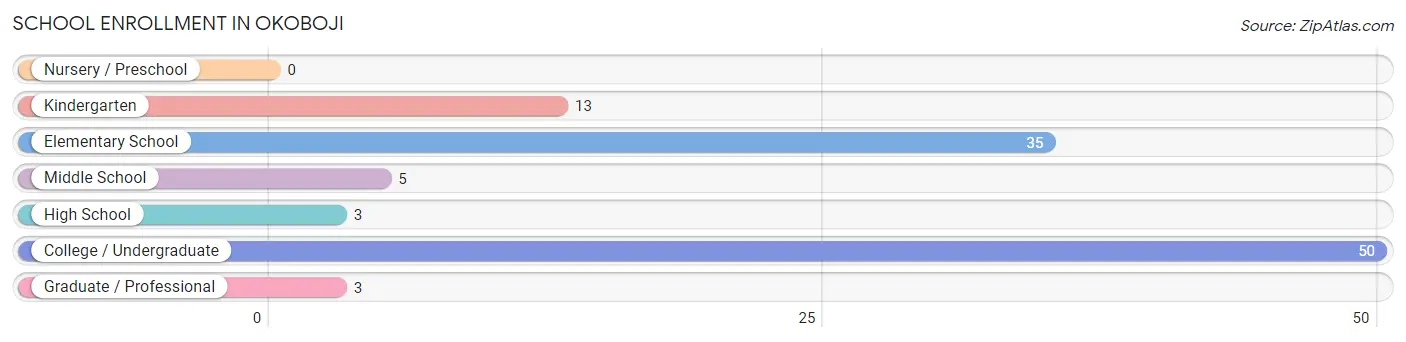
| School Level | # Students | % Students |
| Nursery / Preschool | 0 | 0.0% |
| Kindergarten | 13 | 11.9% |
| Elementary School | 35 | 32.1% |
| Middle School | 5 | 4.6% |
| High School | 3 | 2.8% |
| College / Undergraduate | 50 | 45.9% |
| Graduate / Professional | 3 | 2.8% |
| Total | 109 | 100.0% |
School Enrollment by Age by Funding Source in Okoboji
Out of a total of 109 students who are enrolled in schools in Okoboji, 30 (27.5%) attend a private institution, while the remaining 79 (72.5%) are enrolled in public schools. The age group of 18 to 19 year olds has the highest likelihood of being enrolled in private schools, with 26 (78.8% in the age bracket) enrolled. Conversely, the age group of 5 to 9 year old has the lowest likelihood of being enrolled in a private school, with 48 (100.0% in the age bracket) attending a public institution.
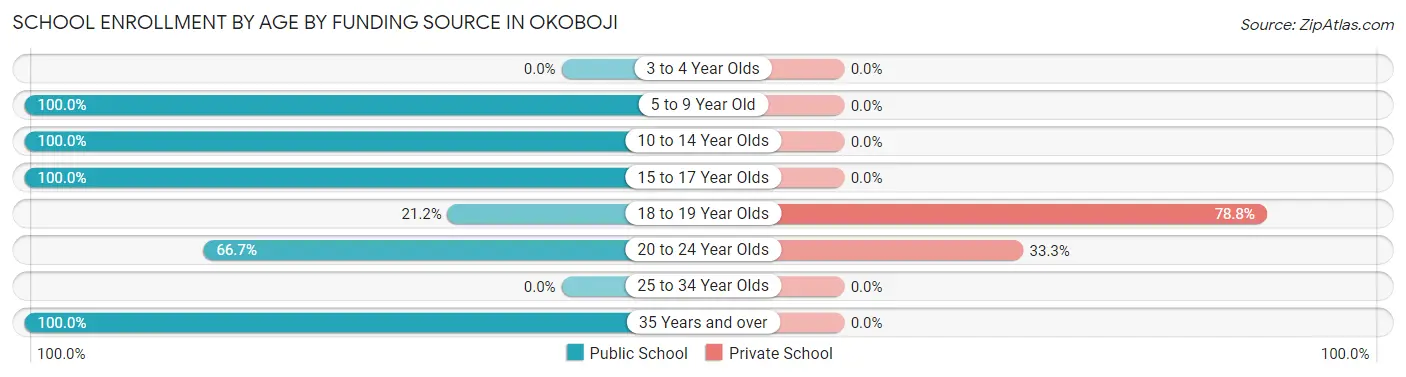
| Age Bracket | Public School | Private School |
| 3 to 4 Year Olds | 0 (0.0%) | 0 (0.0%) |
| 5 to 9 Year Old | 48 (100.0%) | 0 (0.0%) |
| 10 to 14 Year Olds | 5 (100.0%) | 0 (0.0%) |
| 15 to 17 Year Olds | 3 (100.0%) | 0 (0.0%) |
| 18 to 19 Year Olds | 7 (21.2%) | 26 (78.8%) |
| 20 to 24 Year Olds | 8 (66.7%) | 4 (33.3%) |
| 25 to 34 Year Olds | 0 (0.0%) | 0 (0.0%) |
| 35 Years and over | 8 (100.0%) | 0 (0.0%) |
| Total | 79 (72.5%) | 30 (27.5%) |
Educational Attainment by Field of Study in Okoboji
Education (66 | 23.7%), business (45 | 16.2%), social sciences (23 | 8.3%), science & technology (23 | 8.3%), and arts & humanities (20 | 7.2%) are the most common fields of study among 278 individuals in Okoboji who have obtained a bachelor's degree or higher.
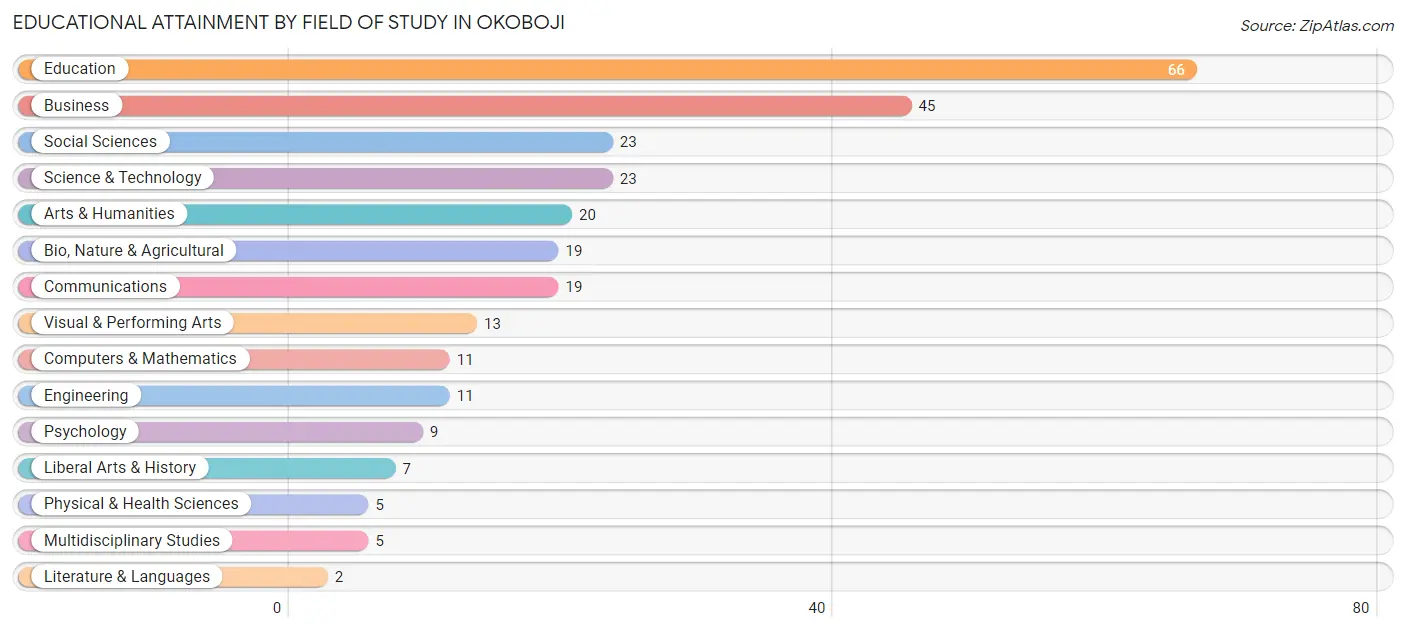
| Field of Study | # Graduates | % Graduates |
| Computers & Mathematics | 11 | 4.0% |
| Bio, Nature & Agricultural | 19 | 6.8% |
| Physical & Health Sciences | 5 | 1.8% |
| Psychology | 9 | 3.2% |
| Social Sciences | 23 | 8.3% |
| Engineering | 11 | 4.0% |
| Multidisciplinary Studies | 5 | 1.8% |
| Science & Technology | 23 | 8.3% |
| Business | 45 | 16.2% |
| Education | 66 | 23.7% |
| Literature & Languages | 2 | 0.7% |
| Liberal Arts & History | 7 | 2.5% |
| Visual & Performing Arts | 13 | 4.7% |
| Communications | 19 | 6.8% |
| Arts & Humanities | 20 | 7.2% |
| Total | 278 | 100.0% |
Transportation & Commute in Okoboji
Vehicle Availability by Sex in Okoboji
The most prevalent vehicle ownership categories in Okoboji are males with 2 vehicles (97, accounting for 43.7%) and females with 2 vehicles (63, making up 53.6%).
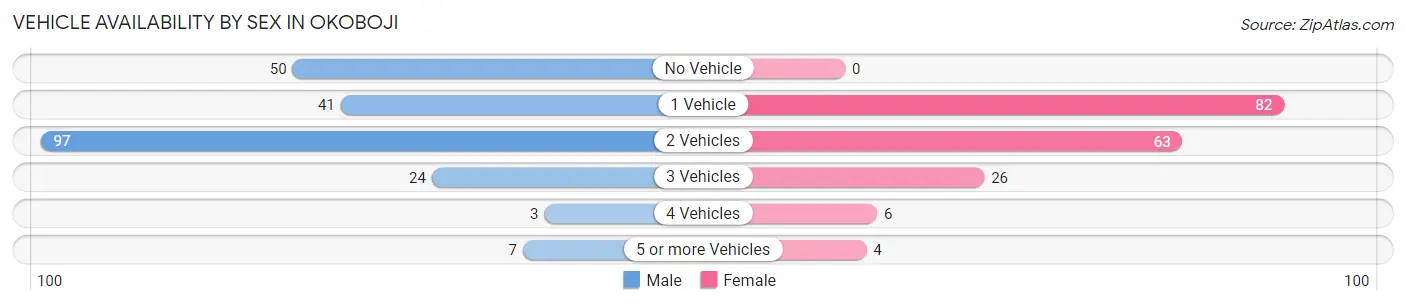
| Vehicles Available | Male | Female |
| No Vehicle | 50 (22.5%) | 0 (0.0%) |
| 1 Vehicle | 41 (18.5%) | 82 (45.3%) |
| 2 Vehicles | 97 (43.7%) | 63 (34.8%) |
| 3 Vehicles | 24 (10.8%) | 26 (14.4%) |
| 4 Vehicles | 3 (1.3%) | 6 (3.3%) |
| 5 or more Vehicles | 7 (3.2%) | 4 (2.2%) |
| Total | 222 (100.0%) | 181 (100.0%) |
Commute Time in Okoboji
The most frequently occuring commute durations in Okoboji are 10 to 14 minutes (136 commuters, 36.2%), 5 to 9 minutes (109 commuters, 29.0%), and 15 to 19 minutes (45 commuters, 12.0%).
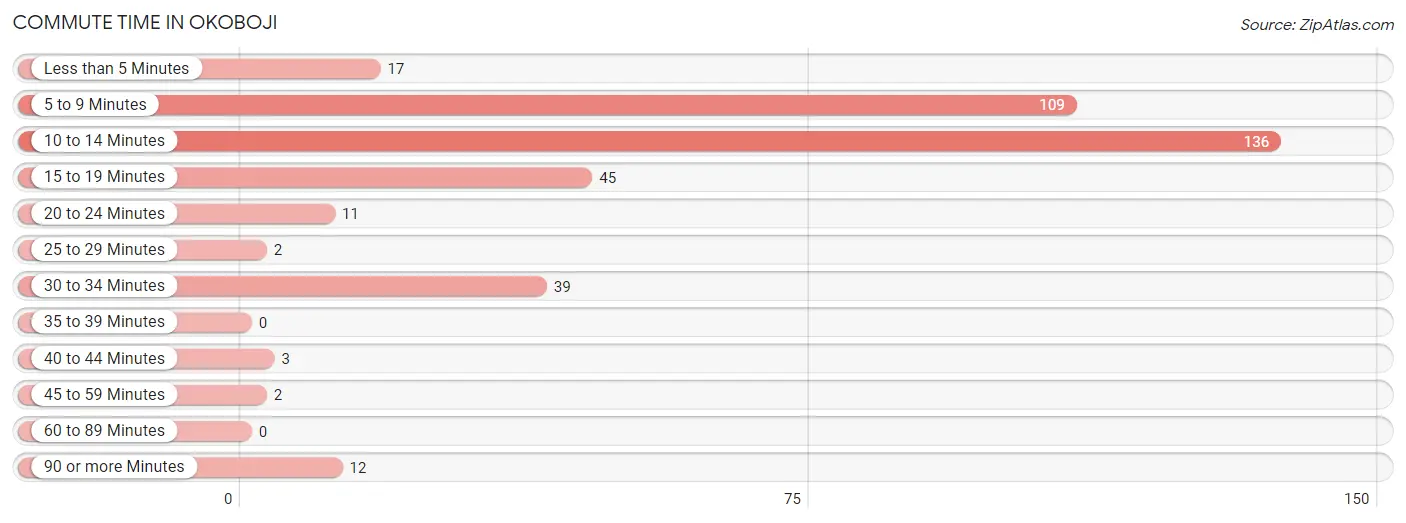
| Commute Time | # Commuters | % Commuters |
| Less than 5 Minutes | 17 | 4.5% |
| 5 to 9 Minutes | 109 | 29.0% |
| 10 to 14 Minutes | 136 | 36.2% |
| 15 to 19 Minutes | 45 | 12.0% |
| 20 to 24 Minutes | 11 | 2.9% |
| 25 to 29 Minutes | 2 | 0.5% |
| 30 to 34 Minutes | 39 | 10.4% |
| 35 to 39 Minutes | 0 | 0.0% |
| 40 to 44 Minutes | 3 | 0.8% |
| 45 to 59 Minutes | 2 | 0.5% |
| 60 to 89 Minutes | 0 | 0.0% |
| 90 or more Minutes | 12 | 3.2% |
Commute Time by Sex in Okoboji
The most common commute times in Okoboji are 10 to 14 minutes (83 commuters, 39.0%) for males and 10 to 14 minutes (53 commuters, 32.5%) for females.
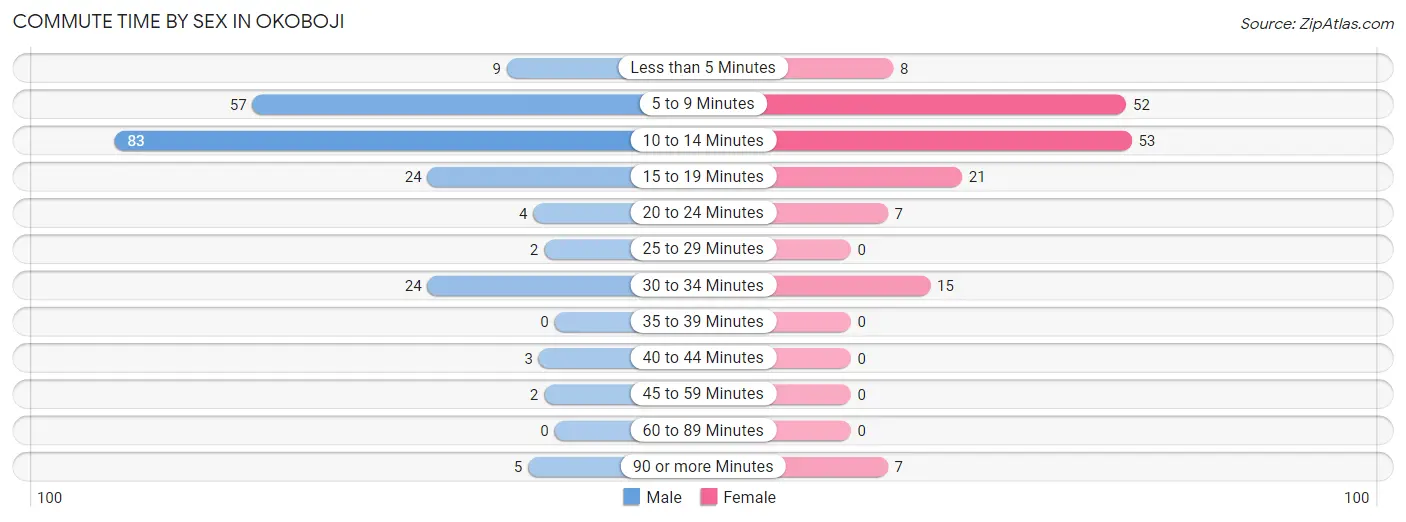
| Commute Time | Male | Female |
| Less than 5 Minutes | 9 (4.2%) | 8 (4.9%) |
| 5 to 9 Minutes | 57 (26.8%) | 52 (31.9%) |
| 10 to 14 Minutes | 83 (39.0%) | 53 (32.5%) |
| 15 to 19 Minutes | 24 (11.3%) | 21 (12.9%) |
| 20 to 24 Minutes | 4 (1.9%) | 7 (4.3%) |
| 25 to 29 Minutes | 2 (0.9%) | 0 (0.0%) |
| 30 to 34 Minutes | 24 (11.3%) | 15 (9.2%) |
| 35 to 39 Minutes | 0 (0.0%) | 0 (0.0%) |
| 40 to 44 Minutes | 3 (1.4%) | 0 (0.0%) |
| 45 to 59 Minutes | 2 (0.9%) | 0 (0.0%) |
| 60 to 89 Minutes | 0 (0.0%) | 0 (0.0%) |
| 90 or more Minutes | 5 (2.4%) | 7 (4.3%) |
Time of Departure to Work by Sex in Okoboji
The most frequent times of departure to work in Okoboji are 7:30 AM to 7:59 AM (63, 29.6%) for males and 8:00 AM to 8:29 AM (24, 14.7%) for females.
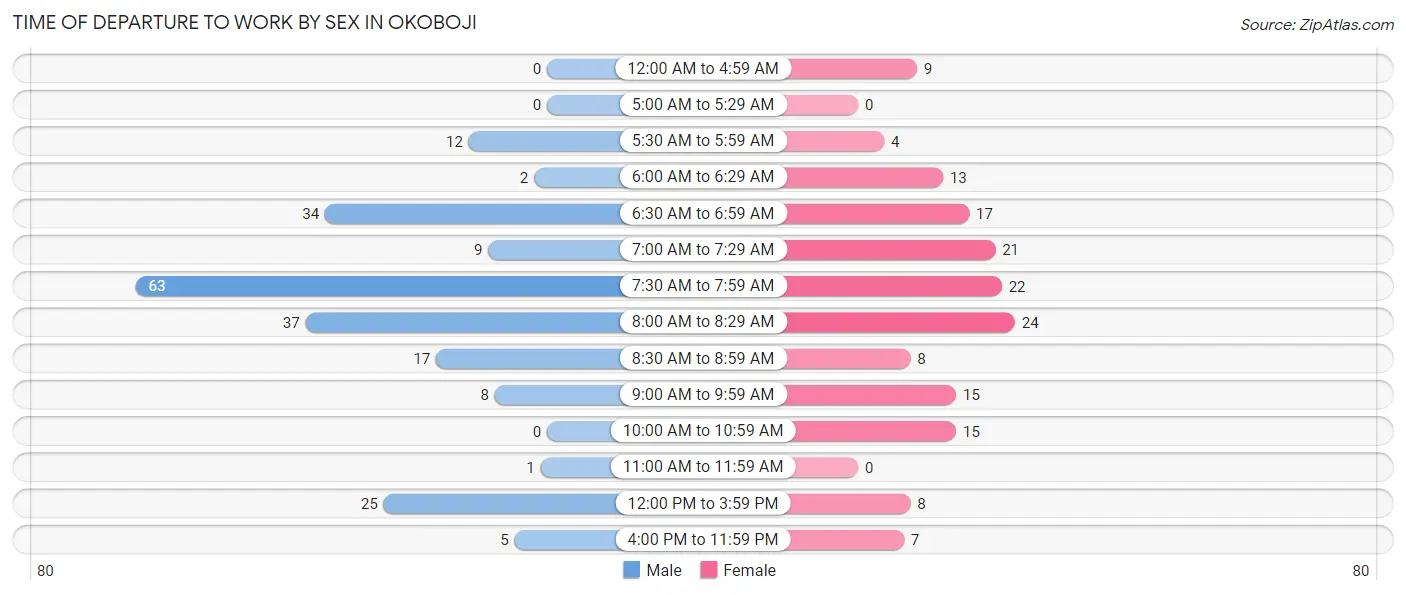
| Time of Departure | Male | Female |
| 12:00 AM to 4:59 AM | 0 (0.0%) | 9 (5.5%) |
| 5:00 AM to 5:29 AM | 0 (0.0%) | 0 (0.0%) |
| 5:30 AM to 5:59 AM | 12 (5.6%) | 4 (2.5%) |
| 6:00 AM to 6:29 AM | 2 (0.9%) | 13 (8.0%) |
| 6:30 AM to 6:59 AM | 34 (16.0%) | 17 (10.4%) |
| 7:00 AM to 7:29 AM | 9 (4.2%) | 21 (12.9%) |
| 7:30 AM to 7:59 AM | 63 (29.6%) | 22 (13.5%) |
| 8:00 AM to 8:29 AM | 37 (17.4%) | 24 (14.7%) |
| 8:30 AM to 8:59 AM | 17 (8.0%) | 8 (4.9%) |
| 9:00 AM to 9:59 AM | 8 (3.8%) | 15 (9.2%) |
| 10:00 AM to 10:59 AM | 0 (0.0%) | 15 (9.2%) |
| 11:00 AM to 11:59 AM | 1 (0.5%) | 0 (0.0%) |
| 12:00 PM to 3:59 PM | 25 (11.7%) | 8 (4.9%) |
| 4:00 PM to 11:59 PM | 5 (2.4%) | 7 (4.3%) |
| Total | 213 (100.0%) | 163 (100.0%) |
Housing Occupancy in Okoboji
Occupancy by Ownership in Okoboji
Of the total 427 dwellings in Okoboji, owner-occupied units account for 299 (70.0%), while renter-occupied units make up 128 (30.0%).
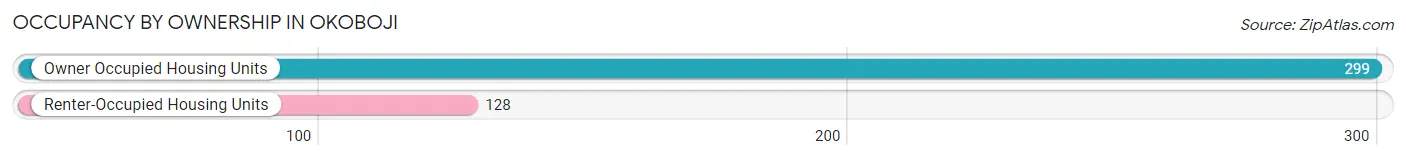
| Occupancy | # Housing Units | % Housing Units |
| Owner Occupied Housing Units | 299 | 70.0% |
| Renter-Occupied Housing Units | 128 | 30.0% |
| Total Occupied Housing Units | 427 | 100.0% |
Occupancy by Household Size in Okoboji
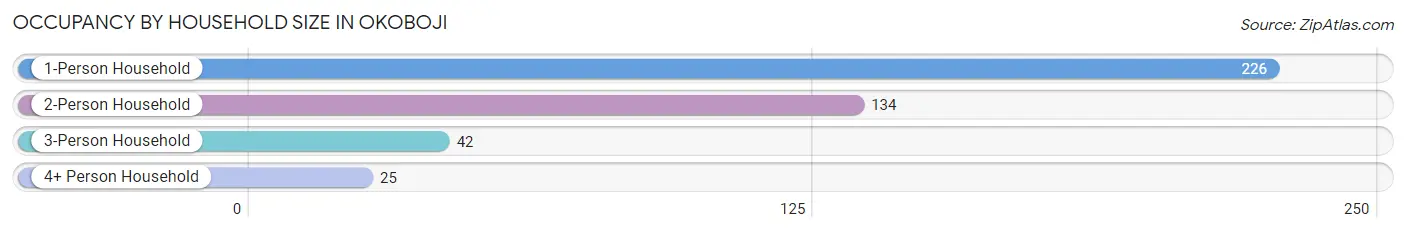
| Household Size | # Housing Units | % Housing Units |
| 1-Person Household | 226 | 52.9% |
| 2-Person Household | 134 | 31.4% |
| 3-Person Household | 42 | 9.8% |
| 4+ Person Household | 25 | 5.9% |
| Total Housing Units | 427 | 100.0% |
Occupancy by Ownership by Household Size in Okoboji
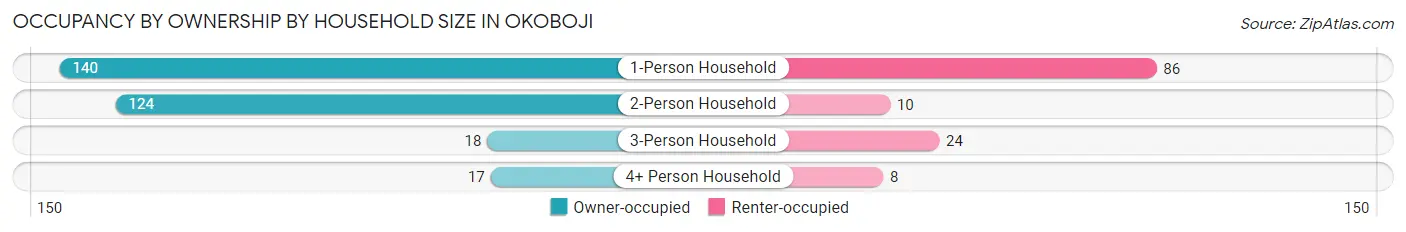
| Household Size | Owner-occupied | Renter-occupied |
| 1-Person Household | 140 (62.0%) | 86 (38.1%) |
| 2-Person Household | 124 (92.5%) | 10 (7.5%) |
| 3-Person Household | 18 (42.9%) | 24 (57.1%) |
| 4+ Person Household | 17 (68.0%) | 8 (32.0%) |
| Total Housing Units | 299 (70.0%) | 128 (30.0%) |
Occupancy by Educational Attainment in Okoboji
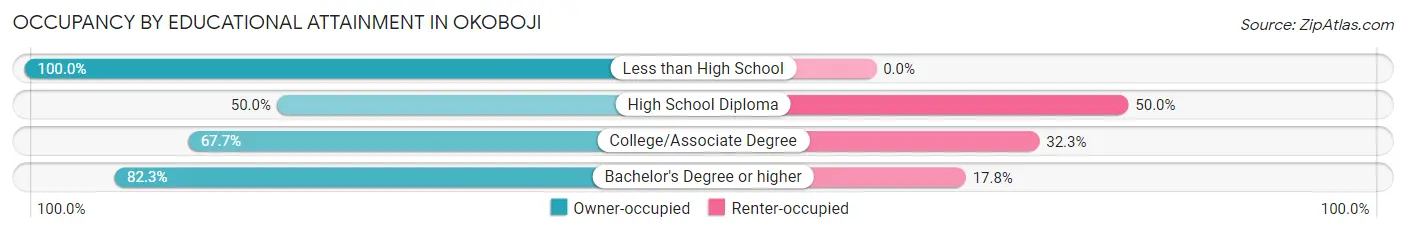
| Household Size | Owner-occupied | Renter-occupied |
| Less than High School | 3 (100.0%) | 0 (0.0%) |
| High School Diploma | 44 (50.0%) | 44 (50.0%) |
| College/Associate Degree | 113 (67.7%) | 54 (32.3%) |
| Bachelor's Degree or higher | 139 (82.3%) | 30 (17.7%) |
Occupancy by Age of Householder in Okoboji
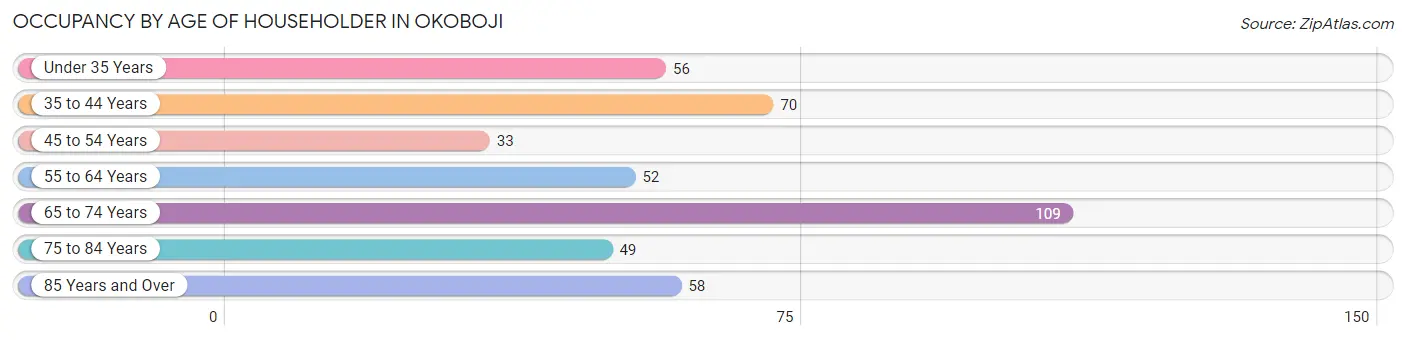
| Age Bracket | # Households | % Households |
| Under 35 Years | 56 | 13.1% |
| 35 to 44 Years | 70 | 16.4% |
| 45 to 54 Years | 33 | 7.7% |
| 55 to 64 Years | 52 | 12.2% |
| 65 to 74 Years | 109 | 25.5% |
| 75 to 84 Years | 49 | 11.5% |
| 85 Years and Over | 58 | 13.6% |
| Total | 427 | 100.0% |
Housing Finances in Okoboji
Median Income by Occupancy in Okoboji
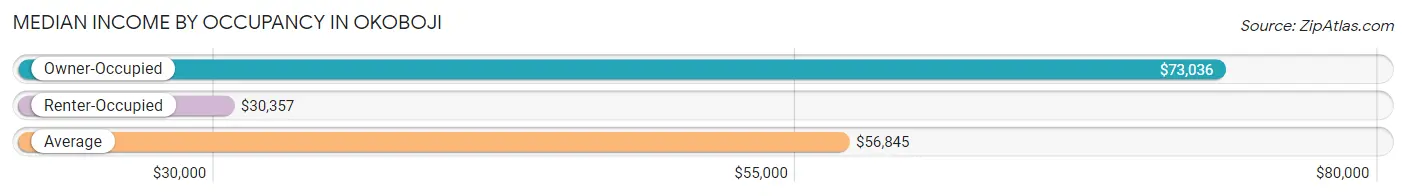
| Occupancy Type | # Households | Median Income |
| Owner-Occupied | 299 (70.0%) | $73,036 |
| Renter-Occupied | 128 (30.0%) | $30,357 |
| Average | 427 (100.0%) | $56,845 |
Occupancy by Householder Income Bracket in Okoboji
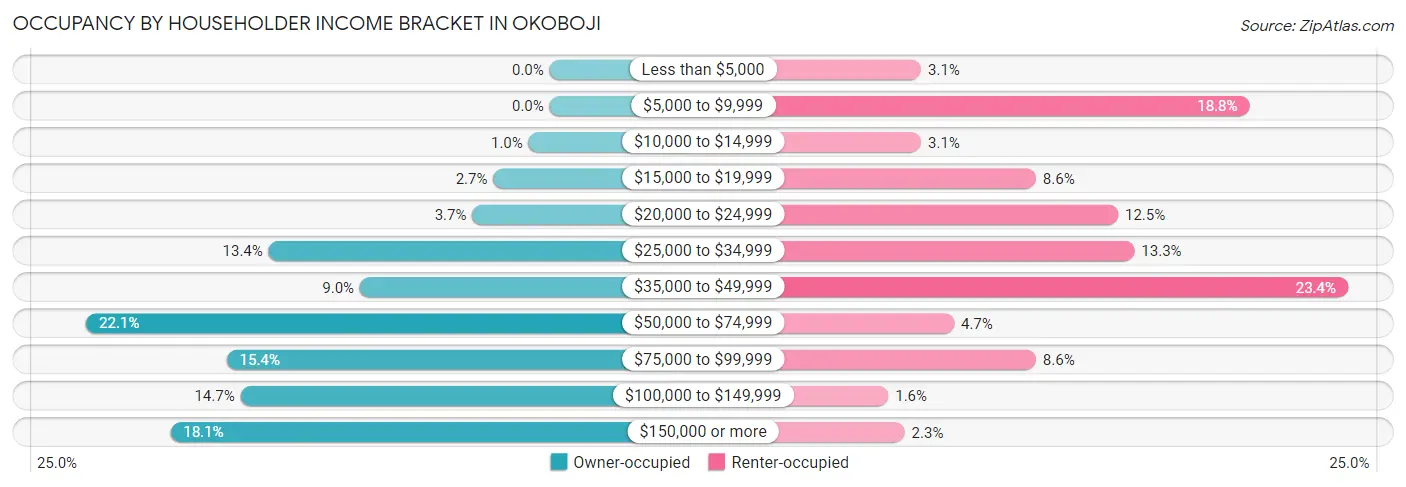
| Income Bracket | Owner-occupied | Renter-occupied |
| Less than $5,000 | 0 (0.0%) | 4 (3.1%) |
| $5,000 to $9,999 | 0 (0.0%) | 24 (18.8%) |
| $10,000 to $14,999 | 3 (1.0%) | 4 (3.1%) |
| $15,000 to $19,999 | 8 (2.7%) | 11 (8.6%) |
| $20,000 to $24,999 | 11 (3.7%) | 16 (12.5%) |
| $25,000 to $34,999 | 40 (13.4%) | 17 (13.3%) |
| $35,000 to $49,999 | 27 (9.0%) | 30 (23.4%) |
| $50,000 to $74,999 | 66 (22.1%) | 6 (4.7%) |
| $75,000 to $99,999 | 46 (15.4%) | 11 (8.6%) |
| $100,000 to $149,999 | 44 (14.7%) | 2 (1.6%) |
| $150,000 or more | 54 (18.1%) | 3 (2.3%) |
| Total | 299 (100.0%) | 128 (100.0%) |
Monthly Housing Cost Tiers in Okoboji
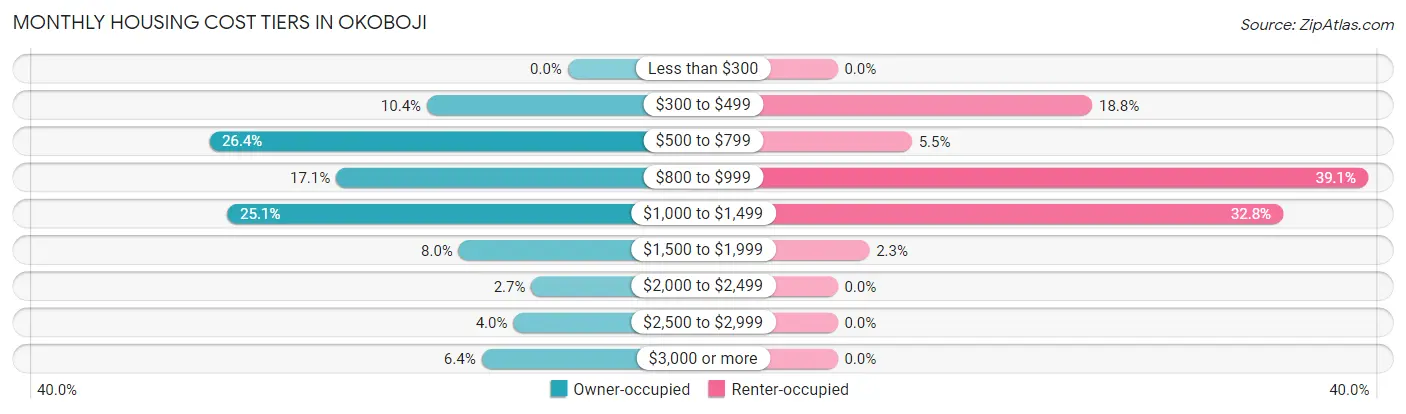
| Monthly Cost | Owner-occupied | Renter-occupied |
| Less than $300 | 0 (0.0%) | 0 (0.0%) |
| $300 to $499 | 31 (10.4%) | 24 (18.8%) |
| $500 to $799 | 79 (26.4%) | 7 (5.5%) |
| $800 to $999 | 51 (17.1%) | 50 (39.1%) |
| $1,000 to $1,499 | 75 (25.1%) | 42 (32.8%) |
| $1,500 to $1,999 | 24 (8.0%) | 3 (2.3%) |
| $2,000 to $2,499 | 8 (2.7%) | 0 (0.0%) |
| $2,500 to $2,999 | 12 (4.0%) | 0 (0.0%) |
| $3,000 or more | 19 (6.4%) | 0 (0.0%) |
| Total | 299 (100.0%) | 128 (100.0%) |
Physical Housing Characteristics in Okoboji
Housing Structures in Okoboji
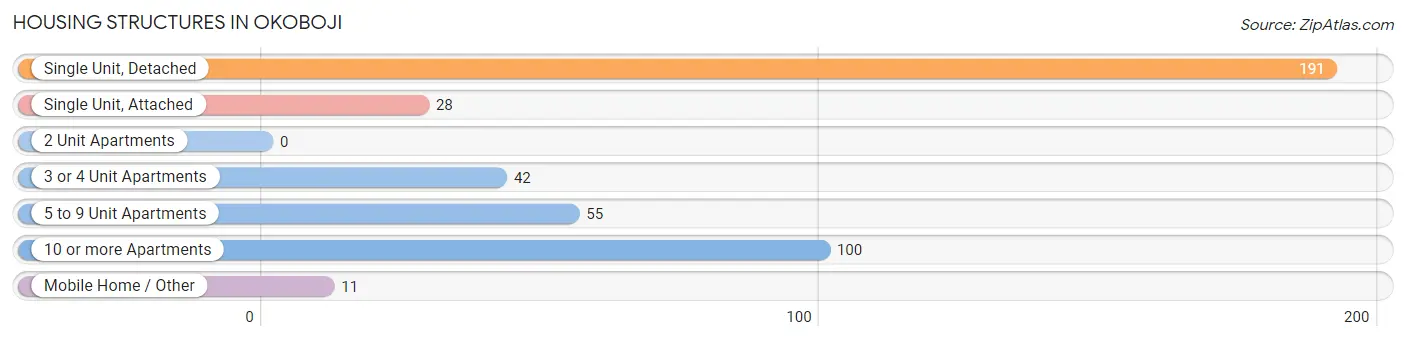
| Structure Type | # Housing Units | % Housing Units |
| Single Unit, Detached | 191 | 44.7% |
| Single Unit, Attached | 28 | 6.6% |
| 2 Unit Apartments | 0 | 0.0% |
| 3 or 4 Unit Apartments | 42 | 9.8% |
| 5 to 9 Unit Apartments | 55 | 12.9% |
| 10 or more Apartments | 100 | 23.4% |
| Mobile Home / Other | 11 | 2.6% |
| Total | 427 | 100.0% |
Housing Structures by Occupancy in Okoboji
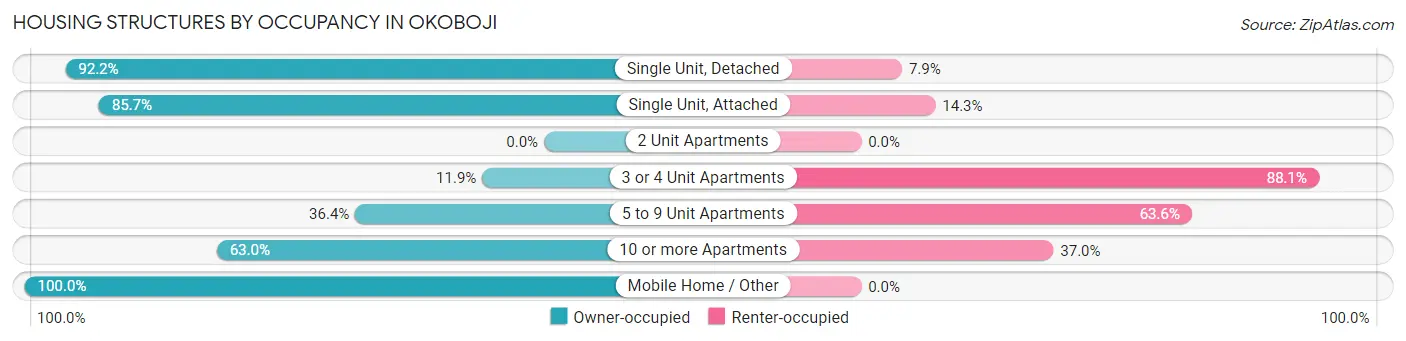
| Structure Type | Owner-occupied | Renter-occupied |
| Single Unit, Detached | 176 (92.1%) | 15 (7.9%) |
| Single Unit, Attached | 24 (85.7%) | 4 (14.3%) |
| 2 Unit Apartments | 0 (0.0%) | 0 (0.0%) |
| 3 or 4 Unit Apartments | 5 (11.9%) | 37 (88.1%) |
| 5 to 9 Unit Apartments | 20 (36.4%) | 35 (63.6%) |
| 10 or more Apartments | 63 (63.0%) | 37 (37.0%) |
| Mobile Home / Other | 11 (100.0%) | 0 (0.0%) |
| Total | 299 (70.0%) | 128 (30.0%) |
Housing Structures by Number of Rooms in Okoboji
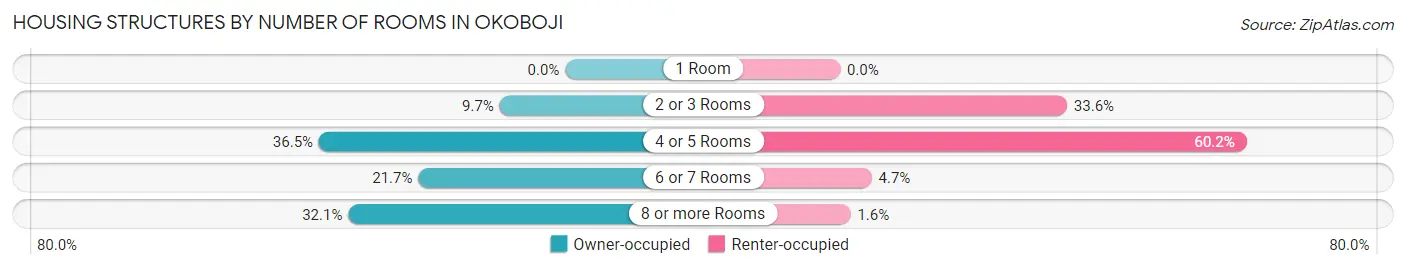
| Number of Rooms | Owner-occupied | Renter-occupied |
| 1 Room | 0 (0.0%) | 0 (0.0%) |
| 2 or 3 Rooms | 29 (9.7%) | 43 (33.6%) |
| 4 or 5 Rooms | 109 (36.4%) | 77 (60.2%) |
| 6 or 7 Rooms | 65 (21.7%) | 6 (4.7%) |
| 8 or more Rooms | 96 (32.1%) | 2 (1.6%) |
| Total | 299 (100.0%) | 128 (100.0%) |
Housing Structure by Heating Type in Okoboji
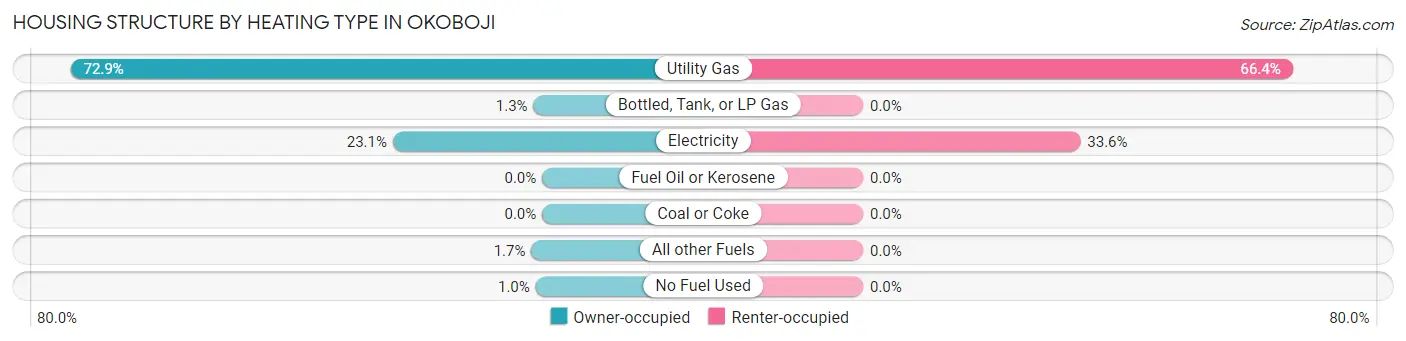
| Heating Type | Owner-occupied | Renter-occupied |
| Utility Gas | 218 (72.9%) | 85 (66.4%) |
| Bottled, Tank, or LP Gas | 4 (1.3%) | 0 (0.0%) |
| Electricity | 69 (23.1%) | 43 (33.6%) |
| Fuel Oil or Kerosene | 0 (0.0%) | 0 (0.0%) |
| Coal or Coke | 0 (0.0%) | 0 (0.0%) |
| All other Fuels | 5 (1.7%) | 0 (0.0%) |
| No Fuel Used | 3 (1.0%) | 0 (0.0%) |
| Total | 299 (100.0%) | 128 (100.0%) |
Household Vehicle Usage in Okoboji
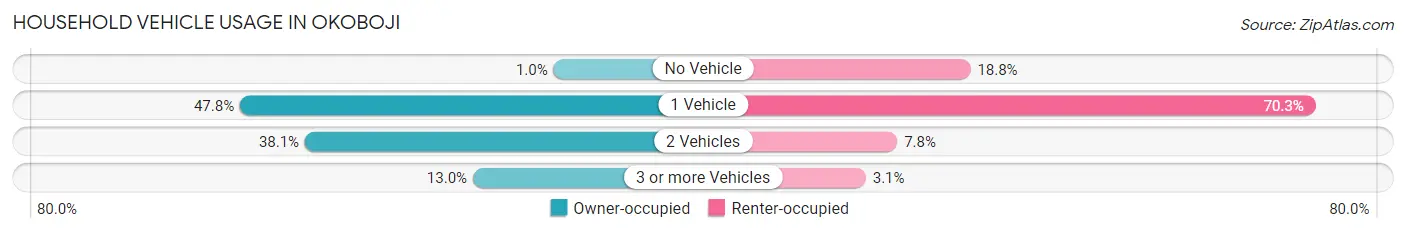
| Vehicles per Household | Owner-occupied | Renter-occupied |
| No Vehicle | 3 (1.0%) | 24 (18.8%) |
| 1 Vehicle | 143 (47.8%) | 90 (70.3%) |
| 2 Vehicles | 114 (38.1%) | 10 (7.8%) |
| 3 or more Vehicles | 39 (13.0%) | 4 (3.1%) |
| Total | 299 (100.0%) | 128 (100.0%) |
Real Estate & Mortgages in Okoboji
Real Estate and Mortgage Overview in Okoboji
| Characteristic | Without Mortgage | With Mortgage |
| Housing Units | 170 | 129 |
| Median Property Value | $430,800 | $210,200 |
| Median Household Income | $62,500 | $35 |
| Monthly Housing Costs | $750 | $19 |
| Real Estate Taxes | $2,913 | $4 |
Property Value by Mortgage Status in Okoboji
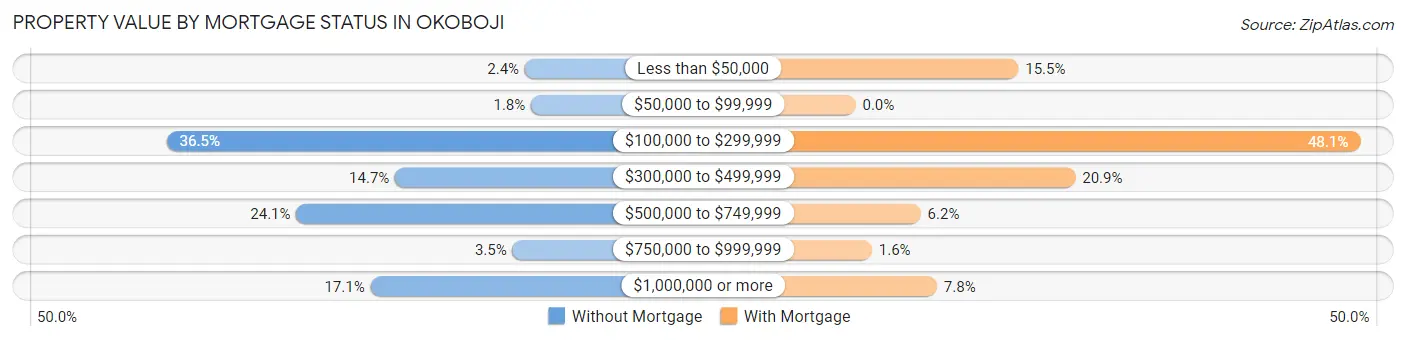
| Property Value | Without Mortgage | With Mortgage |
| Less than $50,000 | 4 (2.4%) | 20 (15.5%) |
| $50,000 to $99,999 | 3 (1.8%) | 0 (0.0%) |
| $100,000 to $299,999 | 62 (36.5%) | 62 (48.1%) |
| $300,000 to $499,999 | 25 (14.7%) | 27 (20.9%) |
| $500,000 to $749,999 | 41 (24.1%) | 8 (6.2%) |
| $750,000 to $999,999 | 6 (3.5%) | 2 (1.5%) |
| $1,000,000 or more | 29 (17.1%) | 10 (7.7%) |
| Total | 170 (100.0%) | 129 (100.0%) |
Household Income by Mortgage Status in Okoboji
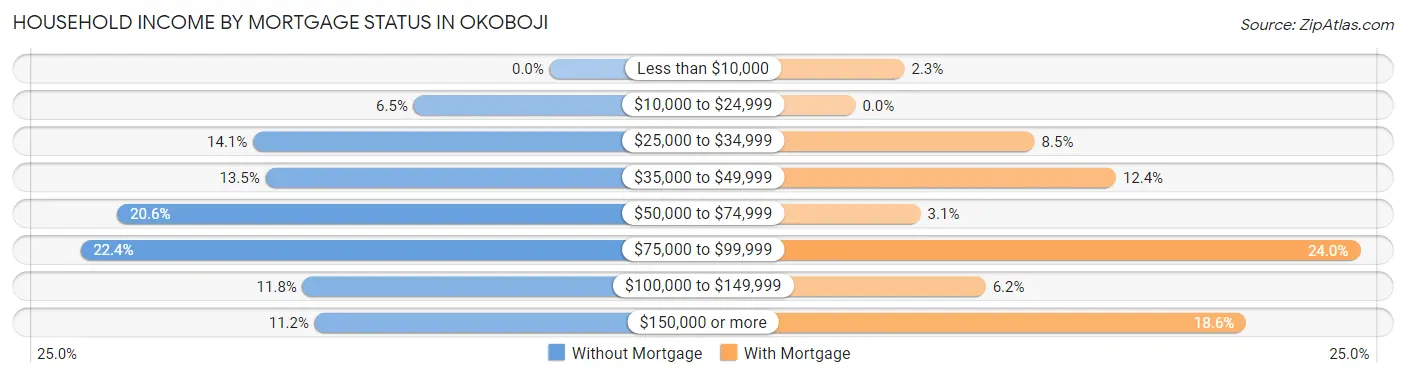
| Household Income | Without Mortgage | With Mortgage |
| Less than $10,000 | 0 (0.0%) | 3 (2.3%) |
| $10,000 to $24,999 | 11 (6.5%) | 0 (0.0%) |
| $25,000 to $34,999 | 24 (14.1%) | 11 (8.5%) |
| $35,000 to $49,999 | 23 (13.5%) | 16 (12.4%) |
| $50,000 to $74,999 | 35 (20.6%) | 4 (3.1%) |
| $75,000 to $99,999 | 38 (22.4%) | 31 (24.0%) |
| $100,000 to $149,999 | 20 (11.8%) | 8 (6.2%) |
| $150,000 or more | 19 (11.2%) | 24 (18.6%) |
| Total | 170 (100.0%) | 129 (100.0%) |
Property Value to Household Income Ratio in Okoboji
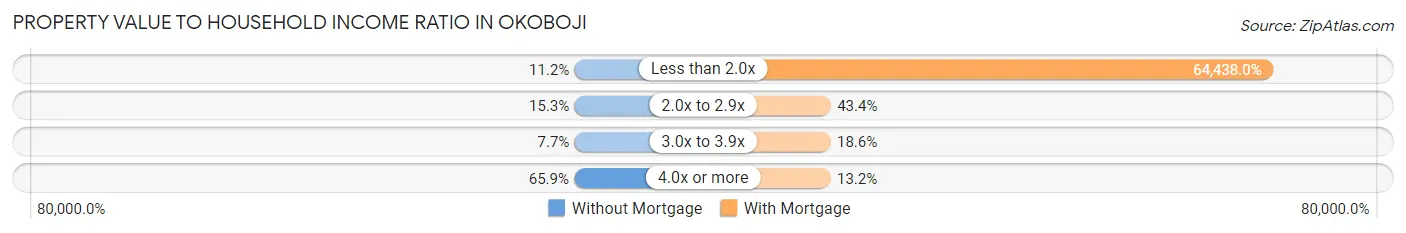
| Value-to-Income Ratio | Without Mortgage | With Mortgage |
| Less than 2.0x | 19 (11.2%) | 83,125 (64,438.0%) |
| 2.0x to 2.9x | 26 (15.3%) | 56 (43.4%) |
| 3.0x to 3.9x | 13 (7.6%) | 24 (18.6%) |
| 4.0x or more | 112 (65.9%) | 17 (13.2%) |
| Total | 170 (100.0%) | 129 (100.0%) |
Real Estate Taxes by Mortgage Status in Okoboji
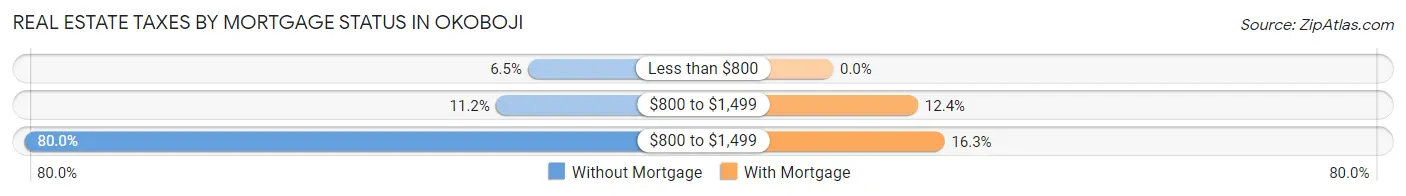
| Property Taxes | Without Mortgage | With Mortgage |
| Less than $800 | 11 (6.5%) | 0 (0.0%) |
| $800 to $1,499 | 19 (11.2%) | 16 (12.4%) |
| $800 to $1,499 | 136 (80.0%) | 21 (16.3%) |
| Total | 170 (100.0%) | 129 (100.0%) |
Health & Disability in Okoboji
Health Insurance Coverage by Age in Okoboji
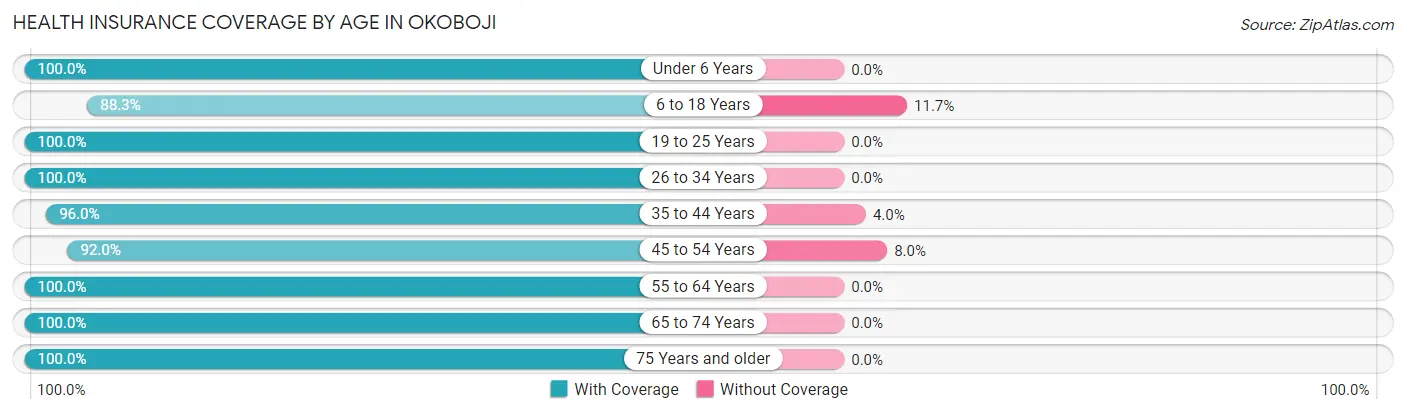
| Age Bracket | With Coverage | Without Coverage |
| Under 6 Years | 26 (100.0%) | 0 (0.0%) |
| 6 to 18 Years | 98 (88.3%) | 13 (11.7%) |
| 19 to 25 Years | 37 (100.0%) | 0 (0.0%) |
| 26 to 34 Years | 62 (100.0%) | 0 (0.0%) |
| 35 to 44 Years | 95 (96.0%) | 4 (4.0%) |
| 45 to 54 Years | 46 (92.0%) | 4 (8.0%) |
| 55 to 64 Years | 104 (100.0%) | 0 (0.0%) |
| 65 to 74 Years | 169 (100.0%) | 0 (0.0%) |
| 75 Years and older | 126 (100.0%) | 0 (0.0%) |
| Total | 763 (97.3%) | 21 (2.7%) |
Health Insurance Coverage by Citizenship Status in Okoboji
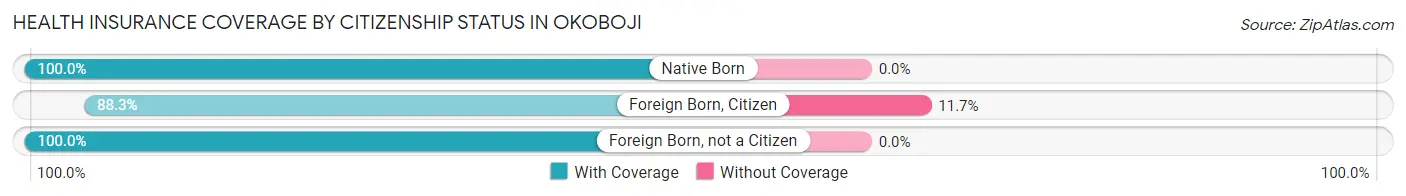
| Citizenship Status | With Coverage | Without Coverage |
| Native Born | 26 (100.0%) | 0 (0.0%) |
| Foreign Born, Citizen | 98 (88.3%) | 13 (11.7%) |
| Foreign Born, not a Citizen | 37 (100.0%) | 0 (0.0%) |
Health Insurance Coverage by Household Income in Okoboji
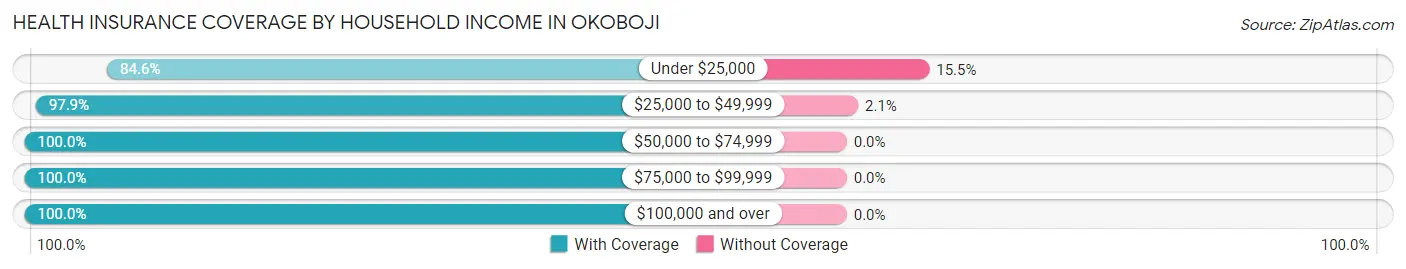
| Household Income | With Coverage | Without Coverage |
| Under $25,000 | 93 (84.6%) | 17 (15.4%) |
| $25,000 to $49,999 | 185 (97.9%) | 4 (2.1%) |
| $50,000 to $74,999 | 136 (100.0%) | 0 (0.0%) |
| $75,000 to $99,999 | 100 (100.0%) | 0 (0.0%) |
| $100,000 and over | 234 (100.0%) | 0 (0.0%) |
Public vs Private Health Insurance Coverage by Age in Okoboji
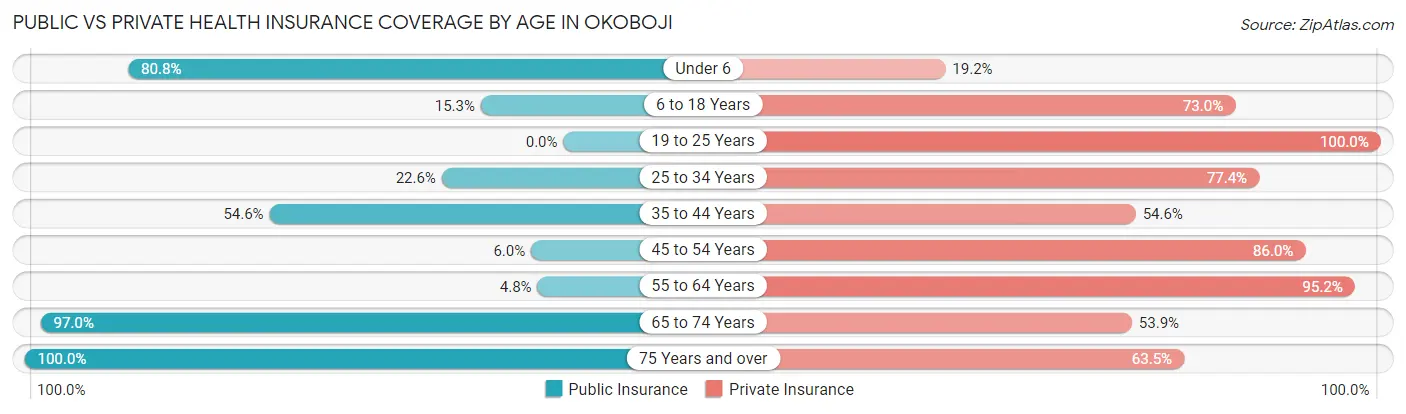
| Age Bracket | Public Insurance | Private Insurance |
| Under 6 | 21 (80.8%) | 5 (19.2%) |
| 6 to 18 Years | 17 (15.3%) | 81 (73.0%) |
| 19 to 25 Years | 0 (0.0%) | 37 (100.0%) |
| 25 to 34 Years | 14 (22.6%) | 48 (77.4%) |
| 35 to 44 Years | 54 (54.5%) | 54 (54.5%) |
| 45 to 54 Years | 3 (6.0%) | 43 (86.0%) |
| 55 to 64 Years | 5 (4.8%) | 99 (95.2%) |
| 65 to 74 Years | 164 (97.0%) | 91 (53.8%) |
| 75 Years and over | 126 (100.0%) | 80 (63.5%) |
| Total | 404 (51.5%) | 538 (68.6%) |
Disability Status by Sex by Age in Okoboji
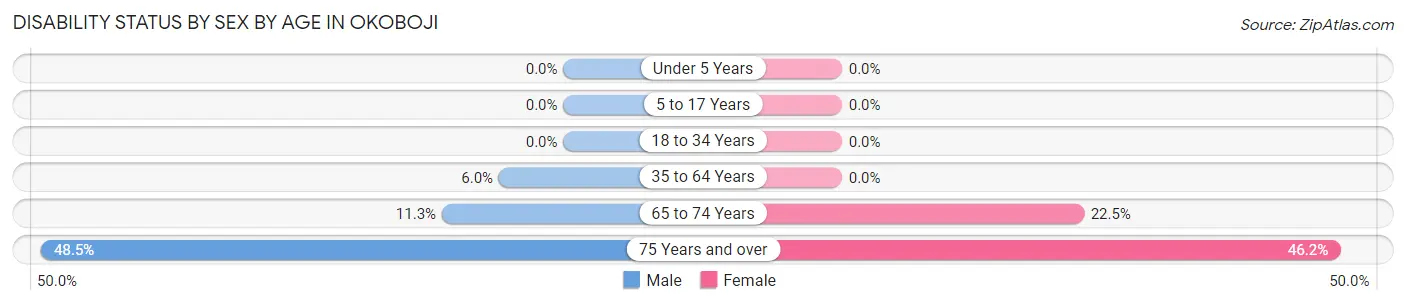
| Age Bracket | Male | Female |
| Under 5 Years | 0 (0.0%) | 0 (0.0%) |
| 5 to 17 Years | 0 (0.0%) | 0 (0.0%) |
| 18 to 34 Years | 0 (0.0%) | 0 (0.0%) |
| 35 to 64 Years | 7 (6.0%) | 0 (0.0%) |
| 65 to 74 Years | 8 (11.3%) | 22 (22.5%) |
| 75 Years and over | 16 (48.5%) | 43 (46.2%) |
Disability Class by Sex by Age in Okoboji
Disability Class: Hearing Difficulty
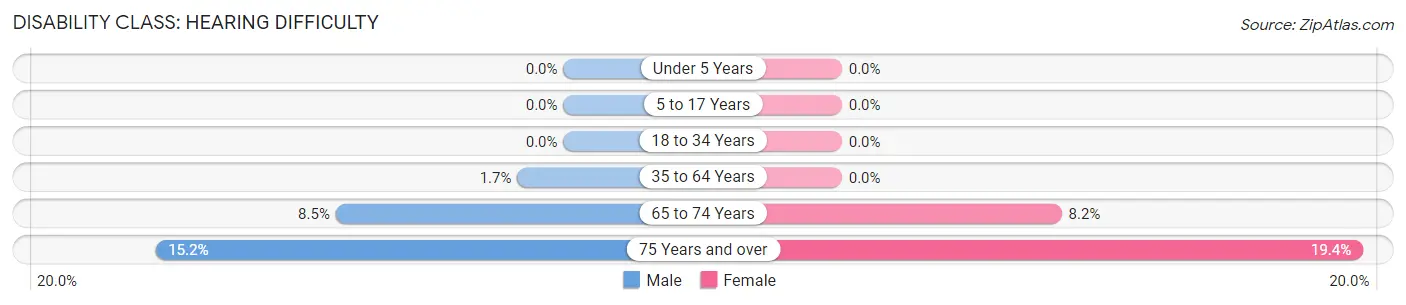
| Age Bracket | Male | Female |
| Under 5 Years | 0 (0.0%) | 0 (0.0%) |
| 5 to 17 Years | 0 (0.0%) | 0 (0.0%) |
| 18 to 34 Years | 0 (0.0%) | 0 (0.0%) |
| 35 to 64 Years | 2 (1.7%) | 0 (0.0%) |
| 65 to 74 Years | 6 (8.5%) | 8 (8.2%) |
| 75 Years and over | 5 (15.1%) | 18 (19.4%) |
Disability Class: Vision Difficulty
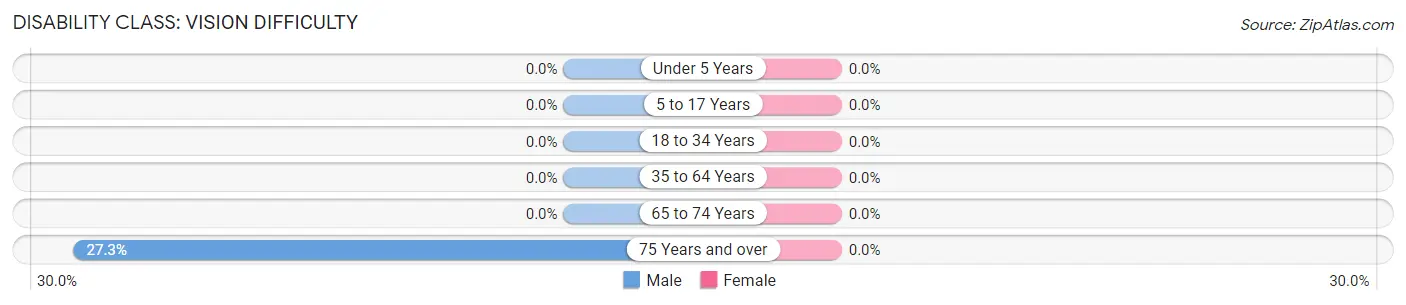
| Age Bracket | Male | Female |
| Under 5 Years | 0 (0.0%) | 0 (0.0%) |
| 5 to 17 Years | 0 (0.0%) | 0 (0.0%) |
| 18 to 34 Years | 0 (0.0%) | 0 (0.0%) |
| 35 to 64 Years | 0 (0.0%) | 0 (0.0%) |
| 65 to 74 Years | 0 (0.0%) | 0 (0.0%) |
| 75 Years and over | 9 (27.3%) | 0 (0.0%) |
Disability Class: Cognitive Difficulty
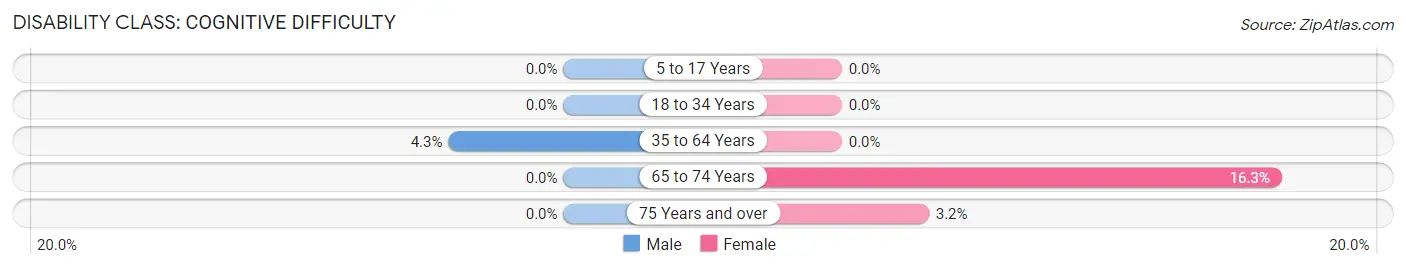
| Age Bracket | Male | Female |
| 5 to 17 Years | 0 (0.0%) | 0 (0.0%) |
| 18 to 34 Years | 0 (0.0%) | 0 (0.0%) |
| 35 to 64 Years | 5 (4.3%) | 0 (0.0%) |
| 65 to 74 Years | 0 (0.0%) | 16 (16.3%) |
| 75 Years and over | 0 (0.0%) | 3 (3.2%) |
Disability Class: Ambulatory Difficulty
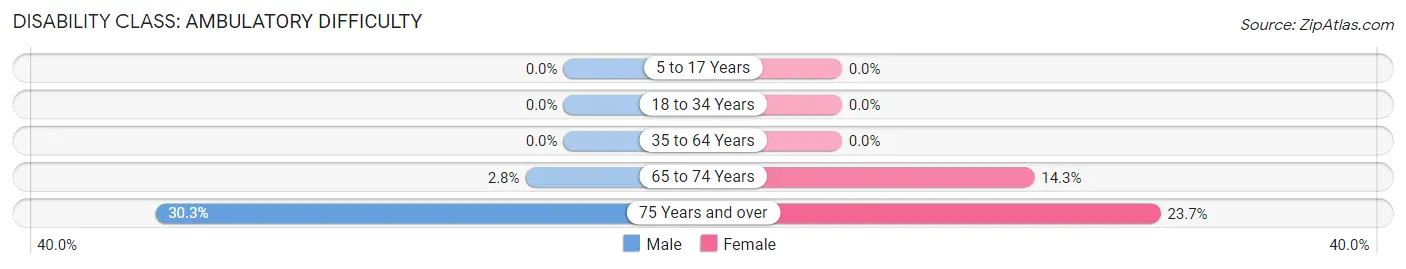
| Age Bracket | Male | Female |
| 5 to 17 Years | 0 (0.0%) | 0 (0.0%) |
| 18 to 34 Years | 0 (0.0%) | 0 (0.0%) |
| 35 to 64 Years | 0 (0.0%) | 0 (0.0%) |
| 65 to 74 Years | 2 (2.8%) | 14 (14.3%) |
| 75 Years and over | 10 (30.3%) | 22 (23.7%) |
Disability Class: Self-Care Difficulty
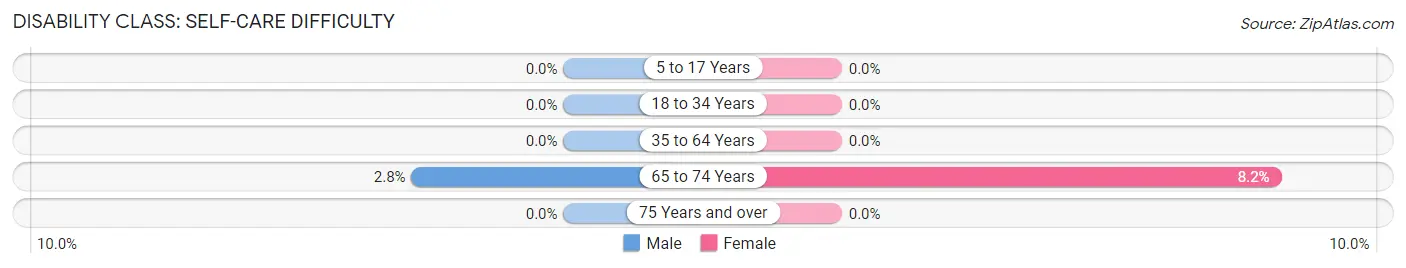
| Age Bracket | Male | Female |
| 5 to 17 Years | 0 (0.0%) | 0 (0.0%) |
| 18 to 34 Years | 0 (0.0%) | 0 (0.0%) |
| 35 to 64 Years | 0 (0.0%) | 0 (0.0%) |
| 65 to 74 Years | 2 (2.8%) | 8 (8.2%) |
| 75 Years and over | 0 (0.0%) | 0 (0.0%) |
Technology Access in Okoboji
Computing Device Access in Okoboji
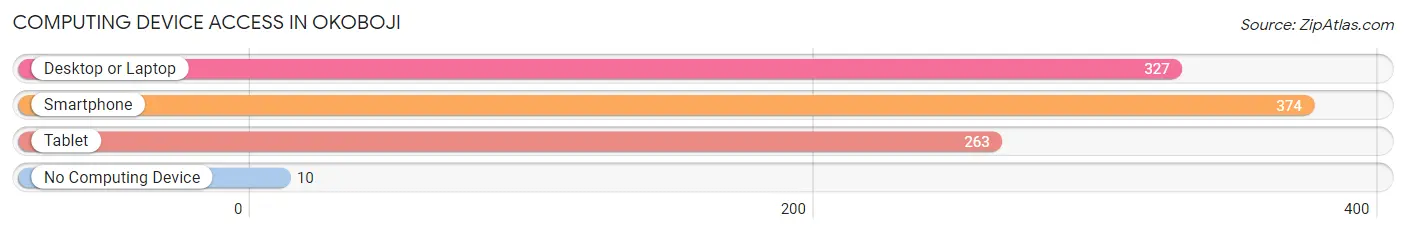
| Device Type | # Households | % Households |
| Desktop or Laptop | 327 | 76.6% |
| Smartphone | 374 | 87.6% |
| Tablet | 263 | 61.6% |
| No Computing Device | 10 | 2.3% |
| Total | 427 | 100.0% |
Internet Access in Okoboji
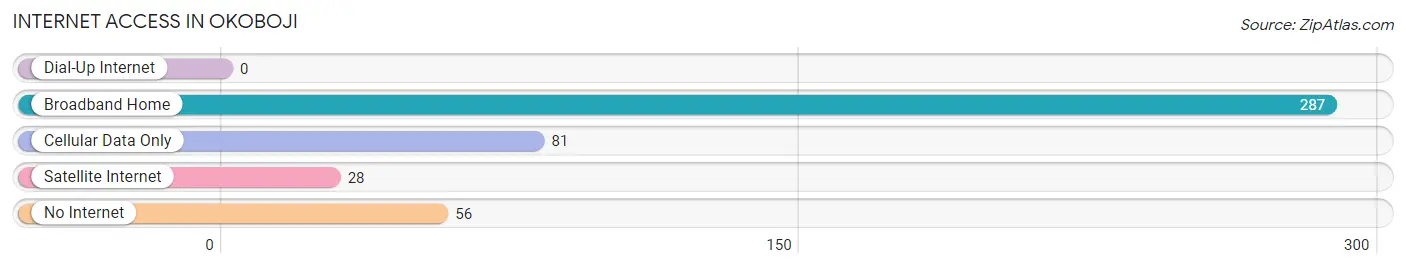
| Internet Type | # Households | % Households |
| Dial-Up Internet | 0 | 0.0% |
| Broadband Home | 287 | 67.2% |
| Cellular Data Only | 81 | 19.0% |
| Satellite Internet | 28 | 6.6% |
| No Internet | 56 | 13.1% |
| Total | 427 | 100.0% |
Okoboji Summary
Kobojii, Iowa is a small city located in Dickinson County in the northwest corner of the state. It is situated on the eastern shore of West Okoboji Lake, one of the five glacial lakes known as the Iowa Great Lakes. The city is known for its natural beauty, recreational activities, and vibrant downtown.
History
The area now known as Okoboji was first inhabited by the Sioux and Winnebago tribes. The first white settlers arrived in the area in the mid-1800s, and the town was officially founded in 1856. The town was named after the Sioux word for “resting place”.
In the late 1800s, the area became a popular tourist destination, and the first hotel was built in 1877. The town was incorporated in 1881, and the first school was built in 1883.
In the early 1900s, the town began to develop as a resort destination. The first golf course was built in 1910, and the first amusement park opened in 1912. The town also became a popular destination for fishing and boating.
In the 1950s, the town began to develop as a year-round destination. The first shopping center was built in 1956, and the first movie theater opened in 1958. The town also began to attract more visitors with its natural beauty and recreational activities.
Geography
Okoboji is located in Dickinson County in the northwest corner of Iowa. It is situated on the eastern shore of West Okoboji Lake, one of the five glacial lakes known as the Iowa Great Lakes. The city is surrounded by rolling hills and wooded areas.
The city has a total area of 4.2 square miles, of which 3.9 square miles is land and 0.3 square miles is water. The city is located at an elevation of 1,068 feet above sea level.
Economy
The economy of Okoboji is largely driven by tourism. The city is a popular destination for fishing, boating, swimming, and other recreational activities. The city also has a vibrant downtown area with shops, restaurants, and other businesses.
The city is also home to several manufacturing companies, including a boat manufacturer and a plastics manufacturer. The city also has a large agricultural sector, with corn, soybeans, and other crops being grown in the area.
Demographics
As of the 2010 census, the population of Okoboji was 2,945. The racial makeup of the city was 97.2% White, 0.7% African American, 0.3% Native American, 0.3% Asian, 0.1% Pacific Islander, 0.3% from other races, and 1.2% from two or more races. Hispanic or Latino of any race were 1.2% of the population.
The median household income in Okoboji was $45,938, and the median family income was $54,844. The per capita income was $25,945. About 8.2% of families and 10.3% of the population were below the poverty line, including 14.2% of those under age 18 and 5.2% of those age 65 or over.
Common Questions
What is Per Capita Income in Okoboji?
Per Capita income in Okoboji is $59,195.
What is the Median Family Income in Okoboji?
Median Family Income in Okoboji is $98,438.
What is the Median Household income in Okoboji?
Median Household Income in Okoboji is $56,845.
What is Income or Wage Gap in Okoboji?
Income or Wage Gap in Okoboji is 54.7%.
Women in Okoboji earn 45.3 cents for every dollar earned by a man.
What is Inequality or Gini Index in Okoboji?
Inequality or Gini Index in Okoboji is 0.57.
What is the Total Population of Okoboji?
Total Population of Okoboji is 784.
What is the Total Male Population of Okoboji?
Total Male Population of Okoboji is 357.
What is the Total Female Population of Okoboji?
Total Female Population of Okoboji is 427.
What is the Ratio of Males per 100 Females in Okoboji?
There are 83.61 Males per 100 Females in Okoboji.
What is the Ratio of Females per 100 Males in Okoboji?
There are 119.61 Females per 100 Males in Okoboji.
What is the Median Population Age in Okoboji?
Median Population Age in Okoboji is 57.0 Years.
What is the Average Family Size in Okoboji
Average Family Size in Okoboji is 2.6 People.
What is the Average Household Size in Okoboji
Average Household Size in Okoboji is 1.8 People.
How Large is the Labor Force in Okoboji?
There are 427 People in the Labor Forcein in Okoboji.
What is the Percentage of People in the Labor Force in Okoboji?
62.0% of People are in the Labor Force in Okoboji.
What is the Unemployment Rate in Okoboji?
Unemployment Rate in Okoboji is 2.1%.