Battle Creek, IA Map & Demographics
Battle Creek Map
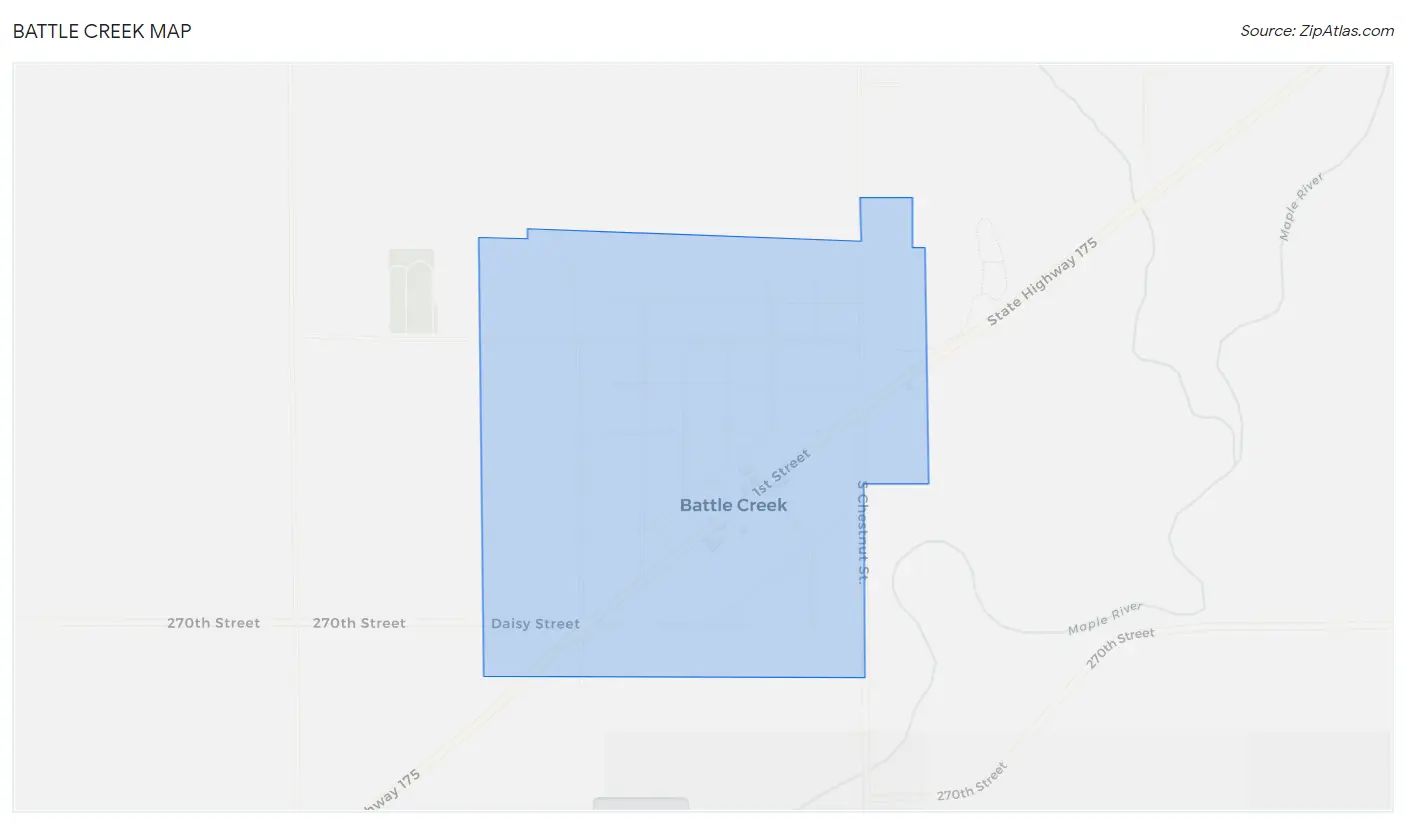
Battle Creek Overview
$30,530
PER CAPITA INCOME
$72,250
AVG FAMILY INCOME
$53,750
AVG HOUSEHOLD INCOME
32.0%
WAGE / INCOME GAP [ % ]
68.0¢/ $1
WAGE / INCOME GAP [ $ ]
0.40
INEQUALITY / GINI INDEX
830
TOTAL POPULATION
384
MALE POPULATION
446
FEMALE POPULATION
86.10
MALES / 100 FEMALES
116.15
FEMALES / 100 MALES
47.8
MEDIAN AGE
2.6
AVG FAMILY SIZE
2.1
AVG HOUSEHOLD SIZE
416
LABOR FORCE [ PEOPLE ]
62.4%
PERCENT IN LABOR FORCE
1.0%
UNEMPLOYMENT RATE
Battle Creek Zip Codes
Battle Creek Area Codes
Income in Battle Creek
Income Overview in Battle Creek
Per Capita Income in Battle Creek is $30,530, while median incomes of families and households are $72,250 and $53,750 respectively.
| Characteristic | Number | Measure |
| Per Capita Income | 830 | $30,530 |
| Median Family Income | 217 | $72,250 |
| Mean Family Income | 217 | $78,883 |
| Median Household Income | 379 | $53,750 |
| Mean Household Income | 379 | $66,205 |
| Income Deficit | 217 | $0 |
| Wage / Income Gap (%) | 830 | 32.02% |
| Wage / Income Gap ($) | 830 | 67.98¢ per $1 |
| Gini / Inequality Index | 830 | 0.40 |
Earnings by Sex in Battle Creek
Average Earnings in Battle Creek are $43,300, $46,492 for men and $31,607 for women, a difference of 32.0%.
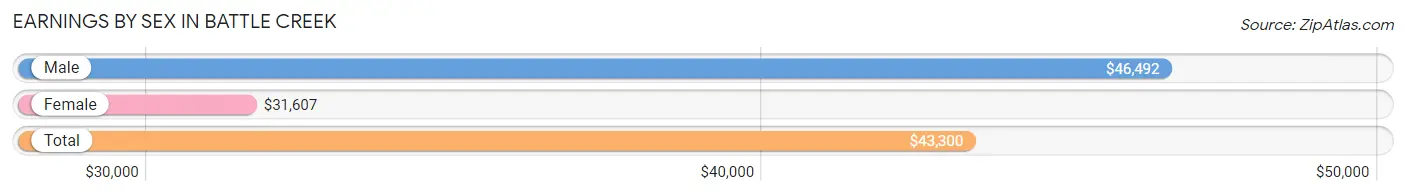
| Sex | Number | Average Earnings |
| Male | 209 (47.5%) | $46,492 |
| Female | 231 (52.5%) | $31,607 |
| Total | 440 (100.0%) | $43,300 |
Earnings by Sex by Income Bracket in Battle Creek
The most common earnings brackets in Battle Creek are $40,000 to $44,999 for men (39 | 18.7%) and $45,000 to $49,999 for women (40 | 17.3%).
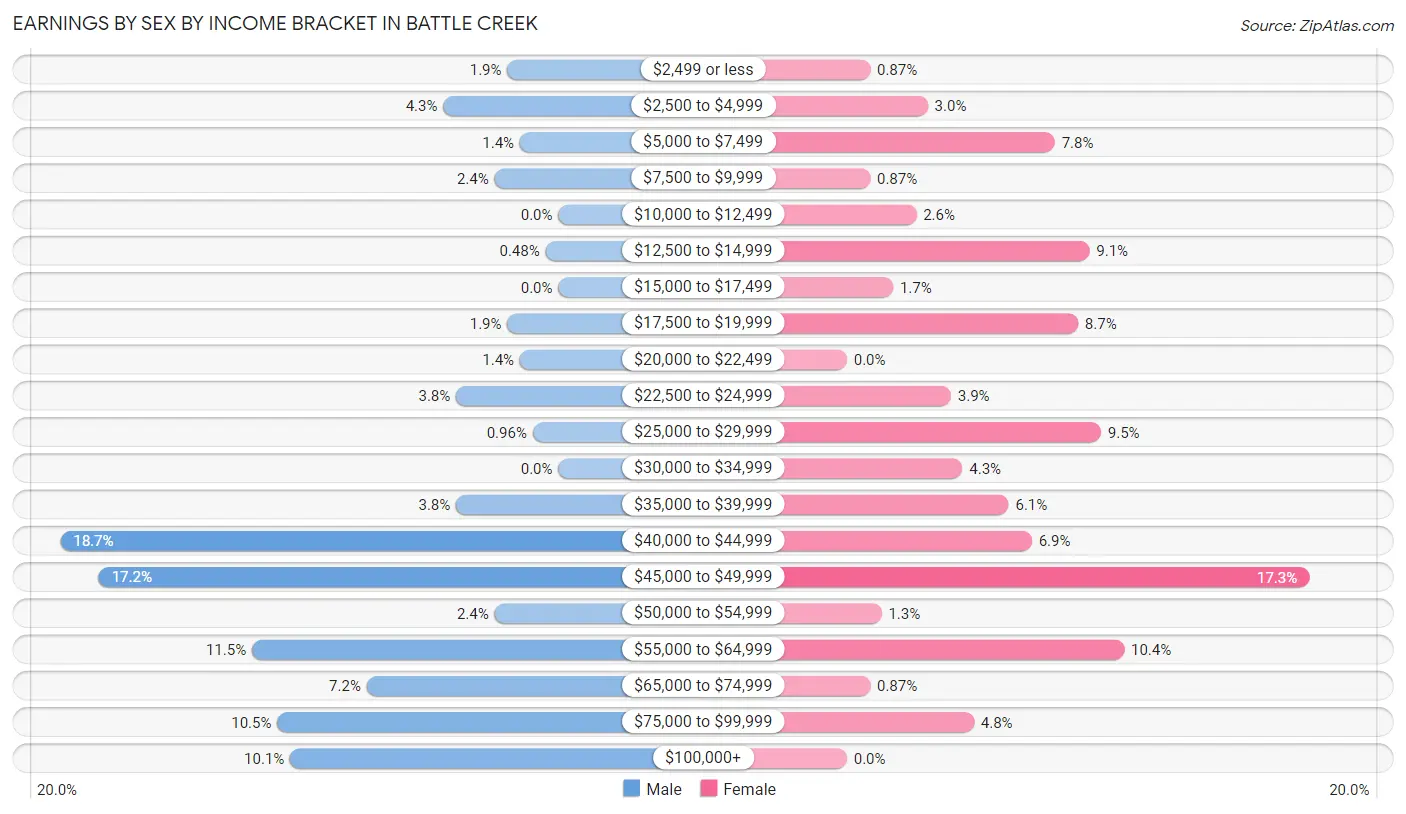
| Income | Male | Female |
| $2,499 or less | 4 (1.9%) | 2 (0.9%) |
| $2,500 to $4,999 | 9 (4.3%) | 7 (3.0%) |
| $5,000 to $7,499 | 3 (1.4%) | 18 (7.8%) |
| $7,500 to $9,999 | 5 (2.4%) | 2 (0.9%) |
| $10,000 to $12,499 | 0 (0.0%) | 6 (2.6%) |
| $12,500 to $14,999 | 1 (0.5%) | 21 (9.1%) |
| $15,000 to $17,499 | 0 (0.0%) | 4 (1.7%) |
| $17,500 to $19,999 | 4 (1.9%) | 20 (8.7%) |
| $20,000 to $22,499 | 3 (1.4%) | 0 (0.0%) |
| $22,500 to $24,999 | 8 (3.8%) | 9 (3.9%) |
| $25,000 to $29,999 | 2 (1.0%) | 22 (9.5%) |
| $30,000 to $34,999 | 0 (0.0%) | 10 (4.3%) |
| $35,000 to $39,999 | 8 (3.8%) | 14 (6.1%) |
| $40,000 to $44,999 | 39 (18.7%) | 16 (6.9%) |
| $45,000 to $49,999 | 36 (17.2%) | 40 (17.3%) |
| $50,000 to $54,999 | 5 (2.4%) | 3 (1.3%) |
| $55,000 to $64,999 | 24 (11.5%) | 24 (10.4%) |
| $65,000 to $74,999 | 15 (7.2%) | 2 (0.9%) |
| $75,000 to $99,999 | 22 (10.5%) | 11 (4.8%) |
| $100,000+ | 21 (10.1%) | 0 (0.0%) |
| Total | 209 (100.0%) | 231 (100.0%) |
Earnings by Sex by Educational Attainment in Battle Creek
Average earnings in Battle Creek are $47,339 for men and $37,500 for women, a difference of 20.8%. Men with an educational attainment of bachelor's degree enjoy the highest average annual earnings of $84,688, while those with college or associate's degree education earn the least with $46,613. Women with an educational attainment of bachelor's degree earn the most with the average annual earnings of $83,250, while those with high school diploma education have the smallest earnings of $23,194.
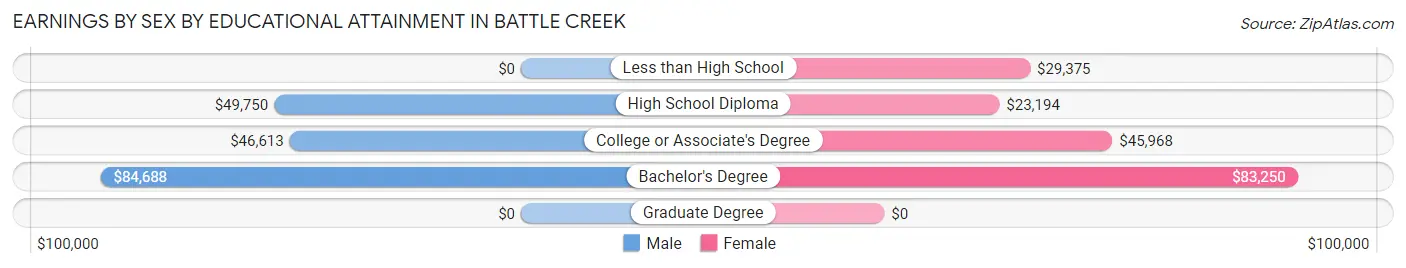
| Educational Attainment | Male Income | Female Income |
| Less than High School | - | - |
| High School Diploma | $49,750 | $23,194 |
| College or Associate's Degree | $46,613 | $45,968 |
| Bachelor's Degree | $84,688 | $83,250 |
| Graduate Degree | - | - |
| Total | $47,339 | $37,500 |
Family Income in Battle Creek
Family Income Brackets in Battle Creek
According to the Battle Creek family income data, there are 46 families falling into the $35,000 to $49,999 income range, which is the most common income bracket and makes up 21.2% of all families.
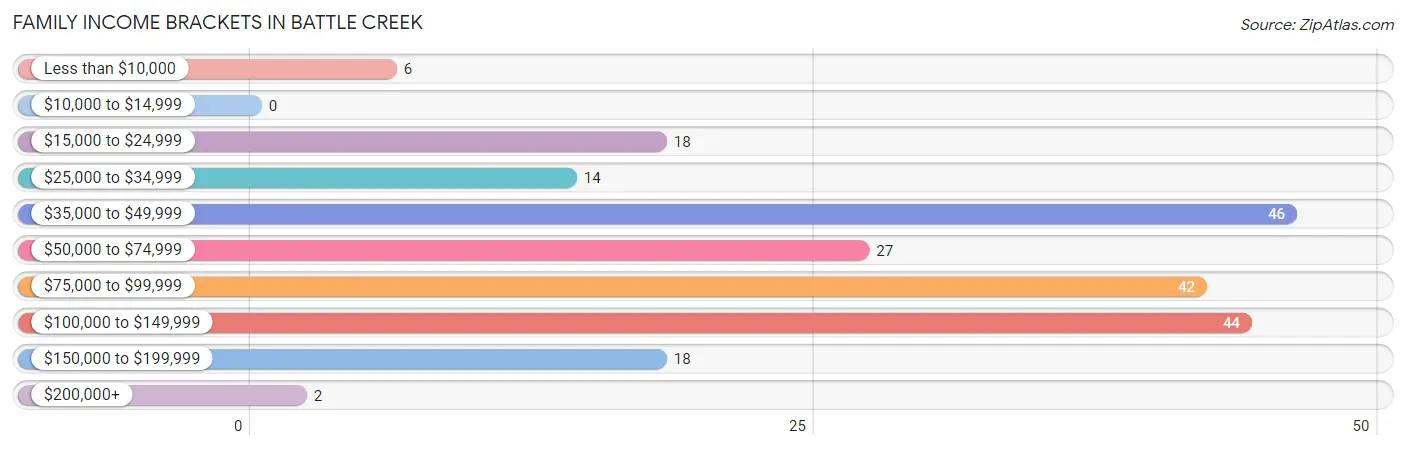
| Income Bracket | # Families | % Families |
| Less than $10,000 | 6 | 2.8% |
| $10,000 to $14,999 | 0 | 0.0% |
| $15,000 to $24,999 | 18 | 8.3% |
| $25,000 to $34,999 | 14 | 6.5% |
| $35,000 to $49,999 | 46 | 21.2% |
| $50,000 to $74,999 | 27 | 12.4% |
| $75,000 to $99,999 | 42 | 19.4% |
| $100,000 to $149,999 | 44 | 20.3% |
| $150,000 to $199,999 | 18 | 8.3% |
| $200,000+ | 2 | 0.9% |
Family Income by Famaliy Size in Battle Creek
3-person families (41 | 18.9%) account for the highest median family income in Battle Creek with $96,181 per family, while 3-person families (41 | 18.9%) have the highest median income of $32,060 per family member.
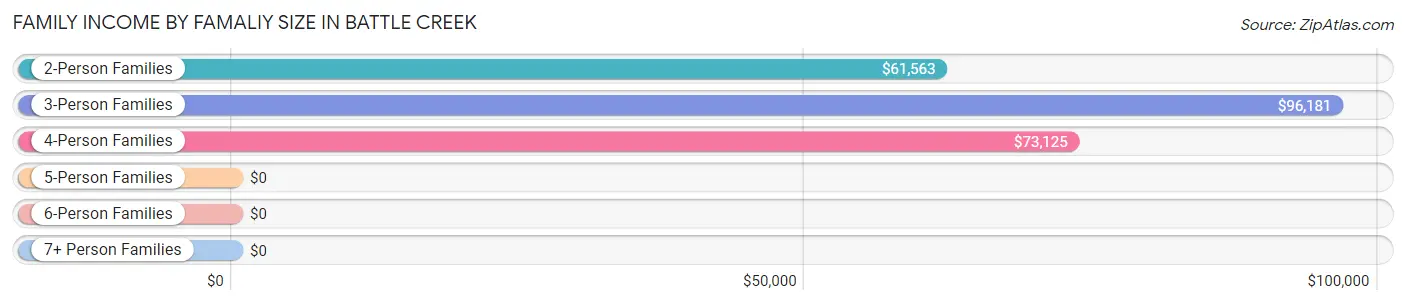
| Income Bracket | # Families | Median Income |
| 2-Person Families | 127 (58.5%) | $61,563 |
| 3-Person Families | 41 (18.9%) | $96,181 |
| 4-Person Families | 31 (14.3%) | $73,125 |
| 5-Person Families | 7 (3.2%) | $0 |
| 6-Person Families | 11 (5.1%) | $0 |
| 7+ Person Families | 0 (0.0%) | $0 |
| Total | 217 (100.0%) | $72,250 |
Family Income by Number of Earners in Battle Creek
The median family income in Battle Creek is $72,250, with families comprising 2 earners (78) having the highest median family income of $108,571, while families with 1 earner (80) have the lowest median family income of $45,565, accounting for 35.9% and 36.9% of families, respectively.
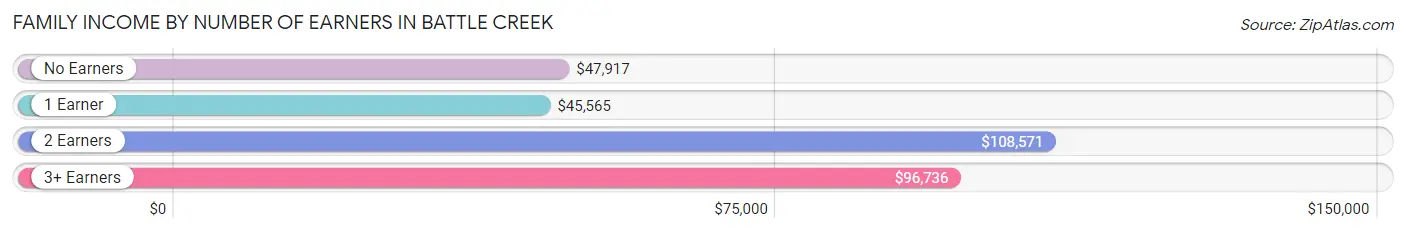
| Number of Earners | # Families | Median Income |
| No Earners | 26 (12.0%) | $47,917 |
| 1 Earner | 80 (36.9%) | $45,565 |
| 2 Earners | 78 (35.9%) | $108,571 |
| 3+ Earners | 33 (15.2%) | $96,736 |
| Total | 217 (100.0%) | $72,250 |
Household Income in Battle Creek
Household Income Brackets in Battle Creek
With 85 households falling in the category, the $100,000 to $149,999 income range is the most frequent in Battle Creek, accounting for 22.4% of all households. In contrast, only 2 households (0.5%) fall into the $200,000+ income bracket, making it the least populous group.
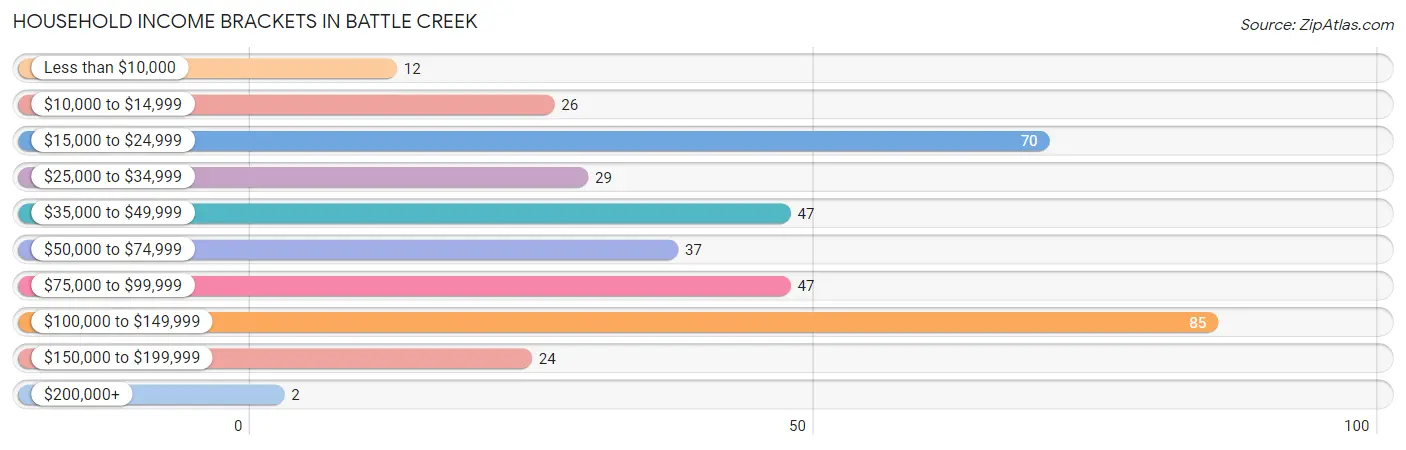
| Income Bracket | # Households | % Households |
| Less than $10,000 | 12 | 3.2% |
| $10,000 to $14,999 | 26 | 6.9% |
| $15,000 to $24,999 | 70 | 18.5% |
| $25,000 to $34,999 | 29 | 7.7% |
| $35,000 to $49,999 | 47 | 12.4% |
| $50,000 to $74,999 | 37 | 9.8% |
| $75,000 to $99,999 | 47 | 12.4% |
| $100,000 to $149,999 | 85 | 22.4% |
| $150,000 to $199,999 | 24 | 6.3% |
| $200,000+ | 2 | 0.5% |
Household Income by Householder Age in Battle Creek
The median household income in Battle Creek is $53,750, with the highest median household income of $98,750 found in the 25 to 44 years age bracket for the primary householder. A total of 94 households (24.8%) fall into this category. Meanwhile, the 65+ years age bracket for the primary householder has the lowest median household income of $23,750, with 156 households (41.2%) in this group.
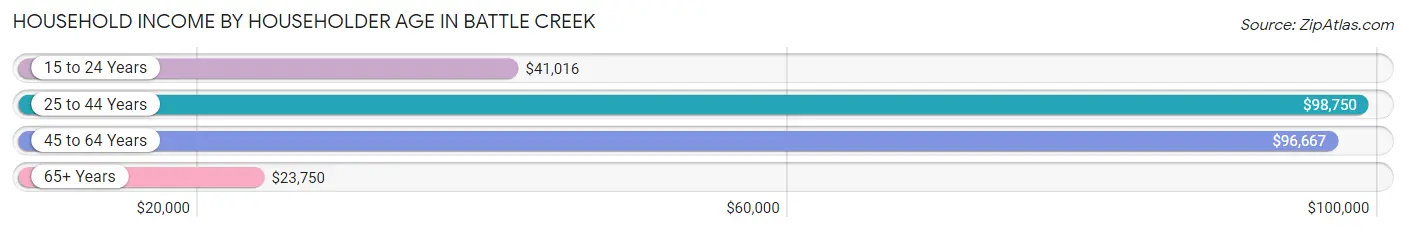
| Income Bracket | # Households | Median Income |
| 15 to 24 Years | 23 (6.1%) | $41,016 |
| 25 to 44 Years | 94 (24.8%) | $98,750 |
| 45 to 64 Years | 106 (28.0%) | $96,667 |
| 65+ Years | 156 (41.2%) | $23,750 |
| Total | 379 (100.0%) | $53,750 |
Poverty in Battle Creek
Income Below Poverty by Sex and Age in Battle Creek
With 11.4% poverty level for males and 13.7% for females among the residents of Battle Creek, under 5 year old males and 6 to 11 year old females are the most vulnerable to poverty, with 4 males (36.4%) and 14 females (53.8%) in their respective age groups living below the poverty level.
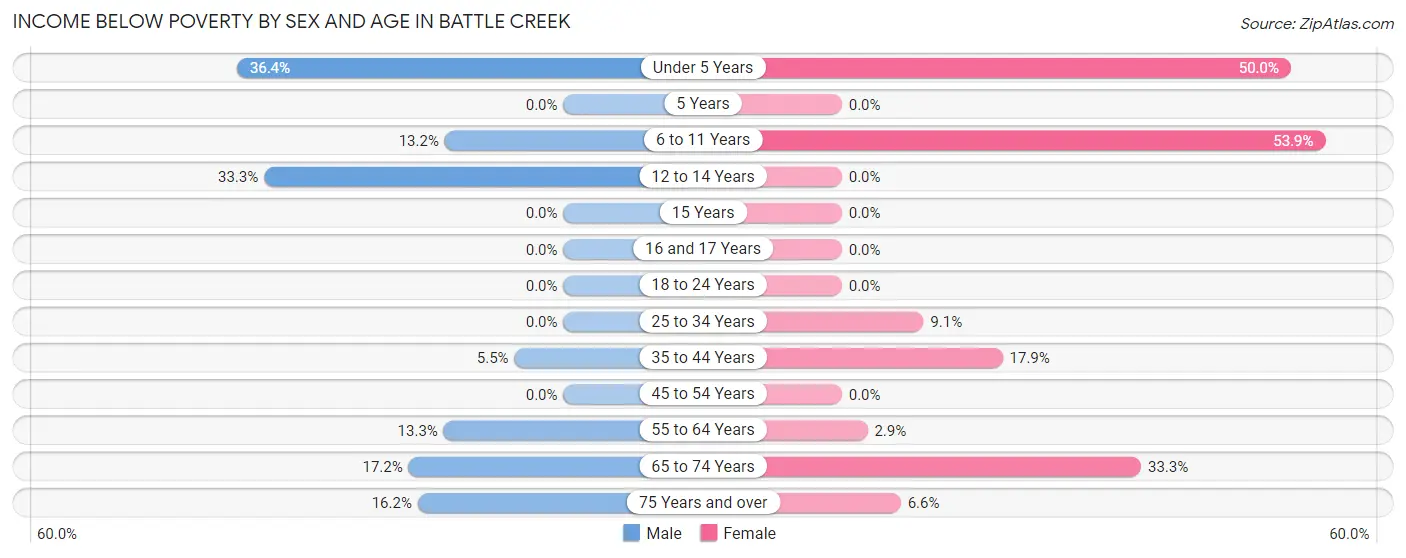
| Age Bracket | Male | Female |
| Under 5 Years | 4 (36.4%) | 5 (50.0%) |
| 5 Years | 0 (0.0%) | 0 (0.0%) |
| 6 to 11 Years | 7 (13.2%) | 14 (53.8%) |
| 12 to 14 Years | 5 (33.3%) | 0 (0.0%) |
| 15 Years | 0 (0.0%) | 0 (0.0%) |
| 16 and 17 Years | 0 (0.0%) | 0 (0.0%) |
| 18 to 24 Years | 0 (0.0%) | 0 (0.0%) |
| 25 to 34 Years | 0 (0.0%) | 2 (9.1%) |
| 35 to 44 Years | 3 (5.4%) | 12 (17.9%) |
| 45 to 54 Years | 0 (0.0%) | 0 (0.0%) |
| 55 to 64 Years | 6 (13.3%) | 2 (2.9%) |
| 65 to 74 Years | 10 (17.2%) | 18 (33.3%) |
| 75 Years and over | 6 (16.2%) | 4 (6.6%) |
| Total | 41 (11.4%) | 57 (13.7%) |
Income Above Poverty by Sex and Age in Battle Creek
According to the poverty statistics in Battle Creek, males aged 16 and 17 years and females aged 5 years are the age groups that are most secure financially, with 100.0% of males and 100.0% of females in these age groups living above the poverty line.
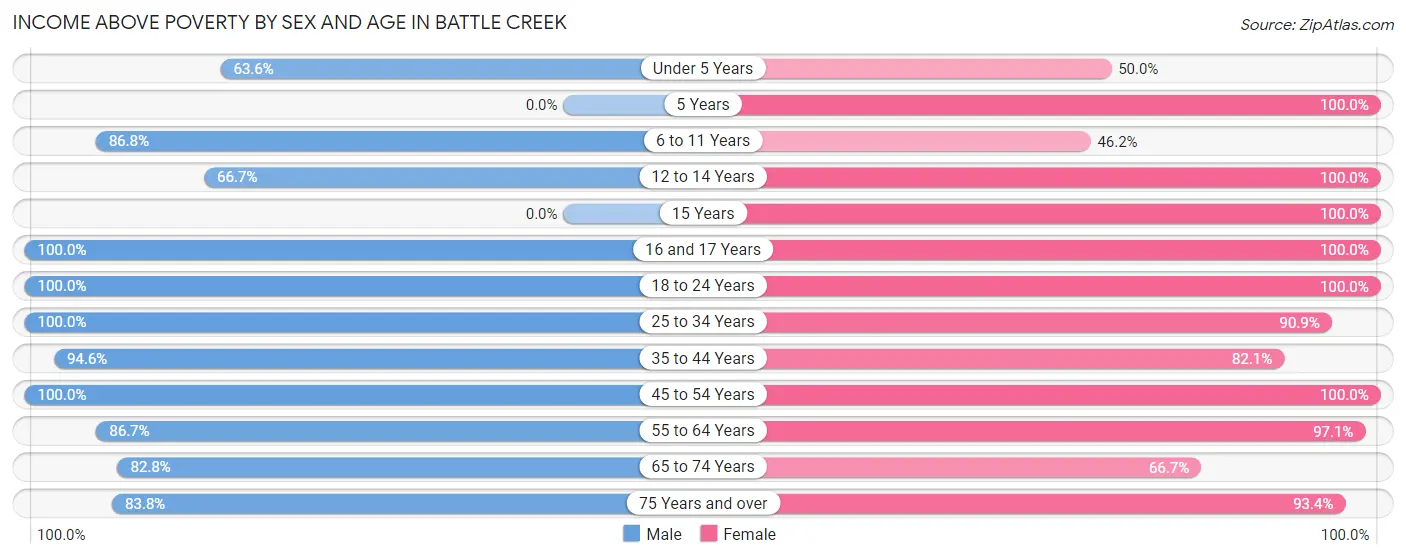
| Age Bracket | Male | Female |
| Under 5 Years | 7 (63.6%) | 5 (50.0%) |
| 5 Years | 0 (0.0%) | 5 (100.0%) |
| 6 to 11 Years | 46 (86.8%) | 12 (46.2%) |
| 12 to 14 Years | 10 (66.7%) | 20 (100.0%) |
| 15 Years | 0 (0.0%) | 5 (100.0%) |
| 16 and 17 Years | 9 (100.0%) | 15 (100.0%) |
| 18 to 24 Years | 20 (100.0%) | 13 (100.0%) |
| 25 to 34 Years | 9 (100.0%) | 20 (90.9%) |
| 35 to 44 Years | 52 (94.6%) | 55 (82.1%) |
| 45 to 54 Years | 47 (100.0%) | 48 (100.0%) |
| 55 to 64 Years | 39 (86.7%) | 68 (97.1%) |
| 65 to 74 Years | 48 (82.8%) | 36 (66.7%) |
| 75 Years and over | 31 (83.8%) | 57 (93.4%) |
| Total | 318 (88.6%) | 359 (86.3%) |
Income Below Poverty Among Married-Couple Families in Battle Creek
The poverty statistics for married-couple families in Battle Creek show that 2.7% or 4 of the total 148 families live below the poverty line. Families with no children have the highest poverty rate of 4.0%, comprising of 4 families. On the other hand, families with 1 or 2 children have the lowest poverty rate of 0.0%, which includes 0 families.
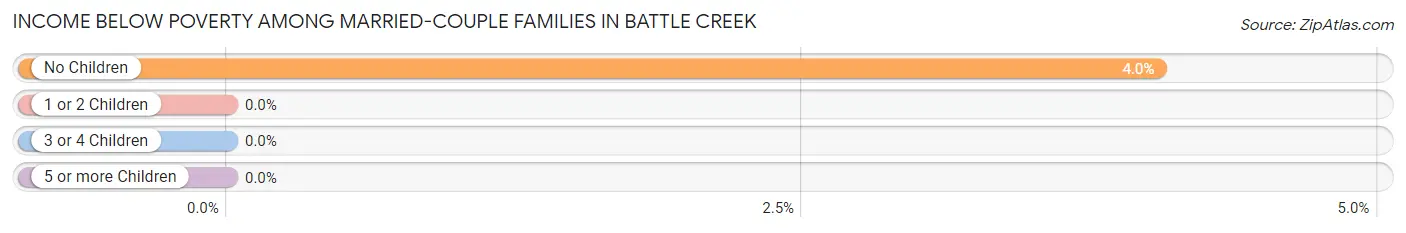
| Children | Above Poverty | Below Poverty |
| No Children | 95 (96.0%) | 4 (4.0%) |
| 1 or 2 Children | 40 (100.0%) | 0 (0.0%) |
| 3 or 4 Children | 9 (100.0%) | 0 (0.0%) |
| 5 or more Children | 0 (0.0%) | 0 (0.0%) |
| Total | 144 (97.3%) | 4 (2.7%) |
Income Below Poverty Among Single-Parent Households in Battle Creek
According to the poverty data in Battle Creek, 6.1% or 2 single-father households and 33.3% or 12 single-mother households are living below the poverty line. Among single-father households, those with no children have the highest poverty rate, with 2 households (100.0%) experiencing poverty. Likewise, among single-mother households, those with 5 or more children have the highest poverty rate, with 9 households (100.0%) falling below the poverty line.
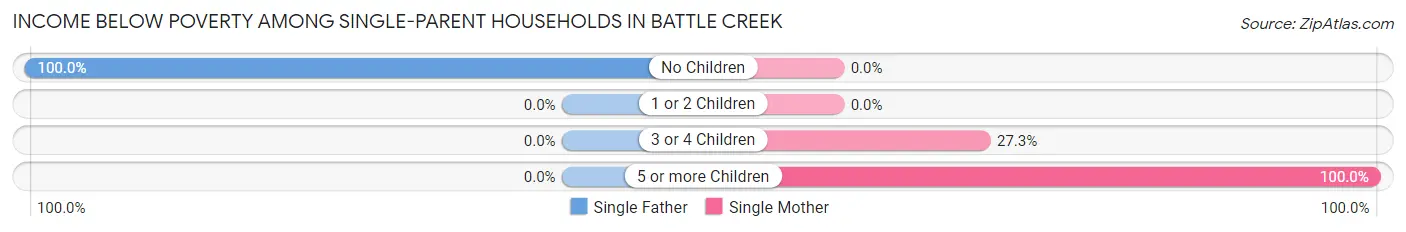
| Children | Single Father | Single Mother |
| No Children | 2 (100.0%) | 0 (0.0%) |
| 1 or 2 Children | 0 (0.0%) | 0 (0.0%) |
| 3 or 4 Children | 0 (0.0%) | 3 (27.3%) |
| 5 or more Children | 0 (0.0%) | 9 (100.0%) |
| Total | 2 (6.1%) | 12 (33.3%) |
Income Below Poverty Among Married-Couple vs Single-Parent Households in Battle Creek
The poverty data for Battle Creek shows that 4 of the married-couple family households (2.7%) and 14 of the single-parent households (20.3%) are living below the poverty level. Within the married-couple family households, those with no children have the highest poverty rate, with 4 households (4.0%) falling below the poverty line. Among the single-parent households, those with 5 or more children have the highest poverty rate, with 9 household (100.0%) living below poverty.
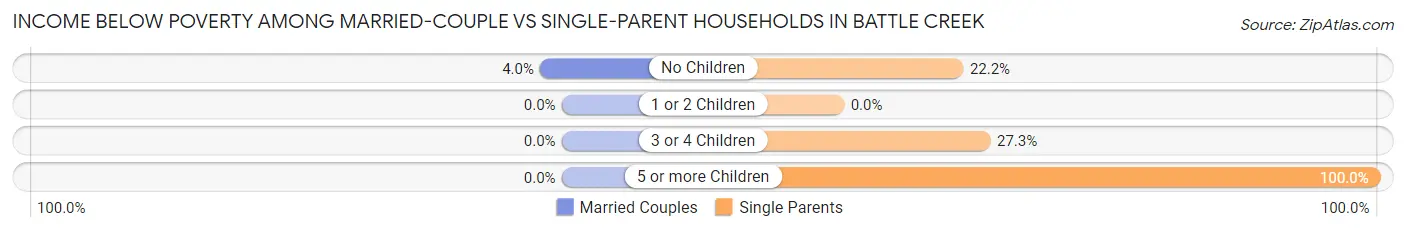
| Children | Married-Couple Families | Single-Parent Households |
| No Children | 4 (4.0%) | 2 (22.2%) |
| 1 or 2 Children | 0 (0.0%) | 0 (0.0%) |
| 3 or 4 Children | 0 (0.0%) | 3 (27.3%) |
| 5 or more Children | 0 (0.0%) | 9 (100.0%) |
| Total | 4 (2.7%) | 14 (20.3%) |
Race in Battle Creek
The most populous races in Battle Creek are White / Caucasian (803 | 96.8%), Hispanic or Latino (28 | 3.4%), and Two or more Races (12 | 1.5%).
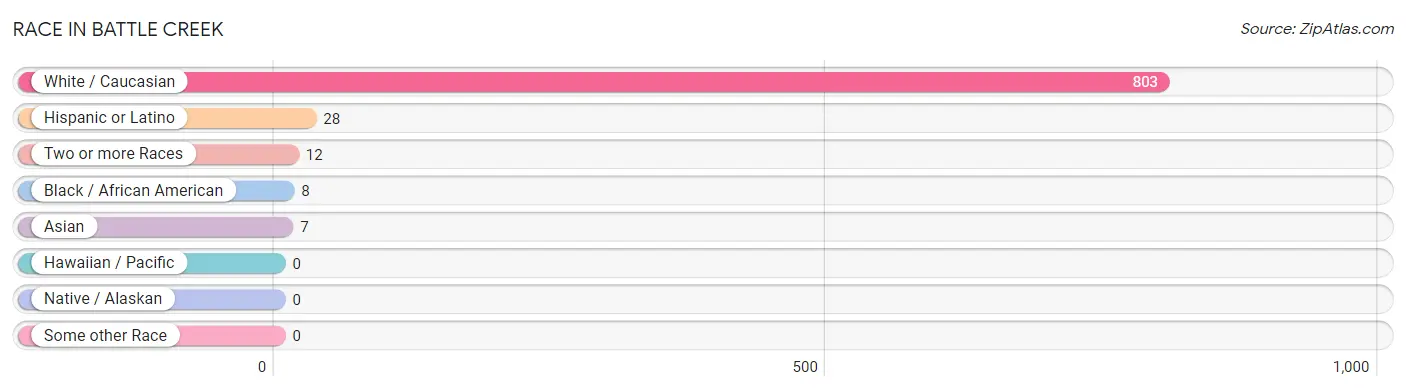
| Race | # Population | % Population |
| Asian | 7 | 0.8% |
| Black / African American | 8 | 1.0% |
| Hawaiian / Pacific | 0 | 0.0% |
| Hispanic or Latino | 28 | 3.4% |
| Native / Alaskan | 0 | 0.0% |
| White / Caucasian | 803 | 96.8% |
| Two or more Races | 12 | 1.5% |
| Some other Race | 0 | 0.0% |
| Total | 830 | 100.0% |
Ancestry in Battle Creek
The most populous ancestries reported in Battle Creek are German (353 | 42.5%), English (90 | 10.8%), Irish (81 | 9.8%), American (65 | 7.8%), and Danish (29 | 3.5%), together accounting for 74.5% of all Battle Creek residents.
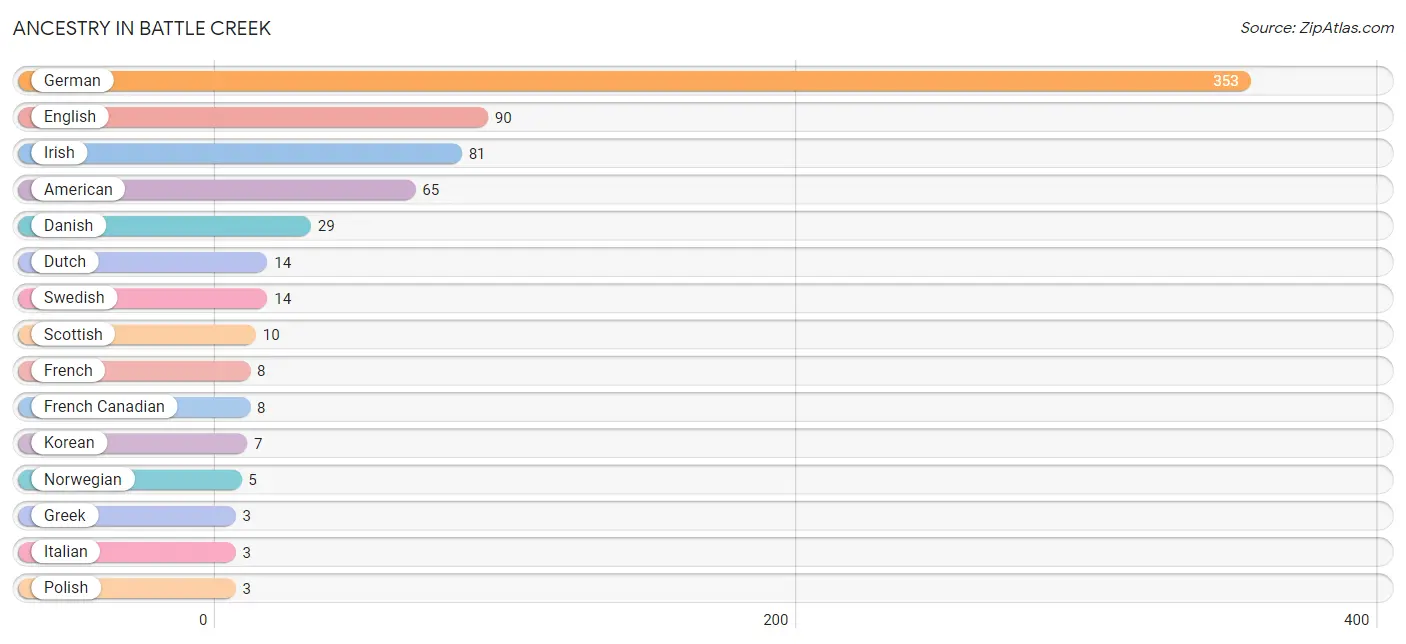
| Ancestry | # Population | % Population |
| American | 65 | 7.8% |
| Danish | 29 | 3.5% |
| Dutch | 14 | 1.7% |
| English | 90 | 10.8% |
| French | 8 | 1.0% |
| French Canadian | 8 | 1.0% |
| German | 353 | 42.5% |
| Greek | 3 | 0.4% |
| Irish | 81 | 9.8% |
| Italian | 3 | 0.4% |
| Korean | 7 | 0.8% |
| Mexican | 2 | 0.2% |
| Norwegian | 5 | 0.6% |
| Polish | 3 | 0.4% |
| Scotch-Irish | 3 | 0.4% |
| Scottish | 10 | 1.2% |
| Swedish | 14 | 1.7% | View All 17 Rows |
Immigrants in Battle Creek
The most numerous immigrant groups reported in Battle Creek came from Asia (7 | 0.8%), Philippines (7 | 0.8%), and South Eastern Asia (7 | 0.8%), together accounting for 2.5% of all Battle Creek residents.
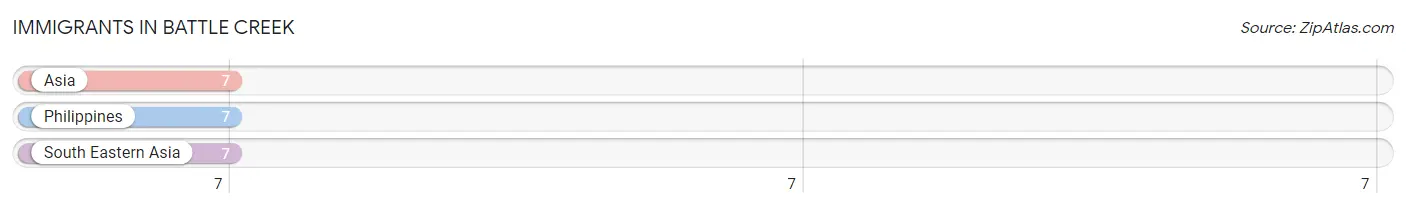
| Immigration Origin | # Population | % Population |
| Asia | 7 | 0.8% |
| Philippines | 7 | 0.8% |
| South Eastern Asia | 7 | 0.8% | View All 3 Rows |
Sex and Age in Battle Creek
Sex and Age in Battle Creek
The most populous age groups in Battle Creek are 10 to 14 Years (59 | 15.4%) for men and 10 to 14 Years (47 | 10.5%) for women.
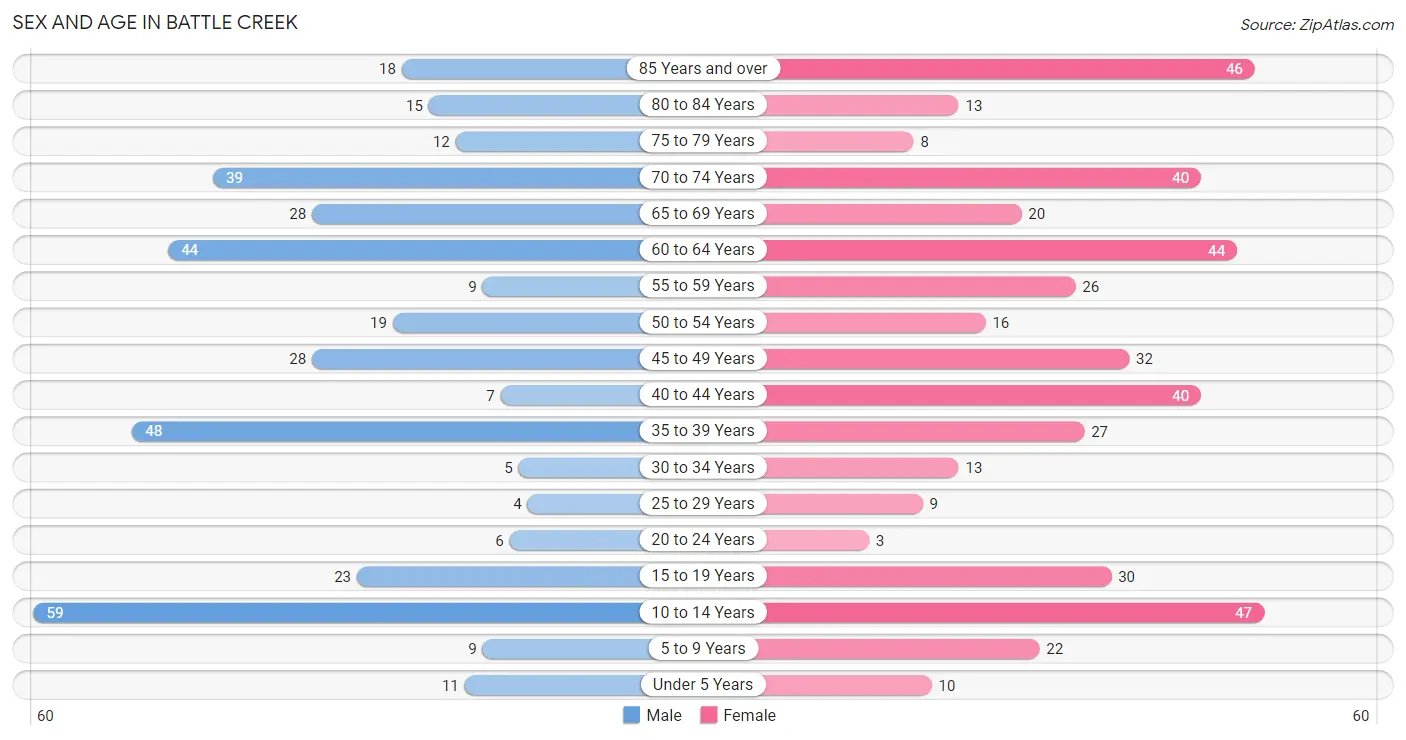
| Age Bracket | Male | Female |
| Under 5 Years | 11 (2.9%) | 10 (2.2%) |
| 5 to 9 Years | 9 (2.3%) | 22 (4.9%) |
| 10 to 14 Years | 59 (15.4%) | 47 (10.5%) |
| 15 to 19 Years | 23 (6.0%) | 30 (6.7%) |
| 20 to 24 Years | 6 (1.6%) | 3 (0.7%) |
| 25 to 29 Years | 4 (1.0%) | 9 (2.0%) |
| 30 to 34 Years | 5 (1.3%) | 13 (2.9%) |
| 35 to 39 Years | 48 (12.5%) | 27 (6.0%) |
| 40 to 44 Years | 7 (1.8%) | 40 (9.0%) |
| 45 to 49 Years | 28 (7.3%) | 32 (7.2%) |
| 50 to 54 Years | 19 (5.0%) | 16 (3.6%) |
| 55 to 59 Years | 9 (2.3%) | 26 (5.8%) |
| 60 to 64 Years | 44 (11.5%) | 44 (9.9%) |
| 65 to 69 Years | 28 (7.3%) | 20 (4.5%) |
| 70 to 74 Years | 39 (10.2%) | 40 (9.0%) |
| 75 to 79 Years | 12 (3.1%) | 8 (1.8%) |
| 80 to 84 Years | 15 (3.9%) | 13 (2.9%) |
| 85 Years and over | 18 (4.7%) | 46 (10.3%) |
| Total | 384 (100.0%) | 446 (100.0%) |
Families and Households in Battle Creek
Median Family Size in Battle Creek
The median family size in Battle Creek is 2.64 persons per family, with single female/mother families (36 | 16.6%) accounting for the largest median family size of 3.25 persons per family. On the other hand, single male/father families (33 | 15.2%) represent the smallest median family size with 1.97 persons per family.
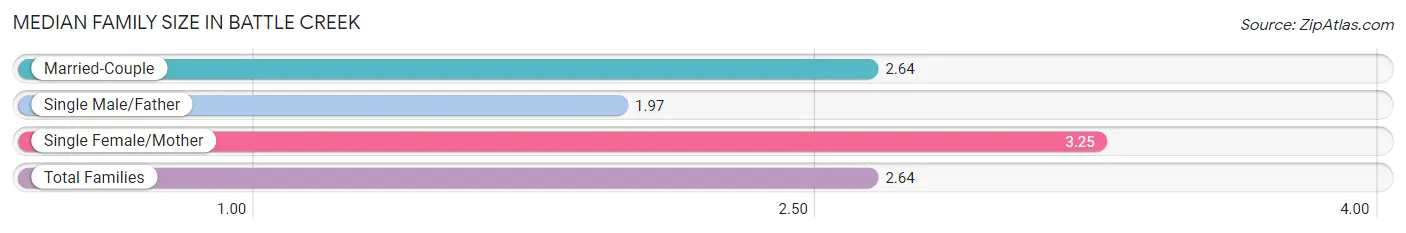
| Family Type | # Families | Family Size |
| Married-Couple | 148 (68.2%) | 2.64 |
| Single Male/Father | 33 (15.2%) | 1.97 |
| Single Female/Mother | 36 (16.6%) | 3.25 |
| Total Families | 217 (100.0%) | 2.64 |
Median Household Size in Battle Creek
The median household size in Battle Creek is 2.09 persons per household, with single female/mother households (36 | 9.5%) accounting for the largest median household size of 3.39 persons per household. non-family households (162 | 42.7%) represent the smallest median household size with 1.07 persons per household.
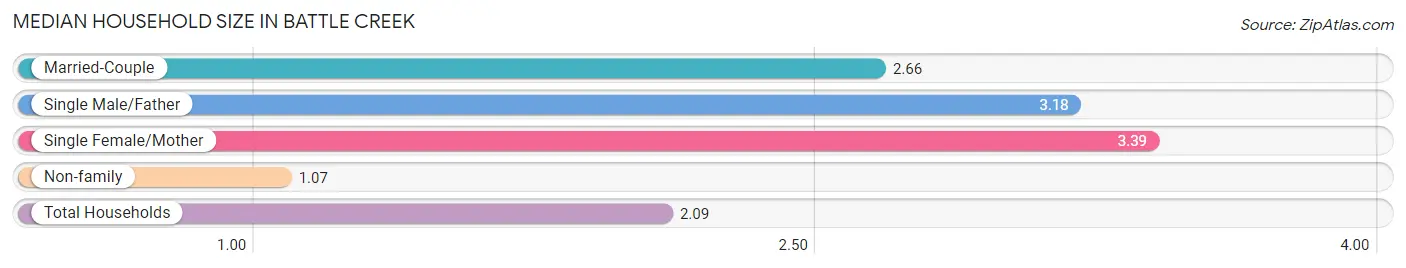
| Household Type | # Households | Household Size |
| Married-Couple | 148 (39.1%) | 2.66 |
| Single Male/Father | 33 (8.7%) | 3.18 |
| Single Female/Mother | 36 (9.5%) | 3.39 |
| Non-family | 162 (42.7%) | 1.07 |
| Total Households | 379 (100.0%) | 2.09 |
Household Size by Marriage Status in Battle Creek
Out of a total of 379 households in Battle Creek, 217 (57.3%) are family households, while 162 (42.7%) are nonfamily households. The most numerous type of family households are 2-person households, comprising 96, and the most common type of nonfamily households are 1-person households, comprising 147.
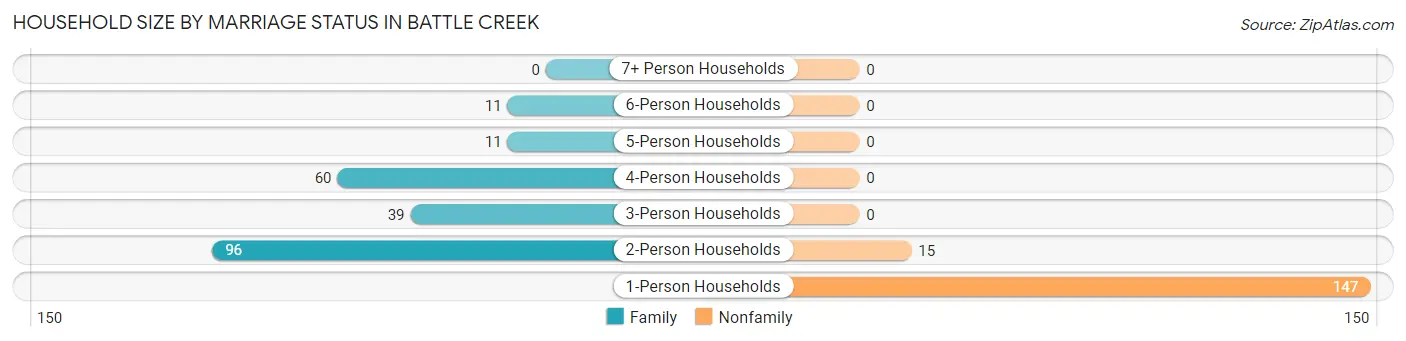
| Household Size | Family Households | Nonfamily Households |
| 1-Person Households | - | 147 (38.8%) |
| 2-Person Households | 96 (25.3%) | 15 (4.0%) |
| 3-Person Households | 39 (10.3%) | 0 (0.0%) |
| 4-Person Households | 60 (15.8%) | 0 (0.0%) |
| 5-Person Households | 11 (2.9%) | 0 (0.0%) |
| 6-Person Households | 11 (2.9%) | 0 (0.0%) |
| 7+ Person Households | 0 (0.0%) | 0 (0.0%) |
| Total | 217 (57.3%) | 162 (42.7%) |
Female Fertility in Battle Creek
Fertility by Age in Battle Creek
Average fertility rate in Battle Creek is 26.0 births per 1,000 women. Women in the age bracket of 20 to 34 years have the highest fertility rate with 160.0 births per 1,000 women. Women in the age bracket of 20 to 34 years acount for 100.0% of all women with births.
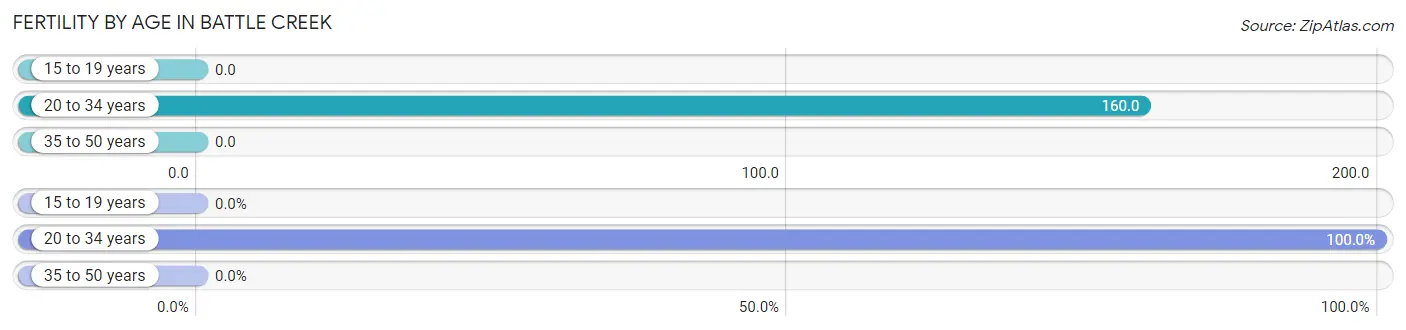
| Age Bracket | Women with Births | Births / 1,000 Women |
| 15 to 19 years | 0 (0.0%) | 0.0 |
| 20 to 34 years | 4 (100.0%) | 160.0 |
| 35 to 50 years | 0 (0.0%) | 0.0 |
| Total | 4 (100.0%) | 26.0 |
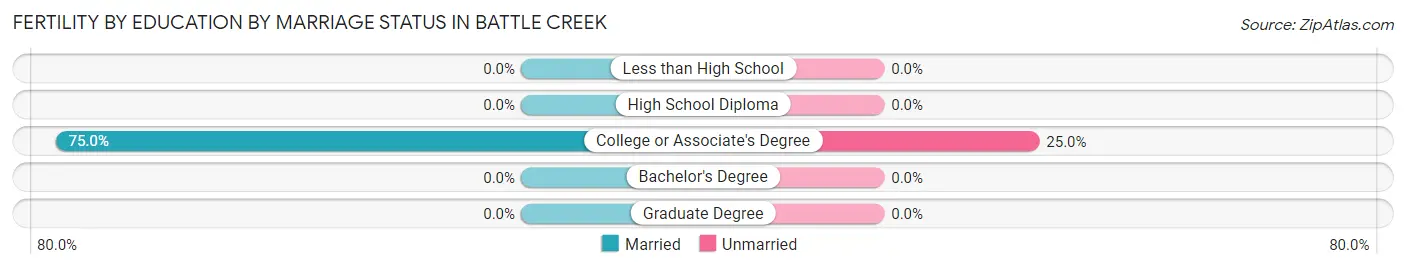
Fertility by Age by Marriage Status in Battle Creek
75.0% of women with births (4) in Battle Creek are married. The highest percentage of unmarried women with births falls into 20 to 34 years age bracket with 25.0% of them unmarried at the time of birth, while the lowest percentage of unmarried women with births belong to 20 to 34 years age bracket with 25.0% of them unmarried.
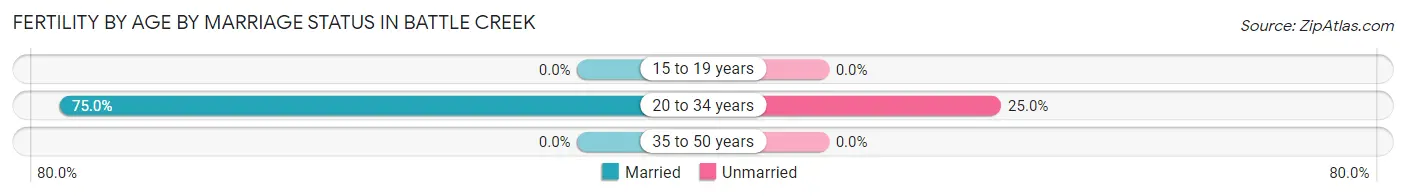
| Age Bracket | Married | Unmarried |
| 15 to 19 years | 0 (0.0%) | 0 (0.0%) |
| 20 to 34 years | 3 (75.0%) | 1 (25.0%) |
| 35 to 50 years | 0 (0.0%) | 0 (0.0%) |
| Total | 3 (75.0%) | 1 (25.0%) |
Fertility by Education in Battle Creek
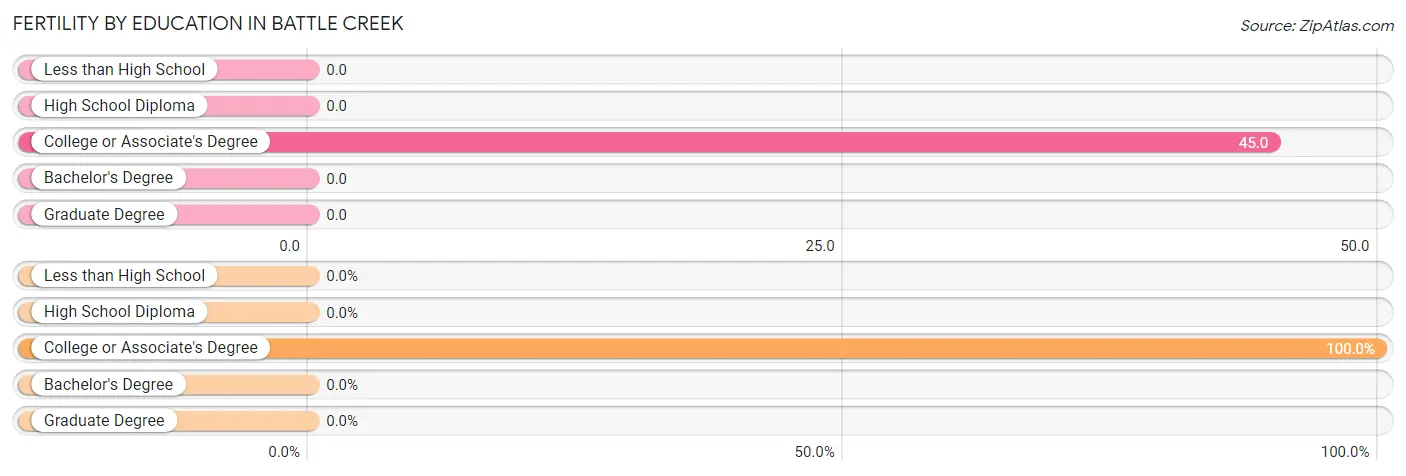
| Educational Attainment | Women with Births | Births / 1,000 Women |
| Less than High School | 0 (0.0%) | 0.0 |
| High School Diploma | 0 (0.0%) | 0.0 |
| College or Associate's Degree | 4 (100.0%) | 45.0 |
| Bachelor's Degree | 0 (0.0%) | 0.0 |
| Graduate Degree | 0 (0.0%) | 0.0 |
| Total | 4 (100.0%) | 26.0 |
Fertility by Education by Marriage Status in Battle Creek
25.0% of women with births in Battle Creek are unmarried. Women with the educational attainment of college or associate's degree are most likely to be married with 75.0% of them married at childbirth, while women with the educational attainment of college or associate's degree are least likely to be married with 25.0% of them unmarried at childbirth.
| Educational Attainment | Married | Unmarried |
| Less than High School | 0 (0.0%) | 0 (0.0%) |
| High School Diploma | 0 (0.0%) | 0 (0.0%) |
| College or Associate's Degree | 3 (75.0%) | 1 (25.0%) |
| Bachelor's Degree | 0 (0.0%) | 0 (0.0%) |
| Graduate Degree | 0 (0.0%) | 0 (0.0%) |
| Total | 3 (75.0%) | 1 (25.0%) |
Employment Characteristics in Battle Creek
Employment by Class of Employer in Battle Creek
Among the 392 employed individuals in Battle Creek, private company employees (262 | 66.8%), local government employees (61 | 15.6%), and self-employed (incorporated) (36 | 9.2%) make up the most common classes of employment.
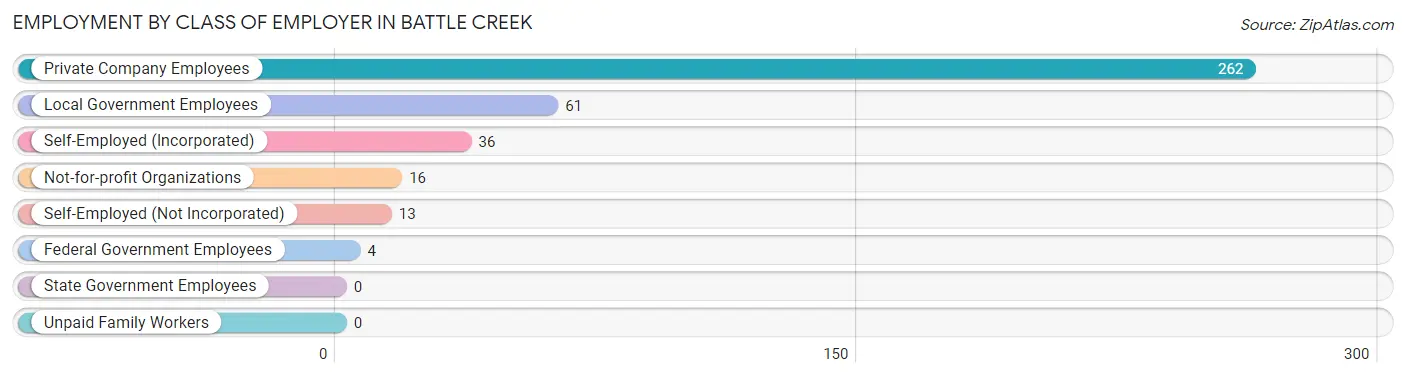
| Employer Class | # Employees | % Employees |
| Private Company Employees | 262 | 66.8% |
| Self-Employed (Incorporated) | 36 | 9.2% |
| Self-Employed (Not Incorporated) | 13 | 3.3% |
| Not-for-profit Organizations | 16 | 4.1% |
| Local Government Employees | 61 | 15.6% |
| State Government Employees | 0 | 0.0% |
| Federal Government Employees | 4 | 1.0% |
| Unpaid Family Workers | 0 | 0.0% |
| Total | 392 | 100.0% |
Employment Status by Age in Battle Creek
According to the labor force statistics for Battle Creek, out of the total population over 16 years of age (667), 62.4% or 416 individuals are in the labor force, with 1.0% or 4 of them unemployed. The age group with the highest labor force participation rate is 25 to 29 years, with 100.0% or 13 individuals in the labor force. Within the labor force, the 75 years and over age range has the highest percentage of unemployed individuals, with 25.0% or 2 of them being unemployed.
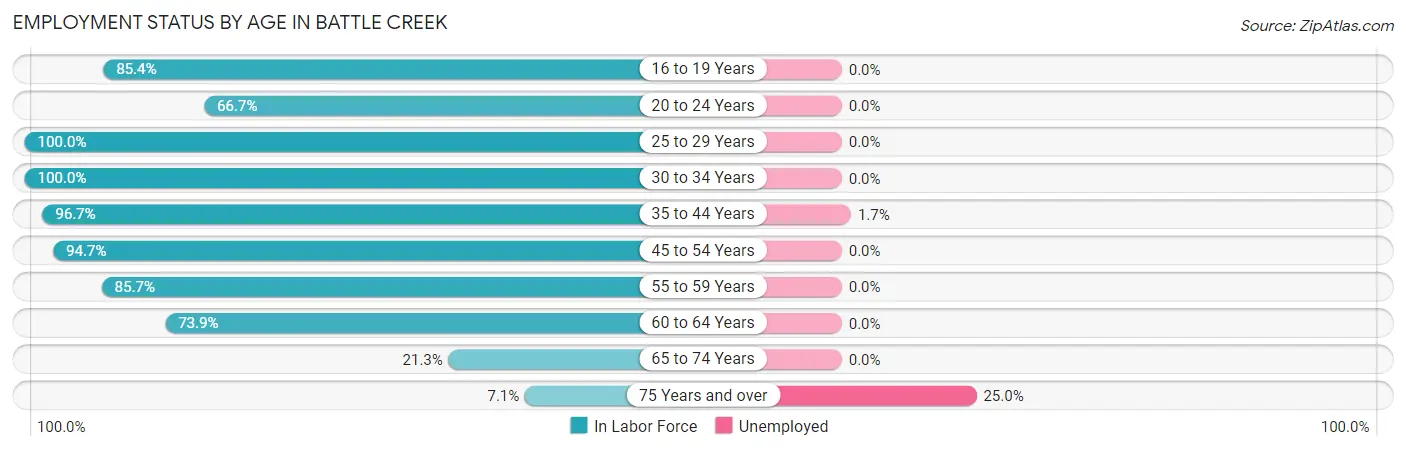
| Age Bracket | In Labor Force | Unemployed |
| 16 to 19 Years | 41 (85.4%) | 0 (0.0%) |
| 20 to 24 Years | 6 (66.7%) | 0 (0.0%) |
| 25 to 29 Years | 13 (100.0%) | 0 (0.0%) |
| 30 to 34 Years | 18 (100.0%) | 0 (0.0%) |
| 35 to 44 Years | 118 (96.7%) | 2 (1.7%) |
| 45 to 54 Years | 90 (94.7%) | 0 (0.0%) |
| 55 to 59 Years | 30 (85.7%) | 0 (0.0%) |
| 60 to 64 Years | 65 (73.9%) | 0 (0.0%) |
| 65 to 74 Years | 27 (21.3%) | 0 (0.0%) |
| 75 Years and over | 8 (7.1%) | 2 (25.0%) |
| Total | 416 (62.4%) | 4 (1.0%) |
Employment Status by Educational Attainment in Battle Creek
According to labor force statistics for Battle Creek, 90.0% of individuals (334) out of the total population between 25 and 64 years of age (371) are in the labor force, with 0.6% or 2 of them being unemployed. The group with the highest labor force participation rate are those with the educational attainment of bachelor's degree or higher, with 100.0% or 29 individuals in the labor force. Within the labor force, individuals with high school diploma education have the highest percentage of unemployment, with 1.7% or 2 of them being unemployed.
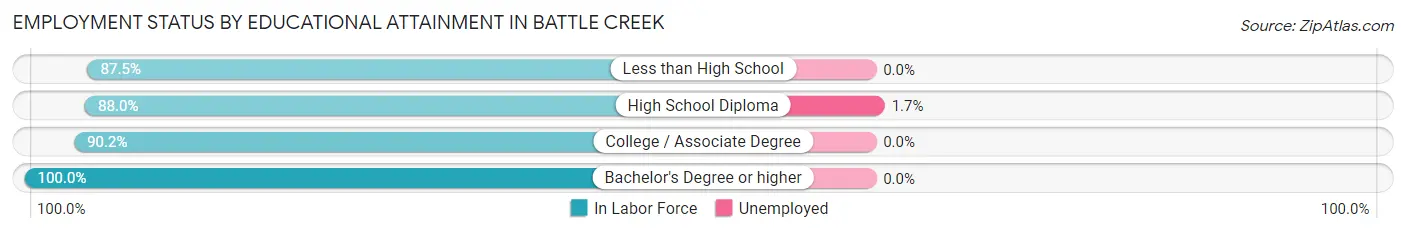
| Educational Attainment | In Labor Force | Unemployed |
| Less than High School | 14 (87.5%) | 0 (0.0%) |
| High School Diploma | 117 (88.0%) | 2 (1.7%) |
| College / Associate Degree | 174 (90.2%) | 0 (0.0%) |
| Bachelor's Degree or higher | 29 (100.0%) | 0 (0.0%) |
| Total | 334 (90.0%) | 2 (0.6%) |
Employment Occupations by Sex in Battle Creek
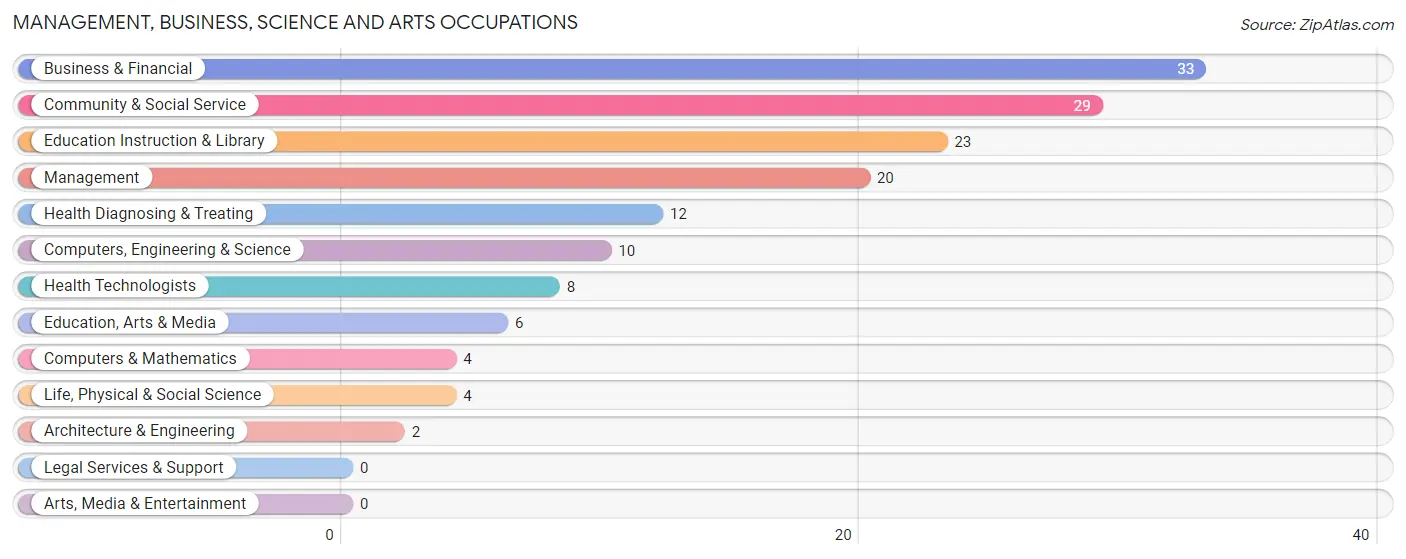
Management, Business, Science and Arts Occupations
The most common Management, Business, Science and Arts occupations in Battle Creek are Business & Financial (33 | 8.0%), Community & Social Service (29 | 7.0%), Education Instruction & Library (23 | 5.6%), Management (20 | 4.9%), and Health Diagnosing & Treating (12 | 2.9%).
Management, Business, Science and Arts Occupations by Sex
Within the Management, Business, Science and Arts occupations in Battle Creek, the most male-oriented occupations are Computers, Engineering & Science (100.0%), Computers & Mathematics (100.0%), and Architecture & Engineering (100.0%), while the most female-oriented occupations are Business & Financial (100.0%), Health Technologists (100.0%), and Health Diagnosing & Treating (75.0%).
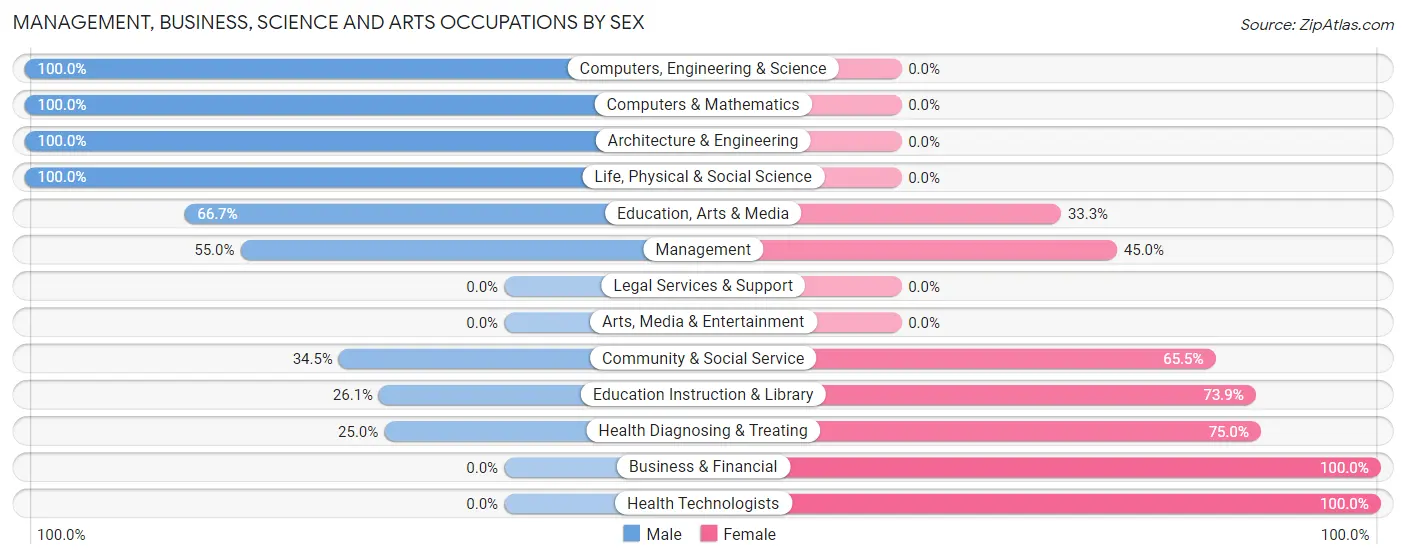
| Occupation | Male | Female |
| Management | 11 (55.0%) | 9 (45.0%) |
| Business & Financial | 0 (0.0%) | 33 (100.0%) |
| Computers, Engineering & Science | 10 (100.0%) | 0 (0.0%) |
| Computers & Mathematics | 4 (100.0%) | 0 (0.0%) |
| Architecture & Engineering | 2 (100.0%) | 0 (0.0%) |
| Life, Physical & Social Science | 4 (100.0%) | 0 (0.0%) |
| Community & Social Service | 10 (34.5%) | 19 (65.5%) |
| Education, Arts & Media | 4 (66.7%) | 2 (33.3%) |
| Legal Services & Support | 0 (0.0%) | 0 (0.0%) |
| Education Instruction & Library | 6 (26.1%) | 17 (73.9%) |
| Arts, Media & Entertainment | 0 (0.0%) | 0 (0.0%) |
| Health Diagnosing & Treating | 3 (25.0%) | 9 (75.0%) |
| Health Technologists | 0 (0.0%) | 8 (100.0%) |
| Total (Category) | 34 (32.7%) | 70 (67.3%) |
| Total (Overall) | 188 (45.6%) | 224 (54.4%) |
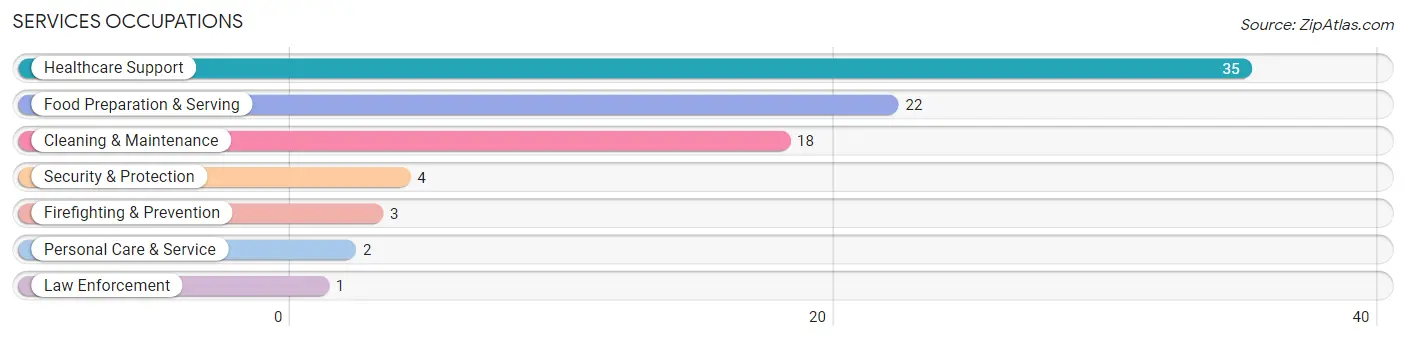
Services Occupations
The most common Services occupations in Battle Creek are Healthcare Support (35 | 8.5%), Food Preparation & Serving (22 | 5.3%), Cleaning & Maintenance (18 | 4.4%), Security & Protection (4 | 1.0%), and Firefighting & Prevention (3 | 0.7%).
Services Occupations by Sex
Within the Services occupations in Battle Creek, the most male-oriented occupations are Law Enforcement (100.0%), Security & Protection (25.0%), and Cleaning & Maintenance (16.7%), while the most female-oriented occupations are Healthcare Support (100.0%), Firefighting & Prevention (100.0%), and Personal Care & Service (100.0%).
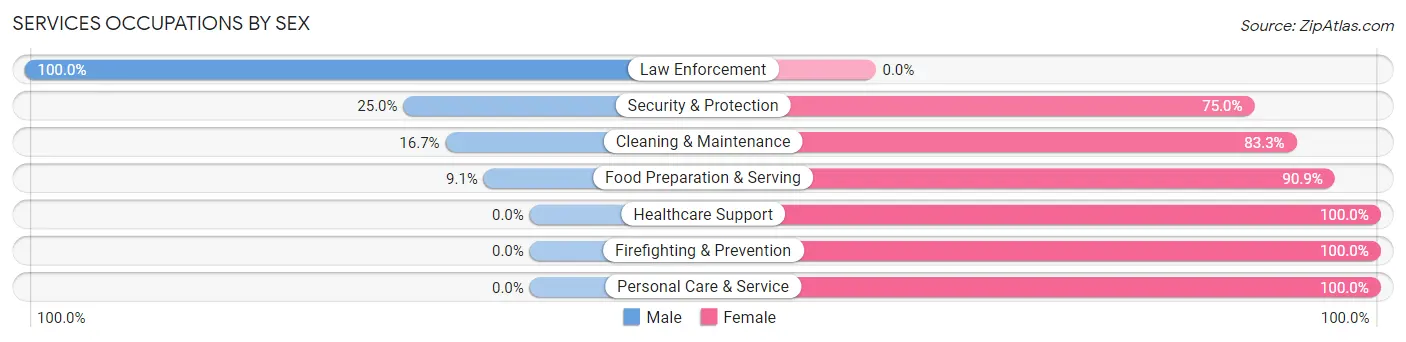
| Occupation | Male | Female |
| Healthcare Support | 0 (0.0%) | 35 (100.0%) |
| Security & Protection | 1 (25.0%) | 3 (75.0%) |
| Firefighting & Prevention | 0 (0.0%) | 3 (100.0%) |
| Law Enforcement | 1 (100.0%) | 0 (0.0%) |
| Food Preparation & Serving | 2 (9.1%) | 20 (90.9%) |
| Cleaning & Maintenance | 3 (16.7%) | 15 (83.3%) |
| Personal Care & Service | 0 (0.0%) | 2 (100.0%) |
| Total (Category) | 6 (7.4%) | 75 (92.6%) |
| Total (Overall) | 188 (45.6%) | 224 (54.4%) |
Sales and Office Occupations
The most common Sales and Office occupations in Battle Creek are Office & Administration (67 | 16.3%), and Sales & Related (30 | 7.3%).
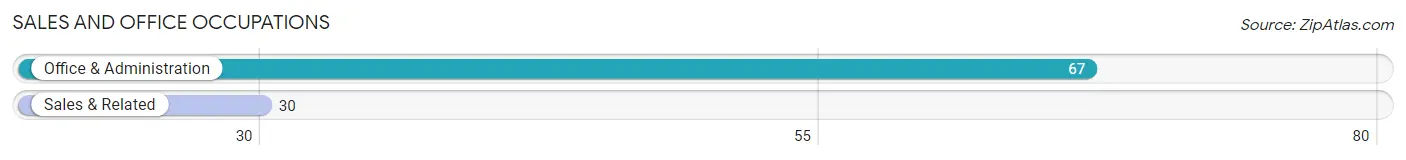
Sales and Office Occupations by Sex
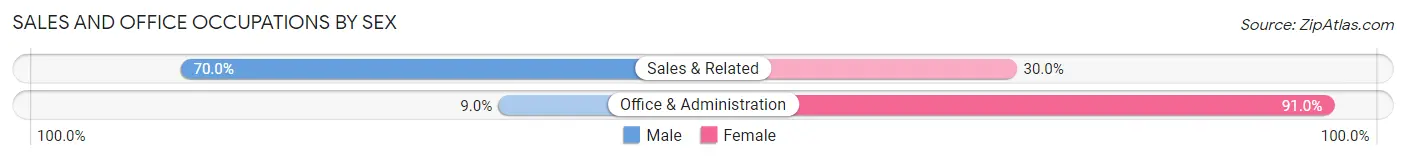
| Occupation | Male | Female |
| Sales & Related | 21 (70.0%) | 9 (30.0%) |
| Office & Administration | 6 (9.0%) | 61 (91.0%) |
| Total (Category) | 27 (27.8%) | 70 (72.2%) |
| Total (Overall) | 188 (45.6%) | 224 (54.4%) |
Natural Resources, Construction and Maintenance Occupations
The most common Natural Resources, Construction and Maintenance occupations in Battle Creek are Construction & Extraction (74 | 18.0%), Installation, Maintenance & Repair (20 | 4.9%), and Farming, Fishing & Forestry (2 | 0.5%).
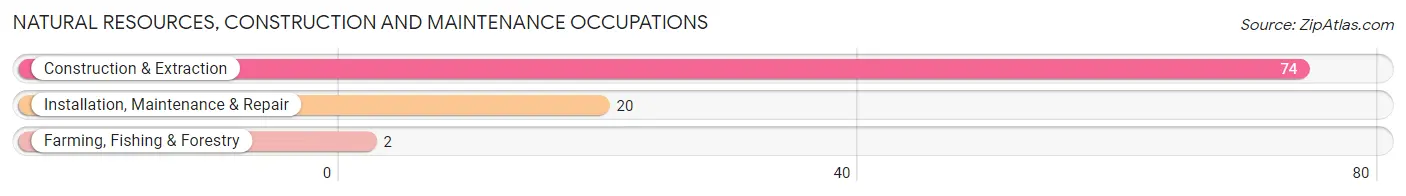
Natural Resources, Construction and Maintenance Occupations by Sex
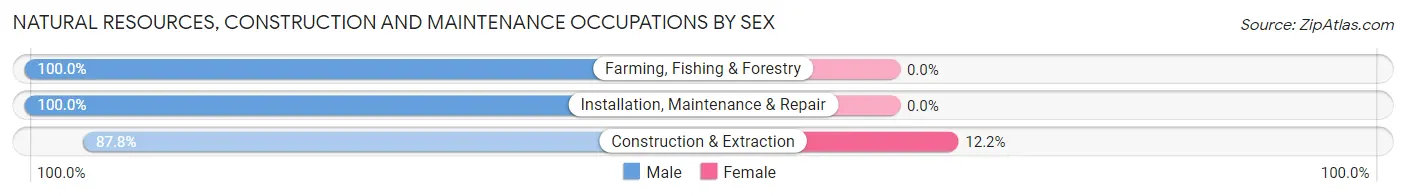
| Occupation | Male | Female |
| Farming, Fishing & Forestry | 2 (100.0%) | 0 (0.0%) |
| Construction & Extraction | 65 (87.8%) | 9 (12.2%) |
| Installation, Maintenance & Repair | 20 (100.0%) | 0 (0.0%) |
| Total (Category) | 87 (90.6%) | 9 (9.4%) |
| Total (Overall) | 188 (45.6%) | 224 (54.4%) |
Production, Transportation and Moving Occupations
The most common Production, Transportation and Moving occupations in Battle Creek are Production (17 | 4.1%), Material Moving (11 | 2.7%), and Transportation (6 | 1.5%).
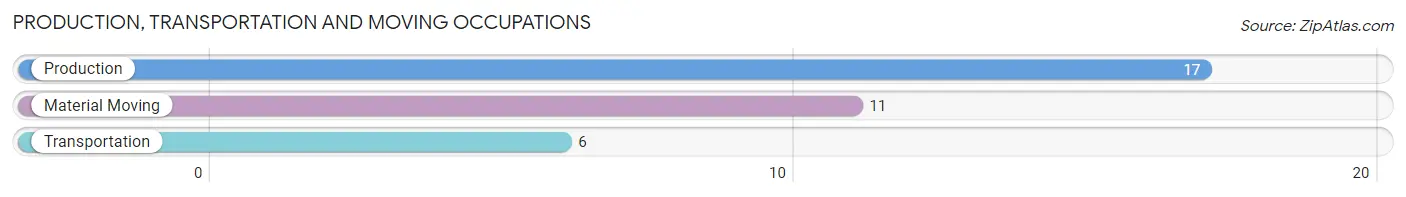
Production, Transportation and Moving Occupations by Sex
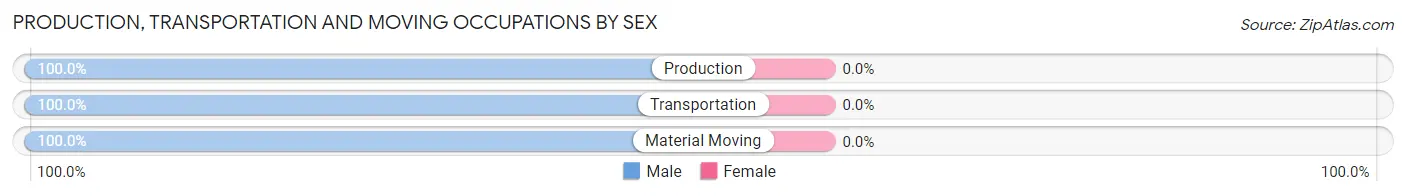
| Occupation | Male | Female |
| Production | 17 (100.0%) | 0 (0.0%) |
| Transportation | 6 (100.0%) | 0 (0.0%) |
| Material Moving | 11 (100.0%) | 0 (0.0%) |
| Total (Category) | 34 (100.0%) | 0 (0.0%) |
| Total (Overall) | 188 (45.6%) | 224 (54.4%) |
Employment Industries by Sex in Battle Creek
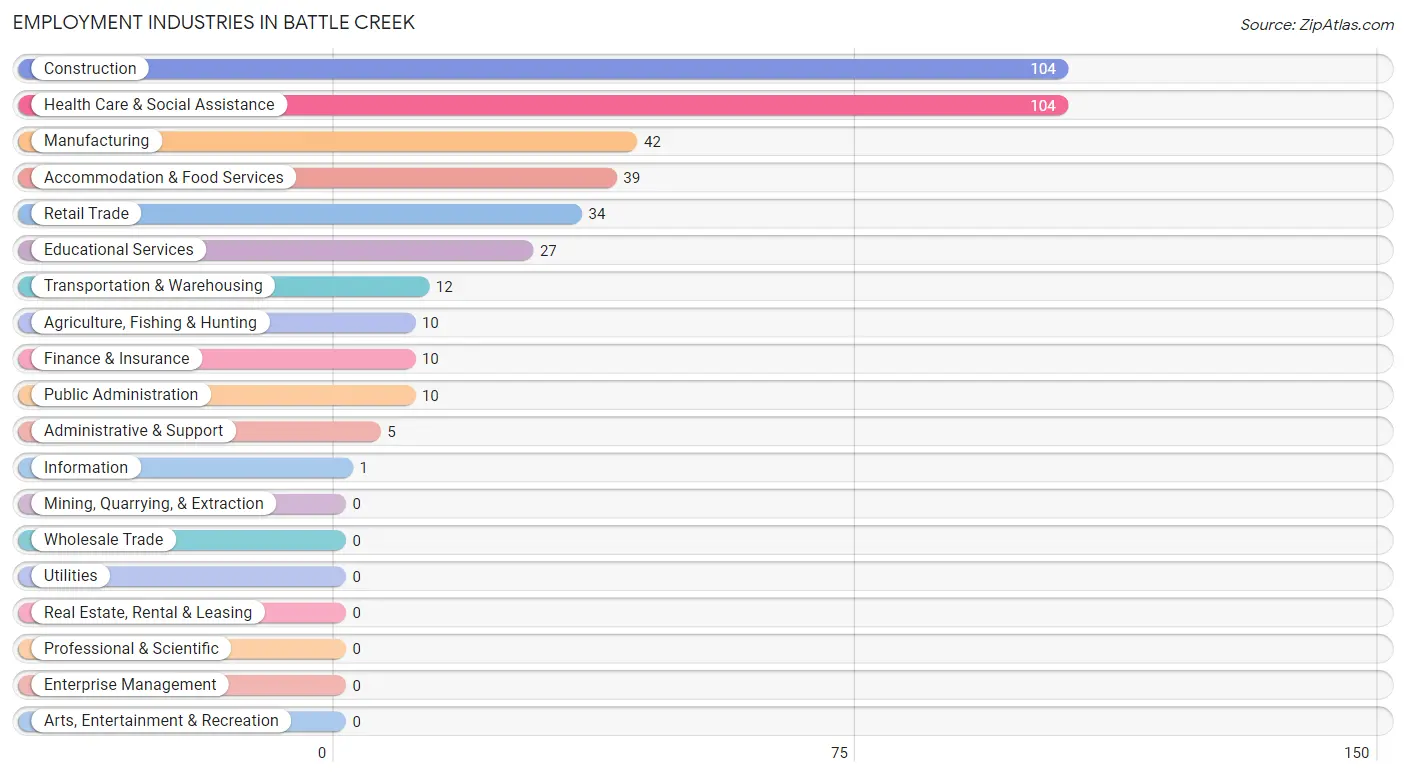
Employment Industries in Battle Creek
The major employment industries in Battle Creek include Construction (104 | 25.2%), Health Care & Social Assistance (104 | 25.2%), Manufacturing (42 | 10.2%), Accommodation & Food Services (39 | 9.5%), and Retail Trade (34 | 8.3%).
Employment Industries by Sex in Battle Creek
The Battle Creek industries that see more men than women are Agriculture, Fishing & Hunting (100.0%), Construction (80.8%), and Transportation & Warehousing (75.0%), whereas the industries that tend to have a higher number of women are Information (100.0%), Finance & Insurance (100.0%), and Health Care & Social Assistance (95.2%).
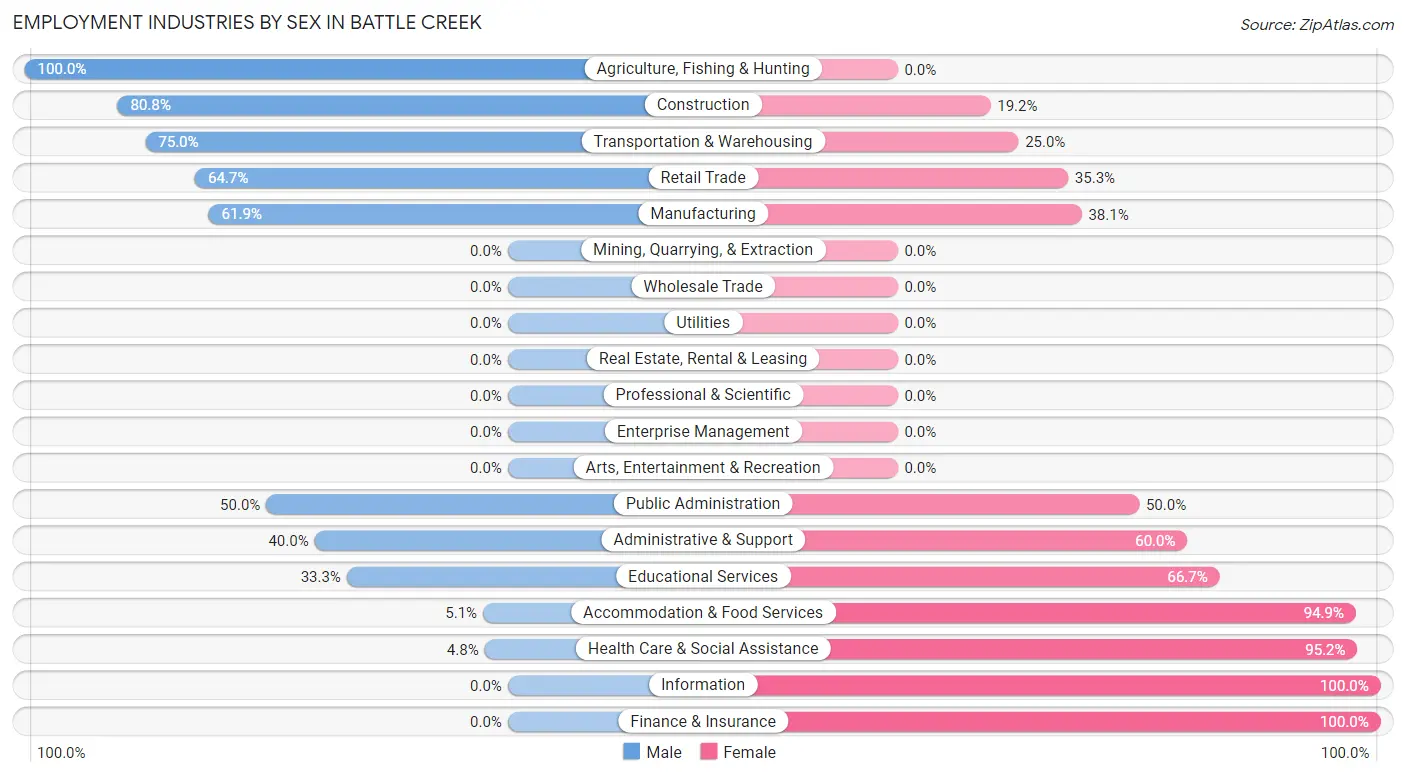
| Industry | Male | Female |
| Agriculture, Fishing & Hunting | 10 (100.0%) | 0 (0.0%) |
| Mining, Quarrying, & Extraction | 0 (0.0%) | 0 (0.0%) |
| Construction | 84 (80.8%) | 20 (19.2%) |
| Manufacturing | 26 (61.9%) | 16 (38.1%) |
| Wholesale Trade | 0 (0.0%) | 0 (0.0%) |
| Retail Trade | 22 (64.7%) | 12 (35.3%) |
| Transportation & Warehousing | 9 (75.0%) | 3 (25.0%) |
| Utilities | 0 (0.0%) | 0 (0.0%) |
| Information | 0 (0.0%) | 1 (100.0%) |
| Finance & Insurance | 0 (0.0%) | 10 (100.0%) |
| Real Estate, Rental & Leasing | 0 (0.0%) | 0 (0.0%) |
| Professional & Scientific | 0 (0.0%) | 0 (0.0%) |
| Enterprise Management | 0 (0.0%) | 0 (0.0%) |
| Administrative & Support | 2 (40.0%) | 3 (60.0%) |
| Educational Services | 9 (33.3%) | 18 (66.7%) |
| Health Care & Social Assistance | 5 (4.8%) | 99 (95.2%) |
| Arts, Entertainment & Recreation | 0 (0.0%) | 0 (0.0%) |
| Accommodation & Food Services | 2 (5.1%) | 37 (94.9%) |
| Public Administration | 5 (50.0%) | 5 (50.0%) |
| Total | 188 (45.6%) | 224 (54.4%) |
Education in Battle Creek
School Enrollment in Battle Creek
The most common levels of schooling among the 133 students in Battle Creek are middle school (40 | 30.1%), high school (38 | 28.6%), and elementary school (34 | 25.6%).
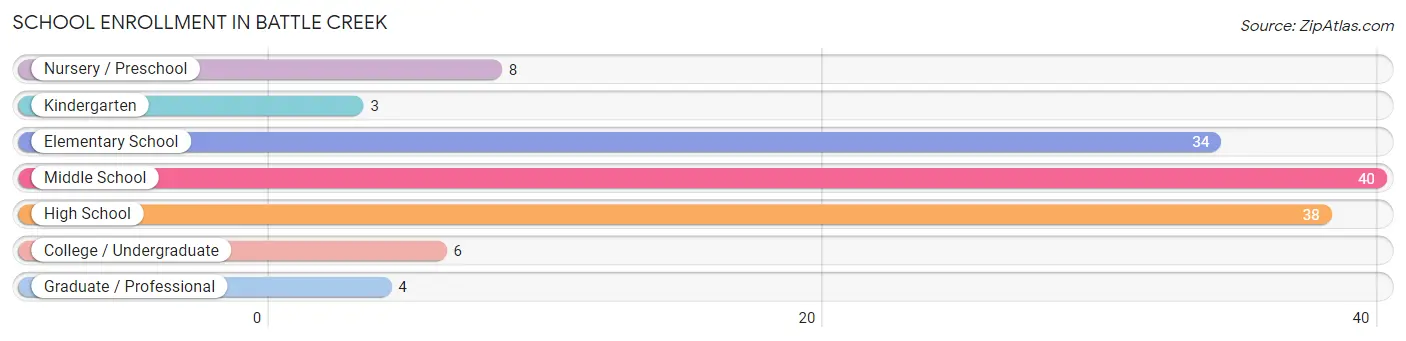
| School Level | # Students | % Students |
| Nursery / Preschool | 8 | 6.0% |
| Kindergarten | 3 | 2.3% |
| Elementary School | 34 | 25.6% |
| Middle School | 40 | 30.1% |
| High School | 38 | 28.6% |
| College / Undergraduate | 6 | 4.5% |
| Graduate / Professional | 4 | 3.0% |
| Total | 133 | 100.0% |
School Enrollment by Age by Funding Source in Battle Creek
Out of a total of 133 students who are enrolled in schools in Battle Creek, 2 (1.5%) attend a private institution, while the remaining 131 (98.5%) are enrolled in public schools. The age group of 18 to 19 year olds has the highest likelihood of being enrolled in private schools, with 2 (33.3% in the age bracket) enrolled. Conversely, the age group of 3 to 4 year olds has the lowest likelihood of being enrolled in a private school, with 6 (100.0% in the age bracket) attending a public institution.
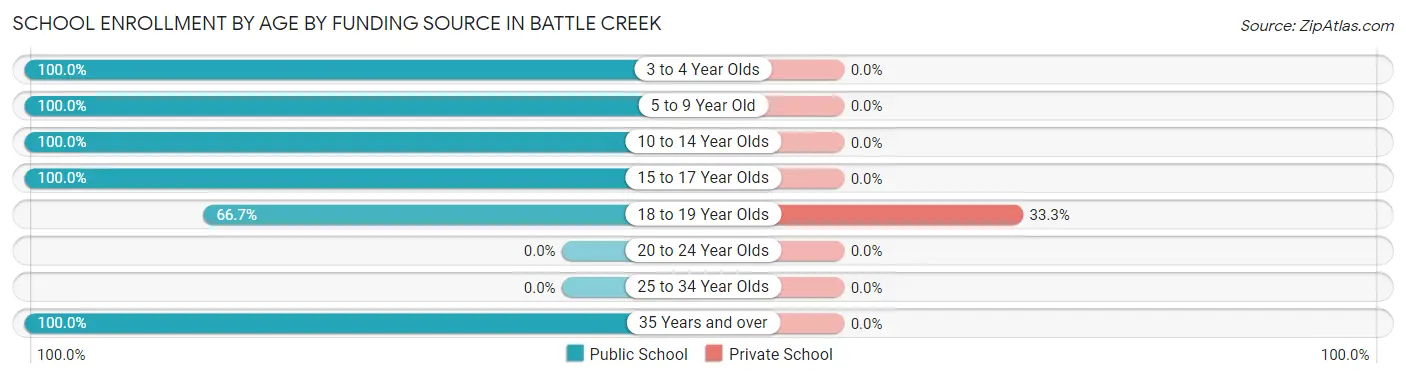
| Age Bracket | Public School | Private School |
| 3 to 4 Year Olds | 6 (100.0%) | 0 (0.0%) |
| 5 to 9 Year Old | 31 (100.0%) | 0 (0.0%) |
| 10 to 14 Year Olds | 57 (100.0%) | 0 (0.0%) |
| 15 to 17 Year Olds | 29 (100.0%) | 0 (0.0%) |
| 18 to 19 Year Olds | 4 (66.7%) | 2 (33.3%) |
| 20 to 24 Year Olds | 0 (0.0%) | 0 (0.0%) |
| 25 to 34 Year Olds | 0 (0.0%) | 0 (0.0%) |
| 35 Years and over | 4 (100.0%) | 0 (0.0%) |
| Total | 131 (98.5%) | 2 (1.5%) |
Educational Attainment by Field of Study in Battle Creek
Education (23 | 33.3%), business (16 | 23.2%), science & technology (9 | 13.0%), computers & mathematics (5 | 7.2%), and bio, nature & agricultural (4 | 5.8%) are the most common fields of study among 69 individuals in Battle Creek who have obtained a bachelor's degree or higher.
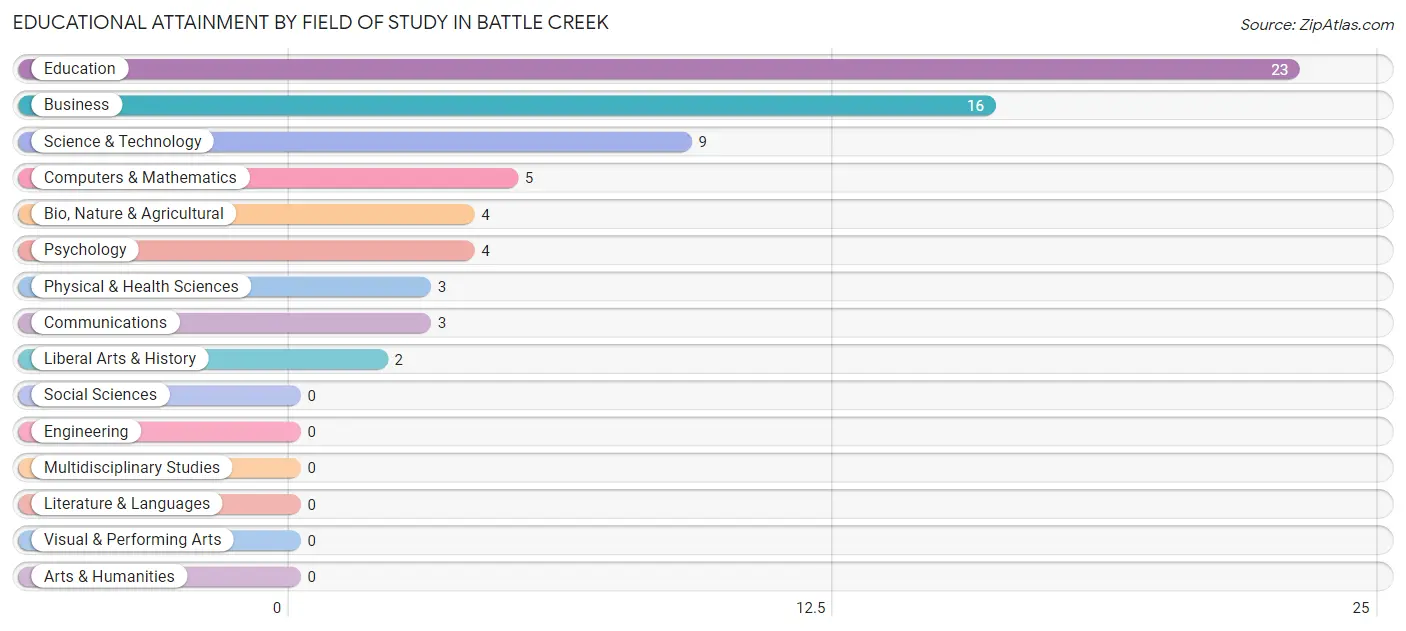
| Field of Study | # Graduates | % Graduates |
| Computers & Mathematics | 5 | 7.2% |
| Bio, Nature & Agricultural | 4 | 5.8% |
| Physical & Health Sciences | 3 | 4.3% |
| Psychology | 4 | 5.8% |
| Social Sciences | 0 | 0.0% |
| Engineering | 0 | 0.0% |
| Multidisciplinary Studies | 0 | 0.0% |
| Science & Technology | 9 | 13.0% |
| Business | 16 | 23.2% |
| Education | 23 | 33.3% |
| Literature & Languages | 0 | 0.0% |
| Liberal Arts & History | 2 | 2.9% |
| Visual & Performing Arts | 0 | 0.0% |
| Communications | 3 | 4.3% |
| Arts & Humanities | 0 | 0.0% |
| Total | 69 | 100.0% |
Transportation & Commute in Battle Creek
Vehicle Availability by Sex in Battle Creek
The most prevalent vehicle ownership categories in Battle Creek are males with 2 vehicles (67, accounting for 37.2%) and females with 2 vehicles (73, making up 31.6%).
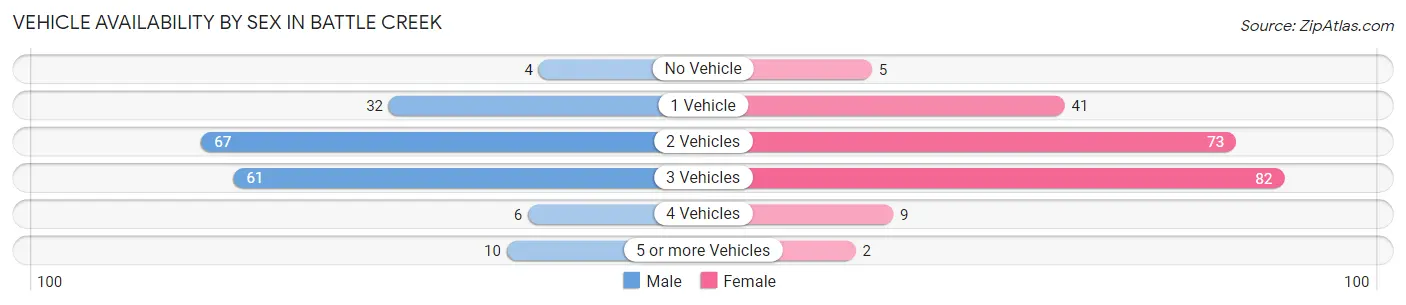
| Vehicles Available | Male | Female |
| No Vehicle | 4 (2.2%) | 5 (2.4%) |
| 1 Vehicle | 32 (17.8%) | 41 (19.3%) |
| 2 Vehicles | 67 (37.2%) | 73 (34.4%) |
| 3 Vehicles | 61 (33.9%) | 82 (38.7%) |
| 4 Vehicles | 6 (3.3%) | 9 (4.3%) |
| 5 or more Vehicles | 10 (5.6%) | 2 (0.9%) |
| Total | 180 (100.0%) | 212 (100.0%) |
Commute Time in Battle Creek
The most frequently occuring commute durations in Battle Creek are 10 to 14 minutes (109 commuters, 34.0%), 15 to 19 minutes (83 commuters, 25.9%), and 20 to 24 minutes (33 commuters, 10.3%).
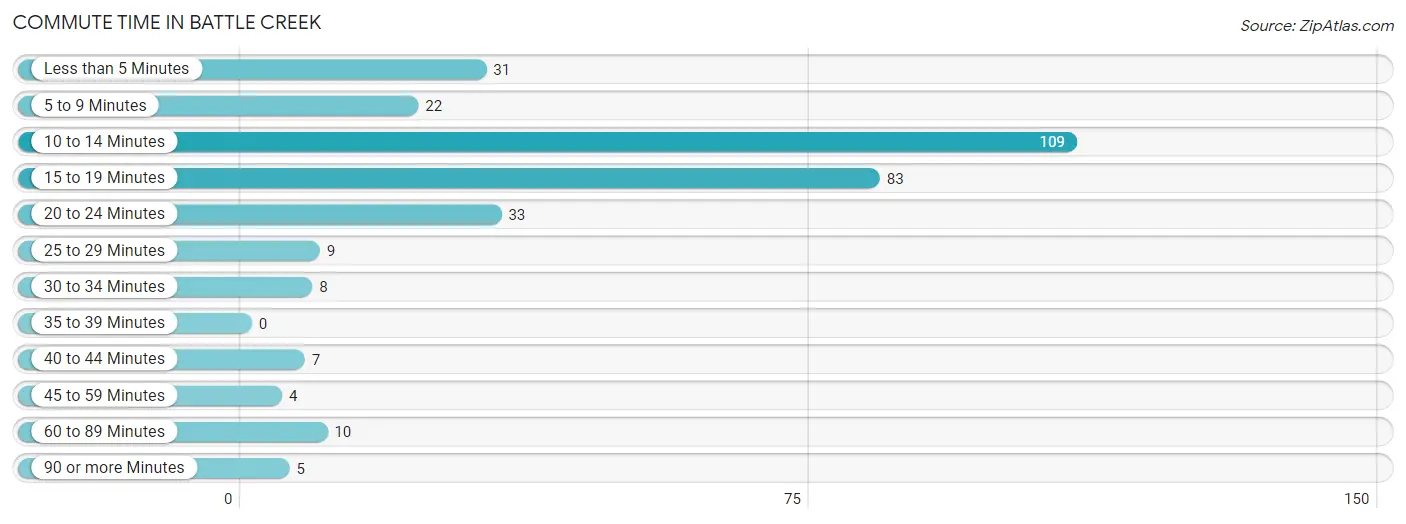
| Commute Time | # Commuters | % Commuters |
| Less than 5 Minutes | 31 | 9.7% |
| 5 to 9 Minutes | 22 | 6.9% |
| 10 to 14 Minutes | 109 | 34.0% |
| 15 to 19 Minutes | 83 | 25.9% |
| 20 to 24 Minutes | 33 | 10.3% |
| 25 to 29 Minutes | 9 | 2.8% |
| 30 to 34 Minutes | 8 | 2.5% |
| 35 to 39 Minutes | 0 | 0.0% |
| 40 to 44 Minutes | 7 | 2.2% |
| 45 to 59 Minutes | 4 | 1.3% |
| 60 to 89 Minutes | 10 | 3.1% |
| 90 or more Minutes | 5 | 1.6% |
Commute Time by Sex in Battle Creek
The most common commute times in Battle Creek are 10 to 14 minutes (53 commuters, 35.6%) for males and 15 to 19 minutes (64 commuters, 37.2%) for females.
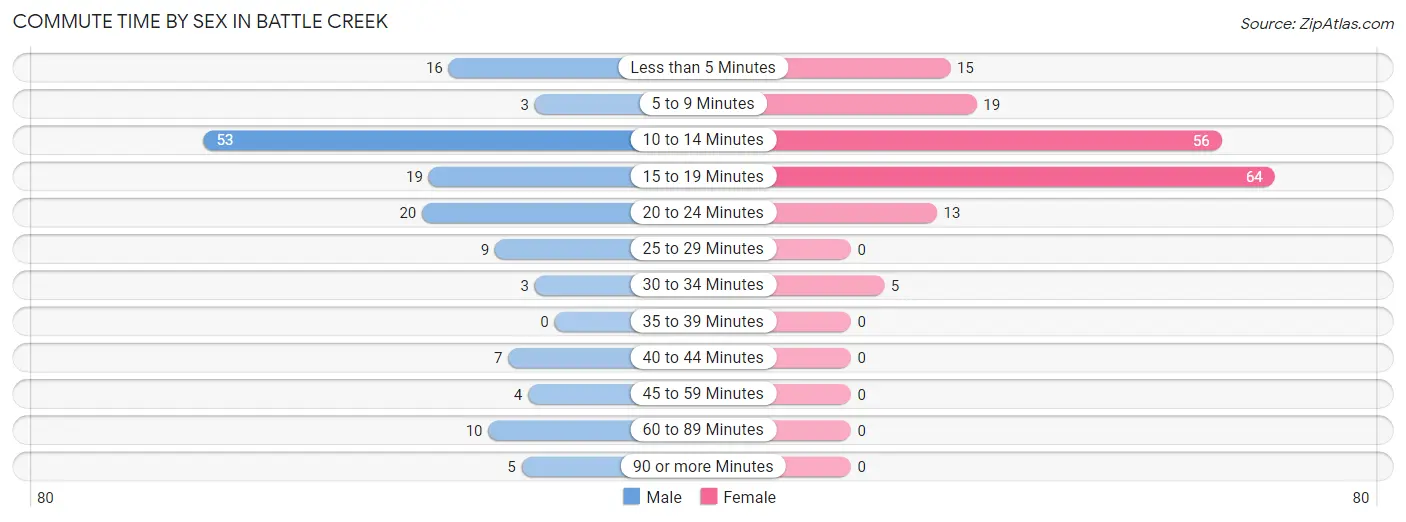
| Commute Time | Male | Female |
| Less than 5 Minutes | 16 (10.7%) | 15 (8.7%) |
| 5 to 9 Minutes | 3 (2.0%) | 19 (11.1%) |
| 10 to 14 Minutes | 53 (35.6%) | 56 (32.6%) |
| 15 to 19 Minutes | 19 (12.8%) | 64 (37.2%) |
| 20 to 24 Minutes | 20 (13.4%) | 13 (7.6%) |
| 25 to 29 Minutes | 9 (6.0%) | 0 (0.0%) |
| 30 to 34 Minutes | 3 (2.0%) | 5 (2.9%) |
| 35 to 39 Minutes | 0 (0.0%) | 0 (0.0%) |
| 40 to 44 Minutes | 7 (4.7%) | 0 (0.0%) |
| 45 to 59 Minutes | 4 (2.7%) | 0 (0.0%) |
| 60 to 89 Minutes | 10 (6.7%) | 0 (0.0%) |
| 90 or more Minutes | 5 (3.4%) | 0 (0.0%) |
Time of Departure to Work by Sex in Battle Creek
The most frequent times of departure to work in Battle Creek are 7:00 AM to 7:29 AM (31, 20.8%) for males and 7:00 AM to 7:29 AM (52, 30.2%) for females.
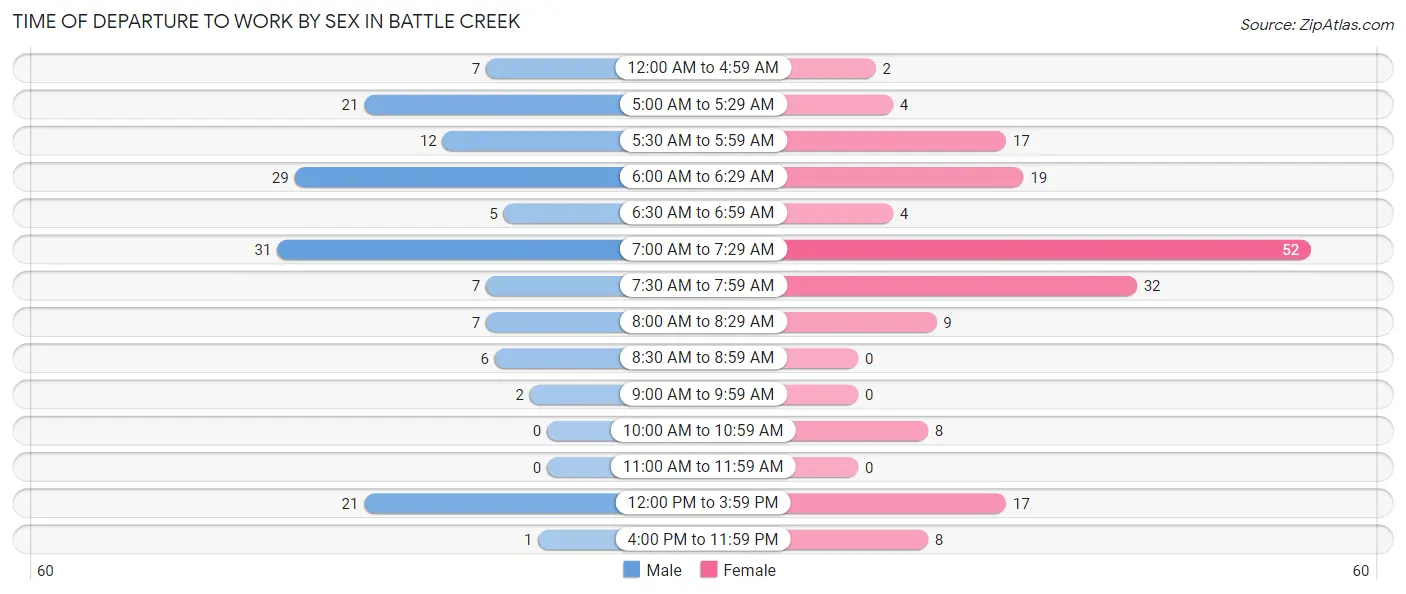
| Time of Departure | Male | Female |
| 12:00 AM to 4:59 AM | 7 (4.7%) | 2 (1.2%) |
| 5:00 AM to 5:29 AM | 21 (14.1%) | 4 (2.3%) |
| 5:30 AM to 5:59 AM | 12 (8.1%) | 17 (9.9%) |
| 6:00 AM to 6:29 AM | 29 (19.5%) | 19 (11.1%) |
| 6:30 AM to 6:59 AM | 5 (3.4%) | 4 (2.3%) |
| 7:00 AM to 7:29 AM | 31 (20.8%) | 52 (30.2%) |
| 7:30 AM to 7:59 AM | 7 (4.7%) | 32 (18.6%) |
| 8:00 AM to 8:29 AM | 7 (4.7%) | 9 (5.2%) |
| 8:30 AM to 8:59 AM | 6 (4.0%) | 0 (0.0%) |
| 9:00 AM to 9:59 AM | 2 (1.3%) | 0 (0.0%) |
| 10:00 AM to 10:59 AM | 0 (0.0%) | 8 (4.6%) |
| 11:00 AM to 11:59 AM | 0 (0.0%) | 0 (0.0%) |
| 12:00 PM to 3:59 PM | 21 (14.1%) | 17 (9.9%) |
| 4:00 PM to 11:59 PM | 1 (0.7%) | 8 (4.6%) |
| Total | 149 (100.0%) | 172 (100.0%) |
Housing Occupancy in Battle Creek
Occupancy by Ownership in Battle Creek
Of the total 379 dwellings in Battle Creek, owner-occupied units account for 288 (76.0%), while renter-occupied units make up 91 (24.0%).
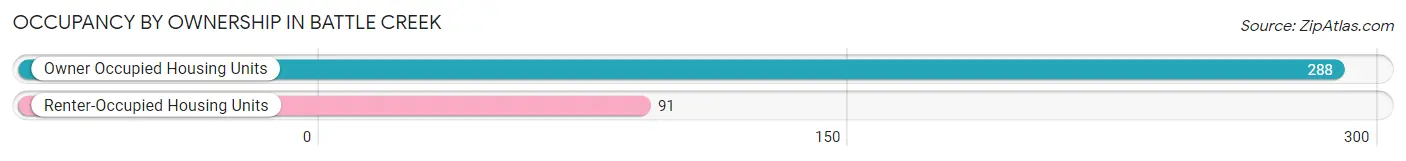
| Occupancy | # Housing Units | % Housing Units |
| Owner Occupied Housing Units | 288 | 76.0% |
| Renter-Occupied Housing Units | 91 | 24.0% |
| Total Occupied Housing Units | 379 | 100.0% |
Occupancy by Household Size in Battle Creek
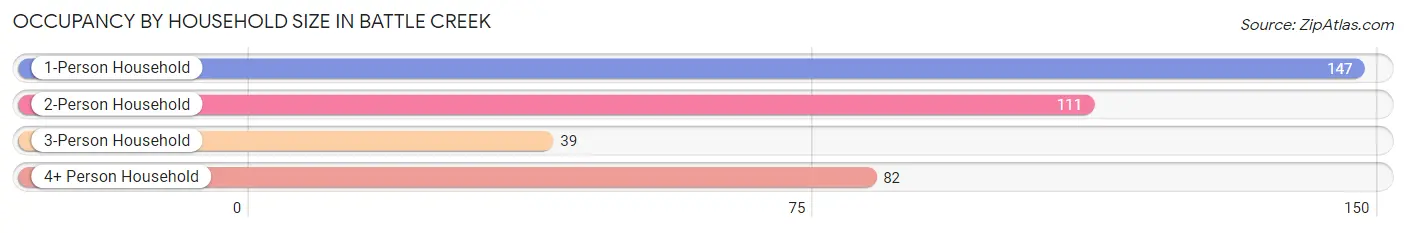
| Household Size | # Housing Units | % Housing Units |
| 1-Person Household | 147 | 38.8% |
| 2-Person Household | 111 | 29.3% |
| 3-Person Household | 39 | 10.3% |
| 4+ Person Household | 82 | 21.6% |
| Total Housing Units | 379 | 100.0% |
Occupancy by Ownership by Household Size in Battle Creek
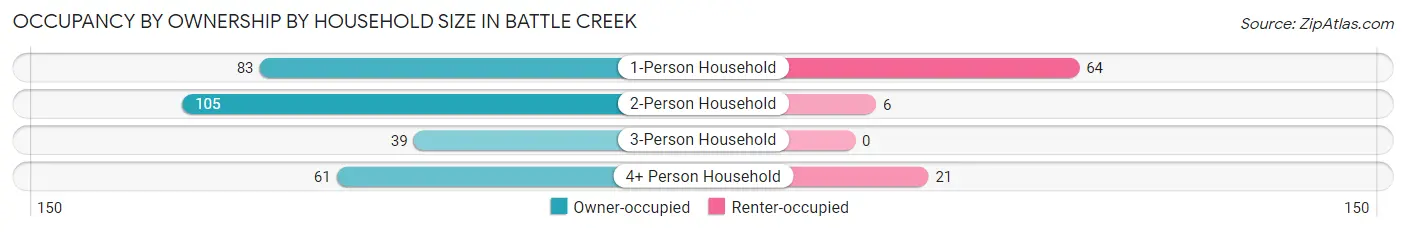
| Household Size | Owner-occupied | Renter-occupied |
| 1-Person Household | 83 (56.5%) | 64 (43.5%) |
| 2-Person Household | 105 (94.6%) | 6 (5.4%) |
| 3-Person Household | 39 (100.0%) | 0 (0.0%) |
| 4+ Person Household | 61 (74.4%) | 21 (25.6%) |
| Total Housing Units | 288 (76.0%) | 91 (24.0%) |
Occupancy by Educational Attainment in Battle Creek
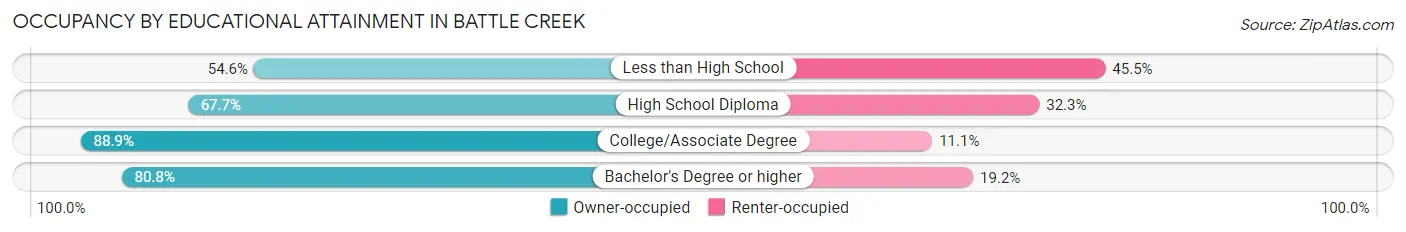
| Household Size | Owner-occupied | Renter-occupied |
| Less than High School | 18 (54.5%) | 15 (45.5%) |
| High School Diploma | 113 (67.7%) | 54 (32.3%) |
| College/Associate Degree | 136 (88.9%) | 17 (11.1%) |
| Bachelor's Degree or higher | 21 (80.8%) | 5 (19.2%) |
Occupancy by Age of Householder in Battle Creek
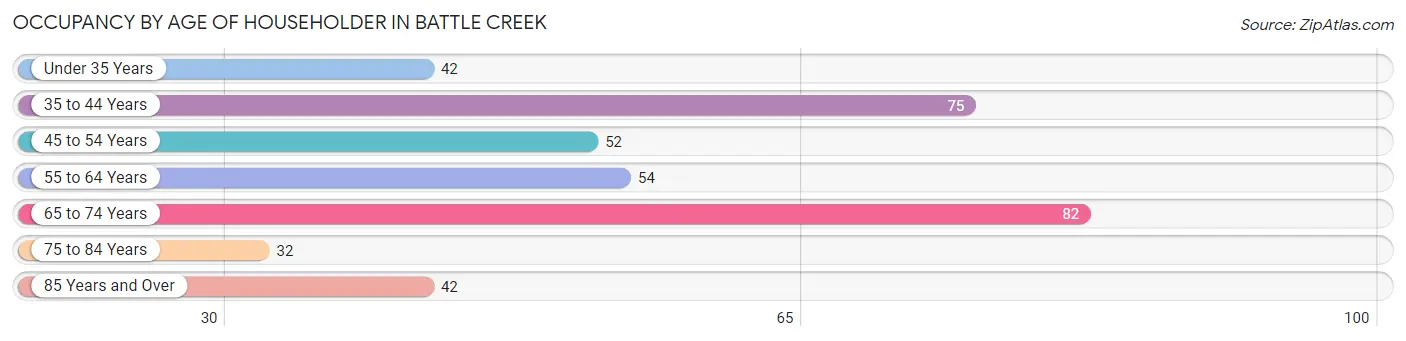
| Age Bracket | # Households | % Households |
| Under 35 Years | 42 | 11.1% |
| 35 to 44 Years | 75 | 19.8% |
| 45 to 54 Years | 52 | 13.7% |
| 55 to 64 Years | 54 | 14.2% |
| 65 to 74 Years | 82 | 21.6% |
| 75 to 84 Years | 32 | 8.4% |
| 85 Years and Over | 42 | 11.1% |
| Total | 379 | 100.0% |
Housing Finances in Battle Creek
Median Income by Occupancy in Battle Creek
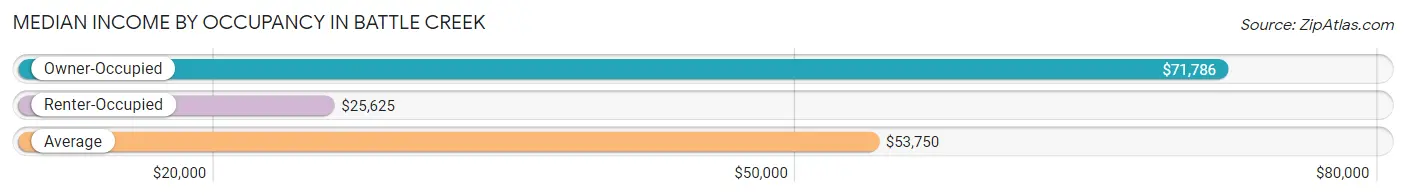
| Occupancy Type | # Households | Median Income |
| Owner-Occupied | 288 (76.0%) | $71,786 |
| Renter-Occupied | 91 (24.0%) | $25,625 |
| Average | 379 (100.0%) | $53,750 |
Occupancy by Householder Income Bracket in Battle Creek
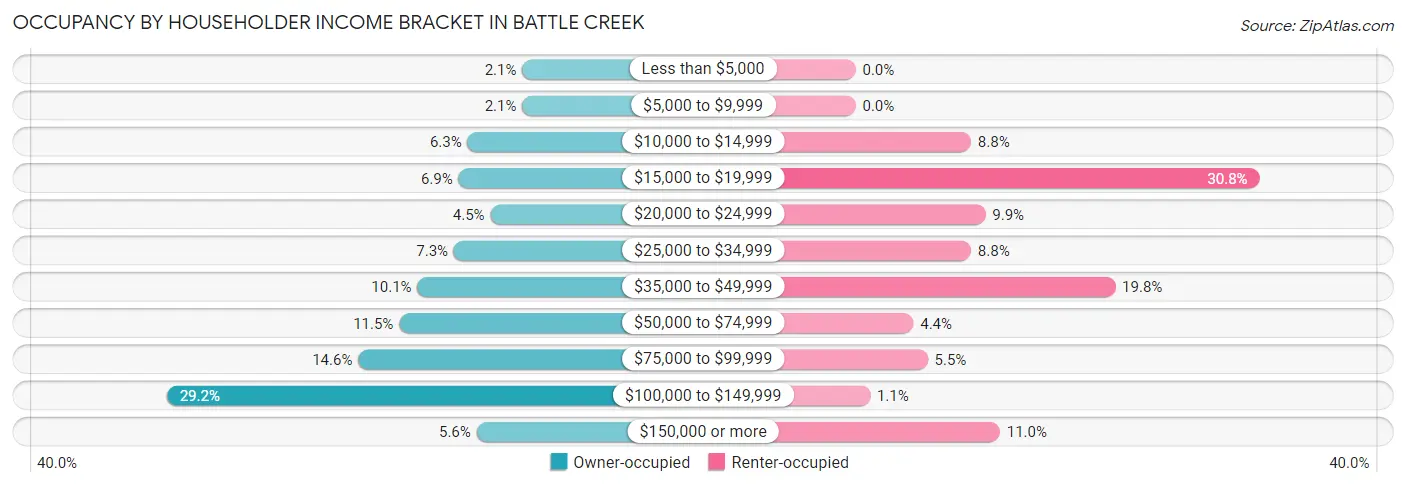
| Income Bracket | Owner-occupied | Renter-occupied |
| Less than $5,000 | 6 (2.1%) | 0 (0.0%) |
| $5,000 to $9,999 | 6 (2.1%) | 0 (0.0%) |
| $10,000 to $14,999 | 18 (6.2%) | 8 (8.8%) |
| $15,000 to $19,999 | 20 (6.9%) | 28 (30.8%) |
| $20,000 to $24,999 | 13 (4.5%) | 9 (9.9%) |
| $25,000 to $34,999 | 21 (7.3%) | 8 (8.8%) |
| $35,000 to $49,999 | 29 (10.1%) | 18 (19.8%) |
| $50,000 to $74,999 | 33 (11.5%) | 4 (4.4%) |
| $75,000 to $99,999 | 42 (14.6%) | 5 (5.5%) |
| $100,000 to $149,999 | 84 (29.2%) | 1 (1.1%) |
| $150,000 or more | 16 (5.6%) | 10 (11.0%) |
| Total | 288 (100.0%) | 91 (100.0%) |
Monthly Housing Cost Tiers in Battle Creek
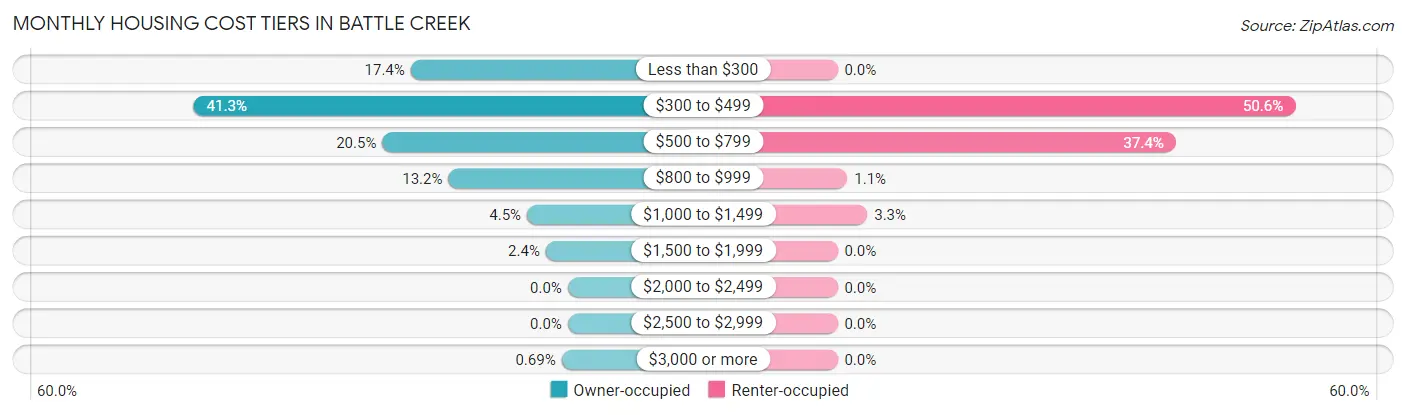
| Monthly Cost | Owner-occupied | Renter-occupied |
| Less than $300 | 50 (17.4%) | 0 (0.0%) |
| $300 to $499 | 119 (41.3%) | 46 (50.5%) |
| $500 to $799 | 59 (20.5%) | 34 (37.4%) |
| $800 to $999 | 38 (13.2%) | 1 (1.1%) |
| $1,000 to $1,499 | 13 (4.5%) | 3 (3.3%) |
| $1,500 to $1,999 | 7 (2.4%) | 0 (0.0%) |
| $2,000 to $2,499 | 0 (0.0%) | 0 (0.0%) |
| $2,500 to $2,999 | 0 (0.0%) | 0 (0.0%) |
| $3,000 or more | 2 (0.7%) | 0 (0.0%) |
| Total | 288 (100.0%) | 91 (100.0%) |
Physical Housing Characteristics in Battle Creek
Housing Structures in Battle Creek
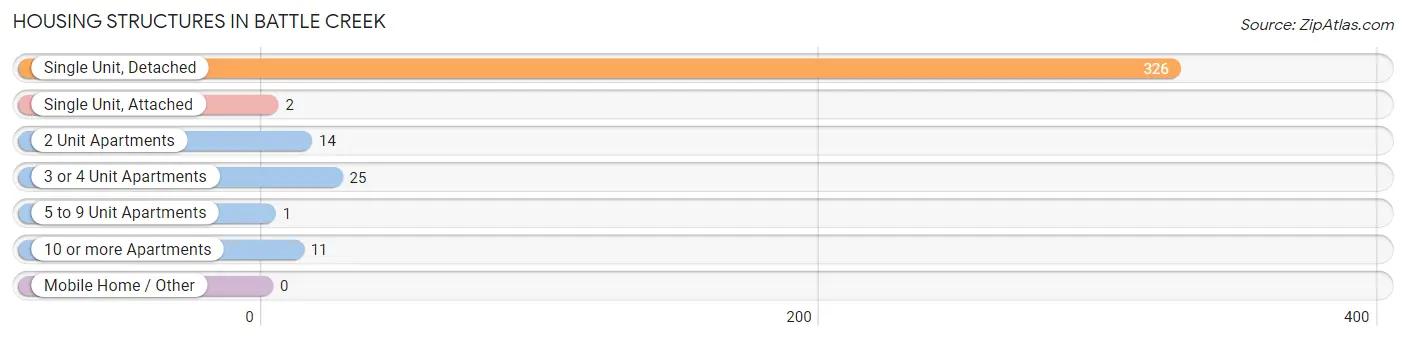
| Structure Type | # Housing Units | % Housing Units |
| Single Unit, Detached | 326 | 86.0% |
| Single Unit, Attached | 2 | 0.5% |
| 2 Unit Apartments | 14 | 3.7% |
| 3 or 4 Unit Apartments | 25 | 6.6% |
| 5 to 9 Unit Apartments | 1 | 0.3% |
| 10 or more Apartments | 11 | 2.9% |
| Mobile Home / Other | 0 | 0.0% |
| Total | 379 | 100.0% |
Housing Structures by Occupancy in Battle Creek
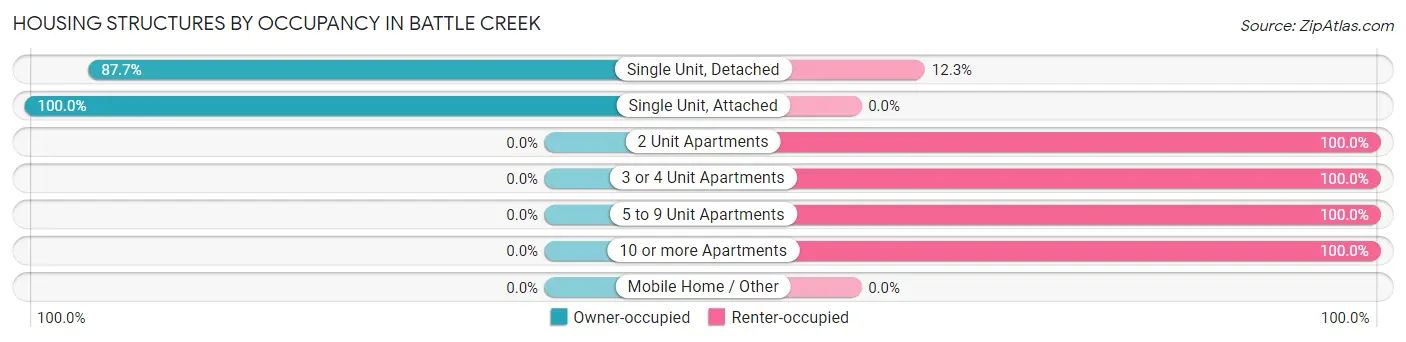
| Structure Type | Owner-occupied | Renter-occupied |
| Single Unit, Detached | 286 (87.7%) | 40 (12.3%) |
| Single Unit, Attached | 2 (100.0%) | 0 (0.0%) |
| 2 Unit Apartments | 0 (0.0%) | 14 (100.0%) |
| 3 or 4 Unit Apartments | 0 (0.0%) | 25 (100.0%) |
| 5 to 9 Unit Apartments | 0 (0.0%) | 1 (100.0%) |
| 10 or more Apartments | 0 (0.0%) | 11 (100.0%) |
| Mobile Home / Other | 0 (0.0%) | 0 (0.0%) |
| Total | 288 (76.0%) | 91 (24.0%) |
Housing Structures by Number of Rooms in Battle Creek
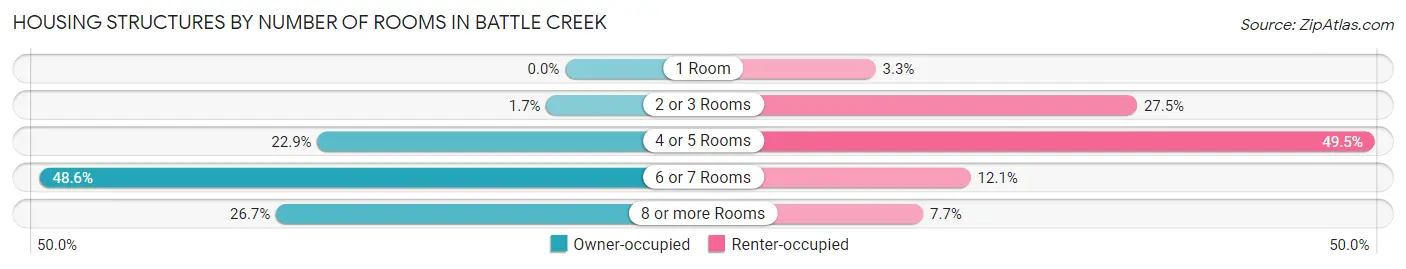
| Number of Rooms | Owner-occupied | Renter-occupied |
| 1 Room | 0 (0.0%) | 3 (3.3%) |
| 2 or 3 Rooms | 5 (1.7%) | 25 (27.5%) |
| 4 or 5 Rooms | 66 (22.9%) | 45 (49.4%) |
| 6 or 7 Rooms | 140 (48.6%) | 11 (12.1%) |
| 8 or more Rooms | 77 (26.7%) | 7 (7.7%) |
| Total | 288 (100.0%) | 91 (100.0%) |
Housing Structure by Heating Type in Battle Creek
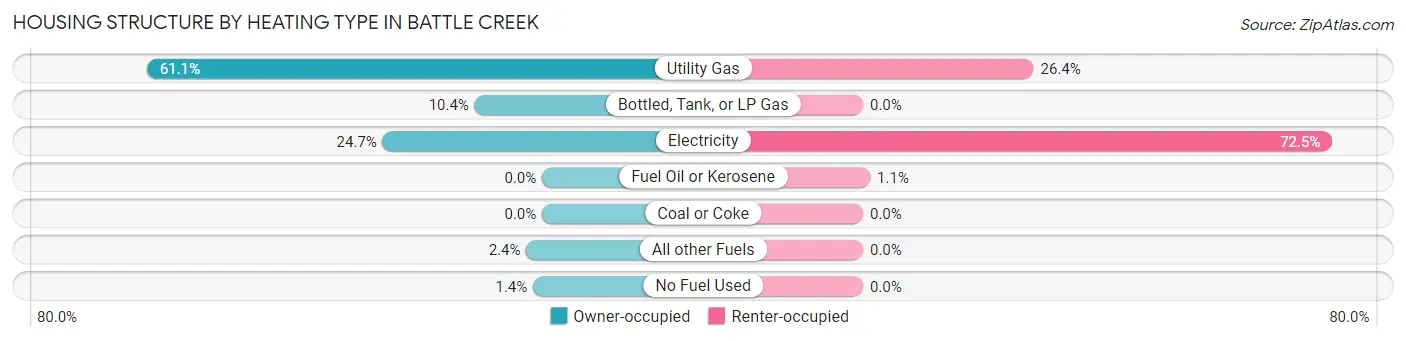
| Heating Type | Owner-occupied | Renter-occupied |
| Utility Gas | 176 (61.1%) | 24 (26.4%) |
| Bottled, Tank, or LP Gas | 30 (10.4%) | 0 (0.0%) |
| Electricity | 71 (24.6%) | 66 (72.5%) |
| Fuel Oil or Kerosene | 0 (0.0%) | 1 (1.1%) |
| Coal or Coke | 0 (0.0%) | 0 (0.0%) |
| All other Fuels | 7 (2.4%) | 0 (0.0%) |
| No Fuel Used | 4 (1.4%) | 0 (0.0%) |
| Total | 288 (100.0%) | 91 (100.0%) |
Household Vehicle Usage in Battle Creek
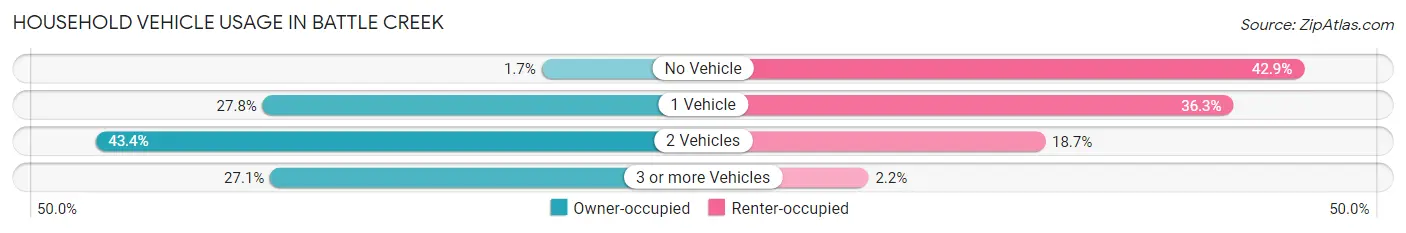
| Vehicles per Household | Owner-occupied | Renter-occupied |
| No Vehicle | 5 (1.7%) | 39 (42.9%) |
| 1 Vehicle | 80 (27.8%) | 33 (36.3%) |
| 2 Vehicles | 125 (43.4%) | 17 (18.7%) |
| 3 or more Vehicles | 78 (27.1%) | 2 (2.2%) |
| Total | 288 (100.0%) | 91 (100.0%) |
Real Estate & Mortgages in Battle Creek
Real Estate and Mortgage Overview in Battle Creek
| Characteristic | Without Mortgage | With Mortgage |
| Housing Units | 191 | 97 |
| Median Property Value | $62,600 | $72,900 |
| Median Household Income | $57,083 | $0 |
| Monthly Housing Costs | $389 | $0 |
| Real Estate Taxes | $709 | $4 |
Property Value by Mortgage Status in Battle Creek
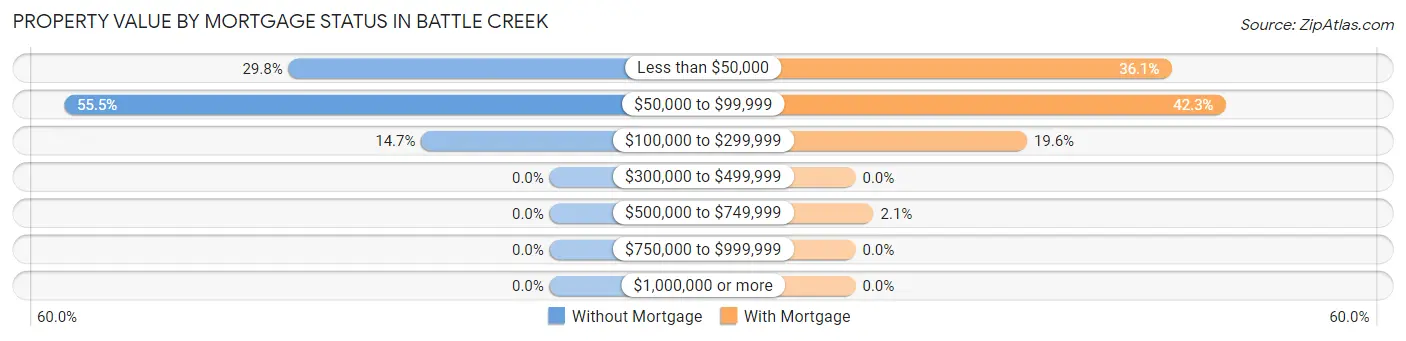
| Property Value | Without Mortgage | With Mortgage |
| Less than $50,000 | 57 (29.8%) | 35 (36.1%) |
| $50,000 to $99,999 | 106 (55.5%) | 41 (42.3%) |
| $100,000 to $299,999 | 28 (14.7%) | 19 (19.6%) |
| $300,000 to $499,999 | 0 (0.0%) | 0 (0.0%) |
| $500,000 to $749,999 | 0 (0.0%) | 2 (2.1%) |
| $750,000 to $999,999 | 0 (0.0%) | 0 (0.0%) |
| $1,000,000 or more | 0 (0.0%) | 0 (0.0%) |
| Total | 191 (100.0%) | 97 (100.0%) |
Household Income by Mortgage Status in Battle Creek
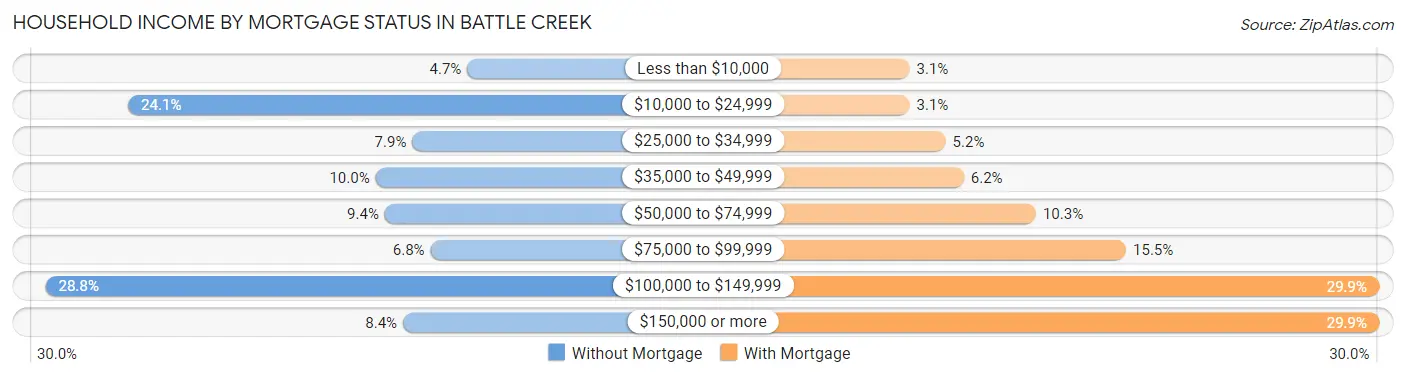
| Household Income | Without Mortgage | With Mortgage |
| Less than $10,000 | 9 (4.7%) | 3 (3.1%) |
| $10,000 to $24,999 | 46 (24.1%) | 3 (3.1%) |
| $25,000 to $34,999 | 15 (7.9%) | 5 (5.1%) |
| $35,000 to $49,999 | 19 (10.0%) | 6 (6.2%) |
| $50,000 to $74,999 | 18 (9.4%) | 10 (10.3%) |
| $75,000 to $99,999 | 13 (6.8%) | 15 (15.5%) |
| $100,000 to $149,999 | 55 (28.8%) | 29 (29.9%) |
| $150,000 or more | 16 (8.4%) | 29 (29.9%) |
| Total | 191 (100.0%) | 97 (100.0%) |
Property Value to Household Income Ratio in Battle Creek
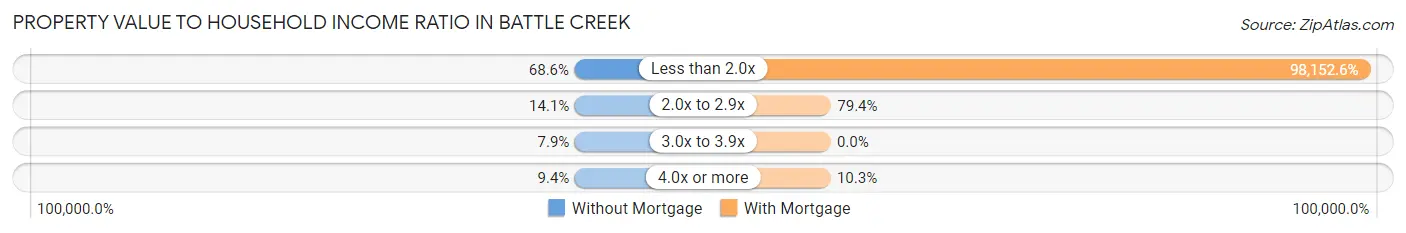
| Value-to-Income Ratio | Without Mortgage | With Mortgage |
| Less than 2.0x | 131 (68.6%) | 95,208 (98,152.6%) |
| 2.0x to 2.9x | 27 (14.1%) | 77 (79.4%) |
| 3.0x to 3.9x | 15 (7.9%) | 0 (0.0%) |
| 4.0x or more | 18 (9.4%) | 10 (10.3%) |
| Total | 191 (100.0%) | 97 (100.0%) |
Real Estate Taxes by Mortgage Status in Battle Creek
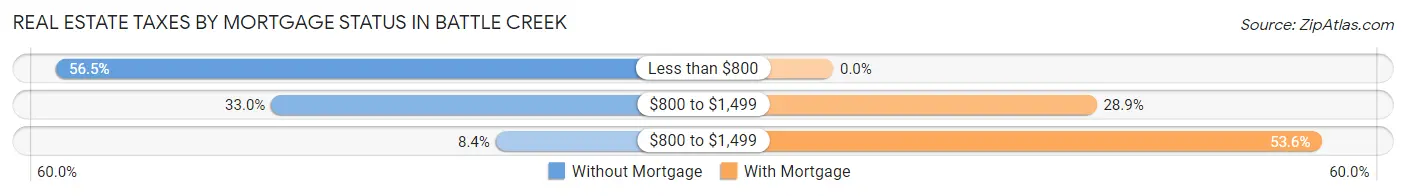
| Property Taxes | Without Mortgage | With Mortgage |
| Less than $800 | 108 (56.5%) | 0 (0.0%) |
| $800 to $1,499 | 63 (33.0%) | 28 (28.9%) |
| $800 to $1,499 | 16 (8.4%) | 52 (53.6%) |
| Total | 191 (100.0%) | 97 (100.0%) |
Health & Disability in Battle Creek
Health Insurance Coverage by Age in Battle Creek
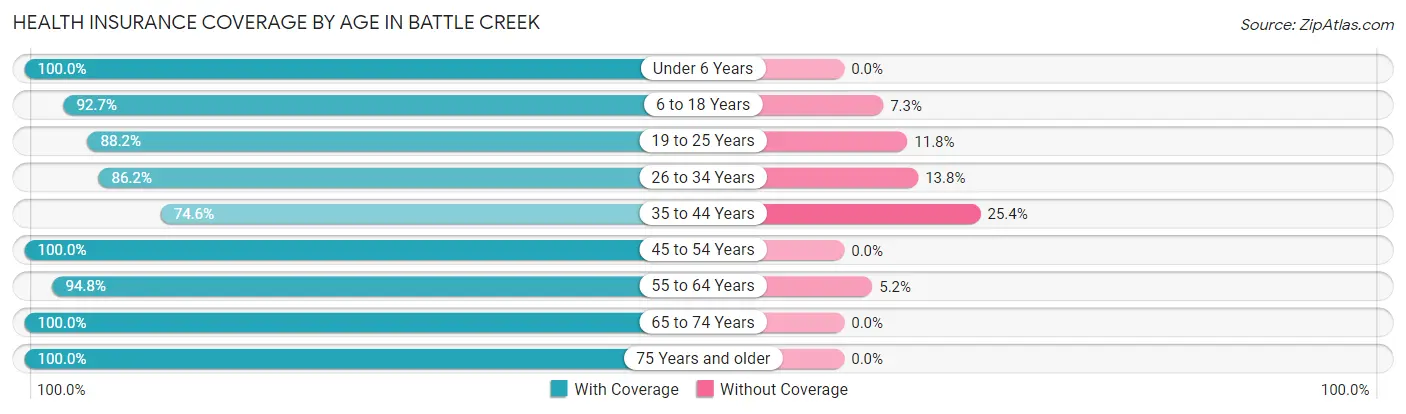
| Age Bracket | With Coverage | Without Coverage |
| Under 6 Years | 26 (100.0%) | 0 (0.0%) |
| 6 to 18 Years | 166 (92.7%) | 13 (7.3%) |
| 19 to 25 Years | 15 (88.2%) | 2 (11.8%) |
| 26 to 34 Years | 25 (86.2%) | 4 (13.8%) |
| 35 to 44 Years | 91 (74.6%) | 31 (25.4%) |
| 45 to 54 Years | 95 (100.0%) | 0 (0.0%) |
| 55 to 64 Years | 109 (94.8%) | 6 (5.2%) |
| 65 to 74 Years | 112 (100.0%) | 0 (0.0%) |
| 75 Years and older | 98 (100.0%) | 0 (0.0%) |
| Total | 737 (92.9%) | 56 (7.1%) |
Health Insurance Coverage by Citizenship Status in Battle Creek
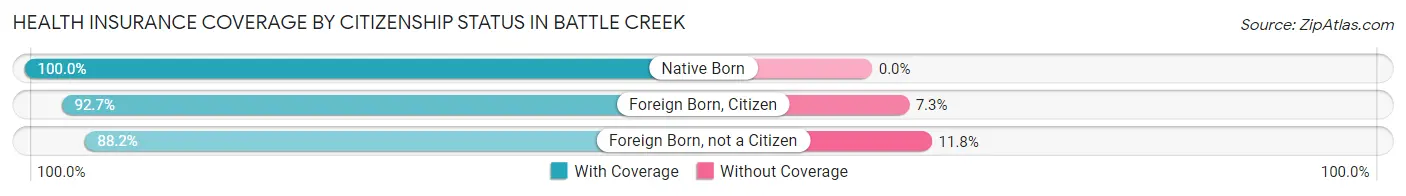
| Citizenship Status | With Coverage | Without Coverage |
| Native Born | 26 (100.0%) | 0 (0.0%) |
| Foreign Born, Citizen | 166 (92.7%) | 13 (7.3%) |
| Foreign Born, not a Citizen | 15 (88.2%) | 2 (11.8%) |
Health Insurance Coverage by Household Income in Battle Creek
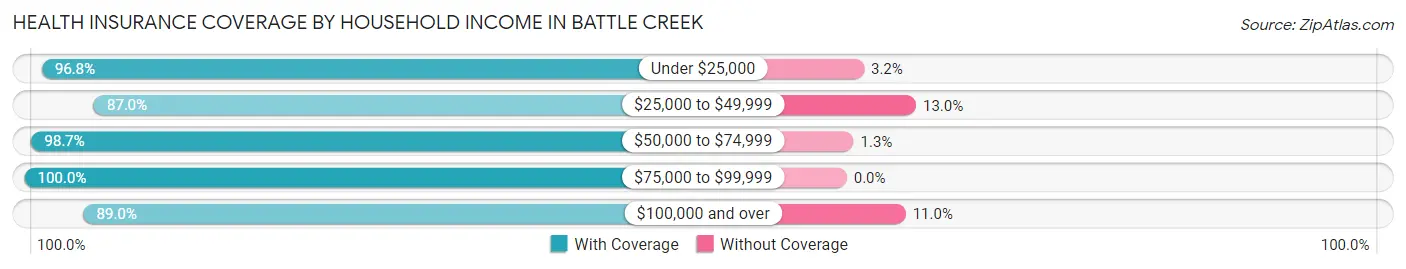
| Household Income | With Coverage | Without Coverage |
| Under $25,000 | 150 (96.8%) | 5 (3.2%) |
| $25,000 to $49,999 | 114 (87.0%) | 17 (13.0%) |
| $50,000 to $74,999 | 78 (98.7%) | 1 (1.3%) |
| $75,000 to $99,999 | 129 (100.0%) | 0 (0.0%) |
| $100,000 and over | 266 (89.0%) | 33 (11.0%) |
Public vs Private Health Insurance Coverage by Age in Battle Creek
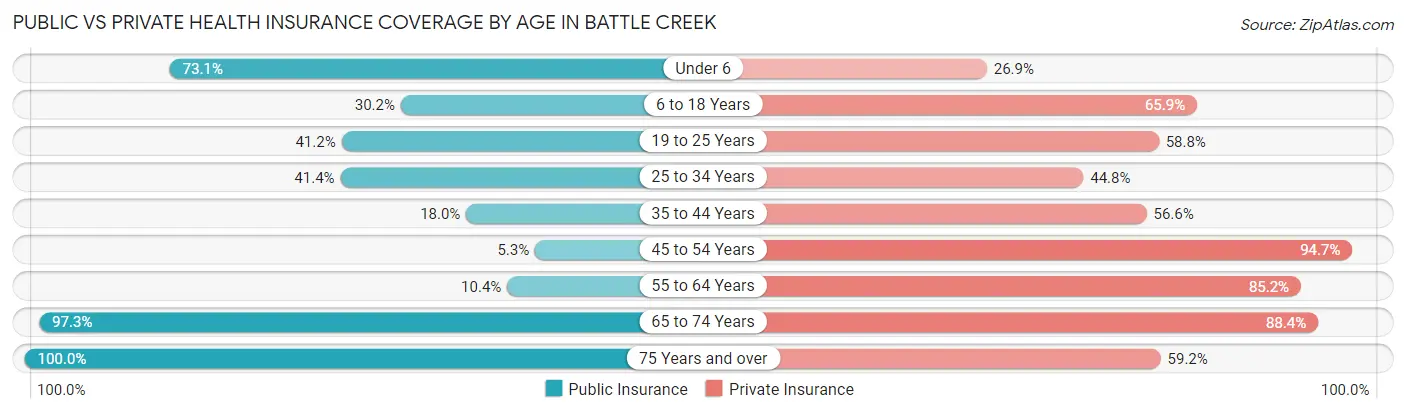
| Age Bracket | Public Insurance | Private Insurance |
| Under 6 | 19 (73.1%) | 7 (26.9%) |
| 6 to 18 Years | 54 (30.2%) | 118 (65.9%) |
| 19 to 25 Years | 7 (41.2%) | 10 (58.8%) |
| 25 to 34 Years | 12 (41.4%) | 13 (44.8%) |
| 35 to 44 Years | 22 (18.0%) | 69 (56.6%) |
| 45 to 54 Years | 5 (5.3%) | 90 (94.7%) |
| 55 to 64 Years | 12 (10.4%) | 98 (85.2%) |
| 65 to 74 Years | 109 (97.3%) | 99 (88.4%) |
| 75 Years and over | 98 (100.0%) | 58 (59.2%) |
| Total | 338 (42.6%) | 562 (70.9%) |
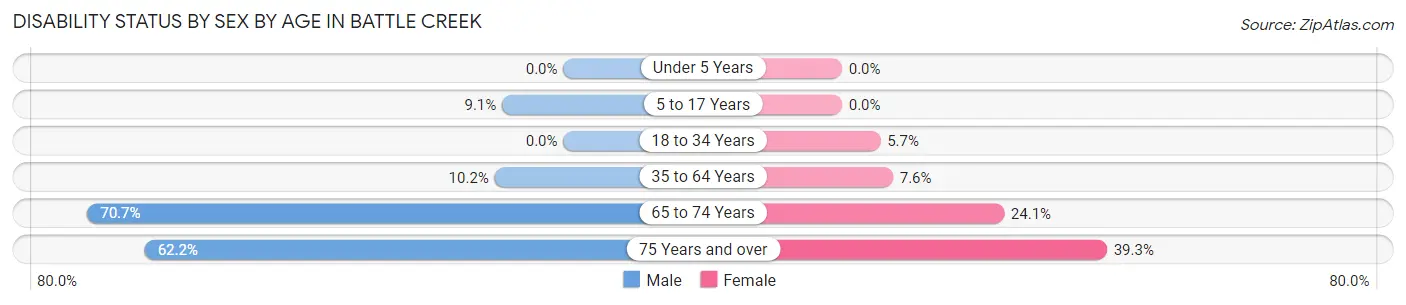
Disability Status by Sex by Age in Battle Creek
| Age Bracket | Male | Female |
| Under 5 Years | 0 (0.0%) | 0 (0.0%) |
| 5 to 17 Years | 7 (9.1%) | 0 (0.0%) |
| 18 to 34 Years | 0 (0.0%) | 2 (5.7%) |
| 35 to 64 Years | 15 (10.2%) | 14 (7.6%) |
| 65 to 74 Years | 41 (70.7%) | 13 (24.1%) |
| 75 Years and over | 23 (62.2%) | 24 (39.3%) |
Disability Class by Sex by Age in Battle Creek
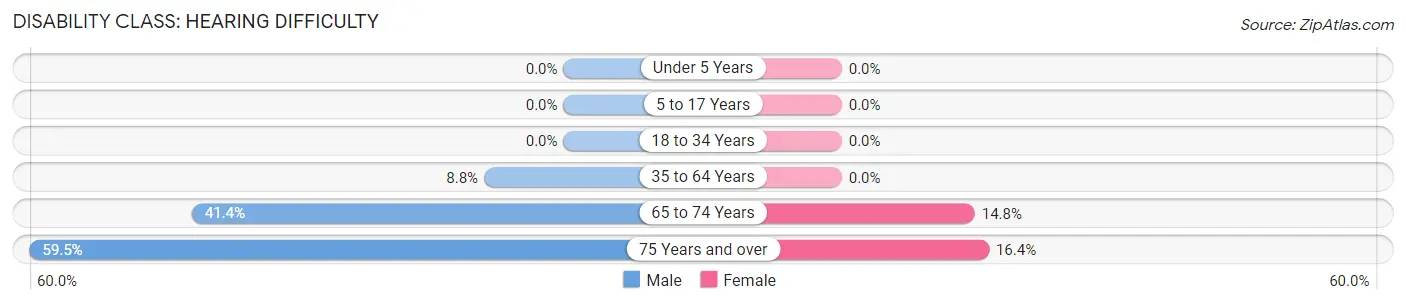
Disability Class: Hearing Difficulty
| Age Bracket | Male | Female |
| Under 5 Years | 0 (0.0%) | 0 (0.0%) |
| 5 to 17 Years | 0 (0.0%) | 0 (0.0%) |
| 18 to 34 Years | 0 (0.0%) | 0 (0.0%) |
| 35 to 64 Years | 13 (8.8%) | 0 (0.0%) |
| 65 to 74 Years | 24 (41.4%) | 8 (14.8%) |
| 75 Years and over | 22 (59.5%) | 10 (16.4%) |
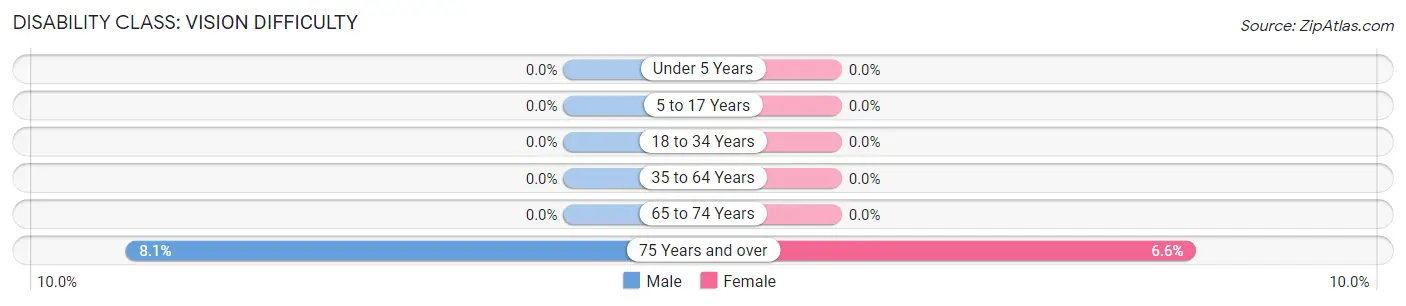
Disability Class: Vision Difficulty
| Age Bracket | Male | Female |
| Under 5 Years | 0 (0.0%) | 0 (0.0%) |
| 5 to 17 Years | 0 (0.0%) | 0 (0.0%) |
| 18 to 34 Years | 0 (0.0%) | 0 (0.0%) |
| 35 to 64 Years | 0 (0.0%) | 0 (0.0%) |
| 65 to 74 Years | 0 (0.0%) | 0 (0.0%) |
| 75 Years and over | 3 (8.1%) | 4 (6.6%) |
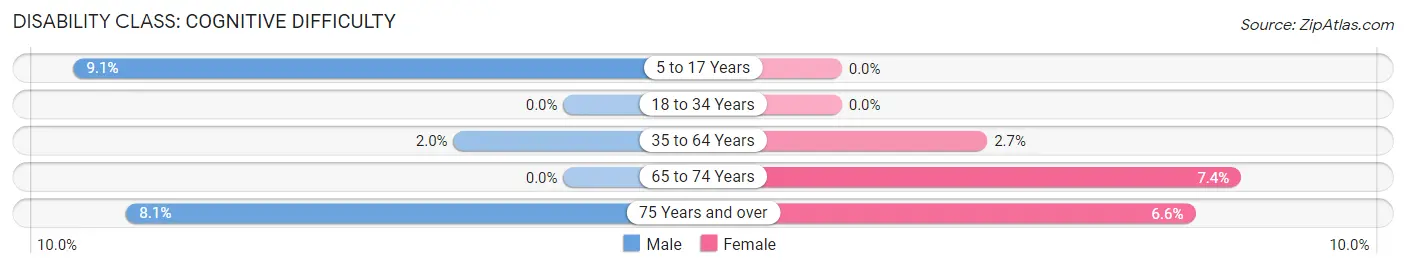
Disability Class: Cognitive Difficulty
| Age Bracket | Male | Female |
| 5 to 17 Years | 7 (9.1%) | 0 (0.0%) |
| 18 to 34 Years | 0 (0.0%) | 0 (0.0%) |
| 35 to 64 Years | 3 (2.0%) | 5 (2.7%) |
| 65 to 74 Years | 0 (0.0%) | 4 (7.4%) |
| 75 Years and over | 3 (8.1%) | 4 (6.6%) |
Disability Class: Ambulatory Difficulty
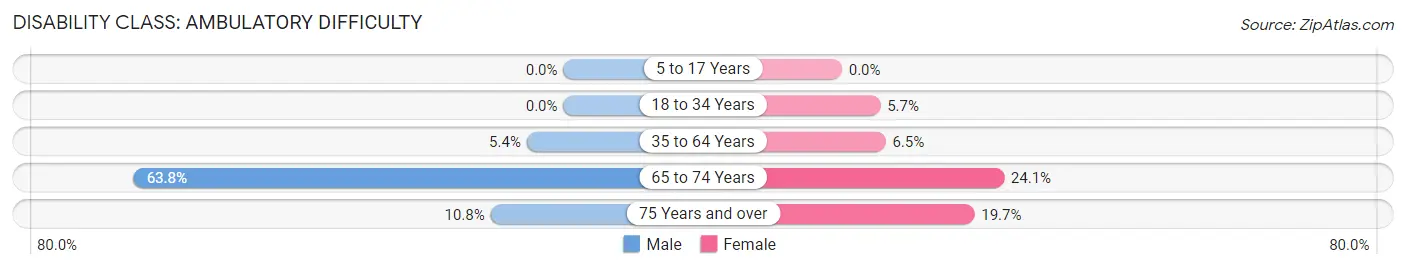
| Age Bracket | Male | Female |
| 5 to 17 Years | 0 (0.0%) | 0 (0.0%) |
| 18 to 34 Years | 0 (0.0%) | 2 (5.7%) |
| 35 to 64 Years | 8 (5.4%) | 12 (6.5%) |
| 65 to 74 Years | 37 (63.8%) | 13 (24.1%) |
| 75 Years and over | 4 (10.8%) | 12 (19.7%) |
Disability Class: Self-Care Difficulty
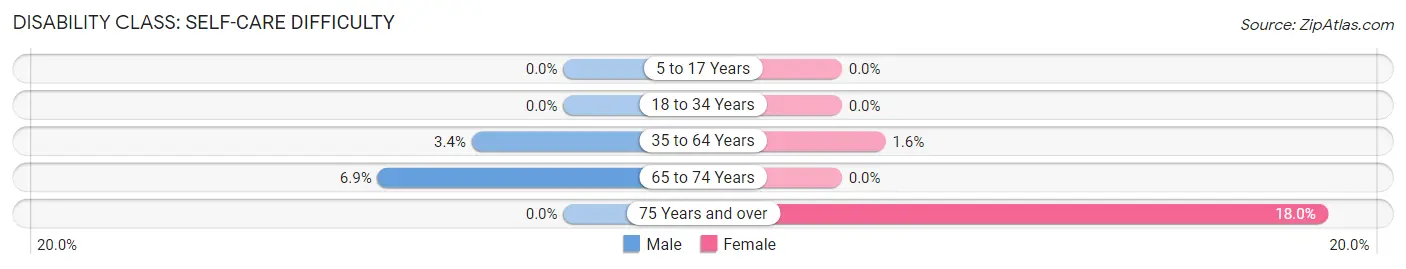
| Age Bracket | Male | Female |
| 5 to 17 Years | 0 (0.0%) | 0 (0.0%) |
| 18 to 34 Years | 0 (0.0%) | 0 (0.0%) |
| 35 to 64 Years | 5 (3.4%) | 3 (1.6%) |
| 65 to 74 Years | 4 (6.9%) | 0 (0.0%) |
| 75 Years and over | 0 (0.0%) | 11 (18.0%) |
Technology Access in Battle Creek
Computing Device Access in Battle Creek
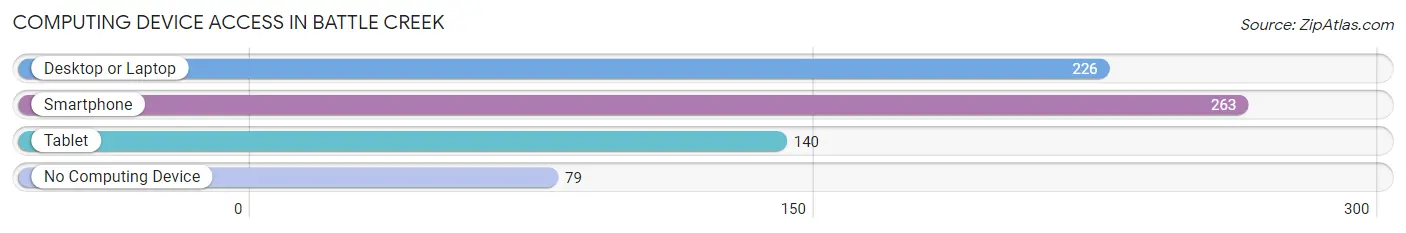
| Device Type | # Households | % Households |
| Desktop or Laptop | 226 | 59.6% |
| Smartphone | 263 | 69.4% |
| Tablet | 140 | 36.9% |
| No Computing Device | 79 | 20.8% |
| Total | 379 | 100.0% |
Internet Access in Battle Creek
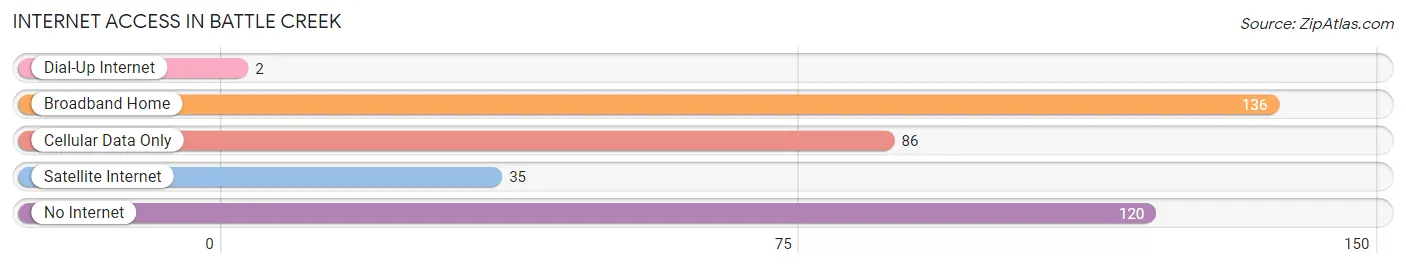
| Internet Type | # Households | % Households |
| Dial-Up Internet | 2 | 0.5% |
| Broadband Home | 136 | 35.9% |
| Cellular Data Only | 86 | 22.7% |
| Satellite Internet | 35 | 9.2% |
| No Internet | 120 | 31.7% |
| Total | 379 | 100.0% |
Battle Creek Summary
History
The city of Battle Creek, Iowa is located in Ida County in the northwest corner of the state. It is situated on the banks of the Little Sioux River, and is the county seat of Ida County. The city was founded in 1856 by a group of settlers from Ohio, led by William and Mary Ann Battle. The city was named after the Battle family, and was incorporated in 1876.
The city of Battle Creek has a rich history, and has been home to many notable people. The most famous of these is the former President of the United States, Herbert Hoover, who was born in the city in 1874. Hoover was the 31st President of the United States, and served from 1929 to 1933. He was a Quaker, and was known for his humanitarian efforts during the Great Depression.
The city of Battle Creek has also been home to many other notable people, including the first female mayor of the city, Mary Ann Battle, who served from 1876 to 1878. Other notable people from the city include the first female doctor in the state of Iowa, Dr. Mary Ann Battle, and the first female lawyer in the state, Mary Ann Battle.
Geography
Battle Creek is located in the northwest corner of Iowa, in Ida County. It is situated on the banks of the Little Sioux River, and is the county seat of Ida County. The city is located at an elevation of 1,072 feet above sea level, and has a total area of 1.3 square miles. The city is located in the Loess Hills region of Iowa, and is surrounded by rolling hills and farmland.
The climate in Battle Creek is classified as humid continental, with hot summers and cold winters. The average temperature in the summer is around 75 degrees Fahrenheit, and the average temperature in the winter is around 25 degrees Fahrenheit. The city receives an average of 33 inches of precipitation per year, with the majority of it falling in the spring and summer months.
Economy
The economy of Battle Creek is largely based on agriculture and manufacturing. The city is home to several large agricultural operations, including the Battle Creek Seed Company, which produces a variety of corn, soybean, and wheat seeds. The city is also home to several manufacturing companies, including the Battle Creek Manufacturing Company, which produces a variety of industrial products.
The city is also home to several retail stores, including the Battle Creek Mall, which features a variety of stores and restaurants. The city is also home to several restaurants, including the Battle Creek Diner, which serves a variety of American and Mexican dishes.
Demographics
As of the 2010 census, the city of Battle Creek had a population of 1,845 people. The racial makeup of the city was 97.2% White, 0.3% African American, 0.2% Native American, 0.2% Asian, 0.1% Pacific Islander, 0.7% from other races, and 1.3% from two or more races. Hispanic or Latino of any race were 1.7% of the population.
The median income for a household in the city was $41,250, and the median income for a family was $50,000. The per capita income for the city was $20,845. About 8.3% of families and 10.2% of the population were below the poverty line, including 14.2% of those under age 18 and 8.3% of those age 65 or over.
Common Questions
What is Per Capita Income in Battle Creek?
Per Capita income in Battle Creek is $30,530.
What is the Median Family Income in Battle Creek?
Median Family Income in Battle Creek is $72,250.
What is the Median Household income in Battle Creek?
Median Household Income in Battle Creek is $53,750.
What is Income or Wage Gap in Battle Creek?
Income or Wage Gap in Battle Creek is 32.0%.
Women in Battle Creek earn 68.0 cents for every dollar earned by a man.
What is Inequality or Gini Index in Battle Creek?
Inequality or Gini Index in Battle Creek is 0.40.
What is the Total Population of Battle Creek?
Total Population of Battle Creek is 830.
What is the Total Male Population of Battle Creek?
Total Male Population of Battle Creek is 384.
What is the Total Female Population of Battle Creek?
Total Female Population of Battle Creek is 446.
What is the Ratio of Males per 100 Females in Battle Creek?
There are 86.10 Males per 100 Females in Battle Creek.
What is the Ratio of Females per 100 Males in Battle Creek?
There are 116.15 Females per 100 Males in Battle Creek.
What is the Median Population Age in Battle Creek?
Median Population Age in Battle Creek is 47.8 Years.
What is the Average Family Size in Battle Creek
Average Family Size in Battle Creek is 2.6 People.
What is the Average Household Size in Battle Creek
Average Household Size in Battle Creek is 2.1 People.
How Large is the Labor Force in Battle Creek?
There are 416 People in the Labor Forcein in Battle Creek.
What is the Percentage of People in the Labor Force in Battle Creek?
62.4% of People are in the Labor Force in Battle Creek.
What is the Unemployment Rate in Battle Creek?
Unemployment Rate in Battle Creek is 1.0%.