Center Point, IA
Center Point Map
Center Point Overview
2,573
TOTAL POPULATION
1,233
MALE POPULATION
1,340
FEMALE POPULATION
92.01
MALES / 100 FEMALES
108.68
FEMALES / 100 MALES
35.0
MEDIAN AGE
3.0
AVG FAMILY SIZE
2.6
AVG HOUSEHOLD SIZE
$36,284
PER CAPITA INCOME
$93,266
AVG FAMILY INCOME
$80,053
AVG HOUSEHOLD INCOME
22.5%
WAGE / INCOME GAP [ % ]
77.5¢/ $1
WAGE / INCOME GAP [ $ ]
0.35
INEQUALITY / GINI INDEX
1,438
LABOR FORCE [ PEOPLE ]
70.6%
PERCENT IN LABOR FORCE
3.1%
UNEMPLOYMENT RATE
Center Point Zip Codes
Center Point Area Codes
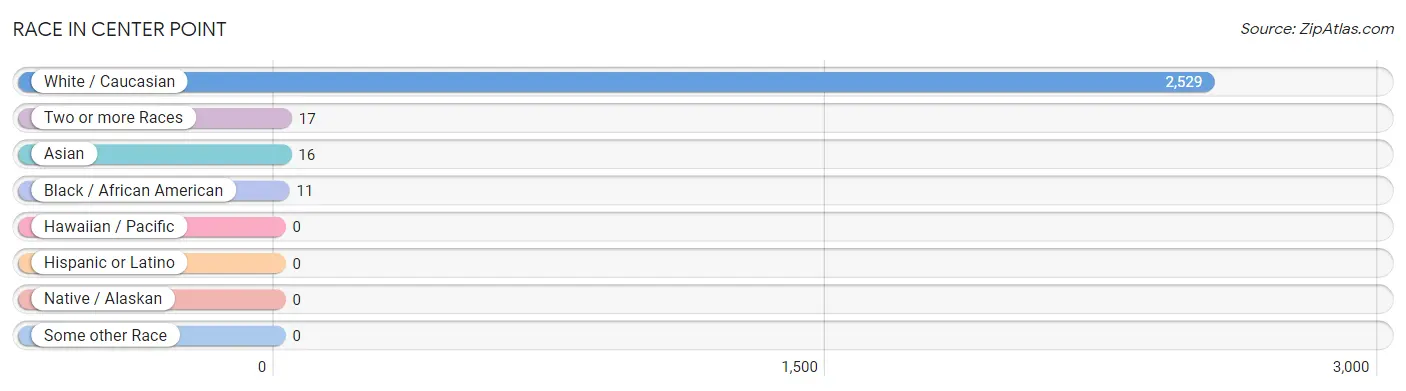
Race in Center Point
The most populous races in Center Point are White / Caucasian (2,529 | 98.3%), Two or more Races (17 | 0.7%), and Asian (16 | 0.6%).
| Race | # Population | % Population |
| Asian | 16 | 0.6% |
| Black / African American | 11 | 0.4% |
| Hawaiian / Pacific | 0 | 0.0% |
| Hispanic or Latino | 0 | 0.0% |
| Native / Alaskan | 0 | 0.0% |
| White / Caucasian | 2,529 | 98.3% |
| Two or more Races | 17 | 0.7% |
| Some other Race | 0 | 0.0% |
| Total | 2,573 | 100.0% |
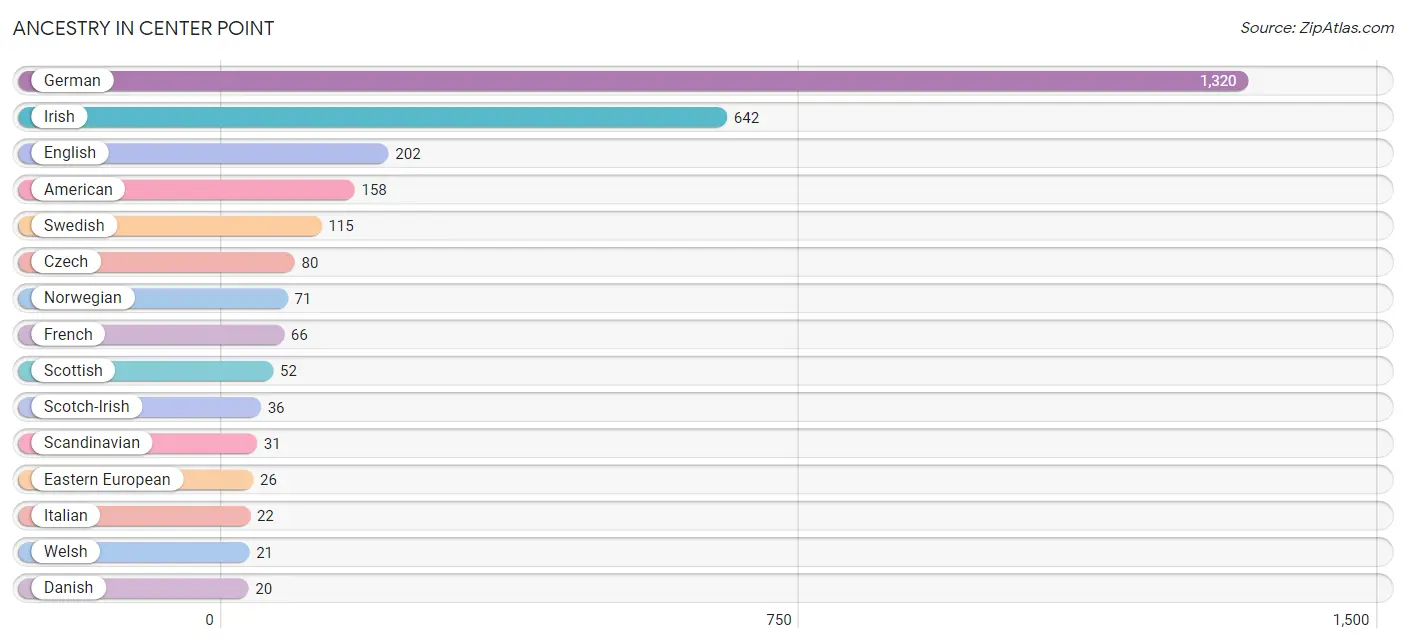
Ancestry in Center Point
The most populous ancestries reported in Center Point are German (1,320 | 51.3%), Irish (642 | 24.9%), English (202 | 7.9%), American (158 | 6.1%), and Swedish (115 | 4.5%), together accounting for 94.7% of all Center Point residents.
| Ancestry | # Population | % Population |
| American | 158 | 6.1% |
| British | 16 | 0.6% |
| Canadian | 16 | 0.6% |
| Czech | 80 | 3.1% |
| Czechoslovakian | 15 | 0.6% |
| Danish | 20 | 0.8% |
| Eastern European | 26 | 1.0% |
| English | 202 | 7.9% |
| European | 14 | 0.5% |
| French | 66 | 2.6% |
| German | 1,320 | 51.3% |
| Greek | 10 | 0.4% |
| Irish | 642 | 24.9% |
| Italian | 22 | 0.9% |
| Korean | 3 | 0.1% |
| Northern European | 9 | 0.4% |
| Norwegian | 71 | 2.8% |
| Polish | 10 | 0.4% |
| Scandinavian | 31 | 1.2% |
| Scotch-Irish | 36 | 1.4% |
| Scottish | 52 | 2.0% |
| Swedish | 115 | 4.5% |
| Thai | 7 | 0.3% |
| Welsh | 21 | 0.8% | View All 24 Rows |
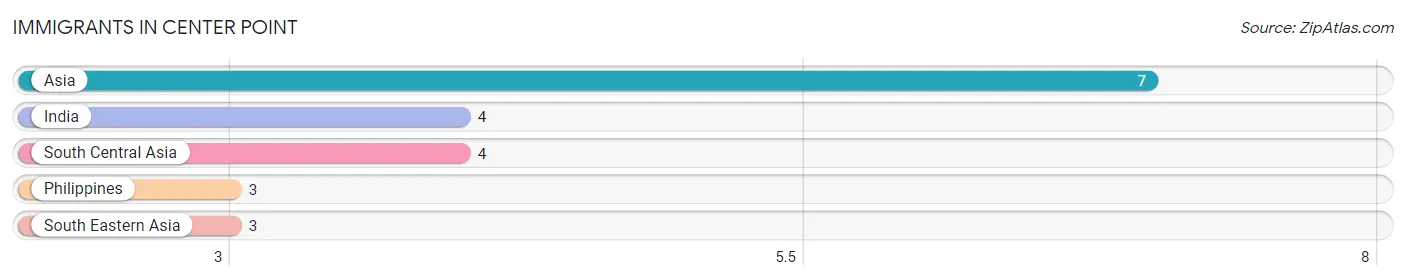
Immigrants in Center Point
The most numerous immigrant groups reported in Center Point came from Asia (7 | 0.3%), India (4 | 0.2%), South Central Asia (4 | 0.2%), Philippines (3 | 0.1%), and South Eastern Asia (3 | 0.1%), together accounting for 0.8% of all Center Point residents.
| Immigration Origin | # Population | % Population |
| Asia | 7 | 0.3% |
| India | 4 | 0.2% |
| Philippines | 3 | 0.1% |
| South Central Asia | 4 | 0.2% |
| South Eastern Asia | 3 | 0.1% | View All 5 Rows |
Sex and Age in Center Point
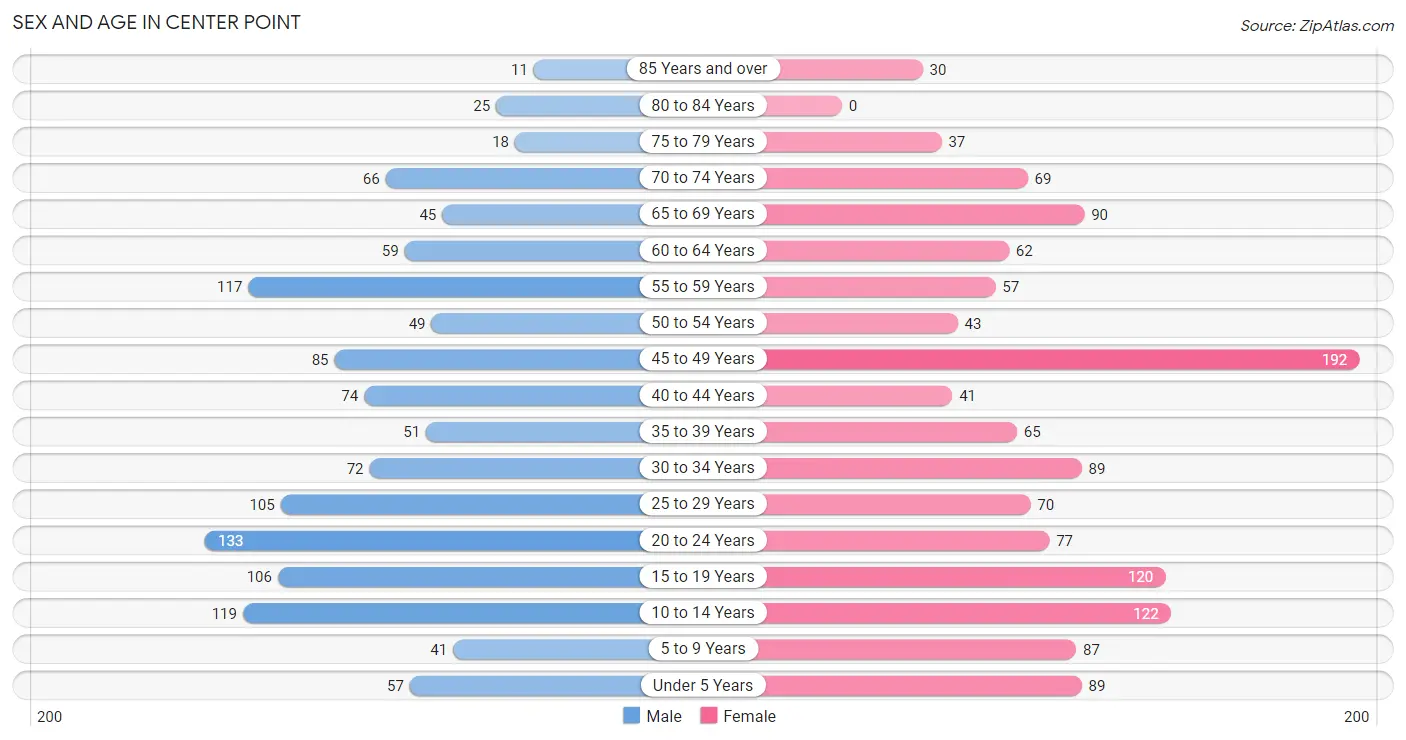
Sex and Age in Center Point
The most populous age groups in Center Point are 20 to 24 Years (133 | 10.8%) for men and 45 to 49 Years (192 | 14.3%) for women.
| Age Bracket | Male | Female |
| Under 5 Years | 57 (4.6%) | 89 (6.6%) |
| 5 to 9 Years | 41 (3.3%) | 87 (6.5%) |
| 10 to 14 Years | 119 (9.7%) | 122 (9.1%) |
| 15 to 19 Years | 106 (8.6%) | 120 (9.0%) |
| 20 to 24 Years | 133 (10.8%) | 77 (5.8%) |
| 25 to 29 Years | 105 (8.5%) | 70 (5.2%) |
| 30 to 34 Years | 72 (5.8%) | 89 (6.6%) |
| 35 to 39 Years | 51 (4.1%) | 65 (4.9%) |
| 40 to 44 Years | 74 (6.0%) | 41 (3.1%) |
| 45 to 49 Years | 85 (6.9%) | 192 (14.3%) |
| 50 to 54 Years | 49 (4.0%) | 43 (3.2%) |
| 55 to 59 Years | 117 (9.5%) | 57 (4.3%) |
| 60 to 64 Years | 59 (4.8%) | 62 (4.6%) |
| 65 to 69 Years | 45 (3.6%) | 90 (6.7%) |
| 70 to 74 Years | 66 (5.3%) | 69 (5.1%) |
| 75 to 79 Years | 18 (1.5%) | 37 (2.8%) |
| 80 to 84 Years | 25 (2.0%) | 0 (0.0%) |
| 85 Years and over | 11 (0.9%) | 30 (2.2%) |
| Total | 1,233 (100.0%) | 1,340 (100.0%) |
Families and Households in Center Point
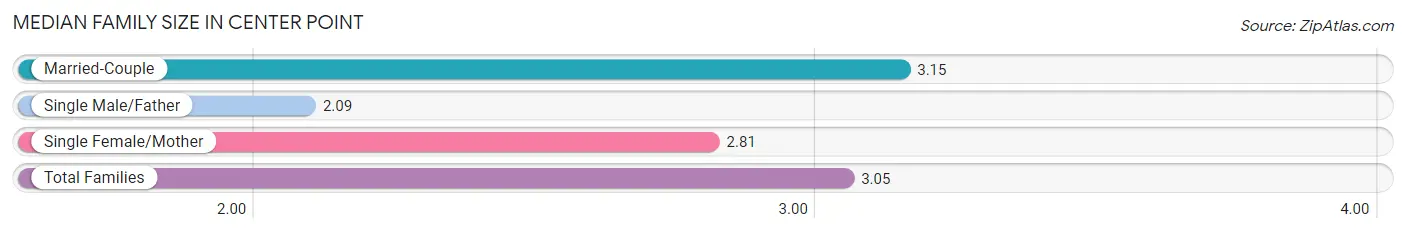
Median Family Size in Center Point
The median family size in Center Point is 3.05 persons per family, with married-couple families (551 | 76.0%) accounting for the largest median family size of 3.15 persons per family. On the other hand, single male/father families (22 | 3.0%) represent the smallest median family size with 2.09 persons per family.
| Family Type | # Families | Family Size |
| Married-Couple | 551 (76.0%) | 3.15 |
| Single Male/Father | 22 (3.0%) | 2.09 |
| Single Female/Mother | 152 (21.0%) | 2.81 |
| Total Families | 725 (100.0%) | 3.05 |
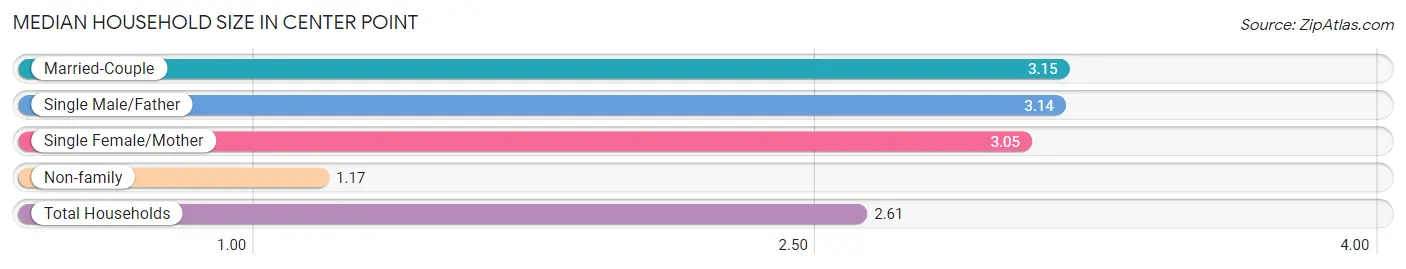
Median Household Size in Center Point
The median household size in Center Point is 2.61 persons per household, with married-couple households (551 | 55.9%) accounting for the largest median household size of 3.15 persons per household. non-family households (261 | 26.5%) represent the smallest median household size with 1.17 persons per household.
| Household Type | # Households | Household Size |
| Married-Couple | 551 (55.9%) | 3.15 |
| Single Male/Father | 22 (2.2%) | 3.14 |
| Single Female/Mother | 152 (15.4%) | 3.05 |
| Non-family | 261 (26.5%) | 1.17 |
| Total Households | 986 (100.0%) | 2.61 |
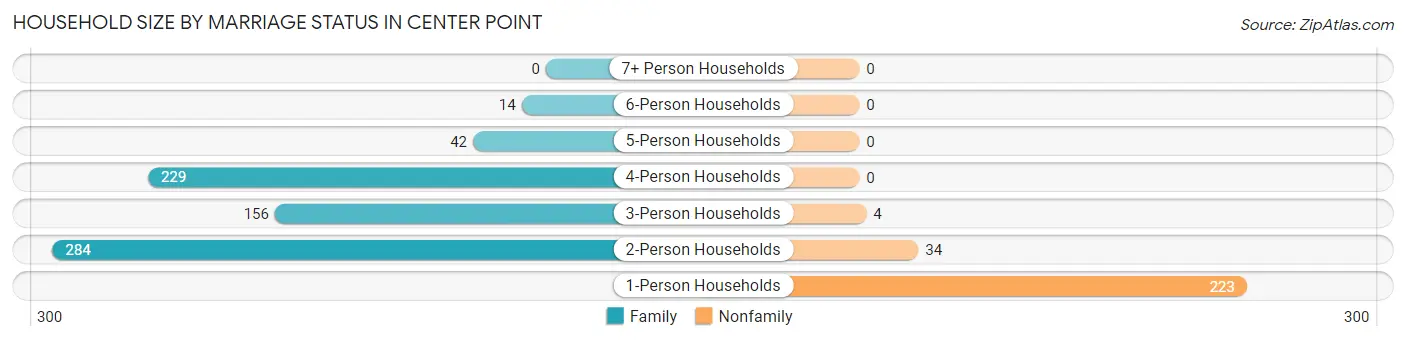
Household Size by Marriage Status in Center Point
Out of a total of 986 households in Center Point, 725 (73.5%) are family households, while 261 (26.5%) are nonfamily households. The most numerous type of family households are 2-person households, comprising 284, and the most common type of nonfamily households are 1-person households, comprising 223.
| Household Size | Family Households | Nonfamily Households |
| 1-Person Households | - | 223 (22.6%) |
| 2-Person Households | 284 (28.8%) | 34 (3.5%) |
| 3-Person Households | 156 (15.8%) | 4 (0.4%) |
| 4-Person Households | 229 (23.2%) | 0 (0.0%) |
| 5-Person Households | 42 (4.3%) | 0 (0.0%) |
| 6-Person Households | 14 (1.4%) | 0 (0.0%) |
| 7+ Person Households | 0 (0.0%) | 0 (0.0%) |
| Total | 725 (73.5%) | 261 (26.5%) |
Female Fertility in Center Point
Fertility by Age in Center Point
Average fertility rate in Center Point is 49.0 births per 1,000 women. Women in the age bracket of 20 to 34 years have the highest fertility rate with 93.0 births per 1,000 women. Women in the age bracket of 20 to 34 years acount for 66.7% of all women with births.
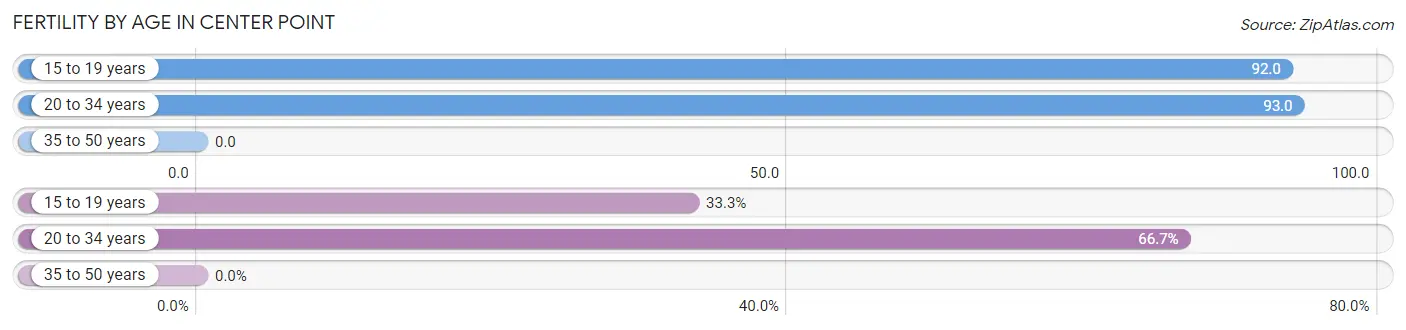
| Age Bracket | Women with Births | Births / 1,000 Women |
| 15 to 19 years | 11 (33.3%) | 92.0 |
| 20 to 34 years | 22 (66.7%) | 93.0 |
| 35 to 50 years | 0 (0.0%) | 0.0 |
| Total | 33 (100.0%) | 49.0 |
Fertility by Age by Marriage Status in Center Point
66.7% of women with births (33) in Center Point are married. The highest percentage of unmarried women with births falls into 15 to 19 years age bracket with 100.0% of them unmarried at the time of birth, while the lowest percentage of unmarried women with births belong to 20 to 34 years age bracket with 0.0% of them unmarried.
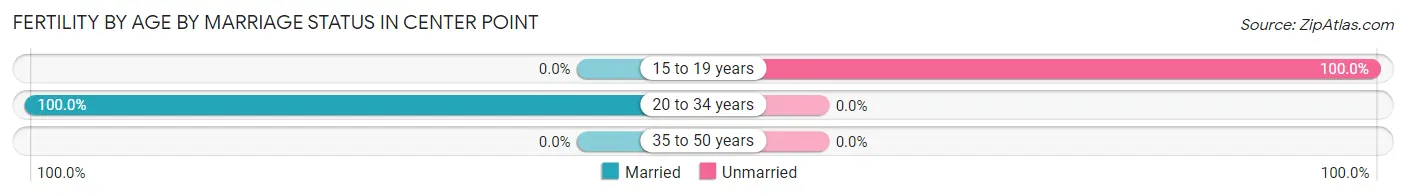
| Age Bracket | Married | Unmarried |
| 15 to 19 years | 0 (0.0%) | 11 (100.0%) |
| 20 to 34 years | 22 (100.0%) | 0 (0.0%) |
| 35 to 50 years | 0 (0.0%) | 0 (0.0%) |
| Total | 22 (66.7%) | 11 (33.3%) |
Fertility by Education in Center Point
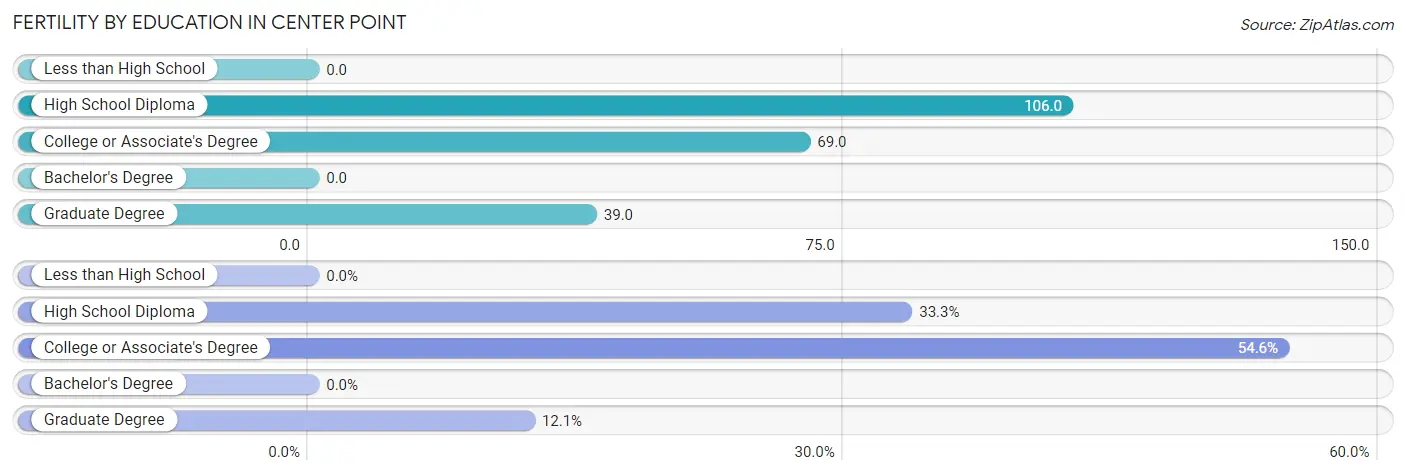
| Educational Attainment | Women with Births | Births / 1,000 Women |
| Less than High School | 0 (0.0%) | 0.0 |
| High School Diploma | 11 (33.3%) | 106.0 |
| College or Associate's Degree | 18 (54.5%) | 69.0 |
| Bachelor's Degree | 0 (0.0%) | 0.0 |
| Graduate Degree | 4 (12.1%) | 39.0 |
| Total | 33 (100.0%) | 49.0 |
Fertility by Education by Marriage Status in Center Point
33.3% of women with births in Center Point are unmarried. Women with the educational attainment of college or associate's degree are most likely to be married with 100.0% of them married at childbirth, while women with the educational attainment of high school diploma are least likely to be married with 100.0% of them unmarried at childbirth.
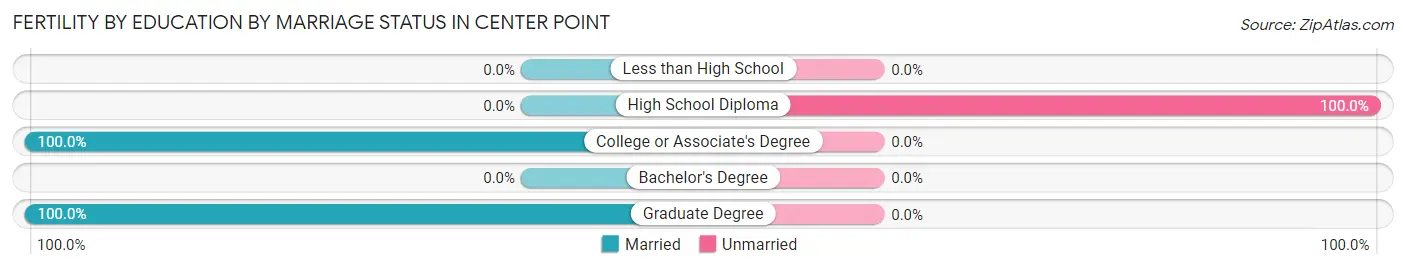
| Educational Attainment | Married | Unmarried |
| Less than High School | 0 (0.0%) | 0 (0.0%) |
| High School Diploma | 0 (0.0%) | 11 (100.0%) |
| College or Associate's Degree | 18 (100.0%) | 0 (0.0%) |
| Bachelor's Degree | 0 (0.0%) | 0 (0.0%) |
| Graduate Degree | 4 (100.0%) | 0 (0.0%) |
| Total | 22 (66.7%) | 11 (33.3%) |
Income in Center Point
Income Overview in Center Point
Per Capita Income in Center Point is $36,284, while median incomes of families and households are $93,266 and $80,053 respectively.
| Characteristic | Number | Measure |
| Per Capita Income | 2,573 | $36,284 |
| Median Family Income | 725 | $93,266 |
| Mean Family Income | 725 | $107,447 |
| Median Household Income | 986 | $80,053 |
| Mean Household Income | 986 | $93,707 |
| Income Deficit | 725 | $0 |
| Wage / Income Gap (%) | 2,573 | 22.53% |
| Wage / Income Gap ($) | 2,573 | 77.47¢ per $1 |
| Gini / Inequality Index | 2,573 | 0.35 |
Earnings by Sex in Center Point
Average Earnings in Center Point are $44,828, $49,514 for men and $38,359 for women, a difference of 22.5%.
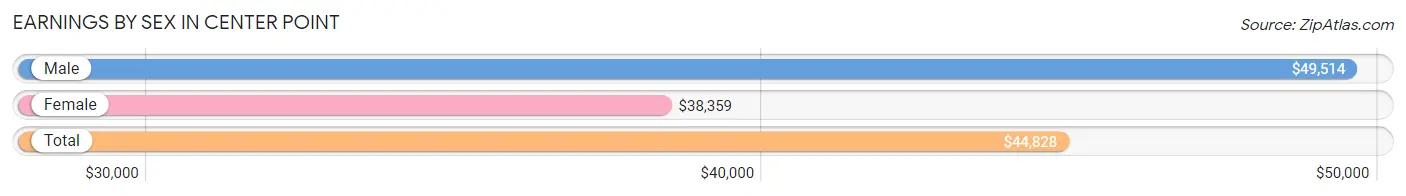
| Sex | Number | Average Earnings |
| Male | 755 (50.6%) | $49,514 |
| Female | 738 (49.4%) | $38,359 |
| Total | 1,493 (100.0%) | $44,828 |
Earnings by Sex by Income Bracket in Center Point
The most common earnings brackets in Center Point are $75,000 to $99,999 for men (121 | 16.0%) and $75,000 to $99,999 for women (108 | 14.6%).
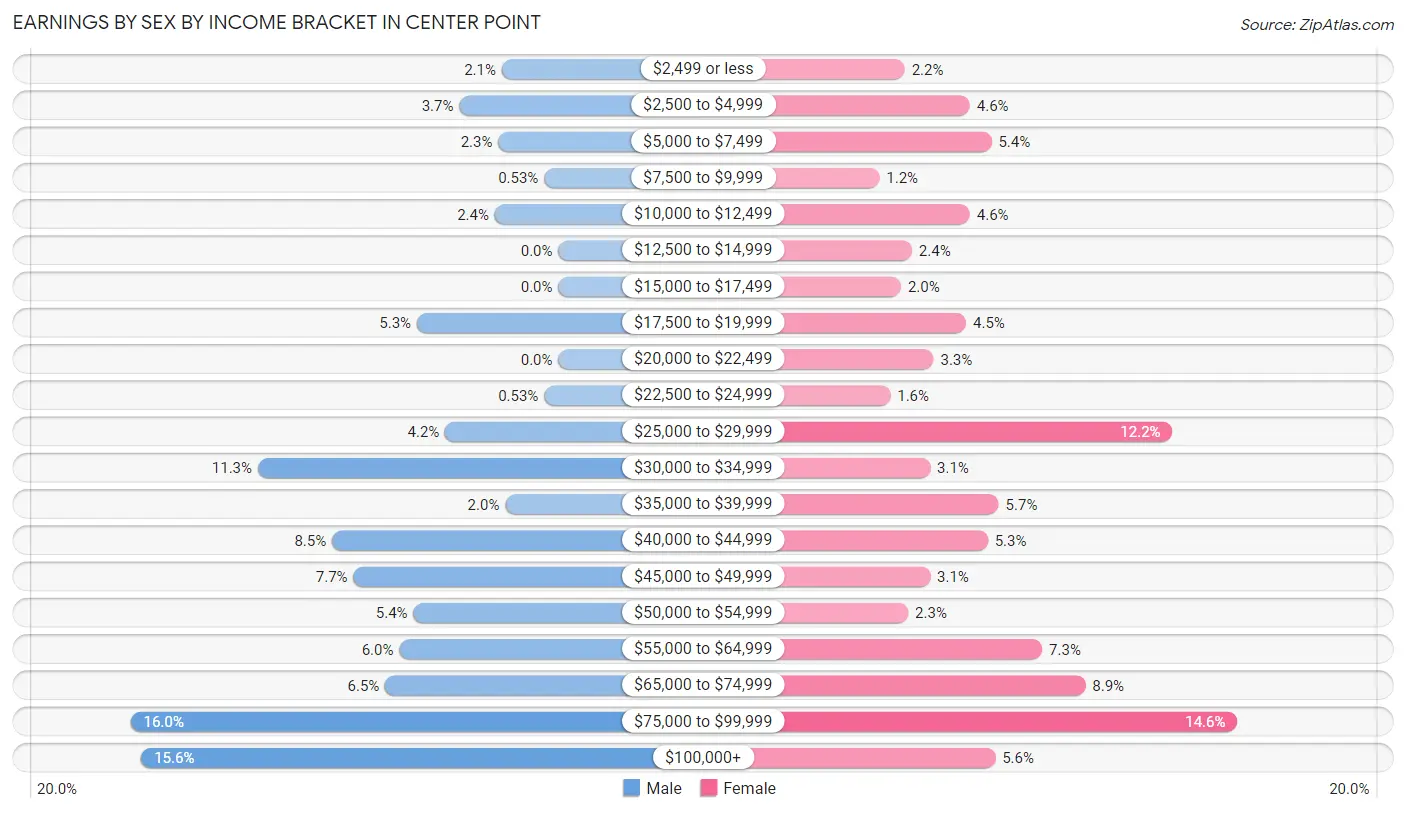
| Income | Male | Female |
| $2,499 or less | 16 (2.1%) | 16 (2.2%) |
| $2,500 to $4,999 | 28 (3.7%) | 34 (4.6%) |
| $5,000 to $7,499 | 17 (2.2%) | 40 (5.4%) |
| $7,500 to $9,999 | 4 (0.5%) | 9 (1.2%) |
| $10,000 to $12,499 | 18 (2.4%) | 34 (4.6%) |
| $12,500 to $14,999 | 0 (0.0%) | 18 (2.4%) |
| $15,000 to $17,499 | 0 (0.0%) | 15 (2.0%) |
| $17,500 to $19,999 | 40 (5.3%) | 33 (4.5%) |
| $20,000 to $22,499 | 0 (0.0%) | 24 (3.3%) |
| $22,500 to $24,999 | 4 (0.5%) | 12 (1.6%) |
| $25,000 to $29,999 | 32 (4.2%) | 90 (12.2%) |
| $30,000 to $34,999 | 85 (11.3%) | 23 (3.1%) |
| $35,000 to $39,999 | 15 (2.0%) | 42 (5.7%) |
| $40,000 to $44,999 | 64 (8.5%) | 39 (5.3%) |
| $45,000 to $49,999 | 58 (7.7%) | 23 (3.1%) |
| $50,000 to $54,999 | 41 (5.4%) | 17 (2.3%) |
| $55,000 to $64,999 | 45 (6.0%) | 54 (7.3%) |
| $65,000 to $74,999 | 49 (6.5%) | 66 (8.9%) |
| $75,000 to $99,999 | 121 (16.0%) | 108 (14.6%) |
| $100,000+ | 118 (15.6%) | 41 (5.6%) |
| Total | 755 (100.0%) | 738 (100.0%) |
Earnings by Sex by Educational Attainment in Center Point
Average earnings in Center Point are $57,885 for men and $42,963 for women, a difference of 25.8%. Men with an educational attainment of graduate degree enjoy the highest average annual earnings of $111,528, while those with high school diploma education earn the least with $45,167. Women with an educational attainment of graduate degree earn the most with the average annual earnings of $75,438, while those with high school diploma education have the smallest earnings of $28,900.
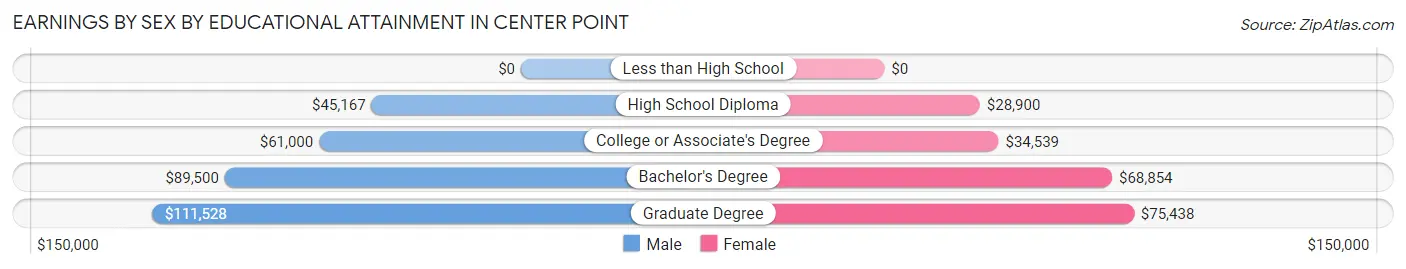
| Educational Attainment | Male Income | Female Income |
| Less than High School | - | - |
| High School Diploma | $45,167 | $28,900 |
| College or Associate's Degree | $61,000 | $34,539 |
| Bachelor's Degree | $89,500 | $68,854 |
| Graduate Degree | $111,528 | $75,438 |
| Total | $57,885 | $42,963 |
Family Income in Center Point
Family Income Brackets in Center Point
According to the Center Point family income data, there are 189 families falling into the $50,000 to $74,999 income range, which is the most common income bracket and makes up 26.1% of all families. Conversely, the $10,000 to $14,999 income bracket is the least frequent group with only 5 families (0.7%) belonging to this category.
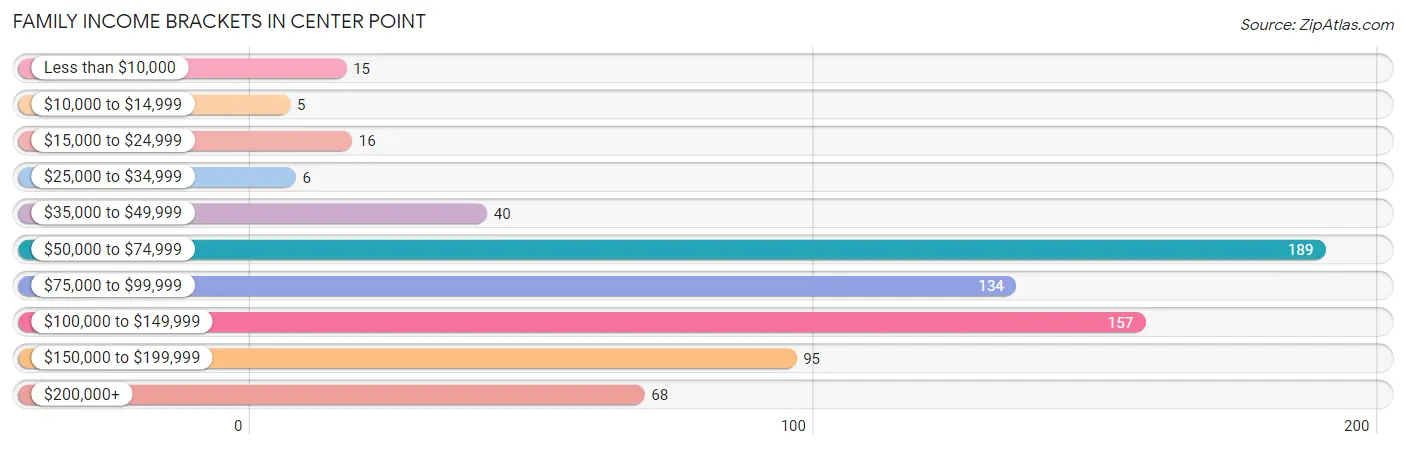
| Income Bracket | # Families | % Families |
| Less than $10,000 | 15 | 2.1% |
| $10,000 to $14,999 | 5 | 0.7% |
| $15,000 to $24,999 | 16 | 2.2% |
| $25,000 to $34,999 | 6 | 0.8% |
| $35,000 to $49,999 | 40 | 5.5% |
| $50,000 to $74,999 | 189 | 26.1% |
| $75,000 to $99,999 | 134 | 18.5% |
| $100,000 to $149,999 | 157 | 21.7% |
| $150,000 to $199,999 | 95 | 13.1% |
| $200,000+ | 68 | 9.4% |
Family Income by Famaliy Size in Center Point
3-person families (124 | 17.1%) account for the highest median family income in Center Point with $127,500 per family, while 3-person families (124 | 17.1%) have the highest median income of $42,500 per family member.
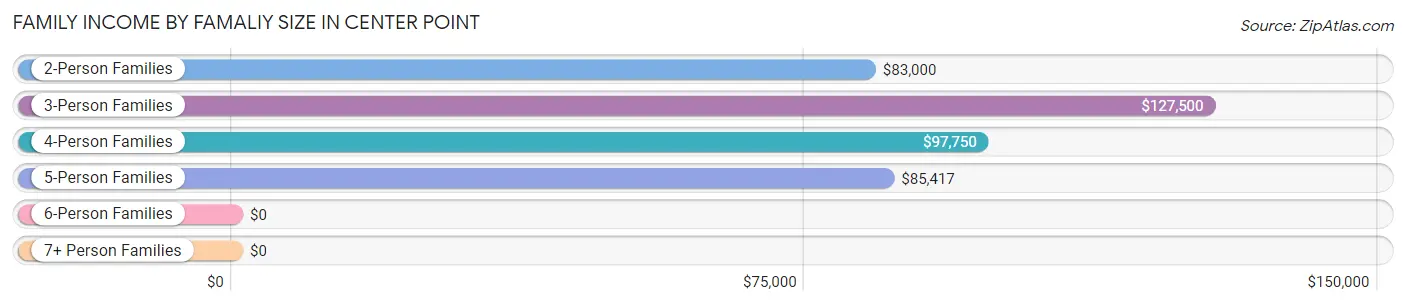
| Income Bracket | # Families | Median Income |
| 2-Person Families | 326 (45.0%) | $83,000 |
| 3-Person Families | 124 (17.1%) | $127,500 |
| 4-Person Families | 229 (31.6%) | $97,750 |
| 5-Person Families | 32 (4.4%) | $85,417 |
| 6-Person Families | 14 (1.9%) | $0 |
| 7+ Person Families | 0 (0.0%) | $0 |
| Total | 725 (100.0%) | $93,266 |
Family Income by Number of Earners in Center Point
The median family income in Center Point is $93,266, with families comprising 3+ earners (73) having the highest median family income of $186,250, while families with no earners (93) have the lowest median family income of $61,042, accounting for 10.1% and 12.8% of families, respectively.
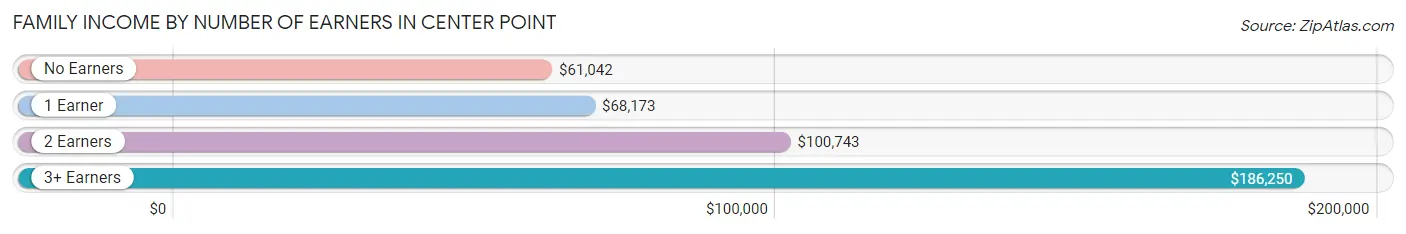
| Number of Earners | # Families | Median Income |
| No Earners | 93 (12.8%) | $61,042 |
| 1 Earner | 137 (18.9%) | $68,173 |
| 2 Earners | 422 (58.2%) | $100,743 |
| 3+ Earners | 73 (10.1%) | $186,250 |
| Total | 725 (100.0%) | $93,266 |
Household Income in Center Point
Household Income Brackets in Center Point
With 253 households falling in the category, the $50,000 to $74,999 income range is the most frequent in Center Point, accounting for 25.7% of all households. In contrast, only 10 households (1.0%) fall into the less than $10,000 income bracket, making it the least populous group.
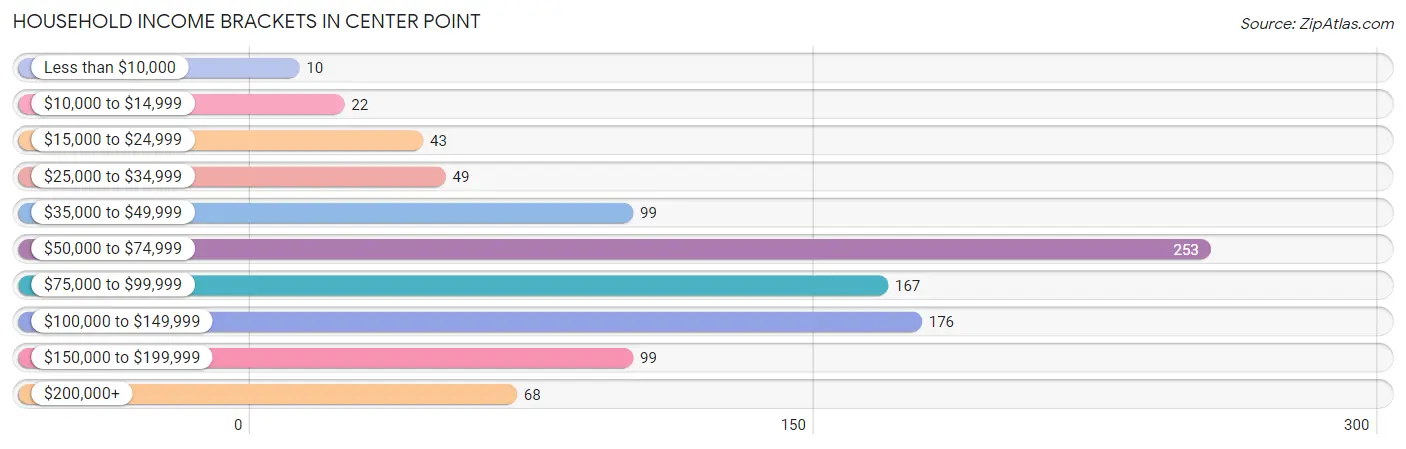
| Income Bracket | # Households | % Households |
| Less than $10,000 | 10 | 1.0% |
| $10,000 to $14,999 | 22 | 2.2% |
| $15,000 to $24,999 | 43 | 4.4% |
| $25,000 to $34,999 | 49 | 5.0% |
| $35,000 to $49,999 | 99 | 10.0% |
| $50,000 to $74,999 | 253 | 25.7% |
| $75,000 to $99,999 | 167 | 16.9% |
| $100,000 to $149,999 | 176 | 17.8% |
| $150,000 to $199,999 | 99 | 10.0% |
| $200,000+ | 68 | 6.9% |
Household Income by Householder Age in Center Point
The median household income in Center Point is $80,053, with the highest median household income of $100,750 found in the 25 to 44 years age bracket for the primary householder. A total of 293 households (29.7%) fall into this category. Meanwhile, the 15 to 24 years age bracket for the primary householder has the lowest median household income of $50,625, with 72 households (7.3%) in this group.
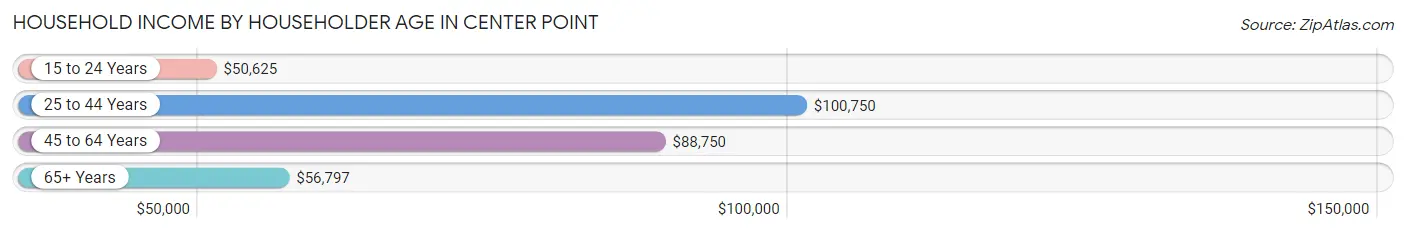
| Income Bracket | # Households | Median Income |
| 15 to 24 Years | 72 (7.3%) | $50,625 |
| 25 to 44 Years | 293 (29.7%) | $100,750 |
| 45 to 64 Years | 362 (36.7%) | $88,750 |
| 65+ Years | 259 (26.3%) | $56,797 |
| Total | 986 (100.0%) | $80,053 |
Poverty in Center Point
Income Below Poverty by Sex and Age in Center Point
With 2.8% poverty level for males and 9.7% for females among the residents of Center Point, 12 to 14 year old males and 18 to 24 year old females are the most vulnerable to poverty, with 10 males (11.9%) and 32 females (29.1%) in their respective age groups living below the poverty level.
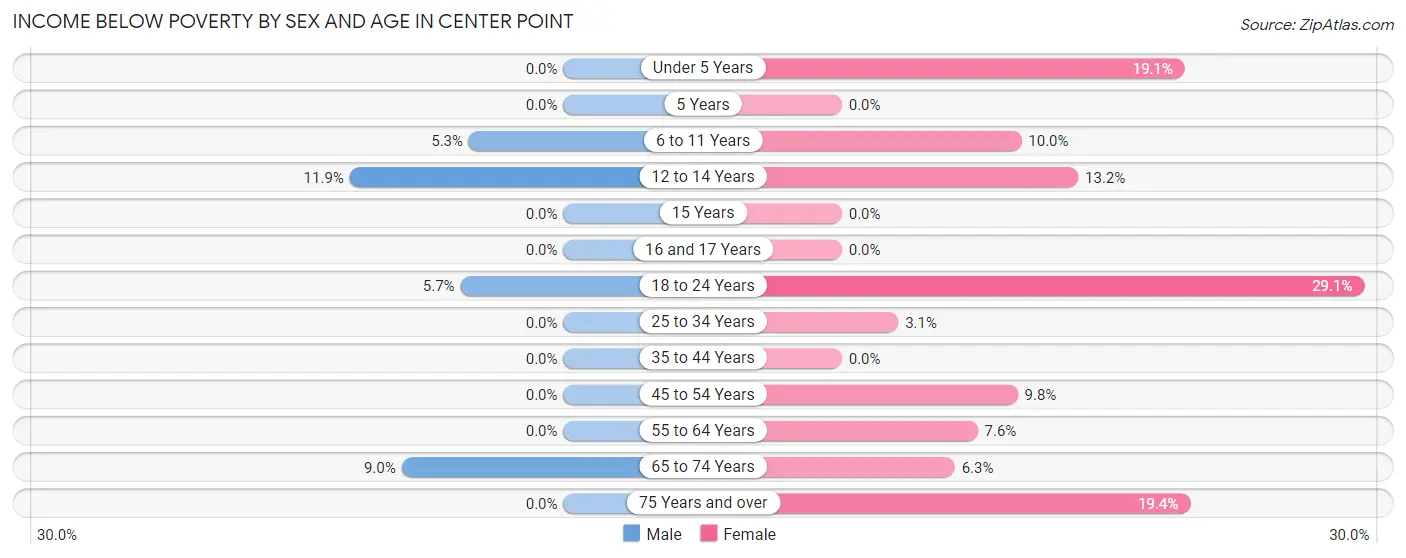
| Age Bracket | Male | Female |
| Under 5 Years | 0 (0.0%) | 17 (19.1%) |
| 5 Years | 0 (0.0%) | 0 (0.0%) |
| 6 to 11 Years | 4 (5.3%) | 11 (10.0%) |
| 12 to 14 Years | 10 (11.9%) | 10 (13.2%) |
| 15 Years | 0 (0.0%) | 0 (0.0%) |
| 16 and 17 Years | 0 (0.0%) | 0 (0.0%) |
| 18 to 24 Years | 11 (5.7%) | 32 (29.1%) |
| 25 to 34 Years | 0 (0.0%) | 5 (3.1%) |
| 35 to 44 Years | 0 (0.0%) | 0 (0.0%) |
| 45 to 54 Years | 0 (0.0%) | 23 (9.8%) |
| 55 to 64 Years | 0 (0.0%) | 9 (7.6%) |
| 65 to 74 Years | 10 (9.0%) | 10 (6.3%) |
| 75 Years and over | 0 (0.0%) | 13 (19.4%) |
| Total | 35 (2.8%) | 130 (9.7%) |
Income Above Poverty by Sex and Age in Center Point
According to the poverty statistics in Center Point, males aged under 5 years and females aged 5 years are the age groups that are most secure financially, with 100.0% of males and 100.0% of females in these age groups living above the poverty line.
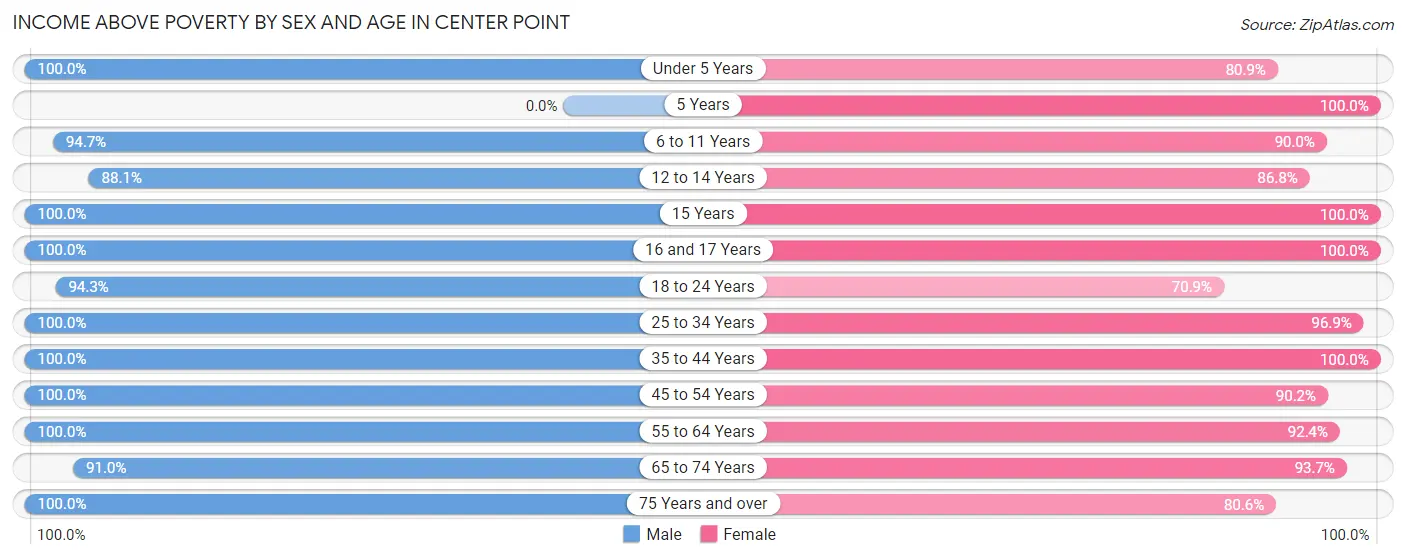
| Age Bracket | Male | Female |
| Under 5 Years | 57 (100.0%) | 72 (80.9%) |
| 5 Years | 0 (0.0%) | 23 (100.0%) |
| 6 to 11 Years | 72 (94.7%) | 99 (90.0%) |
| 12 to 14 Years | 74 (88.1%) | 66 (86.8%) |
| 15 Years | 13 (100.0%) | 8 (100.0%) |
| 16 and 17 Years | 34 (100.0%) | 79 (100.0%) |
| 18 to 24 Years | 181 (94.3%) | 78 (70.9%) |
| 25 to 34 Years | 177 (100.0%) | 154 (96.9%) |
| 35 to 44 Years | 125 (100.0%) | 106 (100.0%) |
| 45 to 54 Years | 134 (100.0%) | 212 (90.2%) |
| 55 to 64 Years | 176 (100.0%) | 110 (92.4%) |
| 65 to 74 Years | 101 (91.0%) | 149 (93.7%) |
| 75 Years and over | 54 (100.0%) | 54 (80.6%) |
| Total | 1,198 (97.2%) | 1,210 (90.3%) |
Income Below Poverty Among Married-Couple Families in Center Point
The poverty statistics for married-couple families in Center Point show that 0.9% or 5 of the total 551 families live below the poverty line. Families with no children have the highest poverty rate of 1.9%, comprising of 5 families. On the other hand, families with 1 or 2 children have the lowest poverty rate of 0.0%, which includes 0 families.
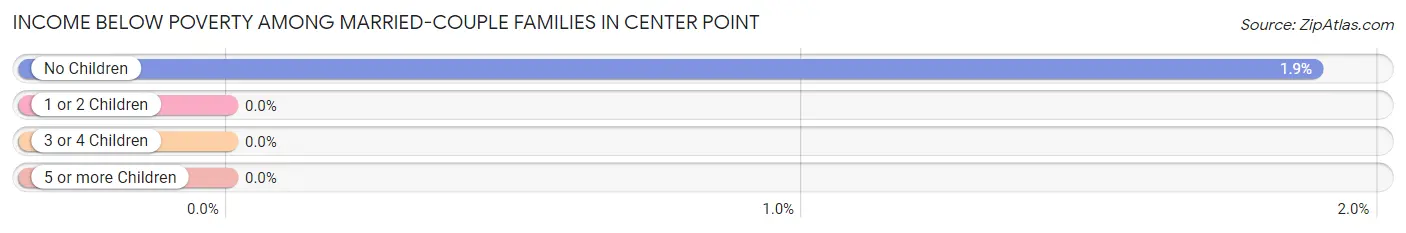
| Children | Above Poverty | Below Poverty |
| No Children | 259 (98.1%) | 5 (1.9%) |
| 1 or 2 Children | 256 (100.0%) | 0 (0.0%) |
| 3 or 4 Children | 31 (100.0%) | 0 (0.0%) |
| 5 or more Children | 0 (0.0%) | 0 (0.0%) |
| Total | 546 (99.1%) | 5 (0.9%) |
Income Below Poverty Among Single-Parent Households in Center Point
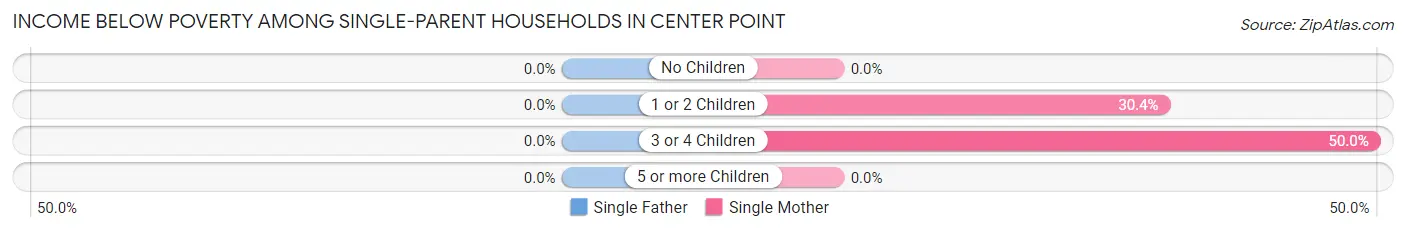
| Children | Single Father | Single Mother |
| No Children | 0 (0.0%) | 0 (0.0%) |
| 1 or 2 Children | 0 (0.0%) | 21 (30.4%) |
| 3 or 4 Children | 0 (0.0%) | 10 (50.0%) |
| 5 or more Children | 0 (0.0%) | 0 (0.0%) |
| Total | 0 (0.0%) | 31 (20.4%) |
Income Below Poverty Among Married-Couple vs Single-Parent Households in Center Point
The poverty data for Center Point shows that 5 of the married-couple family households (0.9%) and 31 of the single-parent households (17.8%) are living below the poverty level. Within the married-couple family households, those with no children have the highest poverty rate, with 5 households (1.9%) falling below the poverty line. Among the single-parent households, those with 3 or 4 children have the highest poverty rate, with 10 household (50.0%) living below poverty.
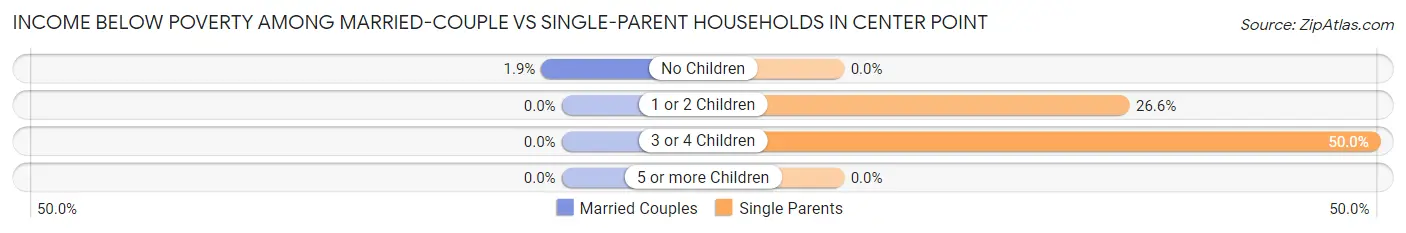
| Children | Married-Couple Families | Single-Parent Households |
| No Children | 5 (1.9%) | 0 (0.0%) |
| 1 or 2 Children | 0 (0.0%) | 21 (26.6%) |
| 3 or 4 Children | 0 (0.0%) | 10 (50.0%) |
| 5 or more Children | 0 (0.0%) | 0 (0.0%) |
| Total | 5 (0.9%) | 31 (17.8%) |
Employment Characteristics in Center Point
Employment by Class of Employer in Center Point
Among the 1,316 employed individuals in Center Point, private company employees (988 | 75.1%), local government employees (102 | 7.7%), and not-for-profit organizations (80 | 6.1%) make up the most common classes of employment.
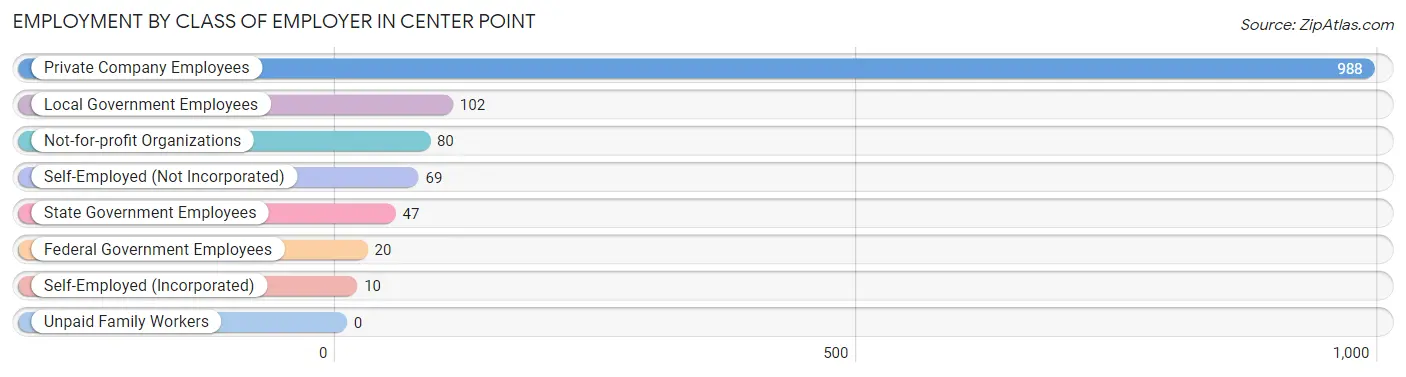
| Employer Class | # Employees | % Employees |
| Private Company Employees | 988 | 75.1% |
| Self-Employed (Incorporated) | 10 | 0.8% |
| Self-Employed (Not Incorporated) | 69 | 5.2% |
| Not-for-profit Organizations | 80 | 6.1% |
| Local Government Employees | 102 | 7.7% |
| State Government Employees | 47 | 3.6% |
| Federal Government Employees | 20 | 1.5% |
| Unpaid Family Workers | 0 | 0.0% |
| Total | 1,316 | 100.0% |
Employment Status by Age in Center Point
According to the labor force statistics for Center Point, out of the total population over 16 years of age (2,037), 70.6% or 1,438 individuals are in the labor force, with 3.1% or 45 of them unemployed. The age group with the highest labor force participation rate is 45 to 54 years, with 96.5% or 356 individuals in the labor force. Within the labor force, the 20 to 24 years age range has the highest percentage of unemployed individuals, with 17.6% or 22 of them being unemployed.
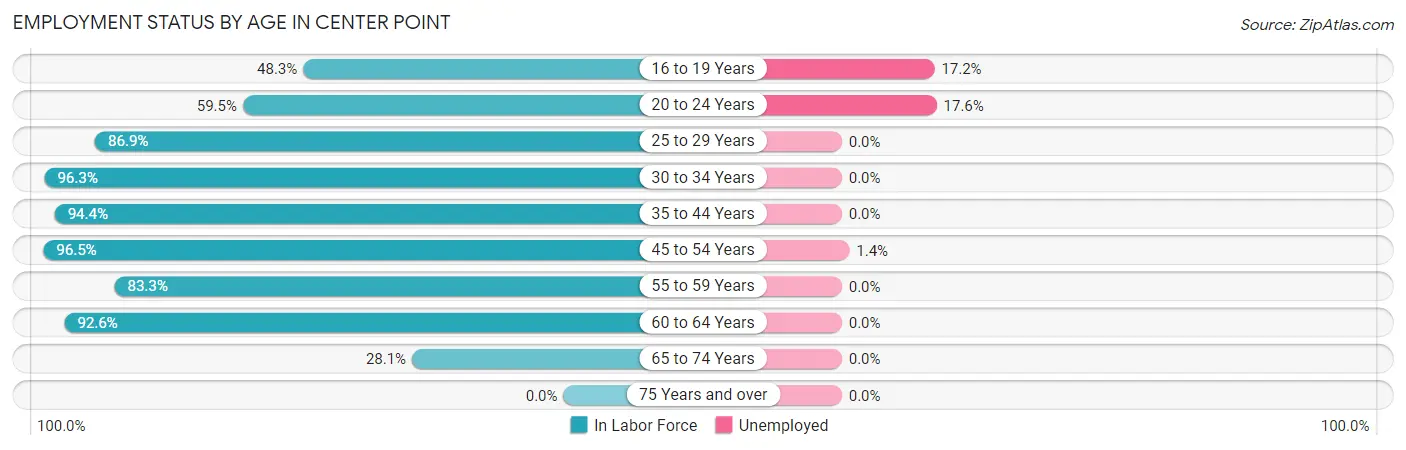
| Age Bracket | In Labor Force | Unemployed |
| 16 to 19 Years | 99 (48.3%) | 17 (17.2%) |
| 20 to 24 Years | 125 (59.5%) | 22 (17.6%) |
| 25 to 29 Years | 152 (86.9%) | 0 (0.0%) |
| 30 to 34 Years | 155 (96.3%) | 0 (0.0%) |
| 35 to 44 Years | 218 (94.4%) | 0 (0.0%) |
| 45 to 54 Years | 356 (96.5%) | 5 (1.4%) |
| 55 to 59 Years | 145 (83.3%) | 0 (0.0%) |
| 60 to 64 Years | 112 (92.6%) | 0 (0.0%) |
| 65 to 74 Years | 76 (28.1%) | 0 (0.0%) |
| 75 Years and over | 0 (0.0%) | 0 (0.0%) |
| Total | 1,438 (70.6%) | 45 (3.1%) |
Employment Status by Educational Attainment in Center Point
According to labor force statistics for Center Point, 92.4% of individuals (1,137) out of the total population between 25 and 64 years of age (1,231) are in the labor force, with 0.4% or 5 of them being unemployed. The group with the highest labor force participation rate are those with the educational attainment of less than high school, with 100.0% or 56 individuals in the labor force. Within the labor force, individuals with college / associate degree education have the highest percentage of unemployment, with 1.3% or 5 of them being unemployed.
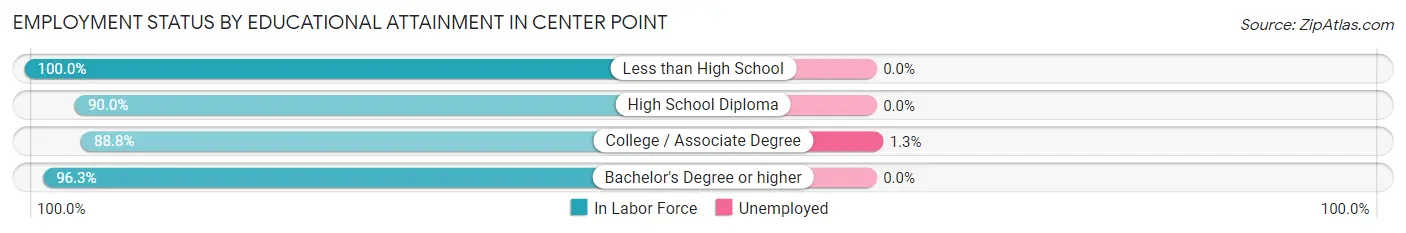
| Educational Attainment | In Labor Force | Unemployed |
| Less than High School | 56 (100.0%) | 0 (0.0%) |
| High School Diploma | 260 (90.0%) | 0 (0.0%) |
| College / Associate Degree | 374 (88.8%) | 5 (1.3%) |
| Bachelor's Degree or higher | 448 (96.3%) | 0 (0.0%) |
| Total | 1,137 (92.4%) | 5 (0.4%) |
Employment Occupations by Sex in Center Point
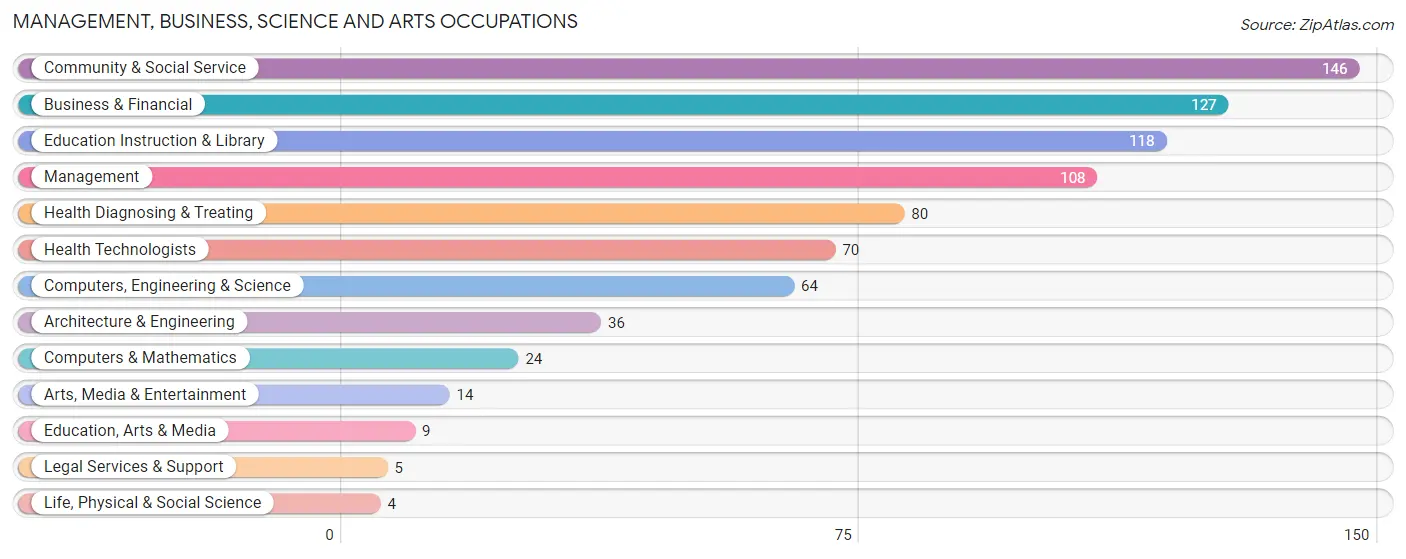
Management, Business, Science and Arts Occupations
The most common Management, Business, Science and Arts occupations in Center Point are Community & Social Service (146 | 10.5%), Business & Financial (127 | 9.1%), Education Instruction & Library (118 | 8.5%), Management (108 | 7.7%), and Health Diagnosing & Treating (80 | 5.7%).
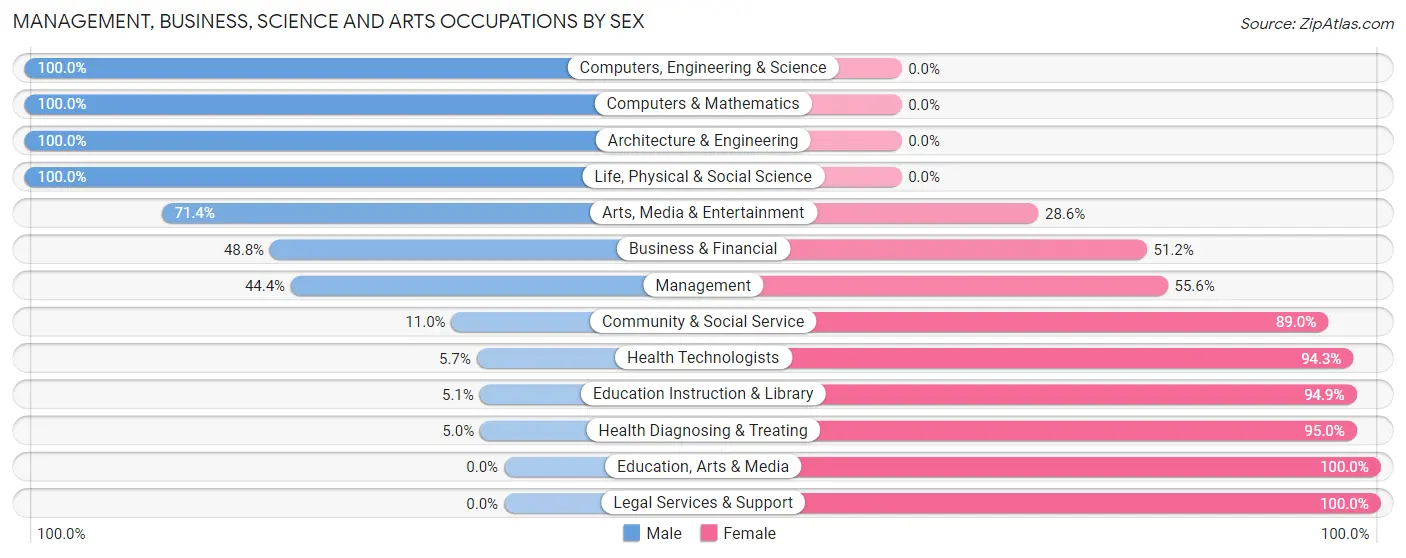
Management, Business, Science and Arts Occupations by Sex
Within the Management, Business, Science and Arts occupations in Center Point, the most male-oriented occupations are Computers, Engineering & Science (100.0%), Computers & Mathematics (100.0%), and Architecture & Engineering (100.0%), while the most female-oriented occupations are Education, Arts & Media (100.0%), Legal Services & Support (100.0%), and Health Diagnosing & Treating (95.0%).
| Occupation | Male | Female |
| Management | 48 (44.4%) | 60 (55.6%) |
| Business & Financial | 62 (48.8%) | 65 (51.2%) |
| Computers, Engineering & Science | 64 (100.0%) | 0 (0.0%) |
| Computers & Mathematics | 24 (100.0%) | 0 (0.0%) |
| Architecture & Engineering | 36 (100.0%) | 0 (0.0%) |
| Life, Physical & Social Science | 4 (100.0%) | 0 (0.0%) |
| Community & Social Service | 16 (11.0%) | 130 (89.0%) |
| Education, Arts & Media | 0 (0.0%) | 9 (100.0%) |
| Legal Services & Support | 0 (0.0%) | 5 (100.0%) |
| Education Instruction & Library | 6 (5.1%) | 112 (94.9%) |
| Arts, Media & Entertainment | 10 (71.4%) | 4 (28.6%) |
| Health Diagnosing & Treating | 4 (5.0%) | 76 (95.0%) |
| Health Technologists | 4 (5.7%) | 66 (94.3%) |
| Total (Category) | 194 (36.9%) | 331 (63.0%) |
| Total (Overall) | 700 (50.2%) | 694 (49.8%) |
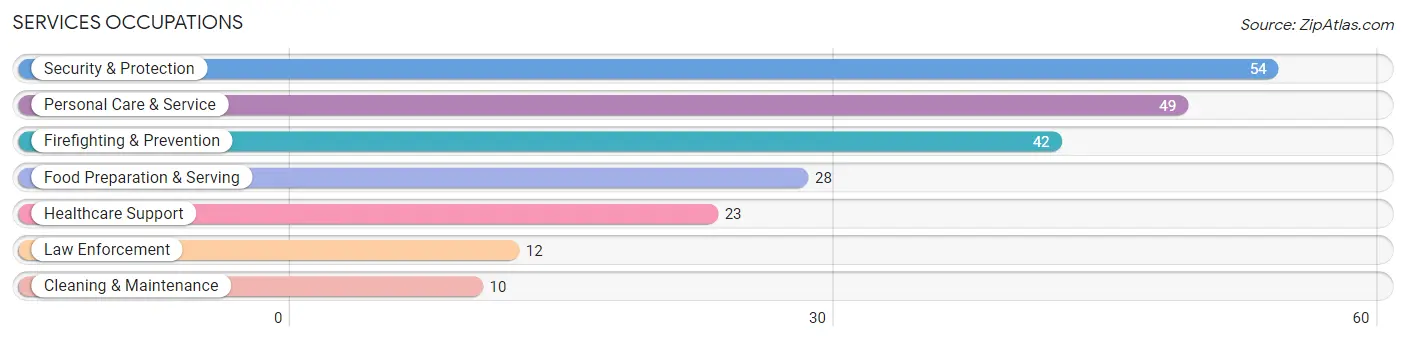
Services Occupations
The most common Services occupations in Center Point are Security & Protection (54 | 3.9%), Personal Care & Service (49 | 3.5%), Firefighting & Prevention (42 | 3.0%), Food Preparation & Serving (28 | 2.0%), and Healthcare Support (23 | 1.7%).
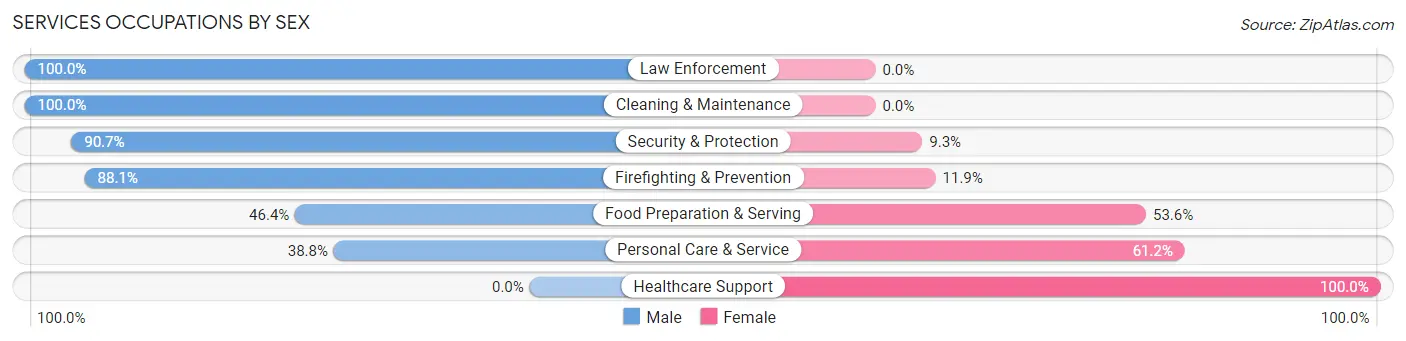
Services Occupations by Sex
Within the Services occupations in Center Point, the most male-oriented occupations are Law Enforcement (100.0%), Cleaning & Maintenance (100.0%), and Security & Protection (90.7%), while the most female-oriented occupations are Healthcare Support (100.0%), Personal Care & Service (61.2%), and Food Preparation & Serving (53.6%).
| Occupation | Male | Female |
| Healthcare Support | 0 (0.0%) | 23 (100.0%) |
| Security & Protection | 49 (90.7%) | 5 (9.3%) |
| Firefighting & Prevention | 37 (88.1%) | 5 (11.9%) |
| Law Enforcement | 12 (100.0%) | 0 (0.0%) |
| Food Preparation & Serving | 13 (46.4%) | 15 (53.6%) |
| Cleaning & Maintenance | 10 (100.0%) | 0 (0.0%) |
| Personal Care & Service | 19 (38.8%) | 30 (61.2%) |
| Total (Category) | 91 (55.5%) | 73 (44.5%) |
| Total (Overall) | 700 (50.2%) | 694 (49.8%) |
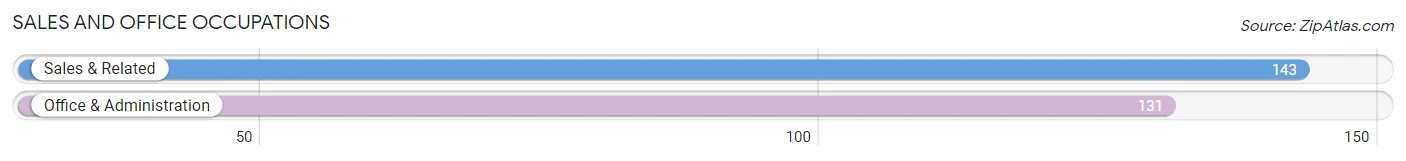
Sales and Office Occupations
The most common Sales and Office occupations in Center Point are Sales & Related (143 | 10.3%), and Office & Administration (131 | 9.4%).
Sales and Office Occupations by Sex
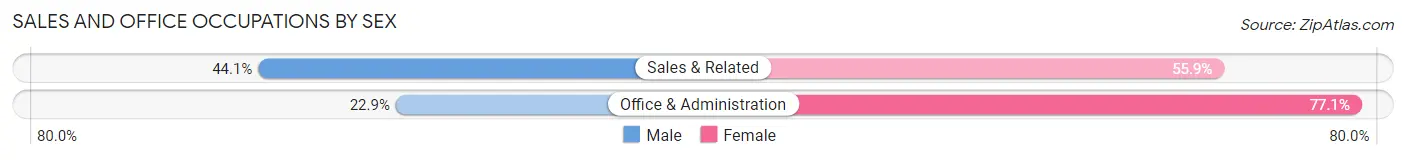
| Occupation | Male | Female |
| Sales & Related | 63 (44.1%) | 80 (55.9%) |
| Office & Administration | 30 (22.9%) | 101 (77.1%) |
| Total (Category) | 93 (33.9%) | 181 (66.1%) |
| Total (Overall) | 700 (50.2%) | 694 (49.8%) |
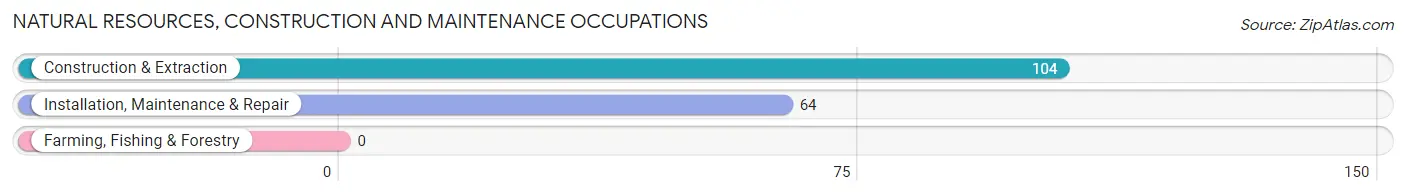
Natural Resources, Construction and Maintenance Occupations
The most common Natural Resources, Construction and Maintenance occupations in Center Point are Construction & Extraction (104 | 7.5%), and Installation, Maintenance & Repair (64 | 4.6%).
Natural Resources, Construction and Maintenance Occupations by Sex
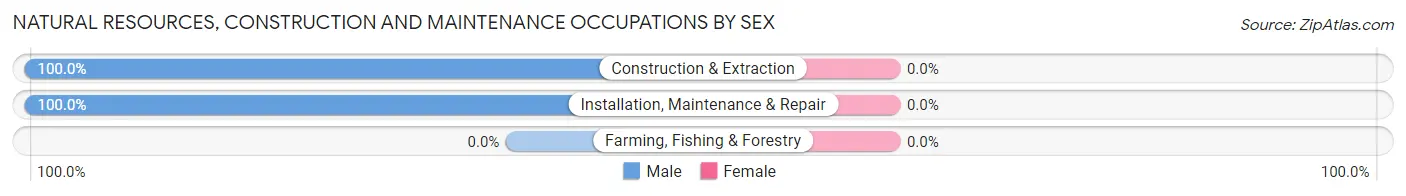
| Occupation | Male | Female |
| Farming, Fishing & Forestry | 0 (0.0%) | 0 (0.0%) |
| Construction & Extraction | 104 (100.0%) | 0 (0.0%) |
| Installation, Maintenance & Repair | 64 (100.0%) | 0 (0.0%) |
| Total (Category) | 168 (100.0%) | 0 (0.0%) |
| Total (Overall) | 700 (50.2%) | 694 (49.8%) |
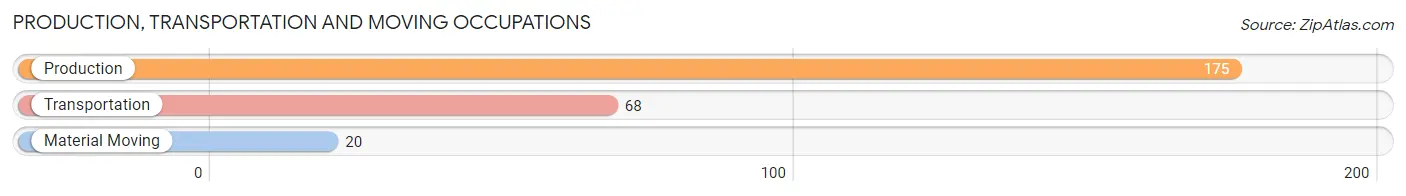
Production, Transportation and Moving Occupations
The most common Production, Transportation and Moving occupations in Center Point are Production (175 | 12.6%), Transportation (68 | 4.9%), and Material Moving (20 | 1.4%).
Production, Transportation and Moving Occupations by Sex
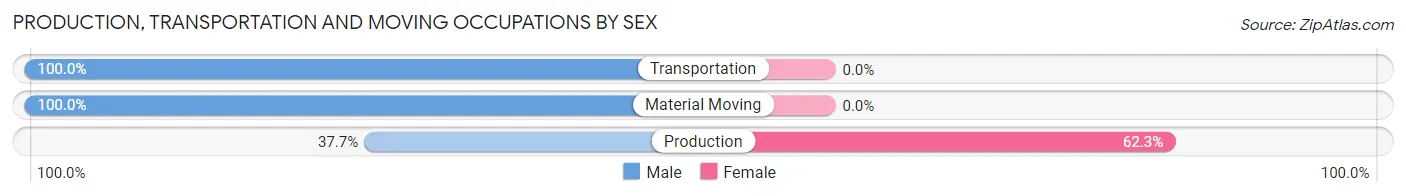
| Occupation | Male | Female |
| Production | 66 (37.7%) | 109 (62.3%) |
| Transportation | 68 (100.0%) | 0 (0.0%) |
| Material Moving | 20 (100.0%) | 0 (0.0%) |
| Total (Category) | 154 (58.6%) | 109 (41.4%) |
| Total (Overall) | 700 (50.2%) | 694 (49.8%) |
Employment Industries by Sex in Center Point
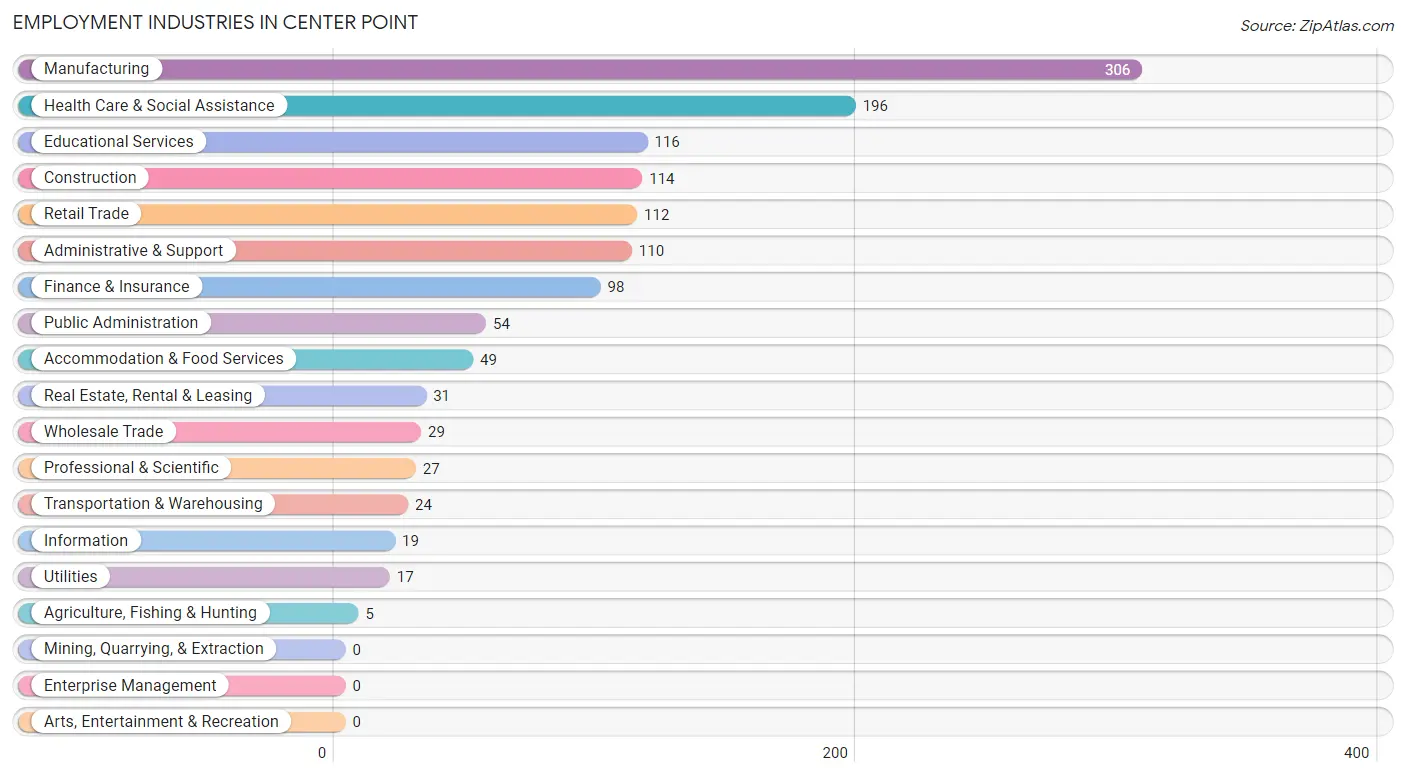
Employment Industries in Center Point
The major employment industries in Center Point include Manufacturing (306 | 22.0%), Health Care & Social Assistance (196 | 14.1%), Educational Services (116 | 8.3%), Construction (114 | 8.2%), and Retail Trade (112 | 8.0%).
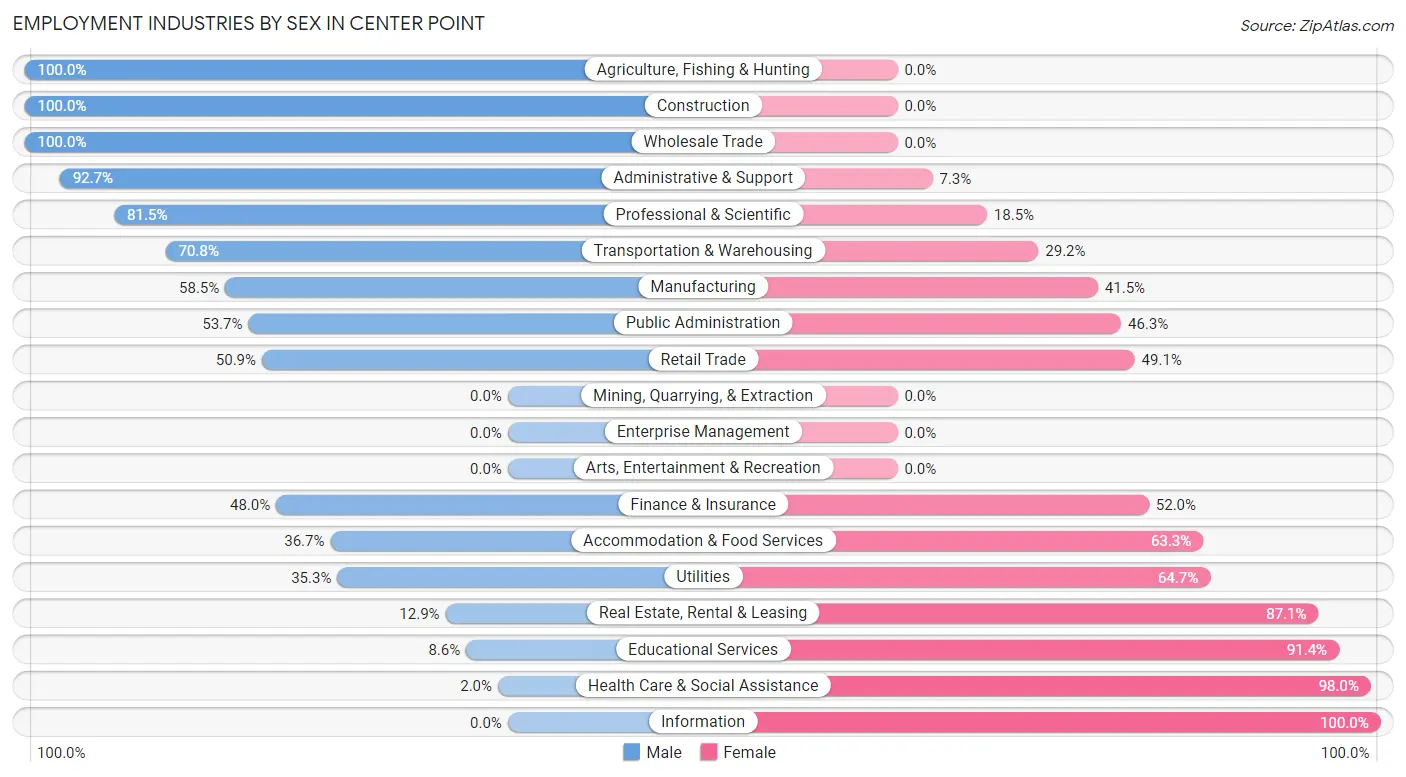
Employment Industries by Sex in Center Point
The Center Point industries that see more men than women are Agriculture, Fishing & Hunting (100.0%), Construction (100.0%), and Wholesale Trade (100.0%), whereas the industries that tend to have a higher number of women are Information (100.0%), Health Care & Social Assistance (98.0%), and Educational Services (91.4%).
| Industry | Male | Female |
| Agriculture, Fishing & Hunting | 5 (100.0%) | 0 (0.0%) |
| Mining, Quarrying, & Extraction | 0 (0.0%) | 0 (0.0%) |
| Construction | 114 (100.0%) | 0 (0.0%) |
| Manufacturing | 179 (58.5%) | 127 (41.5%) |
| Wholesale Trade | 29 (100.0%) | 0 (0.0%) |
| Retail Trade | 57 (50.9%) | 55 (49.1%) |
| Transportation & Warehousing | 17 (70.8%) | 7 (29.2%) |
| Utilities | 6 (35.3%) | 11 (64.7%) |
| Information | 0 (0.0%) | 19 (100.0%) |
| Finance & Insurance | 47 (48.0%) | 51 (52.0%) |
| Real Estate, Rental & Leasing | 4 (12.9%) | 27 (87.1%) |
| Professional & Scientific | 22 (81.5%) | 5 (18.5%) |
| Enterprise Management | 0 (0.0%) | 0 (0.0%) |
| Administrative & Support | 102 (92.7%) | 8 (7.3%) |
| Educational Services | 10 (8.6%) | 106 (91.4%) |
| Health Care & Social Assistance | 4 (2.0%) | 192 (98.0%) |
| Arts, Entertainment & Recreation | 0 (0.0%) | 0 (0.0%) |
| Accommodation & Food Services | 18 (36.7%) | 31 (63.3%) |
| Public Administration | 29 (53.7%) | 25 (46.3%) |
| Total | 700 (50.2%) | 694 (49.8%) |
Education in Center Point
School Enrollment in Center Point
The most common levels of schooling among the 663 students in Center Point are middle school (203 | 30.6%), high school (163 | 24.6%), and college / undergraduate (117 | 17.6%).
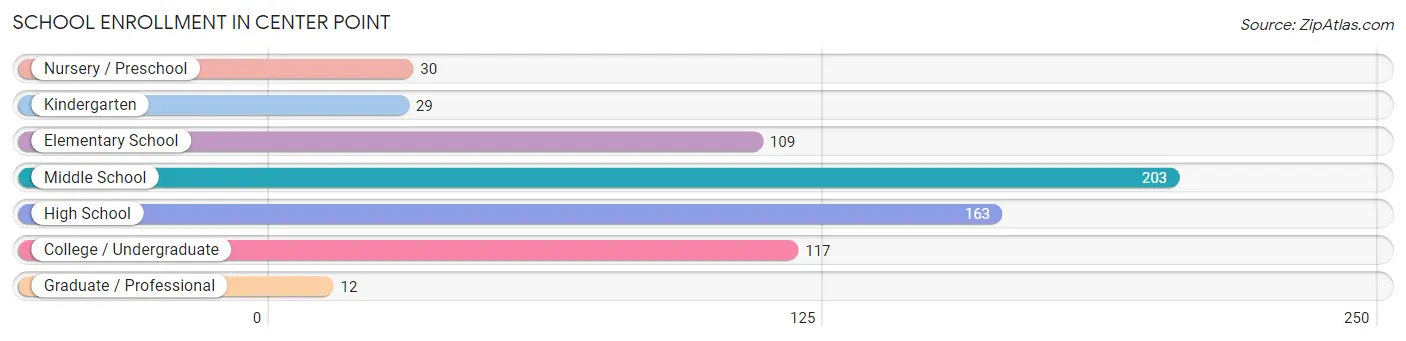
| School Level | # Students | % Students |
| Nursery / Preschool | 30 | 4.5% |
| Kindergarten | 29 | 4.4% |
| Elementary School | 109 | 16.4% |
| Middle School | 203 | 30.6% |
| High School | 163 | 24.6% |
| College / Undergraduate | 117 | 17.6% |
| Graduate / Professional | 12 | 1.8% |
| Total | 663 | 100.0% |
School Enrollment by Age by Funding Source in Center Point
Out of a total of 663 students who are enrolled in schools in Center Point, 26 (3.9%) attend a private institution, while the remaining 637 (96.1%) are enrolled in public schools. The age group of 20 to 24 year olds has the highest likelihood of being enrolled in private schools, with 10 (25.0% in the age bracket) enrolled. Conversely, the age group of 3 to 4 year olds has the lowest likelihood of being enrolled in a private school, with 26 (100.0% in the age bracket) attending a public institution.
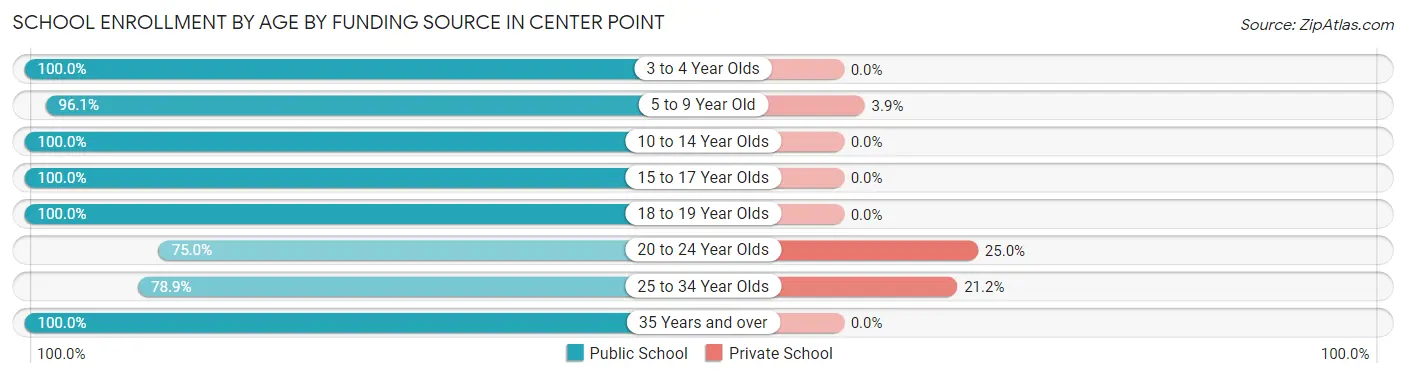
| Age Bracket | Public School | Private School |
| 3 to 4 Year Olds | 26 (100.0%) | 0 (0.0%) |
| 5 to 9 Year Old | 123 (96.1%) | 5 (3.9%) |
| 10 to 14 Year Olds | 221 (100.0%) | 0 (0.0%) |
| 15 to 17 Year Olds | 134 (100.0%) | 0 (0.0%) |
| 18 to 19 Year Olds | 47 (100.0%) | 0 (0.0%) |
| 20 to 24 Year Olds | 30 (75.0%) | 10 (25.0%) |
| 25 to 34 Year Olds | 41 (78.8%) | 11 (21.1%) |
| 35 Years and over | 15 (100.0%) | 0 (0.0%) |
| Total | 637 (96.1%) | 26 (3.9%) |
Educational Attainment by Field of Study in Center Point
Education (126 | 23.0%), business (123 | 22.5%), science & technology (73 | 13.3%), arts & humanities (47 | 8.6%), and bio, nature & agricultural (43 | 7.9%) are the most common fields of study among 548 individuals in Center Point who have obtained a bachelor's degree or higher.
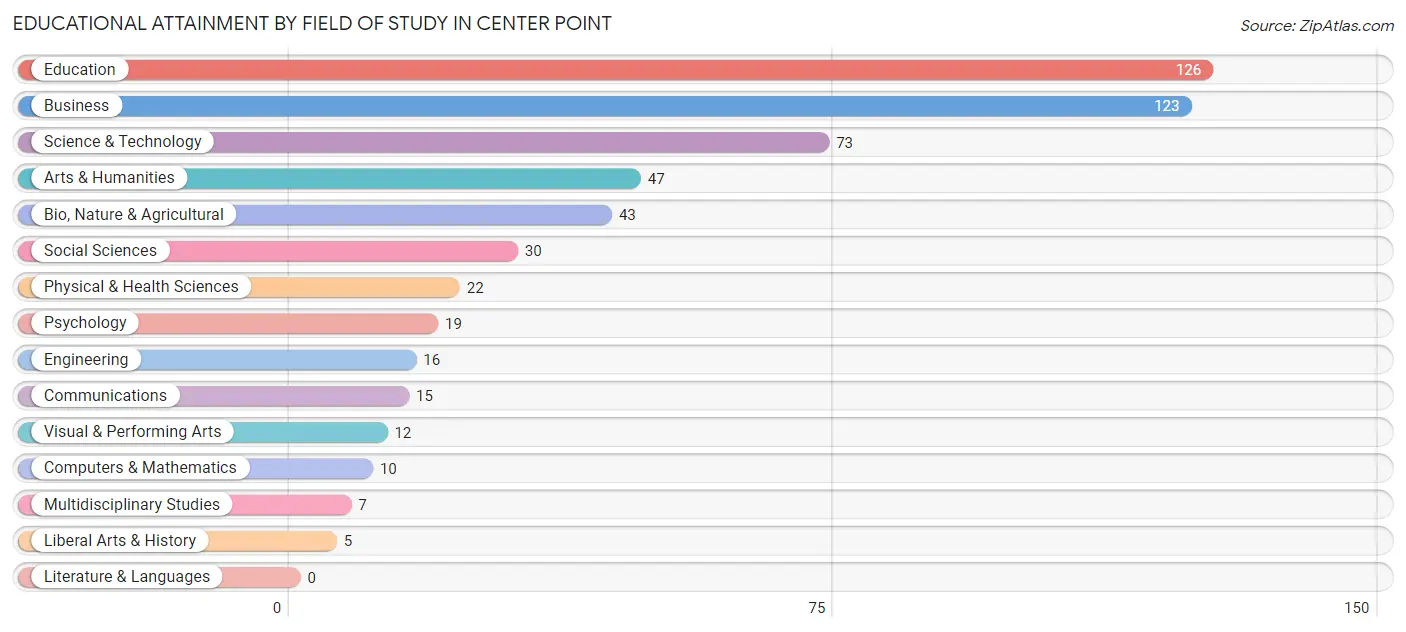
| Field of Study | # Graduates | % Graduates |
| Computers & Mathematics | 10 | 1.8% |
| Bio, Nature & Agricultural | 43 | 7.9% |
| Physical & Health Sciences | 22 | 4.0% |
| Psychology | 19 | 3.5% |
| Social Sciences | 30 | 5.5% |
| Engineering | 16 | 2.9% |
| Multidisciplinary Studies | 7 | 1.3% |
| Science & Technology | 73 | 13.3% |
| Business | 123 | 22.5% |
| Education | 126 | 23.0% |
| Literature & Languages | 0 | 0.0% |
| Liberal Arts & History | 5 | 0.9% |
| Visual & Performing Arts | 12 | 2.2% |
| Communications | 15 | 2.7% |
| Arts & Humanities | 47 | 8.6% |
| Total | 548 | 100.0% |
Transportation & Commute in Center Point
Vehicle Availability by Sex in Center Point
The most prevalent vehicle ownership categories in Center Point are males with 3 vehicles (221, accounting for 35.3%) and females with 3 vehicles (266, making up 32.0%).
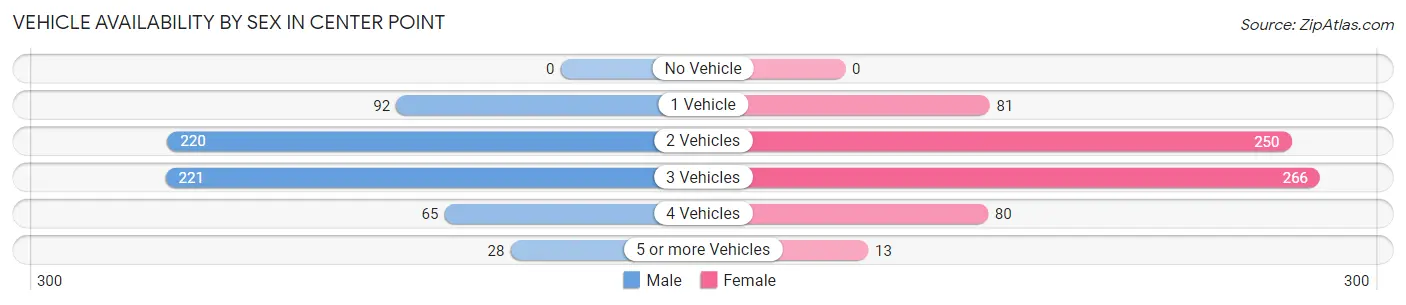
| Vehicles Available | Male | Female |
| No Vehicle | 0 (0.0%) | 0 (0.0%) |
| 1 Vehicle | 92 (14.7%) | 81 (11.7%) |
| 2 Vehicles | 220 (35.1%) | 250 (36.2%) |
| 3 Vehicles | 221 (35.3%) | 266 (38.6%) |
| 4 Vehicles | 65 (10.4%) | 80 (11.6%) |
| 5 or more Vehicles | 28 (4.5%) | 13 (1.9%) |
| Total | 626 (100.0%) | 690 (100.0%) |
Commute Time in Center Point
The most frequently occuring commute durations in Center Point are 20 to 24 minutes (241 commuters, 21.4%), 25 to 29 minutes (176 commuters, 15.6%), and 15 to 19 minutes (135 commuters, 12.0%).
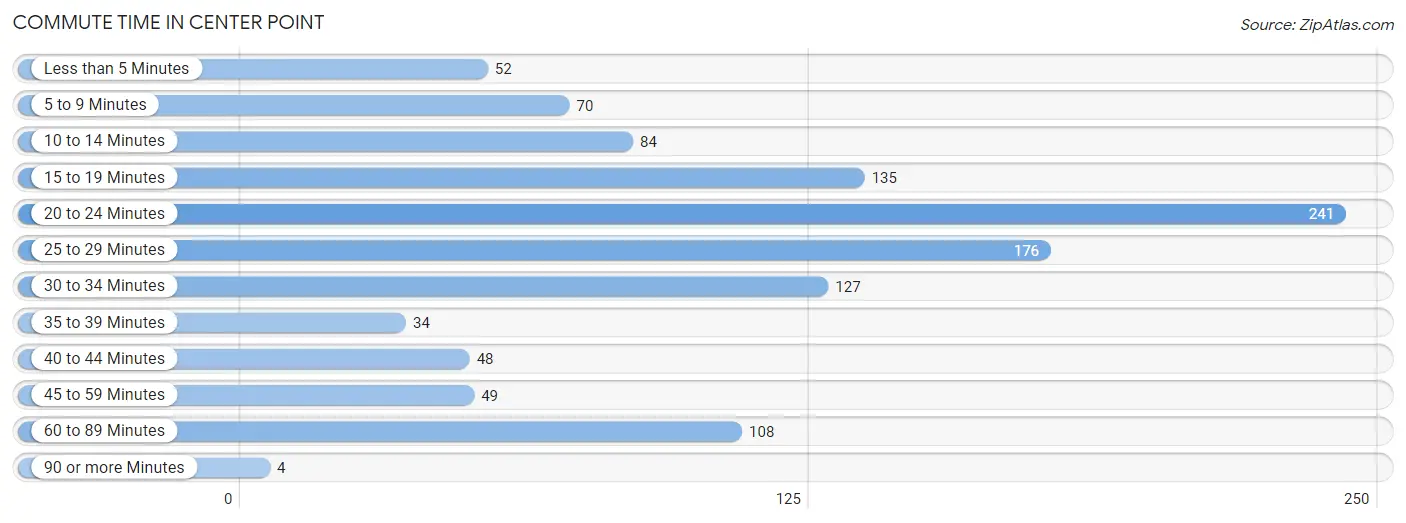
| Commute Time | # Commuters | % Commuters |
| Less than 5 Minutes | 52 | 4.6% |
| 5 to 9 Minutes | 70 | 6.2% |
| 10 to 14 Minutes | 84 | 7.4% |
| 15 to 19 Minutes | 135 | 12.0% |
| 20 to 24 Minutes | 241 | 21.4% |
| 25 to 29 Minutes | 176 | 15.6% |
| 30 to 34 Minutes | 127 | 11.3% |
| 35 to 39 Minutes | 34 | 3.0% |
| 40 to 44 Minutes | 48 | 4.3% |
| 45 to 59 Minutes | 49 | 4.3% |
| 60 to 89 Minutes | 108 | 9.6% |
| 90 or more Minutes | 4 | 0.4% |
Commute Time by Sex in Center Point
The most common commute times in Center Point are 25 to 29 minutes (102 commuters, 18.1%) for males and 20 to 24 minutes (144 commuters, 25.4%) for females.
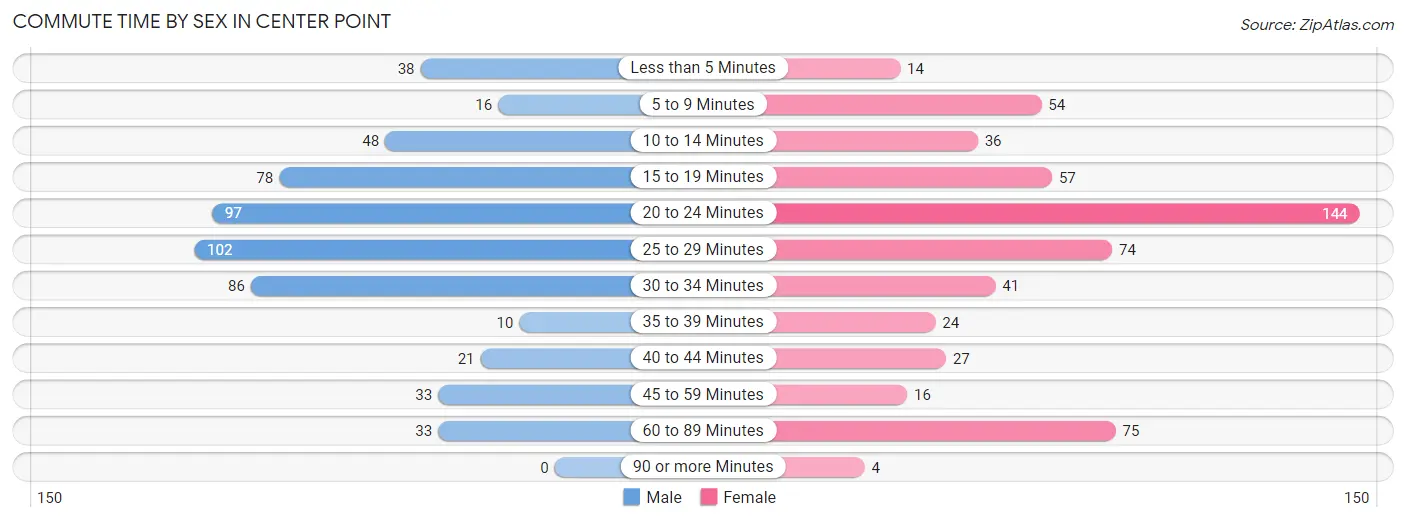
| Commute Time | Male | Female |
| Less than 5 Minutes | 38 (6.8%) | 14 (2.5%) |
| 5 to 9 Minutes | 16 (2.9%) | 54 (9.5%) |
| 10 to 14 Minutes | 48 (8.5%) | 36 (6.4%) |
| 15 to 19 Minutes | 78 (13.9%) | 57 (10.1%) |
| 20 to 24 Minutes | 97 (17.3%) | 144 (25.4%) |
| 25 to 29 Minutes | 102 (18.1%) | 74 (13.1%) |
| 30 to 34 Minutes | 86 (15.3%) | 41 (7.2%) |
| 35 to 39 Minutes | 10 (1.8%) | 24 (4.2%) |
| 40 to 44 Minutes | 21 (3.7%) | 27 (4.8%) |
| 45 to 59 Minutes | 33 (5.9%) | 16 (2.8%) |
| 60 to 89 Minutes | 33 (5.9%) | 75 (13.3%) |
| 90 or more Minutes | 0 (0.0%) | 4 (0.7%) |
Time of Departure to Work by Sex in Center Point
The most frequent times of departure to work in Center Point are 6:30 AM to 6:59 AM (131, 23.3%) for males and 7:00 AM to 7:29 AM (146, 25.8%) for females.
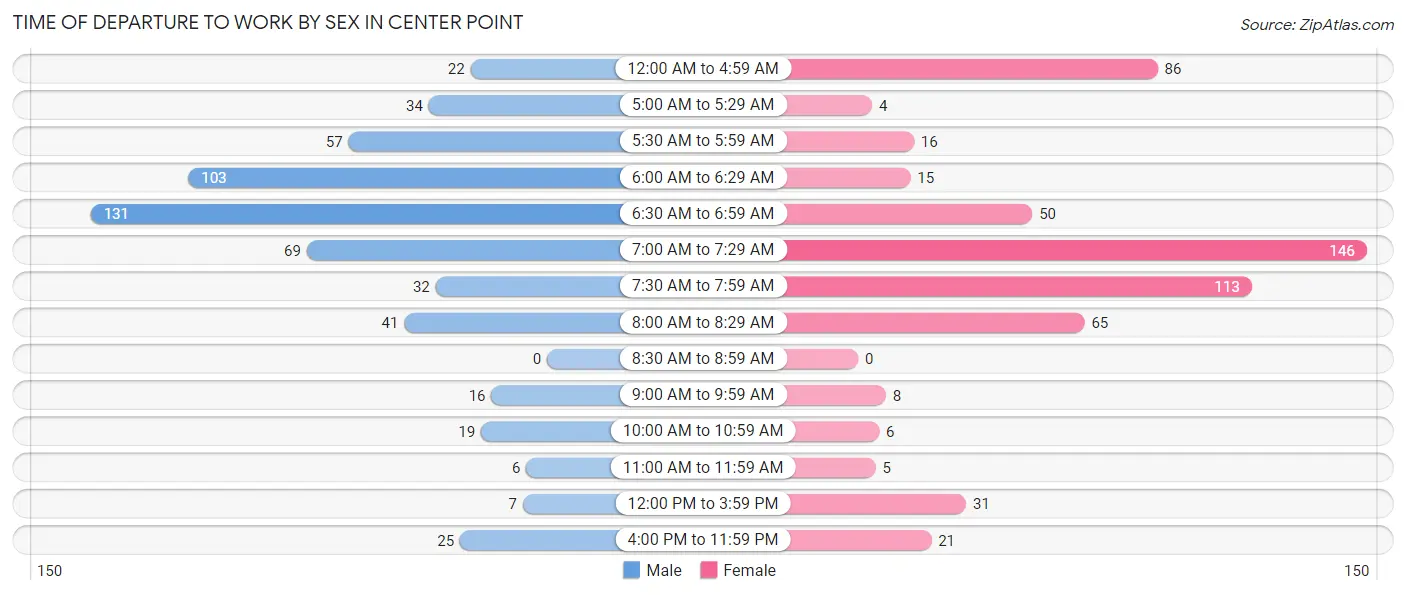
| Time of Departure | Male | Female |
| 12:00 AM to 4:59 AM | 22 (3.9%) | 86 (15.2%) |
| 5:00 AM to 5:29 AM | 34 (6.0%) | 4 (0.7%) |
| 5:30 AM to 5:59 AM | 57 (10.1%) | 16 (2.8%) |
| 6:00 AM to 6:29 AM | 103 (18.3%) | 15 (2.6%) |
| 6:30 AM to 6:59 AM | 131 (23.3%) | 50 (8.8%) |
| 7:00 AM to 7:29 AM | 69 (12.3%) | 146 (25.8%) |
| 7:30 AM to 7:59 AM | 32 (5.7%) | 113 (20.0%) |
| 8:00 AM to 8:29 AM | 41 (7.3%) | 65 (11.5%) |
| 8:30 AM to 8:59 AM | 0 (0.0%) | 0 (0.0%) |
| 9:00 AM to 9:59 AM | 16 (2.9%) | 8 (1.4%) |
| 10:00 AM to 10:59 AM | 19 (3.4%) | 6 (1.1%) |
| 11:00 AM to 11:59 AM | 6 (1.1%) | 5 (0.9%) |
| 12:00 PM to 3:59 PM | 7 (1.3%) | 31 (5.5%) |
| 4:00 PM to 11:59 PM | 25 (4.4%) | 21 (3.7%) |
| Total | 562 (100.0%) | 566 (100.0%) |
Housing Occupancy in Center Point
Occupancy by Ownership in Center Point
Of the total 986 dwellings in Center Point, owner-occupied units account for 768 (77.9%), while renter-occupied units make up 218 (22.1%).
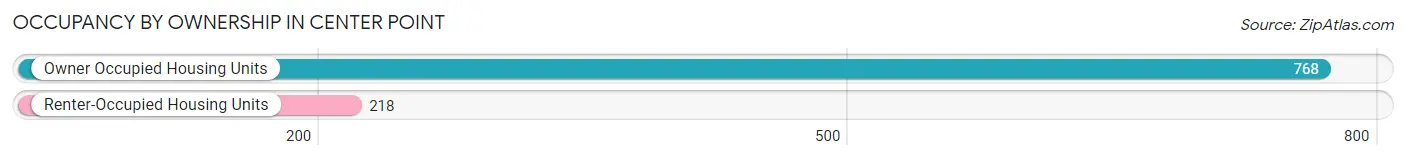
| Occupancy | # Housing Units | % Housing Units |
| Owner Occupied Housing Units | 768 | 77.9% |
| Renter-Occupied Housing Units | 218 | 22.1% |
| Total Occupied Housing Units | 986 | 100.0% |
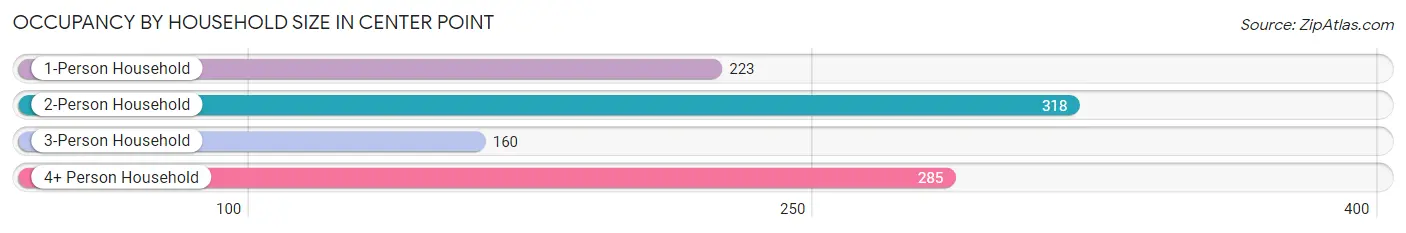
Occupancy by Household Size in Center Point
| Household Size | # Housing Units | % Housing Units |
| 1-Person Household | 223 | 22.6% |
| 2-Person Household | 318 | 32.3% |
| 3-Person Household | 160 | 16.2% |
| 4+ Person Household | 285 | 28.9% |
| Total Housing Units | 986 | 100.0% |
Occupancy by Ownership by Household Size in Center Point
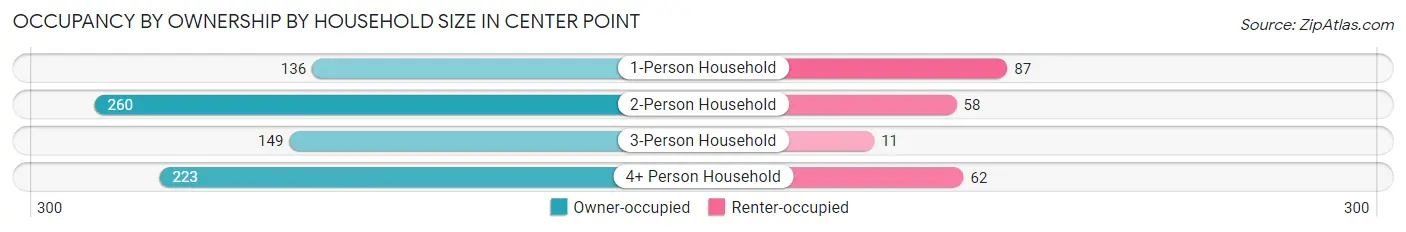
| Household Size | Owner-occupied | Renter-occupied |
| 1-Person Household | 136 (61.0%) | 87 (39.0%) |
| 2-Person Household | 260 (81.8%) | 58 (18.2%) |
| 3-Person Household | 149 (93.1%) | 11 (6.9%) |
| 4+ Person Household | 223 (78.2%) | 62 (21.7%) |
| Total Housing Units | 768 (77.9%) | 218 (22.1%) |
Occupancy by Educational Attainment in Center Point
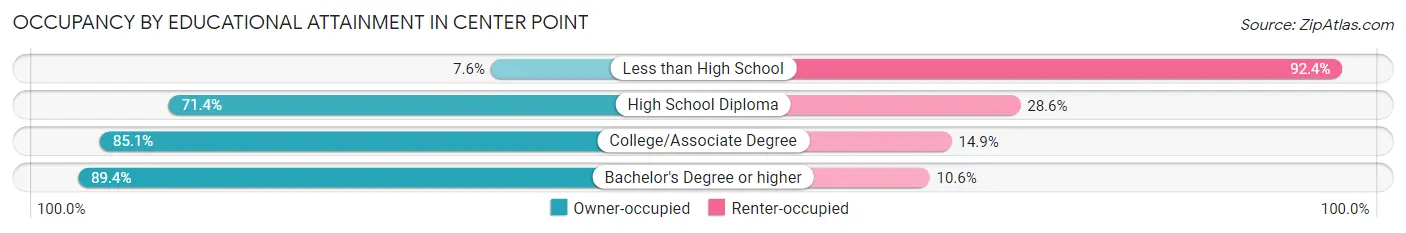
| Household Size | Owner-occupied | Renter-occupied |
| Less than High School | 5 (7.6%) | 61 (92.4%) |
| High School Diploma | 180 (71.4%) | 72 (28.6%) |
| College/Associate Degree | 279 (85.1%) | 49 (14.9%) |
| Bachelor's Degree or higher | 304 (89.4%) | 36 (10.6%) |
Occupancy by Age of Householder in Center Point
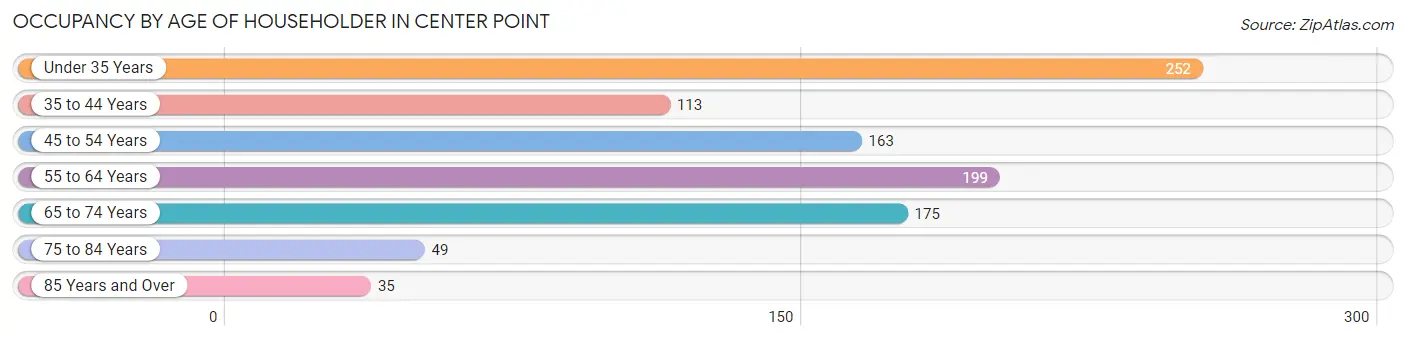
| Age Bracket | # Households | % Households |
| Under 35 Years | 252 | 25.6% |
| 35 to 44 Years | 113 | 11.5% |
| 45 to 54 Years | 163 | 16.5% |
| 55 to 64 Years | 199 | 20.2% |
| 65 to 74 Years | 175 | 17.7% |
| 75 to 84 Years | 49 | 5.0% |
| 85 Years and Over | 35 | 3.5% |
| Total | 986 | 100.0% |
Housing Finances in Center Point
Median Income by Occupancy in Center Point
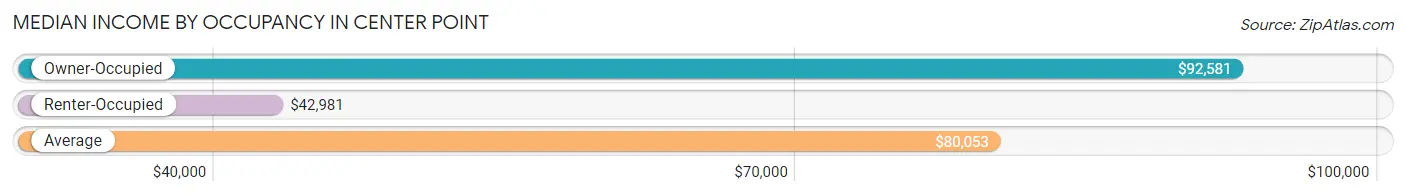
| Occupancy Type | # Households | Median Income |
| Owner-Occupied | 768 (77.9%) | $92,581 |
| Renter-Occupied | 218 (22.1%) | $42,981 |
| Average | 986 (100.0%) | $80,053 |
Occupancy by Householder Income Bracket in Center Point
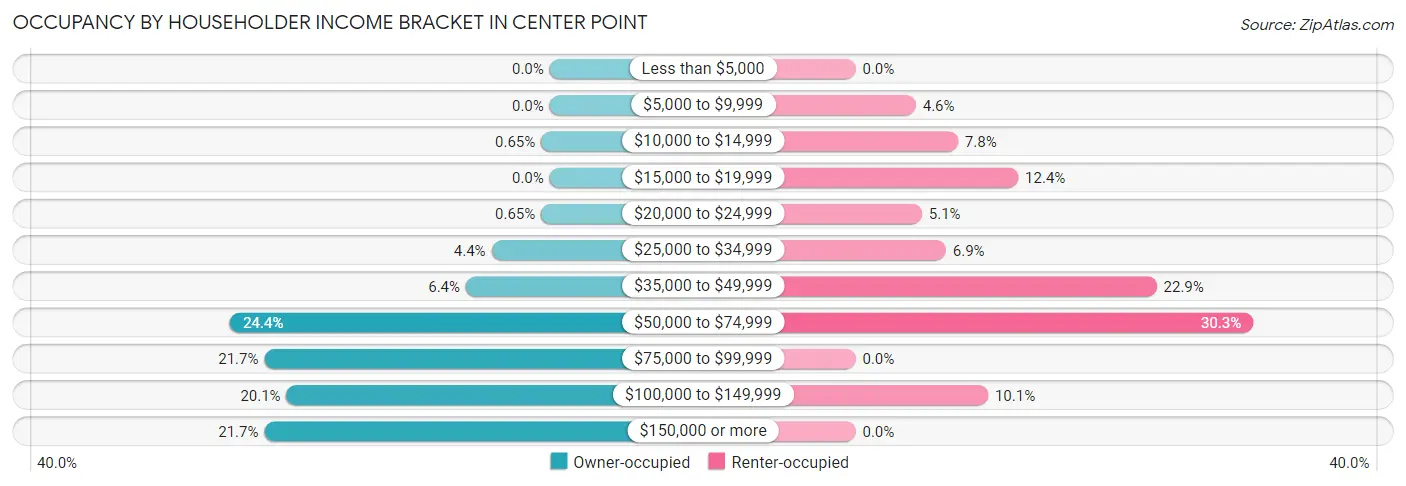
| Income Bracket | Owner-occupied | Renter-occupied |
| Less than $5,000 | 0 (0.0%) | 0 (0.0%) |
| $5,000 to $9,999 | 0 (0.0%) | 10 (4.6%) |
| $10,000 to $14,999 | 5 (0.6%) | 17 (7.8%) |
| $15,000 to $19,999 | 0 (0.0%) | 27 (12.4%) |
| $20,000 to $24,999 | 5 (0.6%) | 11 (5.1%) |
| $25,000 to $34,999 | 34 (4.4%) | 15 (6.9%) |
| $35,000 to $49,999 | 49 (6.4%) | 50 (22.9%) |
| $50,000 to $74,999 | 187 (24.3%) | 66 (30.3%) |
| $75,000 to $99,999 | 167 (21.7%) | 0 (0.0%) |
| $100,000 to $149,999 | 154 (20.1%) | 22 (10.1%) |
| $150,000 or more | 167 (21.7%) | 0 (0.0%) |
| Total | 768 (100.0%) | 218 (100.0%) |
Monthly Housing Cost Tiers in Center Point
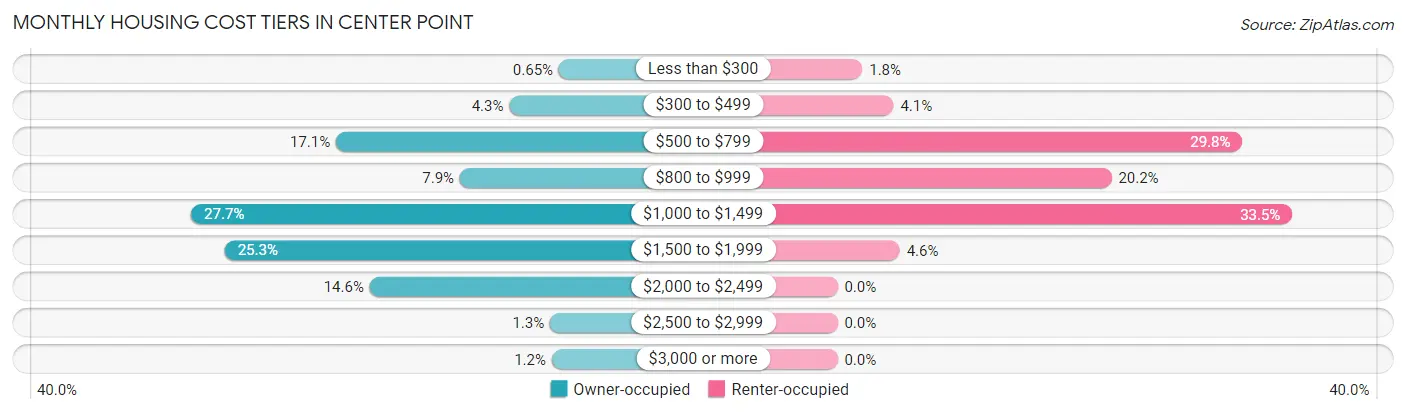
| Monthly Cost | Owner-occupied | Renter-occupied |
| Less than $300 | 5 (0.6%) | 4 (1.8%) |
| $300 to $499 | 33 (4.3%) | 9 (4.1%) |
| $500 to $799 | 131 (17.1%) | 65 (29.8%) |
| $800 to $999 | 61 (7.9%) | 44 (20.2%) |
| $1,000 to $1,499 | 213 (27.7%) | 73 (33.5%) |
| $1,500 to $1,999 | 194 (25.3%) | 10 (4.6%) |
| $2,000 to $2,499 | 112 (14.6%) | 0 (0.0%) |
| $2,500 to $2,999 | 10 (1.3%) | 0 (0.0%) |
| $3,000 or more | 9 (1.2%) | 0 (0.0%) |
| Total | 768 (100.0%) | 218 (100.0%) |
Physical Housing Characteristics in Center Point
Housing Structures in Center Point
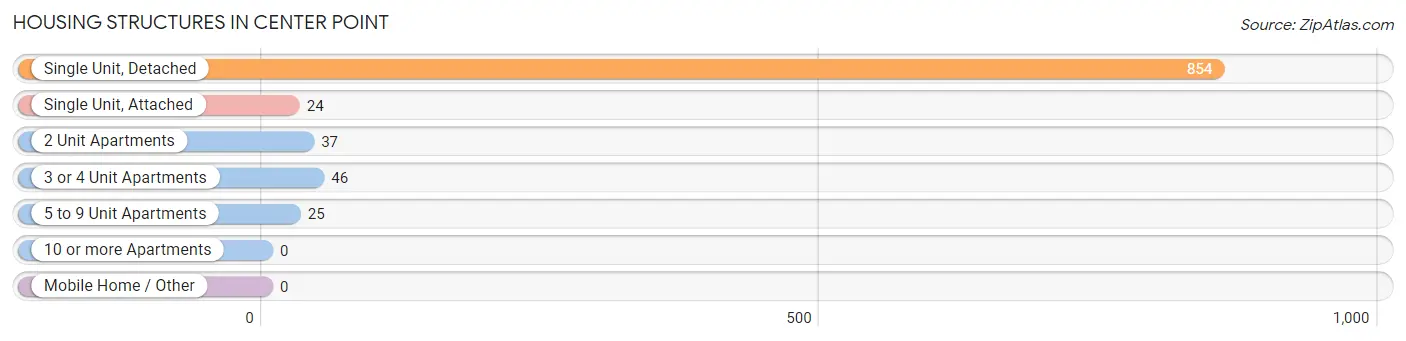
| Structure Type | # Housing Units | % Housing Units |
| Single Unit, Detached | 854 | 86.6% |
| Single Unit, Attached | 24 | 2.4% |
| 2 Unit Apartments | 37 | 3.7% |
| 3 or 4 Unit Apartments | 46 | 4.7% |
| 5 to 9 Unit Apartments | 25 | 2.5% |
| 10 or more Apartments | 0 | 0.0% |
| Mobile Home / Other | 0 | 0.0% |
| Total | 986 | 100.0% |
Housing Structures by Occupancy in Center Point
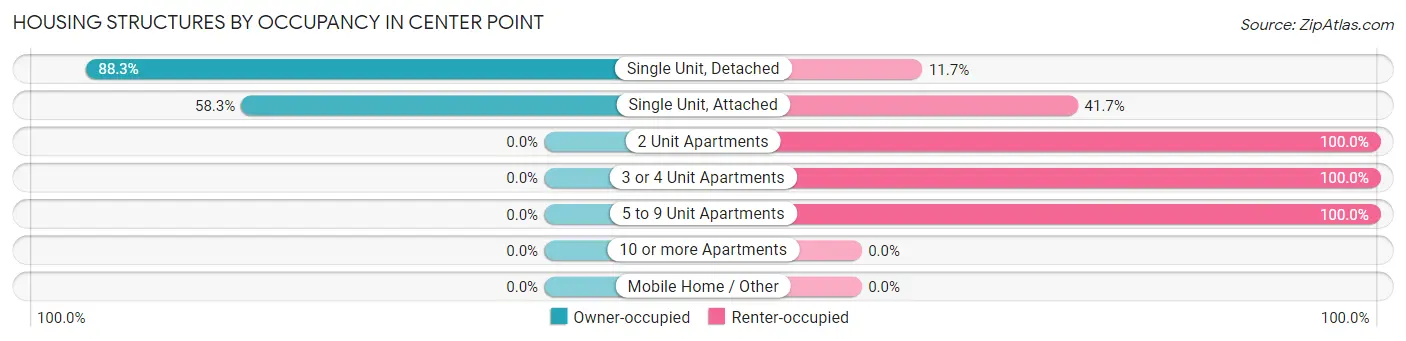
| Structure Type | Owner-occupied | Renter-occupied |
| Single Unit, Detached | 754 (88.3%) | 100 (11.7%) |
| Single Unit, Attached | 14 (58.3%) | 10 (41.7%) |
| 2 Unit Apartments | 0 (0.0%) | 37 (100.0%) |
| 3 or 4 Unit Apartments | 0 (0.0%) | 46 (100.0%) |
| 5 to 9 Unit Apartments | 0 (0.0%) | 25 (100.0%) |
| 10 or more Apartments | 0 (0.0%) | 0 (0.0%) |
| Mobile Home / Other | 0 (0.0%) | 0 (0.0%) |
| Total | 768 (77.9%) | 218 (22.1%) |
Housing Structures by Number of Rooms in Center Point
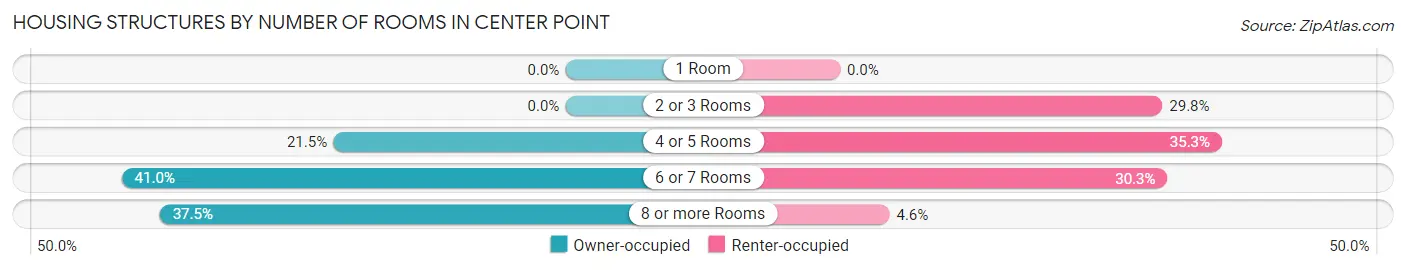
| Number of Rooms | Owner-occupied | Renter-occupied |
| 1 Room | 0 (0.0%) | 0 (0.0%) |
| 2 or 3 Rooms | 0 (0.0%) | 65 (29.8%) |
| 4 or 5 Rooms | 165 (21.5%) | 77 (35.3%) |
| 6 or 7 Rooms | 315 (41.0%) | 66 (30.3%) |
| 8 or more Rooms | 288 (37.5%) | 10 (4.6%) |
| Total | 768 (100.0%) | 218 (100.0%) |
Housing Structure by Heating Type in Center Point
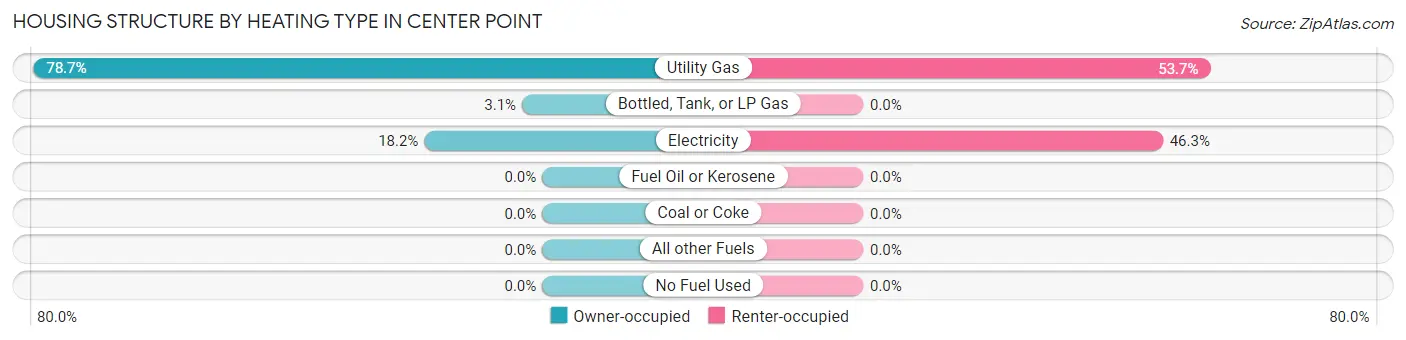
| Heating Type | Owner-occupied | Renter-occupied |
| Utility Gas | 604 (78.6%) | 117 (53.7%) |
| Bottled, Tank, or LP Gas | 24 (3.1%) | 0 (0.0%) |
| Electricity | 140 (18.2%) | 101 (46.3%) |
| Fuel Oil or Kerosene | 0 (0.0%) | 0 (0.0%) |
| Coal or Coke | 0 (0.0%) | 0 (0.0%) |
| All other Fuels | 0 (0.0%) | 0 (0.0%) |
| No Fuel Used | 0 (0.0%) | 0 (0.0%) |
| Total | 768 (100.0%) | 218 (100.0%) |
Household Vehicle Usage in Center Point
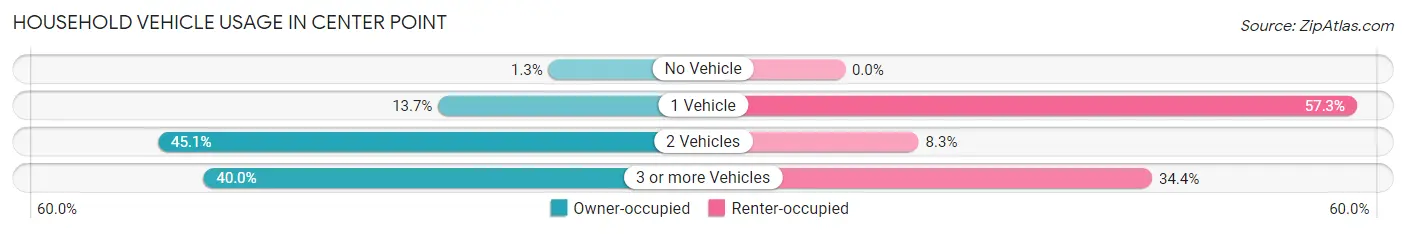
| Vehicles per Household | Owner-occupied | Renter-occupied |
| No Vehicle | 10 (1.3%) | 0 (0.0%) |
| 1 Vehicle | 105 (13.7%) | 125 (57.3%) |
| 2 Vehicles | 346 (45.1%) | 18 (8.3%) |
| 3 or more Vehicles | 307 (40.0%) | 75 (34.4%) |
| Total | 768 (100.0%) | 218 (100.0%) |
Real Estate & Mortgages in Center Point
Real Estate and Mortgage Overview in Center Point
| Characteristic | Without Mortgage | With Mortgage |
| Housing Units | 200 | 568 |
| Median Property Value | $193,100 | $185,900 |
| Median Household Income | $87,045 | $131 |
| Monthly Housing Costs | $642 | $9 |
| Real Estate Taxes | $3,315 | $16 |
Property Value by Mortgage Status in Center Point
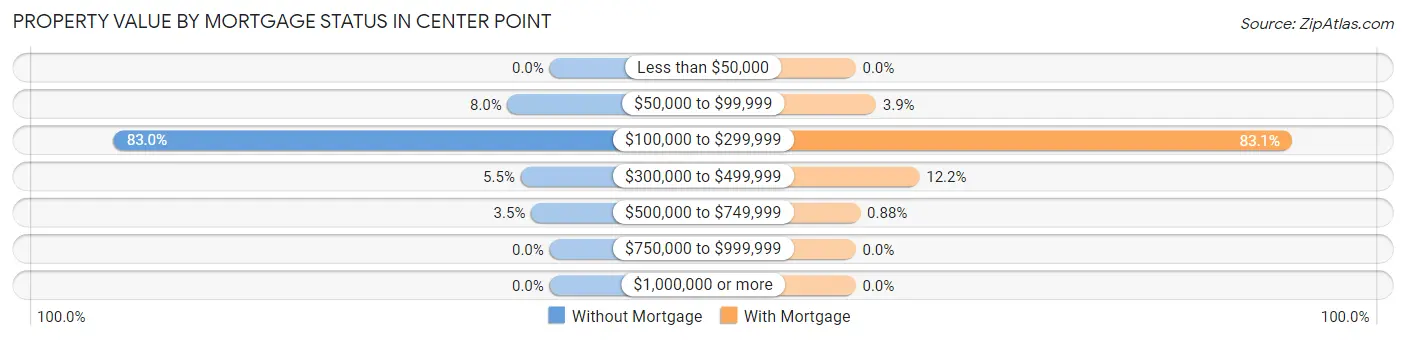
| Property Value | Without Mortgage | With Mortgage |
| Less than $50,000 | 0 (0.0%) | 0 (0.0%) |
| $50,000 to $99,999 | 16 (8.0%) | 22 (3.9%) |
| $100,000 to $299,999 | 166 (83.0%) | 472 (83.1%) |
| $300,000 to $499,999 | 11 (5.5%) | 69 (12.1%) |
| $500,000 to $749,999 | 7 (3.5%) | 5 (0.9%) |
| $750,000 to $999,999 | 0 (0.0%) | 0 (0.0%) |
| $1,000,000 or more | 0 (0.0%) | 0 (0.0%) |
| Total | 200 (100.0%) | 568 (100.0%) |
Household Income by Mortgage Status in Center Point
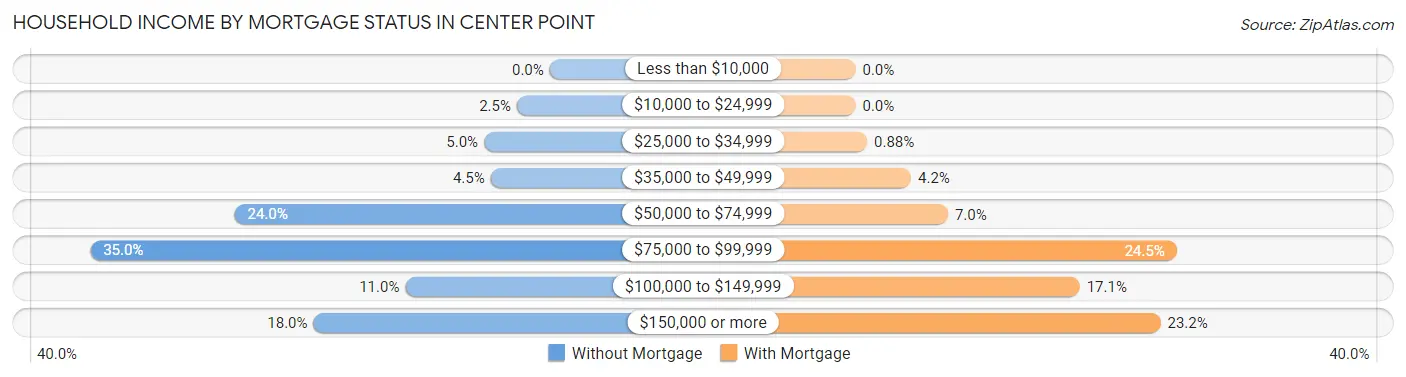
| Household Income | Without Mortgage | With Mortgage |
| Less than $10,000 | 0 (0.0%) | 0 (0.0%) |
| $10,000 to $24,999 | 5 (2.5%) | 0 (0.0%) |
| $25,000 to $34,999 | 10 (5.0%) | 5 (0.9%) |
| $35,000 to $49,999 | 9 (4.5%) | 24 (4.2%) |
| $50,000 to $74,999 | 48 (24.0%) | 40 (7.0%) |
| $75,000 to $99,999 | 70 (35.0%) | 139 (24.5%) |
| $100,000 to $149,999 | 22 (11.0%) | 97 (17.1%) |
| $150,000 or more | 36 (18.0%) | 132 (23.2%) |
| Total | 200 (100.0%) | 568 (100.0%) |
Property Value to Household Income Ratio in Center Point
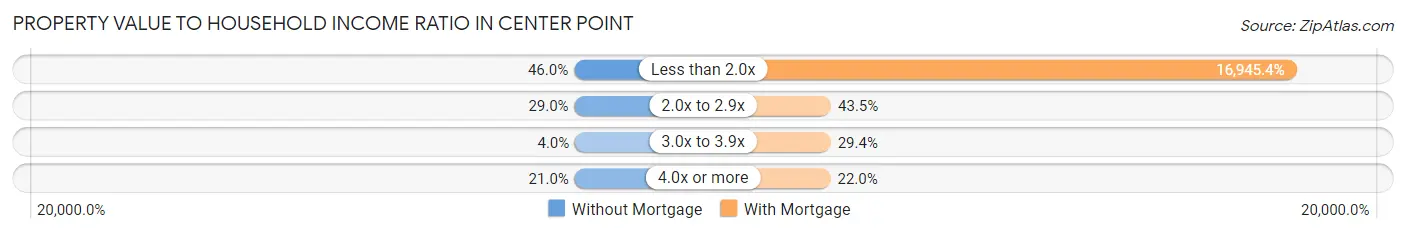
| Value-to-Income Ratio | Without Mortgage | With Mortgage |
| Less than 2.0x | 92 (46.0%) | 96,250 (16,945.4%) |
| 2.0x to 2.9x | 58 (29.0%) | 247 (43.5%) |
| 3.0x to 3.9x | 8 (4.0%) | 167 (29.4%) |
| 4.0x or more | 42 (21.0%) | 125 (22.0%) |
| Total | 200 (100.0%) | 568 (100.0%) |
Real Estate Taxes by Mortgage Status in Center Point
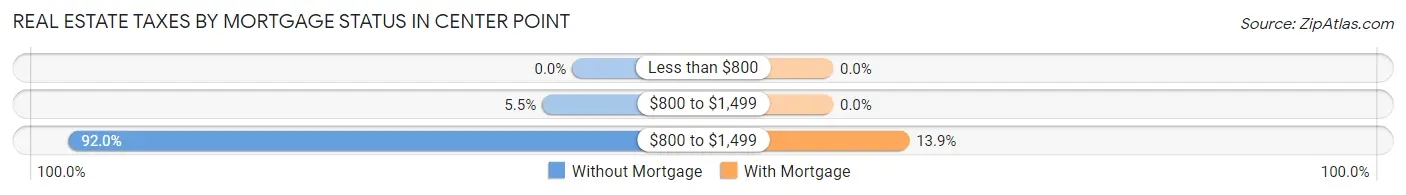
| Property Taxes | Without Mortgage | With Mortgage |
| Less than $800 | 0 (0.0%) | 0 (0.0%) |
| $800 to $1,499 | 11 (5.5%) | 0 (0.0%) |
| $800 to $1,499 | 184 (92.0%) | 79 (13.9%) |
| Total | 200 (100.0%) | 568 (100.0%) |
Health & Disability in Center Point
Health Insurance Coverage by Age in Center Point
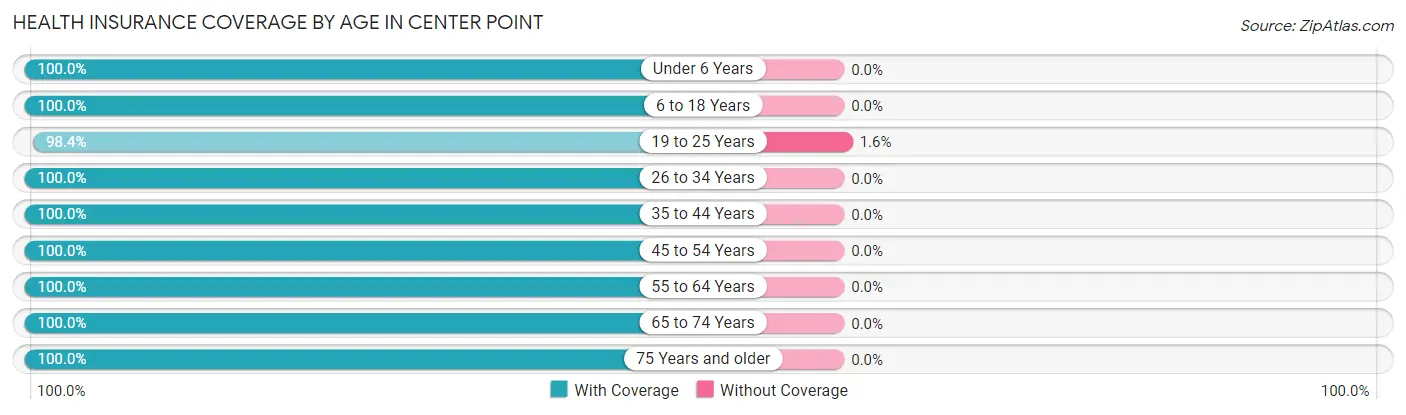
| Age Bracket | With Coverage | Without Coverage |
| Under 6 Years | 169 (100.0%) | 0 (0.0%) |
| 6 to 18 Years | 531 (100.0%) | 0 (0.0%) |
| 19 to 25 Years | 314 (98.4%) | 5 (1.6%) |
| 26 to 34 Years | 268 (100.0%) | 0 (0.0%) |
| 35 to 44 Years | 231 (100.0%) | 0 (0.0%) |
| 45 to 54 Years | 369 (100.0%) | 0 (0.0%) |
| 55 to 64 Years | 295 (100.0%) | 0 (0.0%) |
| 65 to 74 Years | 270 (100.0%) | 0 (0.0%) |
| 75 Years and older | 121 (100.0%) | 0 (0.0%) |
| Total | 2,568 (99.8%) | 5 (0.2%) |
Health Insurance Coverage by Citizenship Status in Center Point
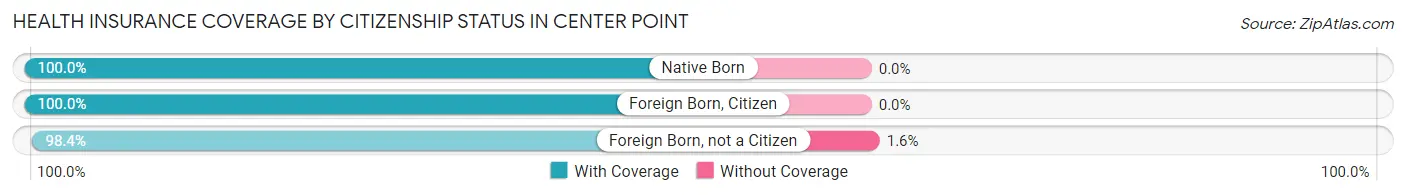
| Citizenship Status | With Coverage | Without Coverage |
| Native Born | 169 (100.0%) | 0 (0.0%) |
| Foreign Born, Citizen | 531 (100.0%) | 0 (0.0%) |
| Foreign Born, not a Citizen | 314 (98.4%) | 5 (1.6%) |
Health Insurance Coverage by Household Income in Center Point
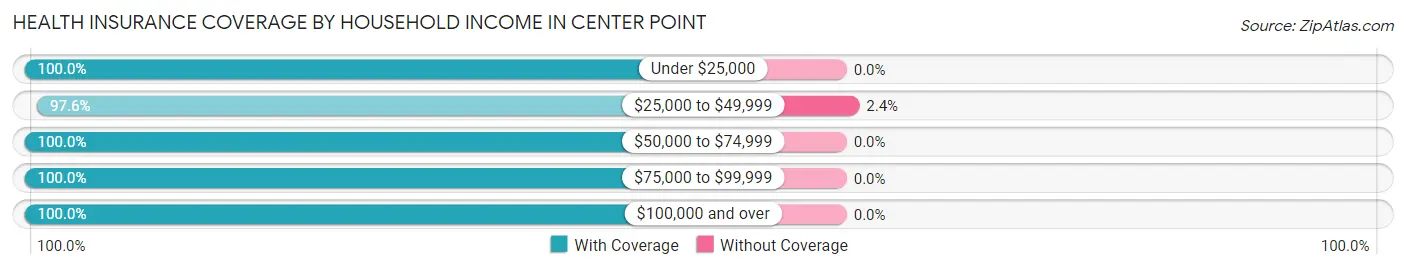
| Household Income | With Coverage | Without Coverage |
| Under $25,000 | 80 (100.0%) | 0 (0.0%) |
| $25,000 to $49,999 | 207 (97.6%) | 5 (2.4%) |
| $50,000 to $74,999 | 791 (100.0%) | 0 (0.0%) |
| $75,000 to $99,999 | 419 (100.0%) | 0 (0.0%) |
| $100,000 and over | 1,071 (100.0%) | 0 (0.0%) |
Public vs Private Health Insurance Coverage by Age in Center Point
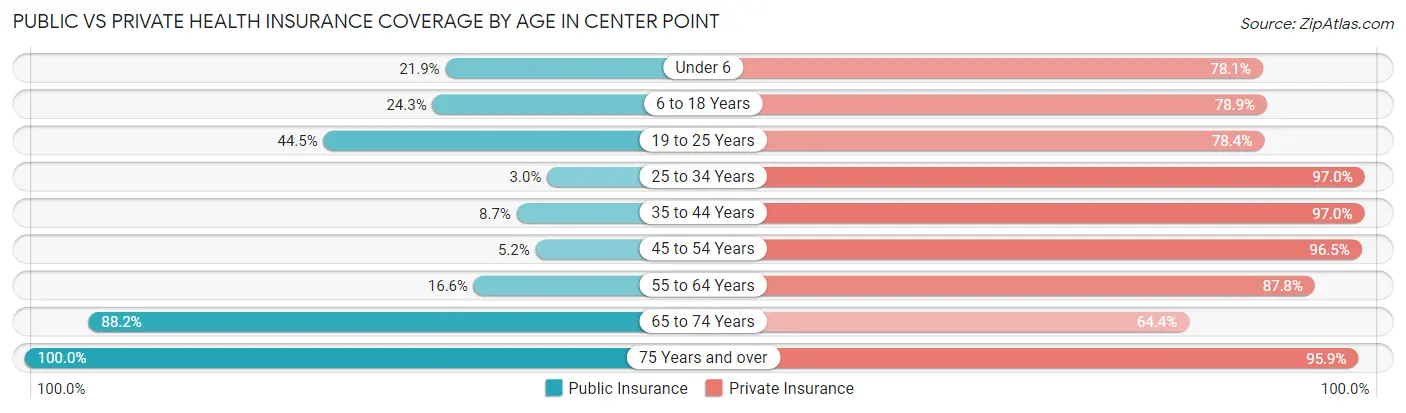
| Age Bracket | Public Insurance | Private Insurance |
| Under 6 | 37 (21.9%) | 132 (78.1%) |
| 6 to 18 Years | 129 (24.3%) | 419 (78.9%) |
| 19 to 25 Years | 142 (44.5%) | 250 (78.4%) |
| 25 to 34 Years | 8 (3.0%) | 260 (97.0%) |
| 35 to 44 Years | 20 (8.7%) | 224 (97.0%) |
| 45 to 54 Years | 19 (5.1%) | 356 (96.5%) |
| 55 to 64 Years | 49 (16.6%) | 259 (87.8%) |
| 65 to 74 Years | 238 (88.1%) | 174 (64.4%) |
| 75 Years and over | 121 (100.0%) | 116 (95.9%) |
| Total | 763 (29.6%) | 2,190 (85.1%) |
Disability Status by Sex by Age in Center Point
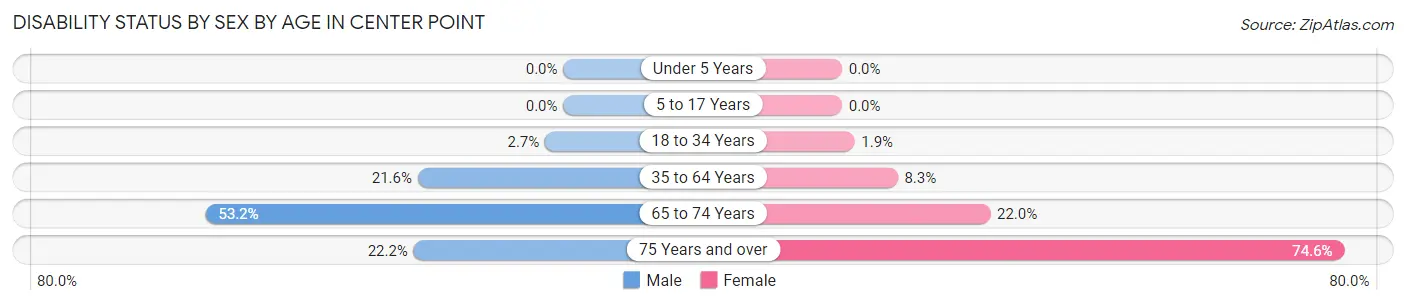
| Age Bracket | Male | Female |
| Under 5 Years | 0 (0.0%) | 0 (0.0%) |
| 5 to 17 Years | 0 (0.0%) | 0 (0.0%) |
| 18 to 34 Years | 10 (2.7%) | 5 (1.9%) |
| 35 to 64 Years | 94 (21.6%) | 38 (8.3%) |
| 65 to 74 Years | 59 (53.1%) | 35 (22.0%) |
| 75 Years and over | 12 (22.2%) | 50 (74.6%) |
Disability Class by Sex by Age in Center Point
Disability Class: Hearing Difficulty
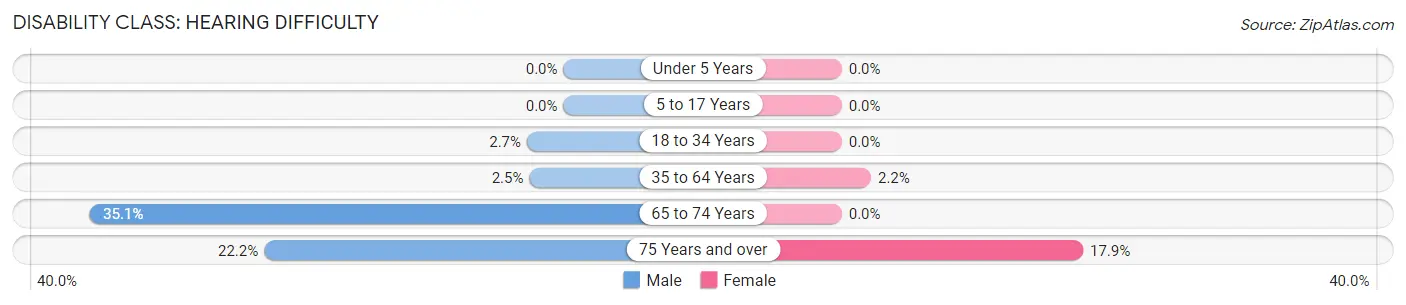
| Age Bracket | Male | Female |
| Under 5 Years | 0 (0.0%) | 0 (0.0%) |
| 5 to 17 Years | 0 (0.0%) | 0 (0.0%) |
| 18 to 34 Years | 10 (2.7%) | 0 (0.0%) |
| 35 to 64 Years | 11 (2.5%) | 10 (2.2%) |
| 65 to 74 Years | 39 (35.1%) | 0 (0.0%) |
| 75 Years and over | 12 (22.2%) | 12 (17.9%) |
Disability Class: Vision Difficulty
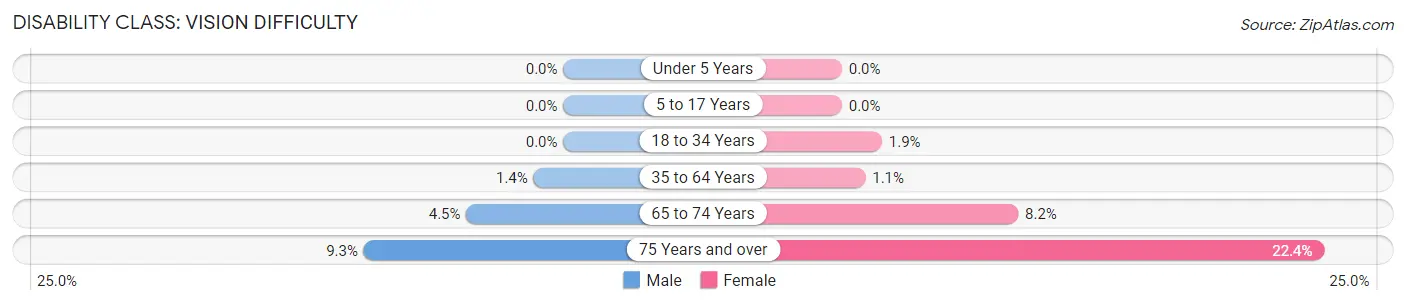
| Age Bracket | Male | Female |
| Under 5 Years | 0 (0.0%) | 0 (0.0%) |
| 5 to 17 Years | 0 (0.0%) | 0 (0.0%) |
| 18 to 34 Years | 0 (0.0%) | 5 (1.9%) |
| 35 to 64 Years | 6 (1.4%) | 5 (1.1%) |
| 65 to 74 Years | 5 (4.5%) | 13 (8.2%) |
| 75 Years and over | 5 (9.3%) | 15 (22.4%) |
Disability Class: Cognitive Difficulty
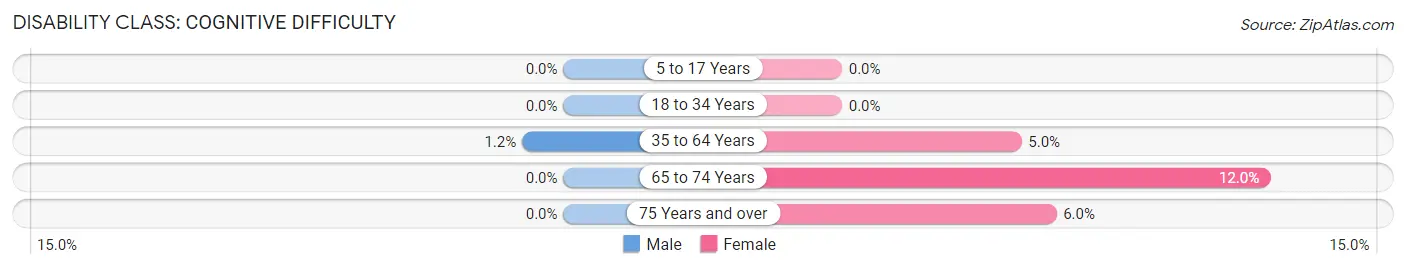
| Age Bracket | Male | Female |
| 5 to 17 Years | 0 (0.0%) | 0 (0.0%) |
| 18 to 34 Years | 0 (0.0%) | 0 (0.0%) |
| 35 to 64 Years | 5 (1.1%) | 23 (5.0%) |
| 65 to 74 Years | 0 (0.0%) | 19 (11.9%) |
| 75 Years and over | 0 (0.0%) | 4 (6.0%) |
Disability Class: Ambulatory Difficulty
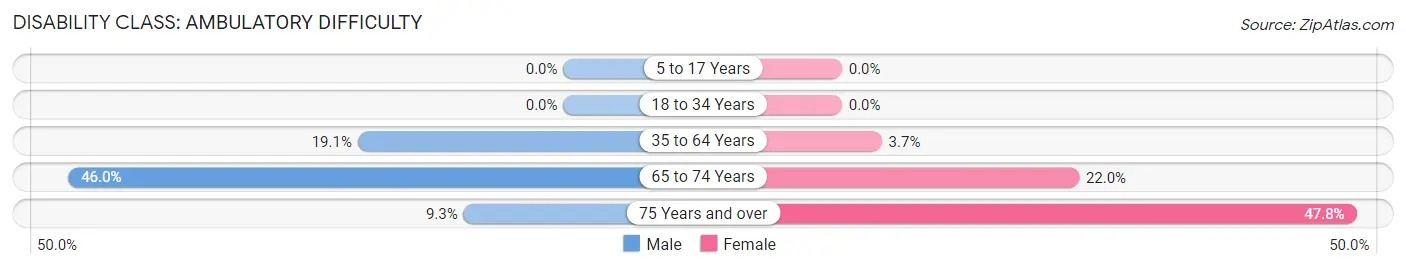
| Age Bracket | Male | Female |
| 5 to 17 Years | 0 (0.0%) | 0 (0.0%) |
| 18 to 34 Years | 0 (0.0%) | 0 (0.0%) |
| 35 to 64 Years | 83 (19.1%) | 17 (3.7%) |
| 65 to 74 Years | 51 (46.0%) | 35 (22.0%) |
| 75 Years and over | 5 (9.3%) | 32 (47.8%) |
Disability Class: Self-Care Difficulty
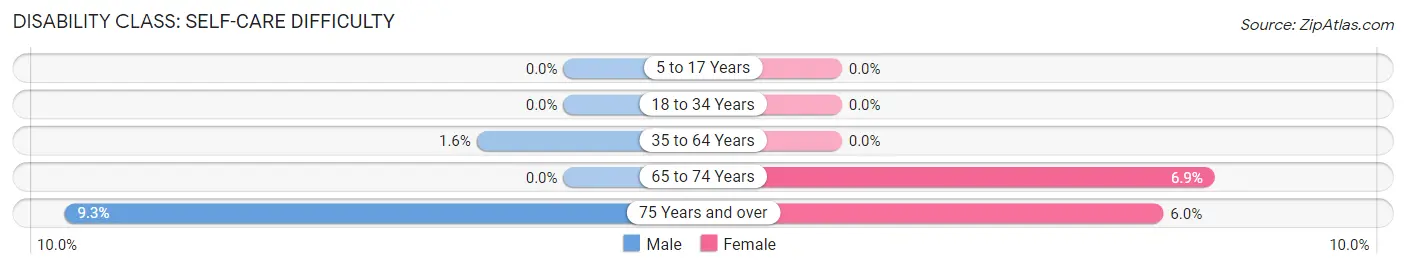
| Age Bracket | Male | Female |
| 5 to 17 Years | 0 (0.0%) | 0 (0.0%) |
| 18 to 34 Years | 0 (0.0%) | 0 (0.0%) |
| 35 to 64 Years | 7 (1.6%) | 0 (0.0%) |
| 65 to 74 Years | 0 (0.0%) | 11 (6.9%) |
| 75 Years and over | 5 (9.3%) | 4 (6.0%) |
Technology Access in Center Point
Computing Device Access in Center Point
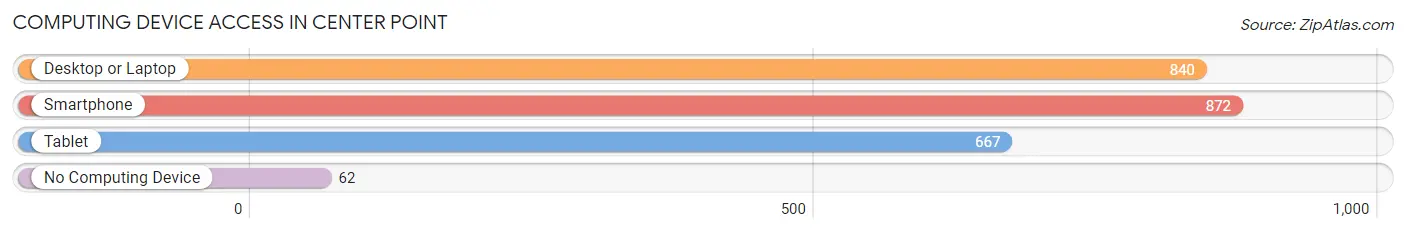
| Device Type | # Households | % Households |
| Desktop or Laptop | 840 | 85.2% |
| Smartphone | 872 | 88.4% |
| Tablet | 667 | 67.6% |
| No Computing Device | 62 | 6.3% |
| Total | 986 | 100.0% |
Internet Access in Center Point
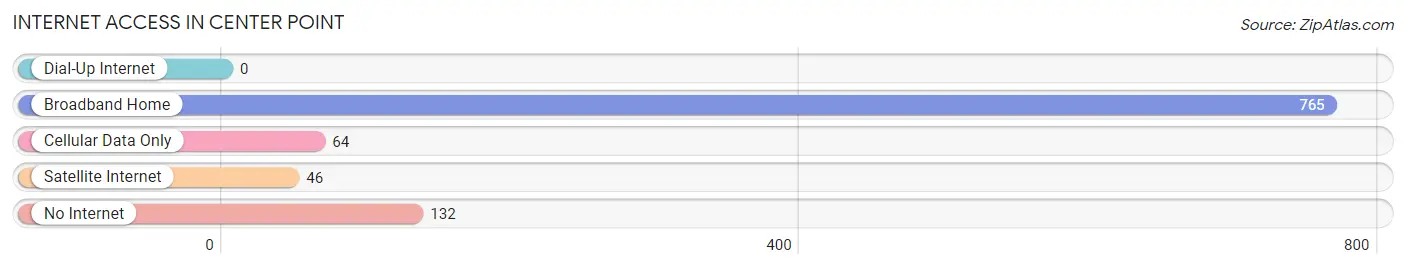
| Internet Type | # Households | % Households |
| Dial-Up Internet | 0 | 0.0% |
| Broadband Home | 765 | 77.6% |
| Cellular Data Only | 64 | 6.5% |
| Satellite Internet | 46 | 4.7% |
| No Internet | 132 | 13.4% |
| Total | 986 | 100.0% |
Center Point Summary
Point, Iowa is a small city located in Linn County, Iowa. It is situated on the Cedar River, about 20 miles north of Cedar Rapids. The city has a population of about 4,000 people and is part of the Cedar Rapids Metropolitan Statistical Area.
History
The area that is now Point, Iowa was first settled in 1845 by a group of settlers from Ohio. The settlement was originally known as “Centerville”, but was later changed to “Center Point” in 1854. The name was chosen to reflect the fact that the settlement was located at the center of the county.
The city was officially incorporated in 1875 and was named after the nearby Cedar River. The city was originally a farming community, but in the late 19th century, it began to develop into a small industrial center. The city was home to several factories, including a flour mill, a sawmill, and a brickyard.
Geography
Center Point is located in Linn County, Iowa, about 20 miles north of Cedar Rapids. The city is situated on the Cedar River, which flows through the city. The city is located in a rural area, with the nearest major city being Cedar Rapids.
The city has a total area of 2.2 square miles, all of which is land. The city has a humid continental climate, with hot summers and cold winters.
Economy
The economy of Center Point is largely based on agriculture and manufacturing. The city is home to several factories, including a flour mill, a sawmill, and a brickyard. The city also has several small businesses, including restaurants, retail stores, and service providers.
The city is also home to several educational institutions, including a community college and a vocational school.
Demographics
As of the 2010 census, the population of Center Point was 4,000. The racial makeup of the city was 97.2% White, 0.7% African American, 0.3% Native American, 0.3% Asian, 0.2% from other races, and 1.5% from two or more races. Hispanic or Latino of any race were 1.2% of the population.
The median income for a household in the city was $45,000, and the median income for a family was $50,000. The per capita income for the city was $20,000. About 8.3% of families and 10.2% of the population were below the poverty line, including 14.3% of those under age 18 and 6.2% of those age 65 or over.
Common Questions
What is the Total Population of Center Point?
Total Population of Center Point is 2,573.
What is the Total Male Population of Center Point?
Total Male Population of Center Point is 1,233.
What is the Total Female Population of Center Point?
Total Female Population of Center Point is 1,340.
What is the Ratio of Males per 100 Females in Center Point?
There are 92.01 Males per 100 Females in Center Point.
What is the Ratio of Females per 100 Males in Center Point?
There are 108.68 Females per 100 Males in Center Point.
What is the Median Population Age in Center Point?
Median Population Age in Center Point is 35.0 Years.
What is the Average Family Size in Center Point
Average Family Size in Center Point is 3.0 People.
What is the Average Household Size in Center Point
Average Household Size in Center Point is 2.6 People.
What is Per Capita Income in Center Point?
Per Capita income in Center Point is $36,284.
What is the Median Family Income in Center Point?
Median Family Income in Center Point is $93,266.
What is the Median Household income in Center Point?
Median Household Income in Center Point is $80,053.
What is Income or Wage Gap in Center Point?
Income or Wage Gap in Center Point is 22.5%.
Women in Center Point earn 77.5 cents for every dollar earned by a man.
What is Inequality or Gini Index in Center Point?
Inequality or Gini Index in Center Point is 0.35.
How Large is the Labor Force in Center Point?
There are 1,438 People in the Labor Forcein in Center Point.
What is the Percentage of People in the Labor Force in Center Point?
70.6% of People are in the Labor Force in Center Point.
What is the Unemployment Rate in Center Point?
Unemployment Rate in Center Point is 3.1%.