Cities with the Highest Poverty Level Among Married Couples in Iowa
RELATED REPORTS & OPTIONS
Highest Poverty | Married Couple
Iowa
Compare Cities
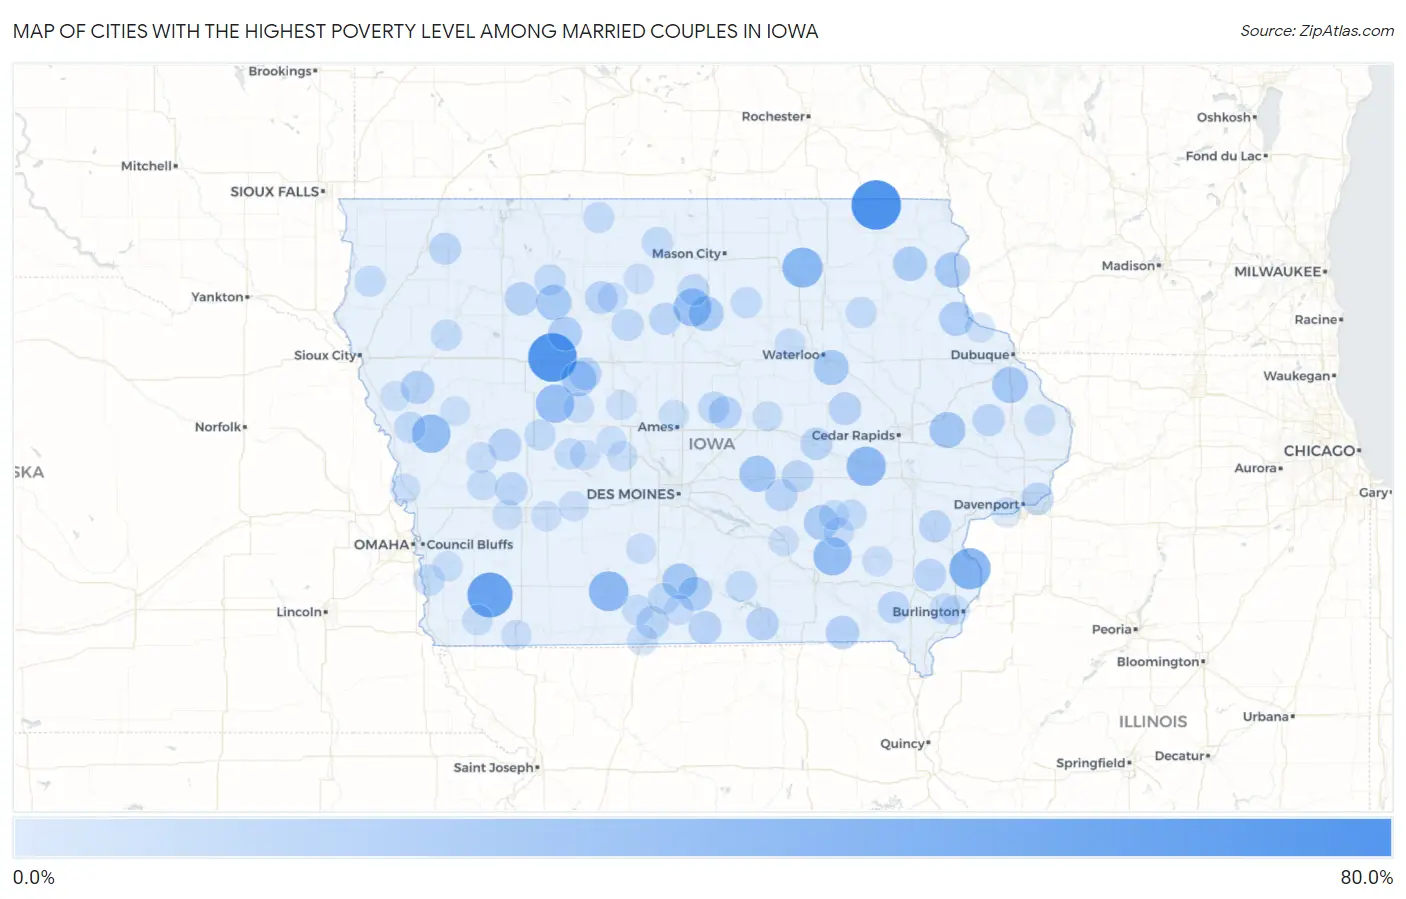
Map of Cities with the Highest Poverty Level Among Married Couples in Iowa
0.0%
80.0%
Cities with the Highest Poverty Level Among Married Couples in Iowa
| City | Married Couples Poverty | vs State | vs National | |
| 1. | Burr Oak | 62.5% | 3.2%(+59.3)#1 | 4.5%(+58.0)#229 |
| 2. | Jolley | 60.0% | 3.2%(+56.8)#2 | 4.5%(+55.5)#272 |
| 3. | Fairport | 57.6% | 3.2%(+54.4)#3 | 4.5%(+53.1)#295 |
| 4. | Coburg | 50.0% | 3.2%(+46.8)#4 | 4.5%(+45.5)#394 |
| 5. | Oakville | 39.4% | 3.2%(+36.2)#5 | 4.5%(+34.9)#658 |
| 6. | Bassett | 36.4% | 3.2%(+33.2)#6 | 4.5%(+31.9)#759 |
| 7. | Arispe | 35.3% | 3.2%(+32.1)#7 | 4.5%(+30.8)#795 |
| 8. | South Amana | 34.0% | 3.2%(+30.9)#8 | 4.5%(+29.6)#844 |
| 9. | Soldier | 31.7% | 3.2%(+28.6)#9 | 4.5%(+27.2)#948 |
| 10. | Martinsburg | 31.6% | 3.2%(+28.4)#10 | 4.5%(+27.1)#954 |
| 11. | Lanesboro | 31.2% | 3.2%(+28.1)#11 | 4.5%(+26.8)#971 |
| 12. | Alexander | 30.0% | 3.2%(+26.8)#12 | 4.5%(+25.5)#1,027 |
| 13. | Kellogg | 26.0% | 3.2%(+22.8)#13 | 4.5%(+21.5)#1,332 |
| 14. | Zwingle | 25.0% | 3.2%(+21.8)#14 | 4.5%(+20.5)#1,450 |
| 15. | Morley | 25.0% | 3.2%(+21.8)#15 | 4.5%(+20.5)#1,455 |
| 16. | Woodburn | 24.4% | 3.2%(+21.2)#16 | 4.5%(+19.9)#1,506 |
| 17. | Havelock | 23.3% | 3.2%(+20.2)#17 | 4.5%(+18.9)#1,628 |
| 18. | Marquette | 23.3% | 3.2%(+20.1)#18 | 4.5%(+18.8)#1,632 |
| 19. | Rinard | 23.1% | 3.2%(+19.9)#19 | 4.5%(+18.6)#1,659 |
| 20. | Washburn | 22.6% | 3.2%(+19.5)#20 | 4.5%(+18.2)#1,708 |
| 21. | What Cheer | 22.1% | 3.2%(+19.0)#21 | 4.5%(+17.7)#1,784 |
| 22. | Latimer | 22.1% | 3.2%(+18.9)#22 | 4.5%(+17.6)#1,789 |
| 23. | Postville | 21.1% | 3.2%(+18.0)#23 | 4.5%(+16.7)#1,896 |
| 24. | Osterdock | 20.0% | 3.2%(+16.8)#24 | 4.5%(+15.5)#2,057 |
| 25. | Palmer | 20.0% | 3.2%(+16.8)#25 | 4.5%(+15.5)#2,062 |
| 26. | Derby | 20.0% | 3.2%(+16.8)#26 | 4.5%(+15.5)#2,064 |
| 27. | Milton | 18.4% | 3.2%(+15.3)#27 | 4.5%(+14.0)#2,314 |
| 28. | Oto | 18.2% | 3.2%(+15.0)#28 | 4.5%(+13.7)#2,374 |
| 29. | Marathon | 17.9% | 3.2%(+14.8)#29 | 4.5%(+13.5)#2,421 |
| 30. | Garrison | 17.2% | 3.2%(+14.0)#30 | 4.5%(+12.7)#2,579 |
| 31. | Somers | 17.1% | 3.2%(+14.0)#31 | 4.5%(+12.7)#2,588 |
| 32. | Allerton | 17.1% | 3.2%(+13.9)#32 | 4.5%(+12.6)#2,597 |
| 33. | Centerville | 17.1% | 3.2%(+13.9)#33 | 4.5%(+12.6)#2,607 |
| 34. | Bode | 16.7% | 3.2%(+13.5)#34 | 4.5%(+12.2)#2,679 |
| 35. | St Anthony | 16.7% | 3.2%(+13.5)#35 | 4.5%(+12.2)#2,702 |
| 36. | Aspinwall | 16.7% | 3.2%(+13.5)#36 | 4.5%(+12.2)#2,711 |
| 37. | Kimballton | 16.4% | 3.2%(+13.2)#37 | 4.5%(+11.9)#2,757 |
| 38. | Decatur City | 16.0% | 3.2%(+12.8)#38 | 4.5%(+11.5)#2,847 |
| 39. | Panorama Park | 16.0% | 3.2%(+12.8)#39 | 4.5%(+11.5)#2,848 |
| 40. | Searsboro | 15.8% | 3.2%(+12.6)#40 | 4.5%(+11.3)#2,900 |
| 41. | Mount Union | 15.8% | 3.2%(+12.6)#41 | 4.5%(+11.3)#2,902 |
| 42. | Chelsea | 15.6% | 3.2%(+12.4)#42 | 4.5%(+11.1)#2,958 |
| 43. | Conesville | 15.1% | 3.2%(+11.9)#43 | 4.5%(+10.6)#3,066 |
| 44. | Monmouth | 15.0% | 3.2%(+11.8)#44 | 4.5%(+10.5)#3,089 |
| 45. | Sanborn | 14.9% | 3.2%(+11.7)#45 | 4.5%(+10.4)#3,115 |
| 46. | Hillsboro | 14.8% | 3.2%(+11.7)#46 | 4.5%(+10.4)#3,134 |
| 47. | Clarion | 14.7% | 3.2%(+11.6)#47 | 4.5%(+10.3)#3,161 |
| 48. | Malcom | 14.6% | 3.2%(+11.5)#48 | 4.5%(+10.2)#3,193 |
| 49. | Thor | 14.3% | 3.2%(+11.1)#49 | 4.5%(+9.82)#3,305 |
| 50. | Zearing | 14.1% | 3.2%(+11.0)#50 | 4.5%(+9.68)#3,363 |
| 51. | Meservey | 14.0% | 3.2%(+10.8)#51 | 4.5%(+9.49)#3,411 |
| 52. | Pacific Junction | 13.6% | 3.2%(+10.5)#52 | 4.5%(+9.17)#3,511 |
| 53. | Turin | 13.3% | 3.2%(+10.2)#53 | 4.5%(+8.87)#3,628 |
| 54. | Weldon | 13.3% | 3.2%(+10.2)#54 | 4.5%(+8.87)#3,633 |
| 55. | Curlew | 13.3% | 3.2%(+10.2)#55 | 4.5%(+8.87)#3,638 |
| 56. | Crystal Lake | 13.1% | 3.2%(+9.96)#56 | 4.5%(+8.65)#3,702 |
| 57. | Willey | 12.9% | 3.2%(+9.75)#57 | 4.5%(+8.44)#3,791 |
| 58. | Westgate | 12.8% | 3.2%(+9.67)#58 | 4.5%(+8.36)#3,825 |
| 59. | Ireton | 12.7% | 3.2%(+9.53)#59 | 4.5%(+8.22)#3,859 |
| 60. | Quimby | 12.7% | 3.2%(+9.52)#60 | 4.5%(+8.21)#3,862 |
| 61. | Melrose | 12.5% | 3.2%(+9.34)#61 | 4.5%(+8.04)#3,950 |
| 62. | Aredale | 12.5% | 3.2%(+9.34)#62 | 4.5%(+8.04)#3,973 |
| 63. | Swea City | 12.4% | 3.2%(+9.22)#63 | 4.5%(+7.91)#4,008 |
| 64. | Bayard | 12.3% | 3.2%(+9.17)#64 | 4.5%(+7.87)#4,025 |
| 65. | South English | 12.3% | 3.2%(+9.13)#65 | 4.5%(+7.82)#4,046 |
| 66. | Lamoni | 11.9% | 3.2%(+8.74)#66 | 4.5%(+7.43)#4,221 |
| 67. | Middletown | 11.9% | 3.2%(+8.71)#67 | 4.5%(+7.40)#4,233 |
| 68. | Spragueville | 11.8% | 3.2%(+8.61)#68 | 4.5%(+7.30)#4,297 |
| 69. | Grand River | 11.7% | 3.2%(+8.51)#69 | 4.5%(+7.20)#4,331 |
| 70. | Shenandoah | 11.5% | 3.2%(+8.36)#70 | 4.5%(+7.05)#4,398 |
| 71. | Defiance | 11.4% | 3.2%(+8.21)#71 | 4.5%(+6.90)#4,461 |
| 72. | Harlan | 11.4% | 3.2%(+8.21)#72 | 4.5%(+6.90)#4,462 |
| 73. | New Hartford | 11.3% | 3.2%(+8.14)#73 | 4.5%(+6.84)#4,493 |
| 74. | Churdan | 11.1% | 3.2%(+7.96)#74 | 4.5%(+6.65)#4,567 |
| 75. | Oak Hills | 11.1% | 3.2%(+7.96)#75 | 4.5%(+6.65)#4,603 |
| 76. | Garden Grove | 10.9% | 3.2%(+7.75)#76 | 4.5%(+6.45)#4,709 |
| 77. | East Peru | 10.8% | 3.2%(+7.66)#77 | 4.5%(+6.35)#4,758 |
| 78. | Livermore | 10.7% | 3.2%(+7.51)#78 | 4.5%(+6.20)#4,839 |
| 79. | Corwith | 10.6% | 3.2%(+7.48)#79 | 4.5%(+6.18)#4,859 |
| 80. | Shambaugh | 10.6% | 3.2%(+7.48)#80 | 4.5%(+6.18)#4,863 |
| 81. | Anita | 10.6% | 3.2%(+7.42)#81 | 4.5%(+6.12)#4,899 |
| 82. | Casey | 10.5% | 3.2%(+7.37)#82 | 4.5%(+6.06)#4,920 |
| 83. | Bagley | 10.5% | 3.2%(+7.37)#83 | 4.5%(+6.06)#4,926 |
| 84. | Marne | 10.5% | 3.2%(+7.37)#84 | 4.5%(+6.06)#4,936 |
| 85. | Pleasant Plain | 10.5% | 3.2%(+7.37)#85 | 4.5%(+6.06)#4,938 |
| 86. | Perry | 10.5% | 3.2%(+7.30)#86 | 4.5%(+5.99)#4,971 |
| 87. | Sigourney | 10.4% | 3.2%(+7.27)#87 | 4.5%(+5.96)#4,992 |
| 88. | Modale | 10.4% | 3.2%(+7.26)#88 | 4.5%(+5.95)#5,008 |
| 89. | Gilbert | 10.4% | 3.2%(+7.21)#89 | 4.5%(+5.90)#5,034 |
| 90. | Keswick | 10.3% | 3.2%(+7.19)#90 | 4.5%(+5.88)#5,050 |
| 91. | Green Mountain | 10.3% | 3.2%(+7.19)#91 | 4.5%(+5.88)#5,055 |
| 92. | Silver City | 10.3% | 3.2%(+7.10)#92 | 4.5%(+5.79)#5,093 |
| 93. | Beacon | 10.2% | 3.2%(+7.07)#93 | 4.5%(+5.77)#5,112 |
| 94. | Hornick | 10.0% | 3.2%(+6.84)#94 | 4.5%(+5.54)#5,248 |
| 95. | Rippey | 10.0% | 3.2%(+6.84)#95 | 4.5%(+5.54)#5,261 |
| 96. | Boxholm | 10.0% | 3.2%(+6.84)#96 | 4.5%(+5.54)#5,268 |
| 97. | North Buena Vista | 10.0% | 3.2%(+6.84)#97 | 4.5%(+5.54)#5,272 |
| 98. | Ricketts | 10.0% | 3.2%(+6.84)#98 | 4.5%(+5.54)#5,281 |
| 99. | Buffalo | 9.9% | 3.2%(+6.70)#99 | 4.5%(+5.40)#5,351 |
| 100. | West Burlington | 9.8% | 3.2%(+6.63)#100 | 4.5%(+5.33)#5,400 |
Common Questions
What are the Top 10 Cities with the Highest Poverty Level Among Married Couples in Iowa?
Top 10 Cities with the Highest Poverty Level Among Married Couples in Iowa are:
#1
62.5%
#2
60.0%
#3
50.0%
#4
39.4%
#5
36.4%
#6
35.3%
#7
34.0%
#8
31.7%
#9
31.6%
#10
31.2%
What city has the Highest Poverty Level Among Married Couples in Iowa?
Burr Oak has the Highest Poverty Level Among Married Couples in Iowa with 62.5%.
What is the Poverty Level Among Married Couples in the State of Iowa?
Poverty Level Among Married Couples in Iowa is 3.2%.
What is the Poverty Level Among Married Couples in the United States?
Poverty Level Among Married Couples in the United States is 4.5%.