Cresco, IA Map & Demographics
Cresco Map
Cresco Overview
$27,407
PER CAPITA INCOME
$75,455
AVG FAMILY INCOME
$60,135
AVG HOUSEHOLD INCOME
22.5%
WAGE / INCOME GAP [ % ]
77.5¢/ $1
WAGE / INCOME GAP [ $ ]
0.36
INEQUALITY / GINI INDEX
3,899
TOTAL POPULATION
1,904
MALE POPULATION
1,995
FEMALE POPULATION
95.44
MALES / 100 FEMALES
104.78
FEMALES / 100 MALES
39.5
MEDIAN AGE
3.1
AVG FAMILY SIZE
2.5
AVG HOUSEHOLD SIZE
2,009
LABOR FORCE [ PEOPLE ]
65.2%
PERCENT IN LABOR FORCE
Cresco Zip Codes
Cresco Area Codes
Income in Cresco
Income Overview in Cresco
Per Capita Income in Cresco is $27,407, while median incomes of families and households are $75,455 and $60,135 respectively.
| Characteristic | Number | Measure |
| Per Capita Income | 3,899 | $27,407 |
| Median Family Income | 990 | $75,455 |
| Mean Family Income | 990 | $83,077 |
| Median Household Income | 1,495 | $60,135 |
| Mean Household Income | 1,495 | $69,734 |
| Income Deficit | 990 | $0 |
| Wage / Income Gap (%) | 3,899 | 22.54% |
| Wage / Income Gap ($) | 3,899 | 77.46¢ per $1 |
| Gini / Inequality Index | 3,899 | 0.36 |
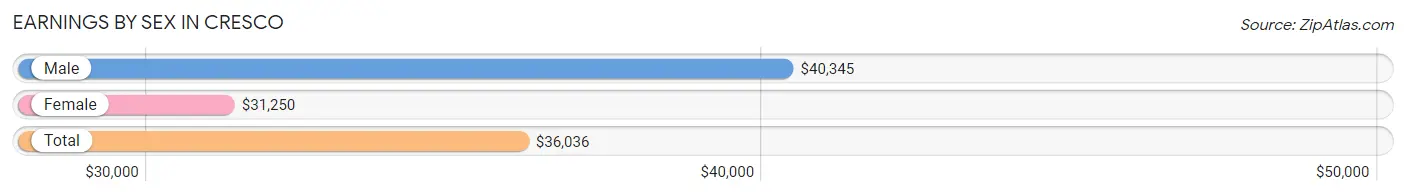
Earnings by Sex in Cresco
Average Earnings in Cresco are $36,036, $40,345 for men and $31,250 for women, a difference of 22.5%.
| Sex | Number | Average Earnings |
| Male | 1,060 (50.5%) | $40,345 |
| Female | 1,039 (49.5%) | $31,250 |
| Total | 2,099 (100.0%) | $36,036 |
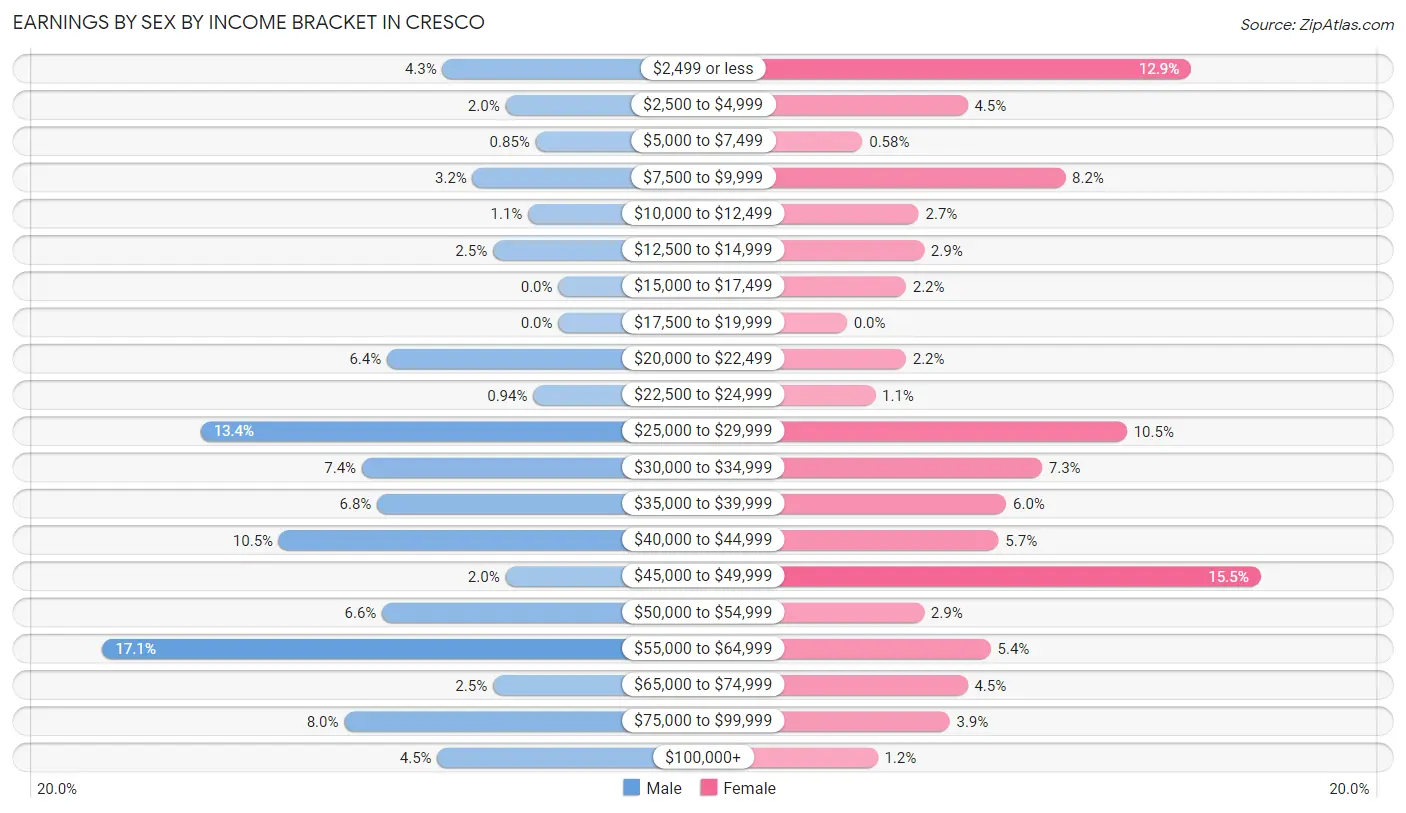
Earnings by Sex by Income Bracket in Cresco
The most common earnings brackets in Cresco are $55,000 to $64,999 for men (181 | 17.1%) and $45,000 to $49,999 for women (161 | 15.5%).
| Income | Male | Female |
| $2,499 or less | 46 (4.3%) | 134 (12.9%) |
| $2,500 to $4,999 | 21 (2.0%) | 47 (4.5%) |
| $5,000 to $7,499 | 9 (0.9%) | 6 (0.6%) |
| $7,500 to $9,999 | 34 (3.2%) | 85 (8.2%) |
| $10,000 to $12,499 | 12 (1.1%) | 28 (2.7%) |
| $12,500 to $14,999 | 26 (2.5%) | 30 (2.9%) |
| $15,000 to $17,499 | 0 (0.0%) | 23 (2.2%) |
| $17,500 to $19,999 | 0 (0.0%) | 0 (0.0%) |
| $20,000 to $22,499 | 68 (6.4%) | 23 (2.2%) |
| $22,500 to $24,999 | 10 (0.9%) | 11 (1.1%) |
| $25,000 to $29,999 | 142 (13.4%) | 109 (10.5%) |
| $30,000 to $34,999 | 78 (7.4%) | 76 (7.3%) |
| $35,000 to $39,999 | 72 (6.8%) | 62 (6.0%) |
| $40,000 to $44,999 | 111 (10.5%) | 59 (5.7%) |
| $45,000 to $49,999 | 21 (2.0%) | 161 (15.5%) |
| $50,000 to $54,999 | 70 (6.6%) | 30 (2.9%) |
| $55,000 to $64,999 | 181 (17.1%) | 56 (5.4%) |
| $65,000 to $74,999 | 26 (2.5%) | 47 (4.5%) |
| $75,000 to $99,999 | 85 (8.0%) | 40 (3.8%) |
| $100,000+ | 48 (4.5%) | 12 (1.1%) |
| Total | 1,060 (100.0%) | 1,039 (100.0%) |
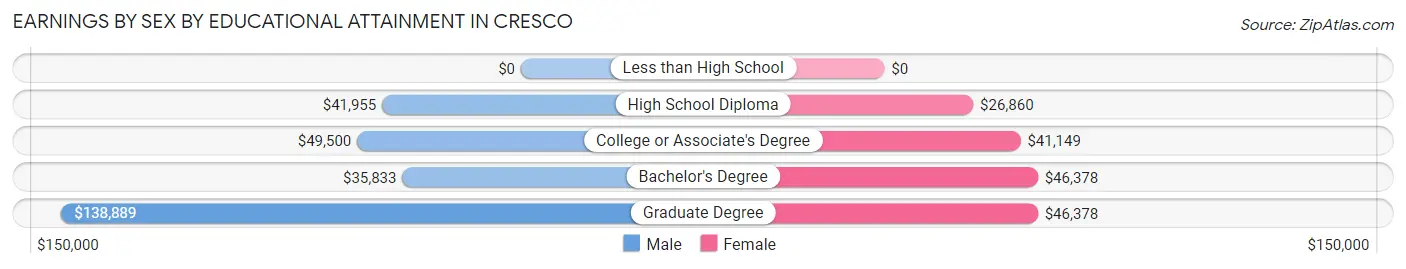
Earnings by Sex by Educational Attainment in Cresco
Average earnings in Cresco are $43,281 for men and $38,875 for women, a difference of 10.2%. Men with an educational attainment of graduate degree enjoy the highest average annual earnings of $138,889, while those with bachelor's degree education earn the least with $35,833. Women with an educational attainment of bachelor's degree earn the most with the average annual earnings of $46,378, while those with high school diploma education have the smallest earnings of $26,860.
| Educational Attainment | Male Income | Female Income |
| Less than High School | - | - |
| High School Diploma | $41,955 | $26,860 |
| College or Associate's Degree | $49,500 | $41,149 |
| Bachelor's Degree | $35,833 | $46,378 |
| Graduate Degree | $138,889 | $46,378 |
| Total | $43,281 | $38,875 |
Family Income in Cresco
Family Income Brackets in Cresco
According to the Cresco family income data, there are 255 families falling into the $50,000 to $74,999 income range, which is the most common income bracket and makes up 25.8% of all families.
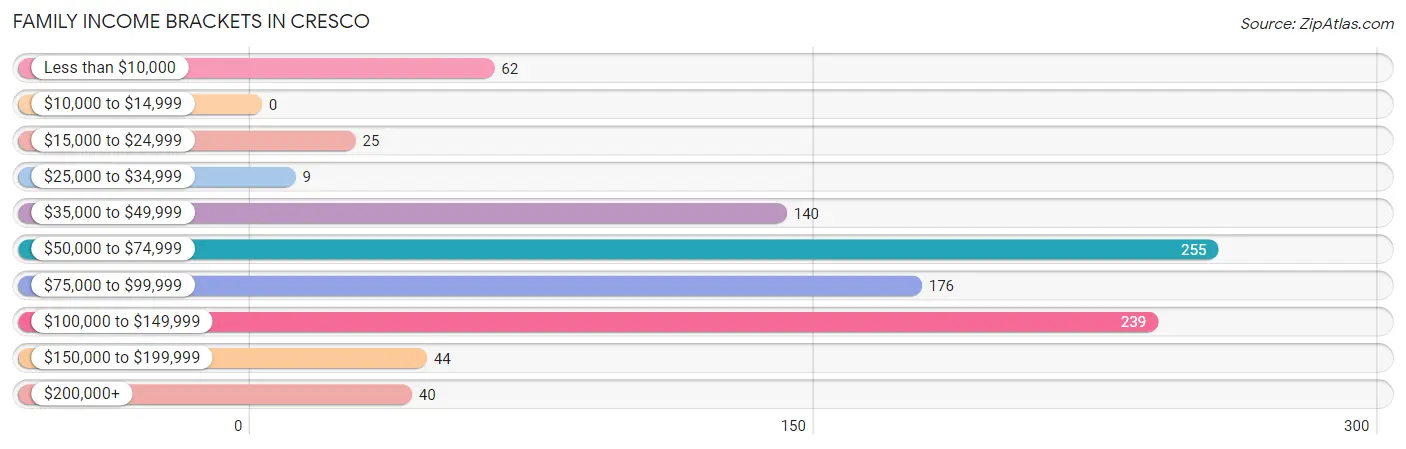
| Income Bracket | # Families | % Families |
| Less than $10,000 | 62 | 6.3% |
| $10,000 to $14,999 | 0 | 0.0% |
| $15,000 to $24,999 | 25 | 2.5% |
| $25,000 to $34,999 | 9 | 0.9% |
| $35,000 to $49,999 | 140 | 14.1% |
| $50,000 to $74,999 | 255 | 25.8% |
| $75,000 to $99,999 | 176 | 17.8% |
| $100,000 to $149,999 | 239 | 24.1% |
| $150,000 to $199,999 | 44 | 4.4% |
| $200,000+ | 40 | 4.0% |
Family Income by Famaliy Size in Cresco
3-person families (112 | 11.3%) account for the highest median family income in Cresco with $110,313 per family, while 3-person families (112 | 11.3%) have the highest median income of $36,771 per family member.
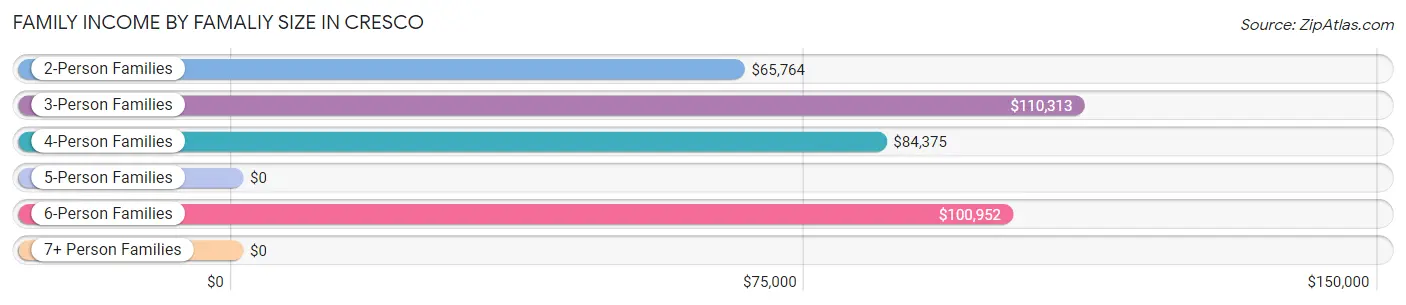
| Income Bracket | # Families | Median Income |
| 2-Person Families | 557 (56.3%) | $65,764 |
| 3-Person Families | 112 (11.3%) | $110,313 |
| 4-Person Families | 128 (12.9%) | $84,375 |
| 5-Person Families | 85 (8.6%) | $0 |
| 6-Person Families | 108 (10.9%) | $100,952 |
| 7+ Person Families | 0 (0.0%) | $0 |
| Total | 990 (100.0%) | $75,455 |
Family Income by Number of Earners in Cresco
The median family income in Cresco is $75,455, with families comprising 3+ earners (140) having the highest median family income of $106,944, while families with no earners (169) have the lowest median family income of $43,443, accounting for 14.1% and 17.1% of families, respectively.
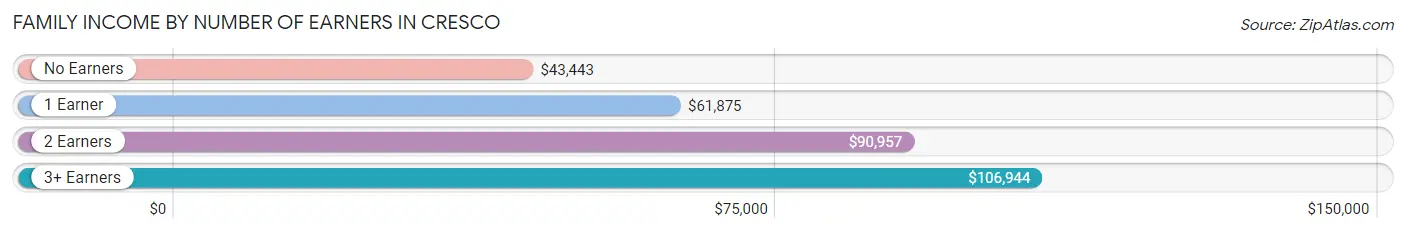
| Number of Earners | # Families | Median Income |
| No Earners | 169 (17.1%) | $43,443 |
| 1 Earner | 255 (25.8%) | $61,875 |
| 2 Earners | 426 (43.0%) | $90,957 |
| 3+ Earners | 140 (14.1%) | $106,944 |
| Total | 990 (100.0%) | $75,455 |
Household Income in Cresco
Household Income Brackets in Cresco
With 336 households falling in the category, the $50,000 to $74,999 income range is the most frequent in Cresco, accounting for 22.5% of all households. In contrast, only 28 households (1.9%) fall into the less than $10,000 income bracket, making it the least populous group.
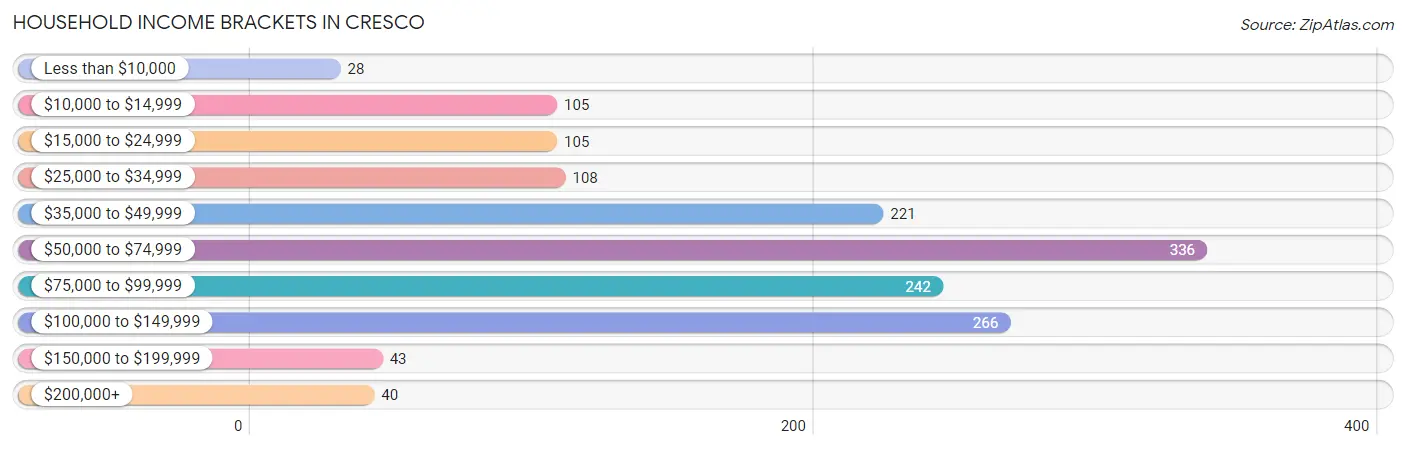
| Income Bracket | # Households | % Households |
| Less than $10,000 | 28 | 1.9% |
| $10,000 to $14,999 | 105 | 7.0% |
| $15,000 to $24,999 | 105 | 7.0% |
| $25,000 to $34,999 | 108 | 7.2% |
| $35,000 to $49,999 | 221 | 14.8% |
| $50,000 to $74,999 | 336 | 22.5% |
| $75,000 to $99,999 | 242 | 16.2% |
| $100,000 to $149,999 | 266 | 17.8% |
| $150,000 to $199,999 | 43 | 2.9% |
| $200,000+ | 40 | 2.7% |
Household Income by Householder Age in Cresco
The median household income in Cresco is $60,135, with the highest median household income of $80,875 found in the 25 to 44 years age bracket for the primary householder. A total of 423 households (28.3%) fall into this category. Meanwhile, the 15 to 24 years age bracket for the primary householder has the lowest median household income of $0, with 79 households (5.3%) in this group.
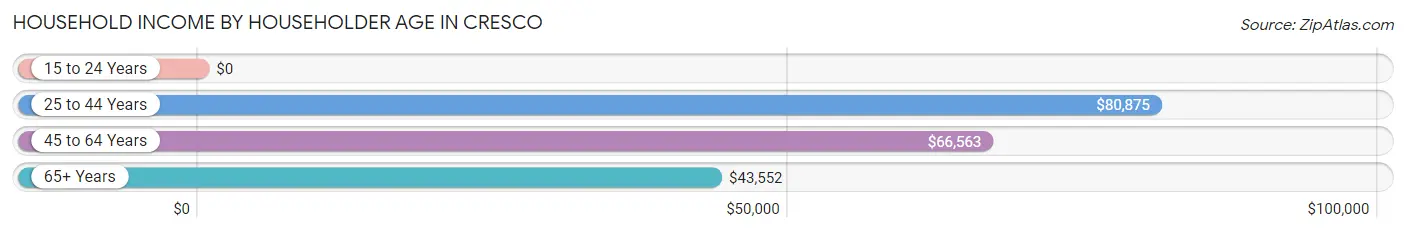
| Income Bracket | # Households | Median Income |
| 15 to 24 Years | 79 (5.3%) | $0 |
| 25 to 44 Years | 423 (28.3%) | $80,875 |
| 45 to 64 Years | 570 (38.1%) | $66,563 |
| 65+ Years | 423 (28.3%) | $43,552 |
| Total | 1,495 (100.0%) | $60,135 |
Poverty in Cresco
Income Below Poverty by Sex and Age in Cresco
With 10.3% poverty level for males and 12.2% for females among the residents of Cresco, 6 to 11 year old males and under 5 year old females are the most vulnerable to poverty, with 63 males (33.2%) and 40 females (29.8%) in their respective age groups living below the poverty level.
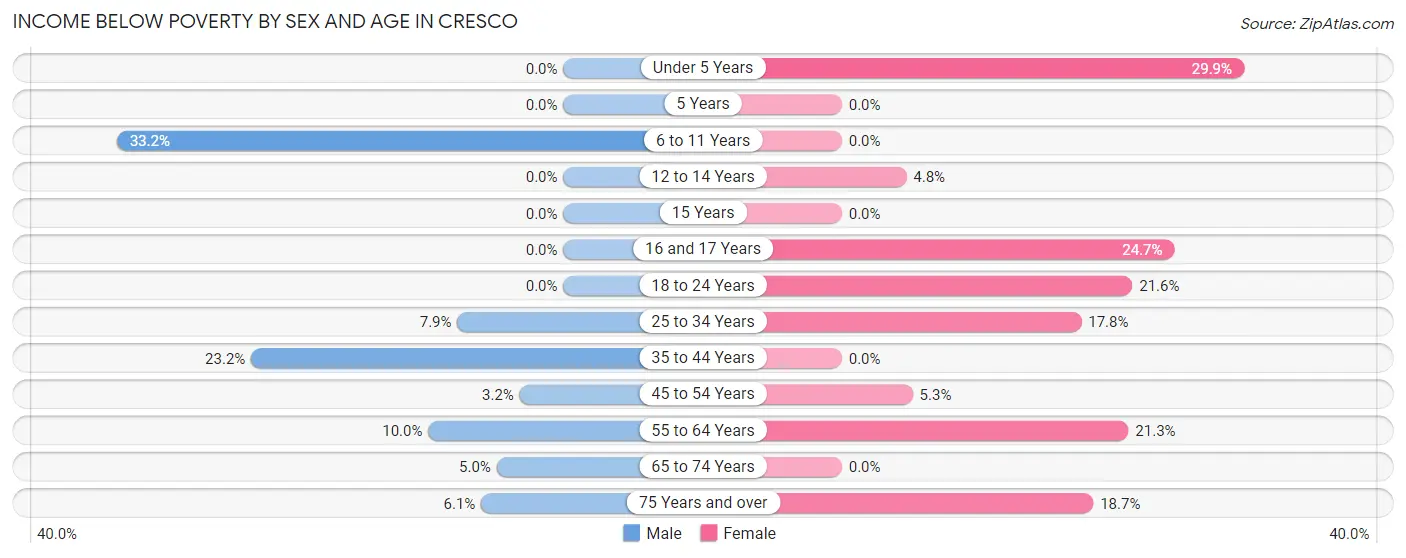
| Age Bracket | Male | Female |
| Under 5 Years | 0 (0.0%) | 40 (29.8%) |
| 5 Years | 0 (0.0%) | 0 (0.0%) |
| 6 to 11 Years | 63 (33.2%) | 0 (0.0%) |
| 12 to 14 Years | 0 (0.0%) | 7 (4.8%) |
| 15 Years | 0 (0.0%) | 0 (0.0%) |
| 16 and 17 Years | 0 (0.0%) | 20 (24.7%) |
| 18 to 24 Years | 0 (0.0%) | 33 (21.6%) |
| 25 to 34 Years | 14 (7.9%) | 40 (17.8%) |
| 35 to 44 Years | 54 (23.2%) | 0 (0.0%) |
| 45 to 54 Years | 6 (3.2%) | 9 (5.3%) |
| 55 to 64 Years | 34 (10.0%) | 60 (21.3%) |
| 65 to 74 Years | 10 (5.0%) | 0 (0.0%) |
| 75 Years and over | 10 (6.1%) | 28 (18.7%) |
| Total | 191 (10.3%) | 237 (12.2%) |
Income Above Poverty by Sex and Age in Cresco
According to the poverty statistics in Cresco, males aged under 5 years and females aged 5 years are the age groups that are most secure financially, with 100.0% of males and 100.0% of females in these age groups living above the poverty line.
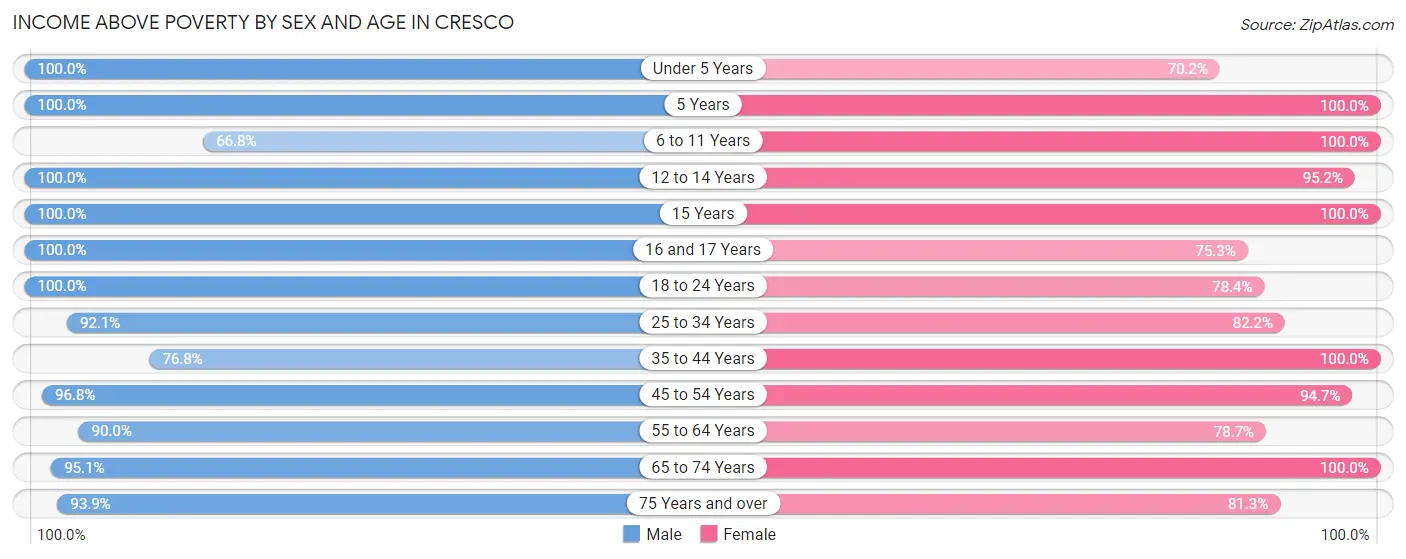
| Age Bracket | Male | Female |
| Under 5 Years | 124 (100.0%) | 94 (70.2%) |
| 5 Years | 3 (100.0%) | 45 (100.0%) |
| 6 to 11 Years | 127 (66.8%) | 98 (100.0%) |
| 12 to 14 Years | 19 (100.0%) | 139 (95.2%) |
| 15 Years | 54 (100.0%) | 5 (100.0%) |
| 16 and 17 Years | 21 (100.0%) | 61 (75.3%) |
| 18 to 24 Years | 144 (100.0%) | 120 (78.4%) |
| 25 to 34 Years | 164 (92.1%) | 185 (82.2%) |
| 35 to 44 Years | 179 (76.8%) | 255 (100.0%) |
| 45 to 54 Years | 179 (96.8%) | 162 (94.7%) |
| 55 to 64 Years | 305 (90.0%) | 222 (78.7%) |
| 65 to 74 Years | 192 (95.1%) | 191 (100.0%) |
| 75 Years and over | 154 (93.9%) | 122 (81.3%) |
| Total | 1,665 (89.7%) | 1,699 (87.8%) |
Income Below Poverty Among Married-Couple Families in Cresco
The poverty statistics for married-couple families in Cresco show that 1.3% or 11 of the total 851 families live below the poverty line. Families with no children have the highest poverty rate of 2.0%, comprising of 11 families. On the other hand, families with 1 or 2 children have the lowest poverty rate of 0.0%, which includes 0 families.
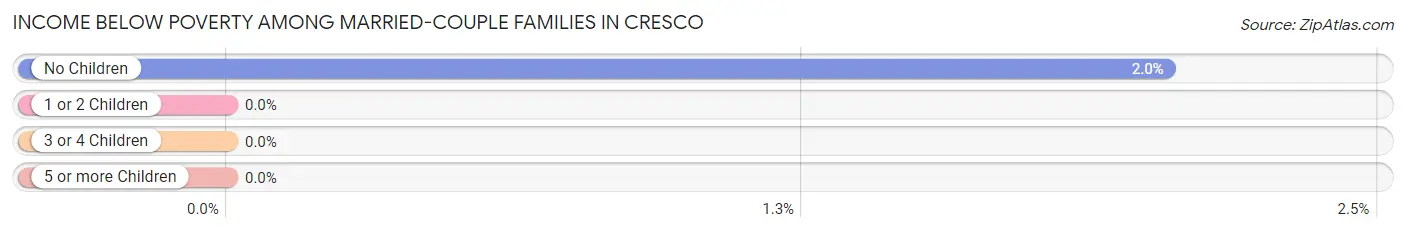
| Children | Above Poverty | Below Poverty |
| No Children | 527 (98.0%) | 11 (2.0%) |
| 1 or 2 Children | 198 (100.0%) | 0 (0.0%) |
| 3 or 4 Children | 115 (100.0%) | 0 (0.0%) |
| 5 or more Children | 0 (0.0%) | 0 (0.0%) |
| Total | 840 (98.7%) | 11 (1.3%) |
Income Below Poverty Among Single-Parent Households in Cresco
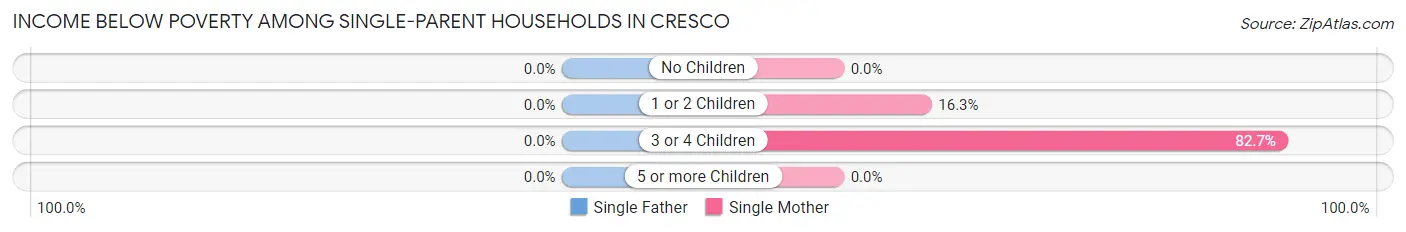
| Children | Single Father | Single Mother |
| No Children | 0 (0.0%) | 0 (0.0%) |
| 1 or 2 Children | 0 (0.0%) | 8 (16.3%) |
| 3 or 4 Children | 0 (0.0%) | 43 (82.7%) |
| 5 or more Children | 0 (0.0%) | 0 (0.0%) |
| Total | 0 (0.0%) | 51 (44.4%) |
Income Below Poverty Among Married-Couple vs Single-Parent Households in Cresco
The poverty data for Cresco shows that 11 of the married-couple family households (1.3%) and 51 of the single-parent households (36.7%) are living below the poverty level. Within the married-couple family households, those with no children have the highest poverty rate, with 11 households (2.0%) falling below the poverty line. Among the single-parent households, those with 3 or 4 children have the highest poverty rate, with 43 household (82.7%) living below poverty.
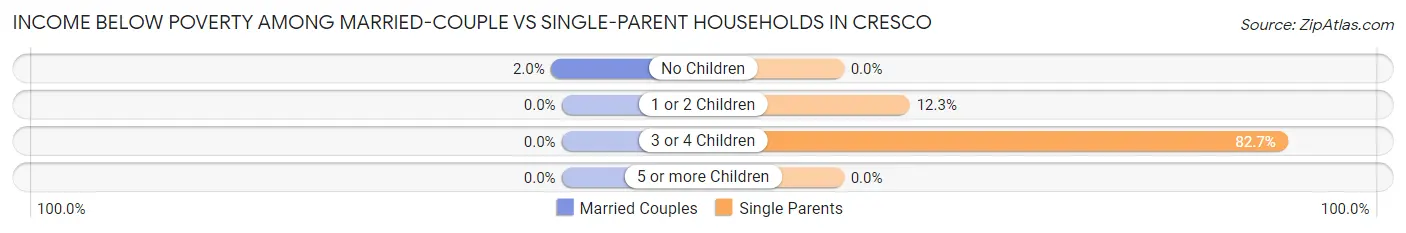
| Children | Married-Couple Families | Single-Parent Households |
| No Children | 11 (2.0%) | 0 (0.0%) |
| 1 or 2 Children | 0 (0.0%) | 8 (12.3%) |
| 3 or 4 Children | 0 (0.0%) | 43 (82.7%) |
| 5 or more Children | 0 (0.0%) | 0 (0.0%) |
| Total | 11 (1.3%) | 51 (36.7%) |
Race in Cresco
The most populous races in Cresco are White / Caucasian (3,770 | 96.7%), Two or more Races (93 | 2.4%), and Hispanic or Latino (35 | 0.9%).
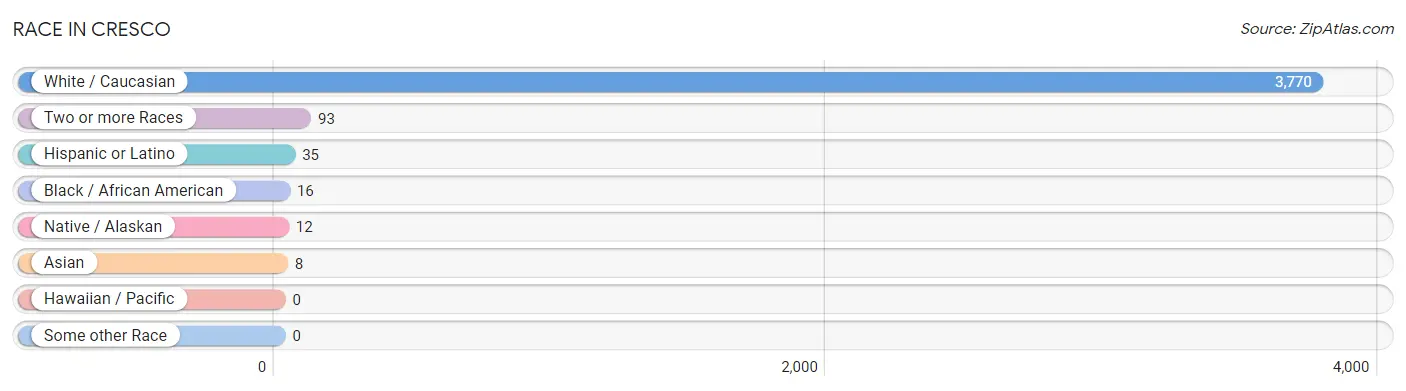
| Race | # Population | % Population |
| Asian | 8 | 0.2% |
| Black / African American | 16 | 0.4% |
| Hawaiian / Pacific | 0 | 0.0% |
| Hispanic or Latino | 35 | 0.9% |
| Native / Alaskan | 12 | 0.3% |
| White / Caucasian | 3,770 | 96.7% |
| Two or more Races | 93 | 2.4% |
| Some other Race | 0 | 0.0% |
| Total | 3,899 | 100.0% |
Ancestry in Cresco
The most populous ancestries reported in Cresco are German (1,417 | 36.3%), Norwegian (695 | 17.8%), Czech (325 | 8.3%), Irish (325 | 8.3%), and Polish (163 | 4.2%), together accounting for 75.0% of all Cresco residents.
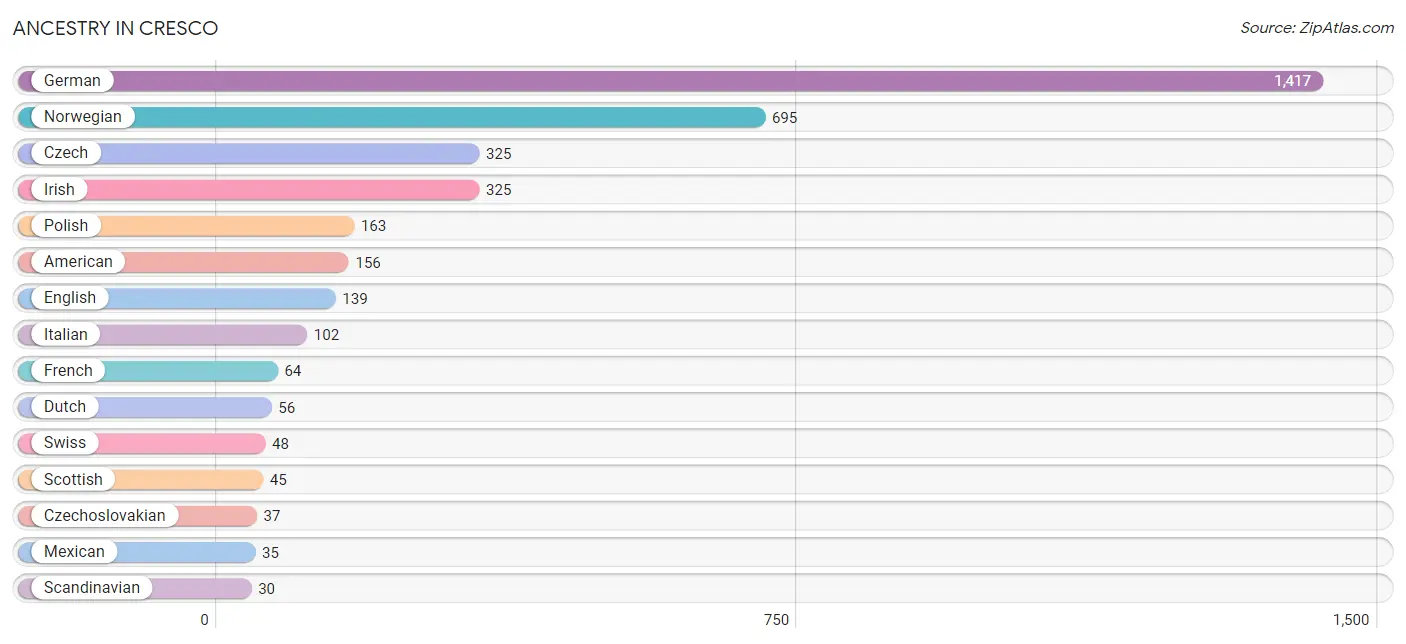
| Ancestry | # Population | % Population |
| American | 156 | 4.0% |
| Austrian | 7 | 0.2% |
| Bhutanese | 13 | 0.3% |
| Burmese | 1 | 0.0% |
| Cherokee | 12 | 0.3% |
| Czech | 325 | 8.3% |
| Czechoslovakian | 37 | 0.9% |
| Danish | 11 | 0.3% |
| Dutch | 56 | 1.4% |
| English | 139 | 3.6% |
| European | 8 | 0.2% |
| French | 64 | 1.6% |
| French Canadian | 9 | 0.2% |
| German | 1,417 | 36.3% |
| Greek | 10 | 0.3% |
| Irish | 325 | 8.3% |
| Italian | 102 | 2.6% |
| Korean | 4 | 0.1% |
| Mexican | 35 | 0.9% |
| Norwegian | 695 | 17.8% |
| Polish | 163 | 4.2% |
| Scandinavian | 30 | 0.8% |
| Scotch-Irish | 8 | 0.2% |
| Scottish | 45 | 1.1% |
| Somali | 2 | 0.1% |
| South African | 18 | 0.5% |
| Subsaharan African | 20 | 0.5% |
| Swedish | 8 | 0.2% |
| Swiss | 48 | 1.2% |
| Welsh | 10 | 0.3% | View All 30 Rows |
Immigrants in Cresco
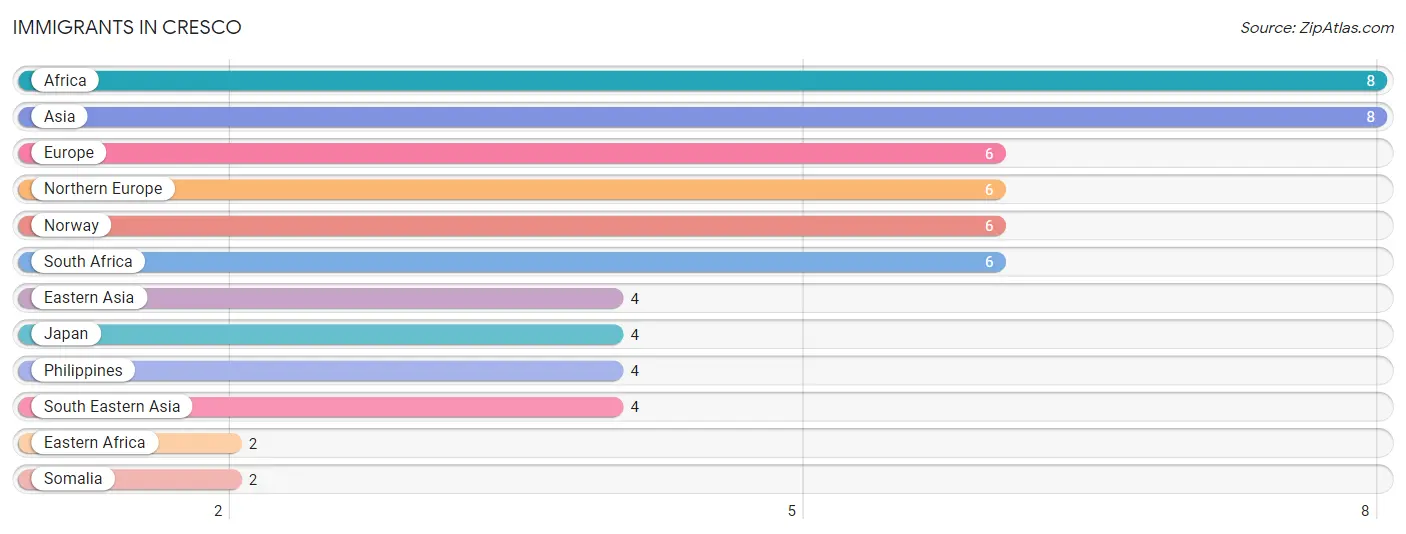
The most numerous immigrant groups reported in Cresco came from Africa (8 | 0.2%), Asia (8 | 0.2%), Europe (6 | 0.2%), Northern Europe (6 | 0.2%), and Norway (6 | 0.2%), together accounting for 0.9% of all Cresco residents.
| Immigration Origin | # Population | % Population |
| Africa | 8 | 0.2% |
| Asia | 8 | 0.2% |
| Eastern Africa | 2 | 0.1% |
| Eastern Asia | 4 | 0.1% |
| Europe | 6 | 0.2% |
| Japan | 4 | 0.1% |
| Northern Europe | 6 | 0.2% |
| Norway | 6 | 0.2% |
| Philippines | 4 | 0.1% |
| Somalia | 2 | 0.1% |
| South Africa | 6 | 0.2% |
| South Eastern Asia | 4 | 0.1% | View All 12 Rows |
Sex and Age in Cresco
Sex and Age in Cresco
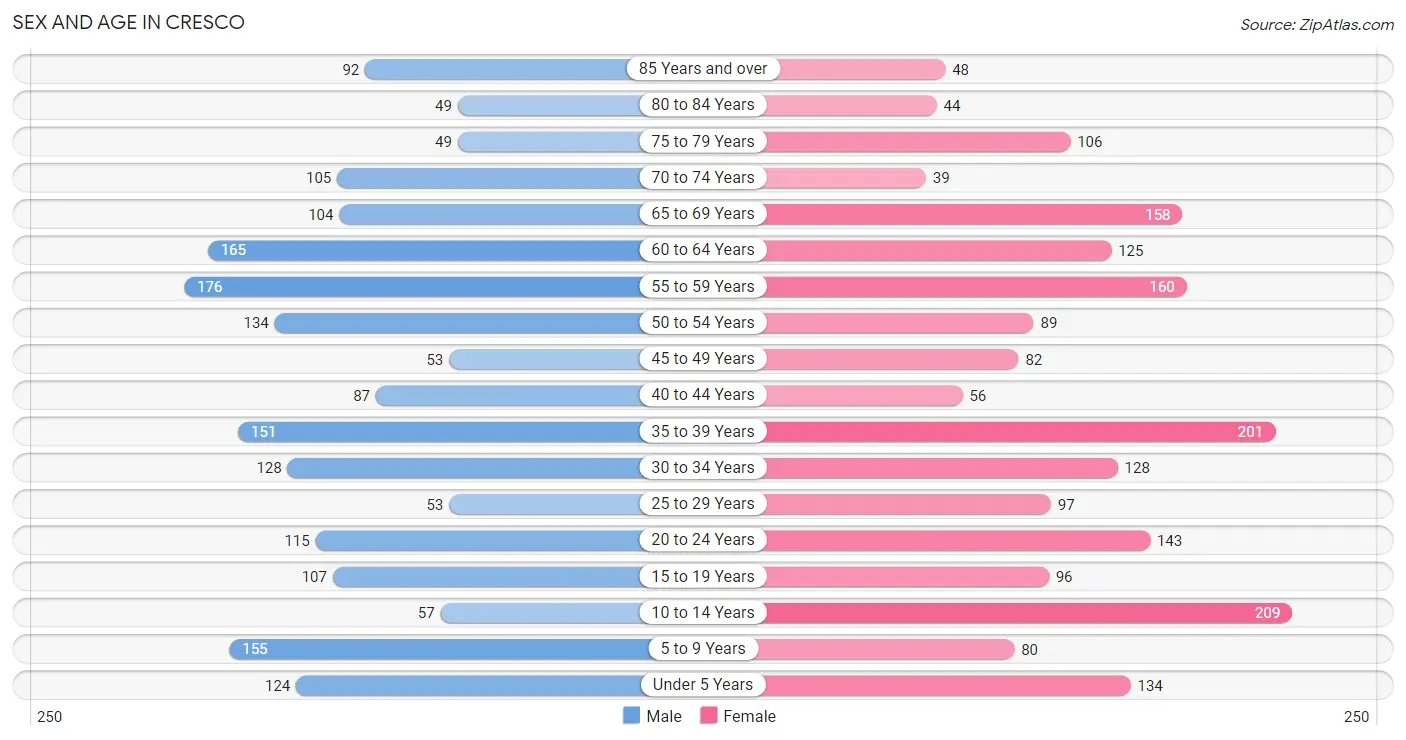
The most populous age groups in Cresco are 55 to 59 Years (176 | 9.2%) for men and 10 to 14 Years (209 | 10.5%) for women.
| Age Bracket | Male | Female |
| Under 5 Years | 124 (6.5%) | 134 (6.7%) |
| 5 to 9 Years | 155 (8.1%) | 80 (4.0%) |
| 10 to 14 Years | 57 (3.0%) | 209 (10.5%) |
| 15 to 19 Years | 107 (5.6%) | 96 (4.8%) |
| 20 to 24 Years | 115 (6.0%) | 143 (7.2%) |
| 25 to 29 Years | 53 (2.8%) | 97 (4.9%) |
| 30 to 34 Years | 128 (6.7%) | 128 (6.4%) |
| 35 to 39 Years | 151 (7.9%) | 201 (10.1%) |
| 40 to 44 Years | 87 (4.6%) | 56 (2.8%) |
| 45 to 49 Years | 53 (2.8%) | 82 (4.1%) |
| 50 to 54 Years | 134 (7.0%) | 89 (4.5%) |
| 55 to 59 Years | 176 (9.2%) | 160 (8.0%) |
| 60 to 64 Years | 165 (8.7%) | 125 (6.3%) |
| 65 to 69 Years | 104 (5.5%) | 158 (7.9%) |
| 70 to 74 Years | 105 (5.5%) | 39 (1.9%) |
| 75 to 79 Years | 49 (2.6%) | 106 (5.3%) |
| 80 to 84 Years | 49 (2.6%) | 44 (2.2%) |
| 85 Years and over | 92 (4.8%) | 48 (2.4%) |
| Total | 1,904 (100.0%) | 1,995 (100.0%) |
Families and Households in Cresco
Median Family Size in Cresco
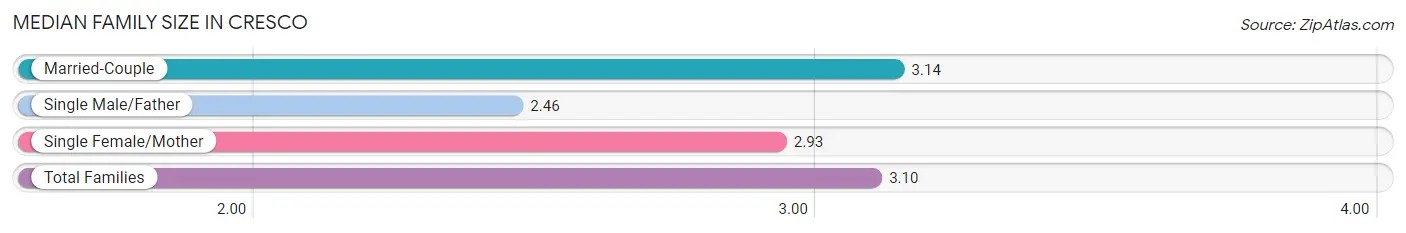
The median family size in Cresco is 3.10 persons per family, with married-couple families (851 | 86.0%) accounting for the largest median family size of 3.14 persons per family. On the other hand, single male/father families (24 | 2.4%) represent the smallest median family size with 2.46 persons per family.
| Family Type | # Families | Family Size |
| Married-Couple | 851 (86.0%) | 3.14 |
| Single Male/Father | 24 (2.4%) | 2.46 |
| Single Female/Mother | 115 (11.6%) | 2.93 |
| Total Families | 990 (100.0%) | 3.10 |
Median Household Size in Cresco
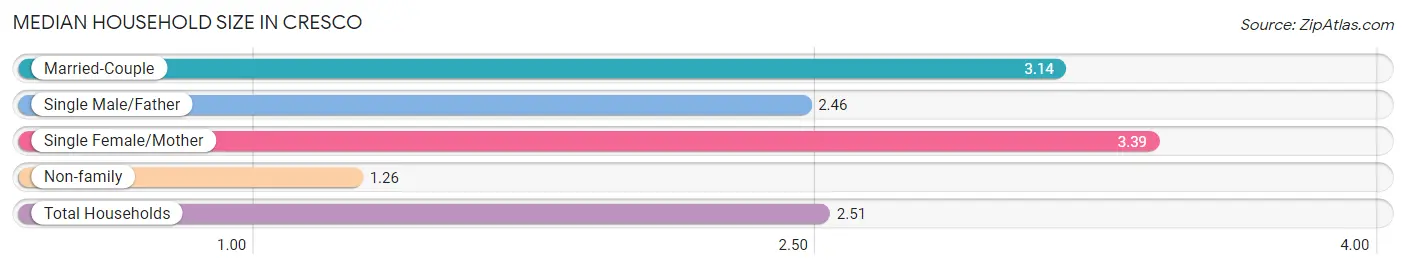
The median household size in Cresco is 2.51 persons per household, with single female/mother households (115 | 7.7%) accounting for the largest median household size of 3.39 persons per household. non-family households (505 | 33.8%) represent the smallest median household size with 1.26 persons per household.
| Household Type | # Households | Household Size |
| Married-Couple | 851 (56.9%) | 3.14 |
| Single Male/Father | 24 (1.6%) | 2.46 |
| Single Female/Mother | 115 (7.7%) | 3.39 |
| Non-family | 505 (33.8%) | 1.26 |
| Total Households | 1,495 (100.0%) | 2.51 |
Household Size by Marriage Status in Cresco
Out of a total of 1,495 households in Cresco, 990 (66.2%) are family households, while 505 (33.8%) are nonfamily households. The most numerous type of family households are 2-person households, comprising 557, and the most common type of nonfamily households are 1-person households, comprising 393.
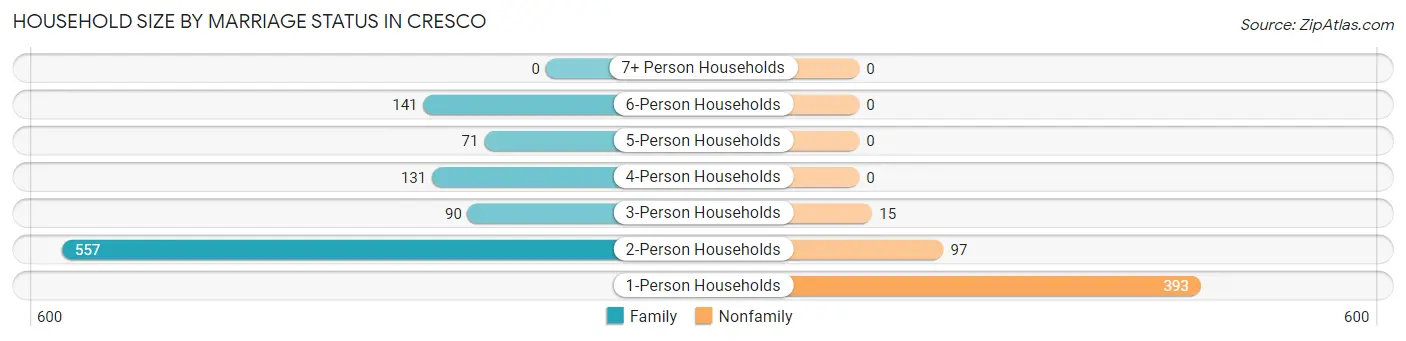
| Household Size | Family Households | Nonfamily Households |
| 1-Person Households | - | 393 (26.3%) |
| 2-Person Households | 557 (37.3%) | 97 (6.5%) |
| 3-Person Households | 90 (6.0%) | 15 (1.0%) |
| 4-Person Households | 131 (8.8%) | 0 (0.0%) |
| 5-Person Households | 71 (4.8%) | 0 (0.0%) |
| 6-Person Households | 141 (9.4%) | 0 (0.0%) |
| 7+ Person Households | 0 (0.0%) | 0 (0.0%) |
| Total | 990 (66.2%) | 505 (33.8%) |
Female Fertility in Cresco
Fertility by Age in Cresco
Average fertility rate in Cresco is 128.0 births per 1,000 women. Women in the age bracket of 20 to 34 years have the highest fertility rate with 253.0 births per 1,000 women. Women in the age bracket of 20 to 34 years acount for 88.6% of all women with births.
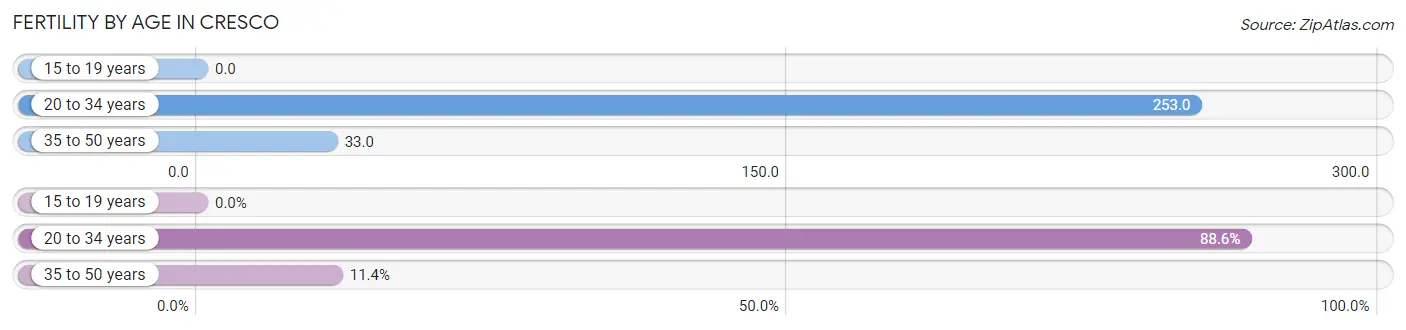
| Age Bracket | Women with Births | Births / 1,000 Women |
| 15 to 19 years | 0 (0.0%) | 0.0 |
| 20 to 34 years | 93 (88.6%) | 253.0 |
| 35 to 50 years | 12 (11.4%) | 33.0 |
| Total | 105 (100.0%) | 128.0 |
Fertility by Age by Marriage Status in Cresco
29.5% of women with births (105) in Cresco are married. The highest percentage of unmarried women with births falls into 20 to 34 years age bracket with 79.6% of them unmarried at the time of birth, while the lowest percentage of unmarried women with births belong to 35 to 50 years age bracket with 0.0% of them unmarried.
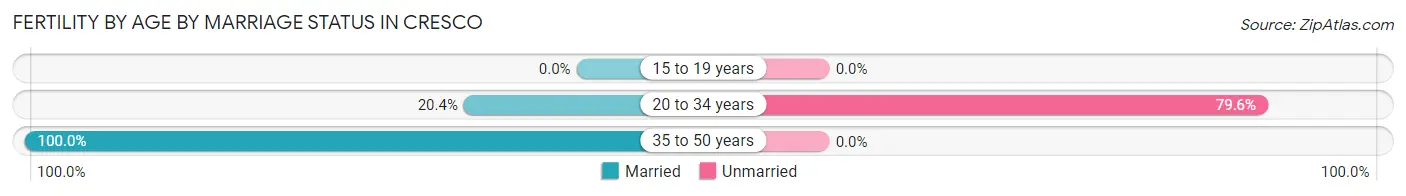
| Age Bracket | Married | Unmarried |
| 15 to 19 years | 0 (0.0%) | 0 (0.0%) |
| 20 to 34 years | 19 (20.4%) | 74 (79.6%) |
| 35 to 50 years | 12 (100.0%) | 0 (0.0%) |
| Total | 31 (29.5%) | 74 (70.5%) |
Fertility by Education in Cresco
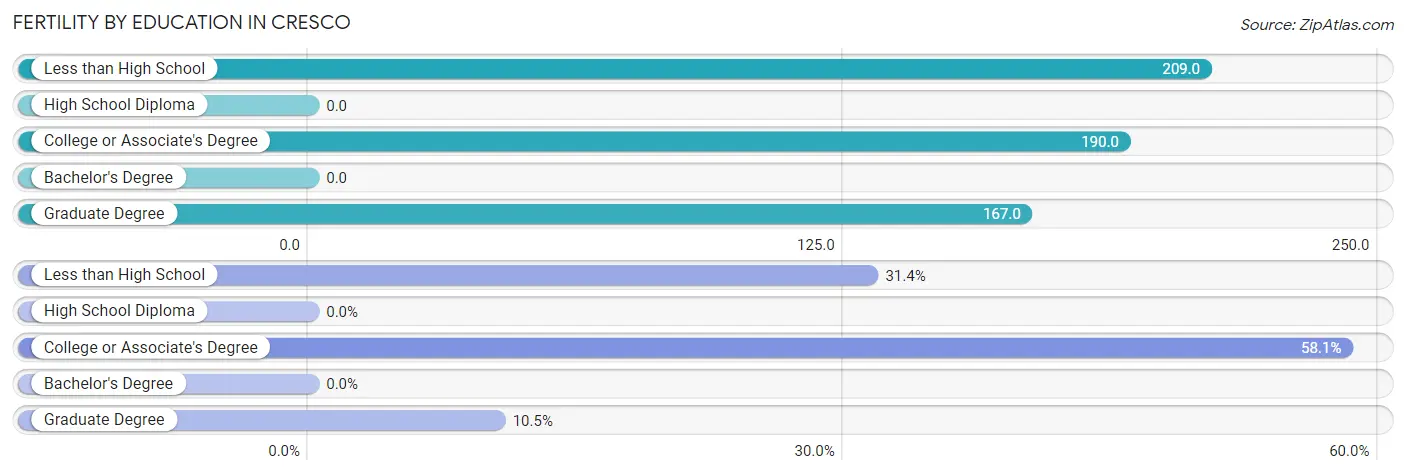
| Educational Attainment | Women with Births | Births / 1,000 Women |
| Less than High School | 33 (31.4%) | 209.0 |
| High School Diploma | 0 (0.0%) | 0.0 |
| College or Associate's Degree | 61 (58.1%) | 190.0 |
| Bachelor's Degree | 0 (0.0%) | 0.0 |
| Graduate Degree | 11 (10.5%) | 167.0 |
| Total | 105 (100.0%) | 128.0 |
Fertility by Education by Marriage Status in Cresco
70.5% of women with births in Cresco are unmarried. Women with the educational attainment of graduate degree are most likely to be married with 100.0% of them married at childbirth, while women with the educational attainment of less than high school are least likely to be married with 100.0% of them unmarried at childbirth.
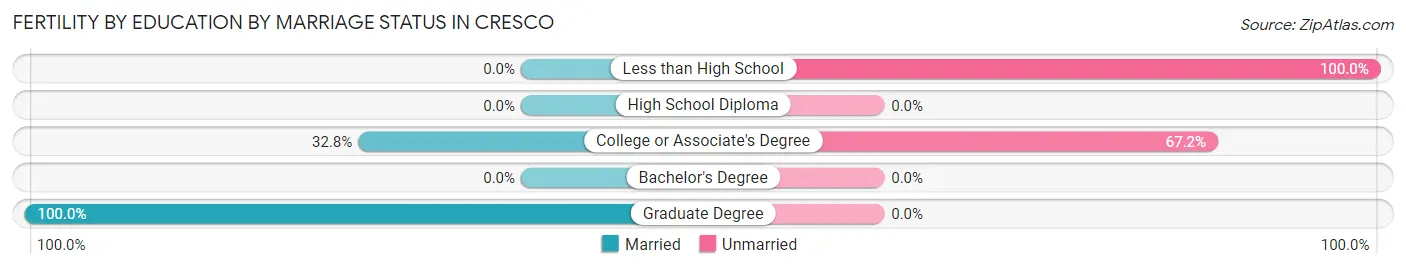
| Educational Attainment | Married | Unmarried |
| Less than High School | 0 (0.0%) | 33 (100.0%) |
| High School Diploma | 0 (0.0%) | 0 (0.0%) |
| College or Associate's Degree | 20 (32.8%) | 41 (67.2%) |
| Bachelor's Degree | 0 (0.0%) | 0 (0.0%) |
| Graduate Degree | 11 (100.0%) | 0 (0.0%) |
| Total | 31 (29.5%) | 74 (70.5%) |
Employment Characteristics in Cresco
Employment by Class of Employer in Cresco
Among the 1,980 employed individuals in Cresco, private company employees (1,367 | 69.0%), not-for-profit organizations (230 | 11.6%), and local government employees (198 | 10.0%) make up the most common classes of employment.
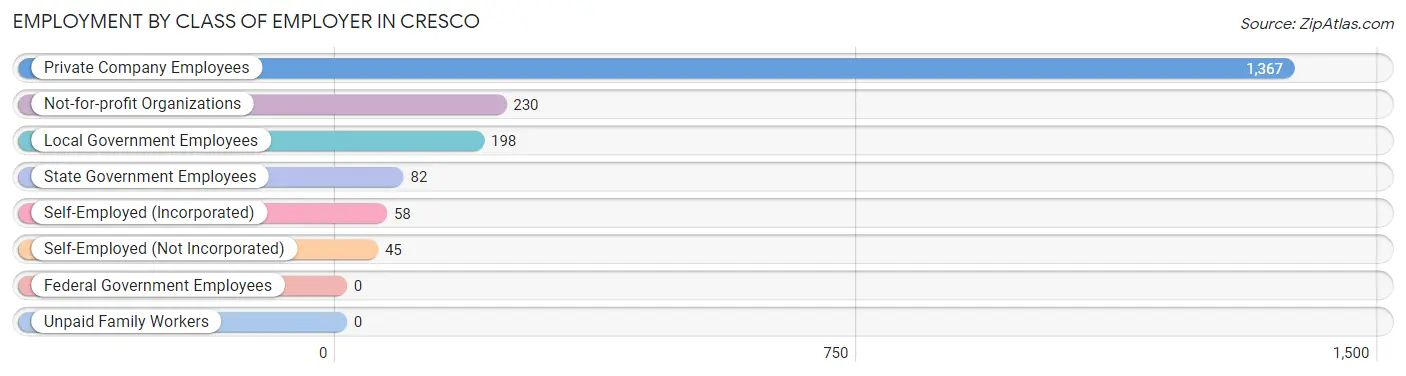
| Employer Class | # Employees | % Employees |
| Private Company Employees | 1,367 | 69.0% |
| Self-Employed (Incorporated) | 58 | 2.9% |
| Self-Employed (Not Incorporated) | 45 | 2.3% |
| Not-for-profit Organizations | 230 | 11.6% |
| Local Government Employees | 198 | 10.0% |
| State Government Employees | 82 | 4.1% |
| Federal Government Employees | 0 | 0.0% |
| Unpaid Family Workers | 0 | 0.0% |
| Total | 1,980 | 100.0% |
Employment Status by Age in Cresco
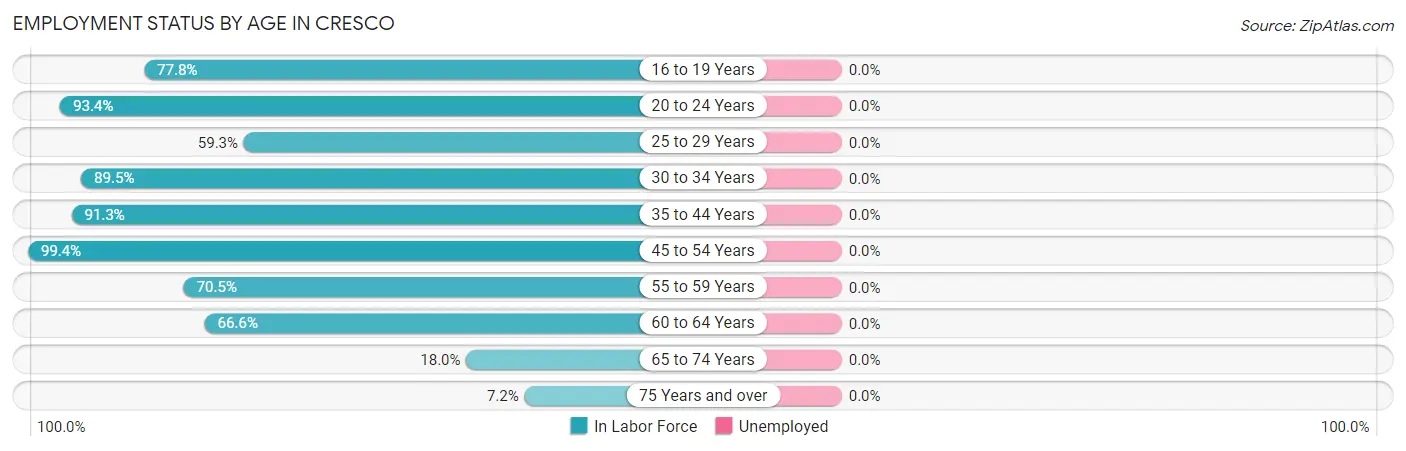
| Age Bracket | In Labor Force | Unemployed |
| 16 to 19 Years | 112 (77.8%) | 0 (0.0%) |
| 20 to 24 Years | 241 (93.4%) | 0 (0.0%) |
| 25 to 29 Years | 89 (59.3%) | 0 (0.0%) |
| 30 to 34 Years | 229 (89.5%) | 0 (0.0%) |
| 35 to 44 Years | 452 (91.3%) | 0 (0.0%) |
| 45 to 54 Years | 356 (99.4%) | 0 (0.0%) |
| 55 to 59 Years | 237 (70.5%) | 0 (0.0%) |
| 60 to 64 Years | 193 (66.6%) | 0 (0.0%) |
| 65 to 74 Years | 73 (18.0%) | 0 (0.0%) |
| 75 Years and over | 28 (7.2%) | 0 (0.0%) |
| Total | 2,009 (65.2%) | 0 (0.0%) |
Employment Status by Educational Attainment in Cresco
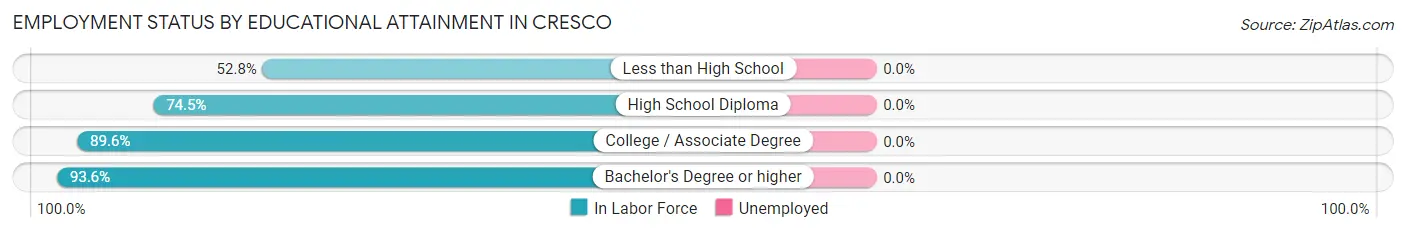
| Educational Attainment | In Labor Force | Unemployed |
| Less than High School | 47 (52.8%) | 0 (0.0%) |
| High School Diploma | 568 (74.5%) | 0 (0.0%) |
| College / Associate Degree | 592 (89.6%) | 0 (0.0%) |
| Bachelor's Degree or higher | 349 (93.6%) | 0 (0.0%) |
| Total | 1,555 (82.5%) | 0 (0.0%) |
Employment Occupations by Sex in Cresco
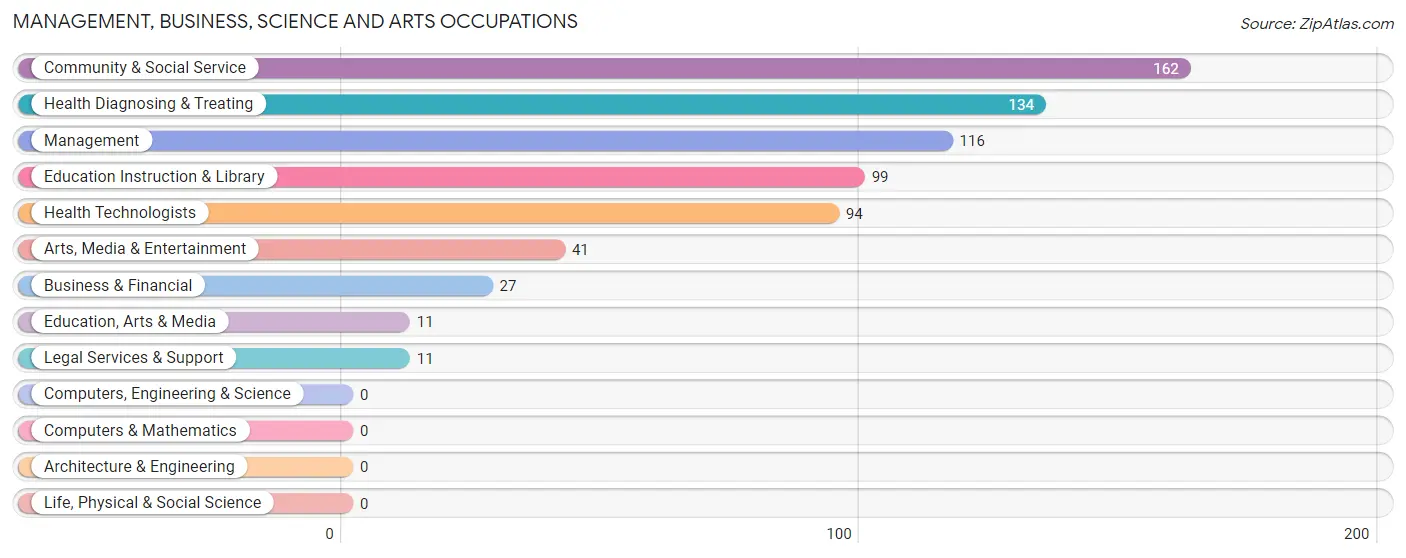
Management, Business, Science and Arts Occupations
The most common Management, Business, Science and Arts occupations in Cresco are Community & Social Service (162 | 8.1%), Health Diagnosing & Treating (134 | 6.7%), Management (116 | 5.8%), Education Instruction & Library (99 | 4.9%), and Health Technologists (94 | 4.7%).
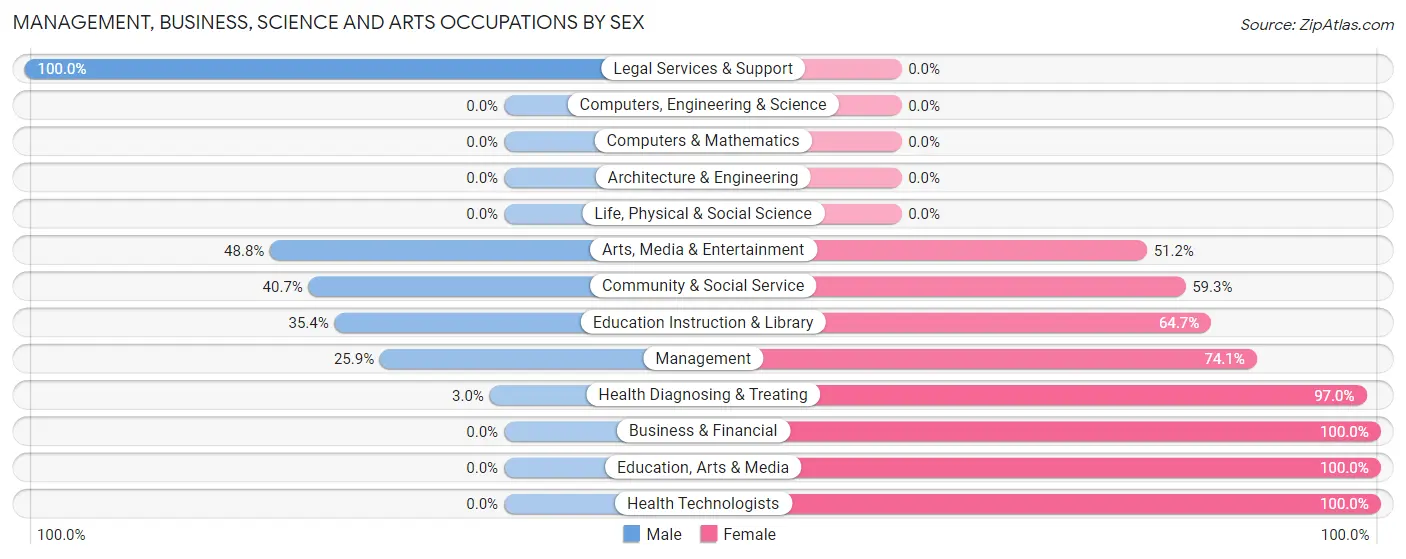
Management, Business, Science and Arts Occupations by Sex
Within the Management, Business, Science and Arts occupations in Cresco, the most male-oriented occupations are Legal Services & Support (100.0%), Arts, Media & Entertainment (48.8%), and Community & Social Service (40.7%), while the most female-oriented occupations are Business & Financial (100.0%), Education, Arts & Media (100.0%), and Health Technologists (100.0%).
| Occupation | Male | Female |
| Management | 30 (25.9%) | 86 (74.1%) |
| Business & Financial | 0 (0.0%) | 27 (100.0%) |
| Computers, Engineering & Science | 0 (0.0%) | 0 (0.0%) |
| Computers & Mathematics | 0 (0.0%) | 0 (0.0%) |
| Architecture & Engineering | 0 (0.0%) | 0 (0.0%) |
| Life, Physical & Social Science | 0 (0.0%) | 0 (0.0%) |
| Community & Social Service | 66 (40.7%) | 96 (59.3%) |
| Education, Arts & Media | 0 (0.0%) | 11 (100.0%) |
| Legal Services & Support | 11 (100.0%) | 0 (0.0%) |
| Education Instruction & Library | 35 (35.3%) | 64 (64.6%) |
| Arts, Media & Entertainment | 20 (48.8%) | 21 (51.2%) |
| Health Diagnosing & Treating | 4 (3.0%) | 130 (97.0%) |
| Health Technologists | 0 (0.0%) | 94 (100.0%) |
| Total (Category) | 100 (22.8%) | 339 (77.2%) |
| Total (Overall) | 1,020 (50.7%) | 990 (49.2%) |
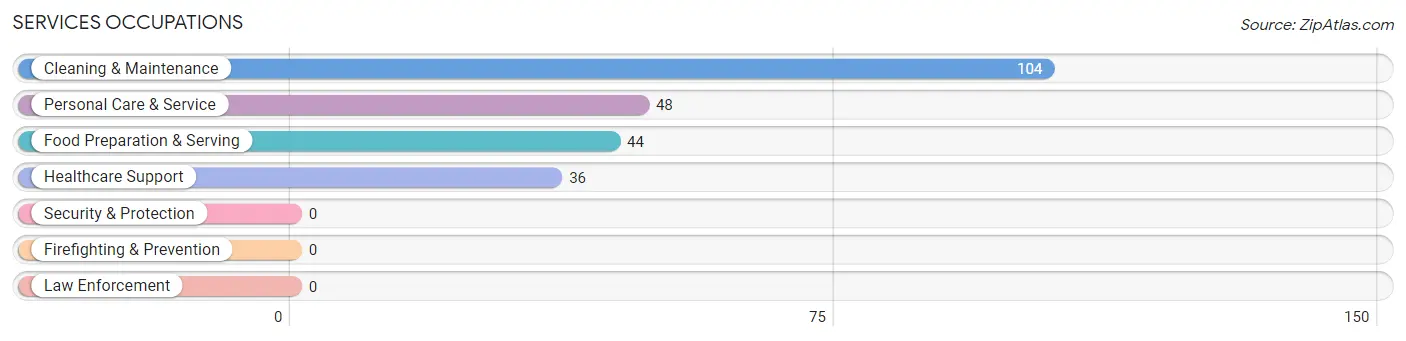
Services Occupations
The most common Services occupations in Cresco are Cleaning & Maintenance (104 | 5.2%), Personal Care & Service (48 | 2.4%), Food Preparation & Serving (44 | 2.2%), and Healthcare Support (36 | 1.8%).
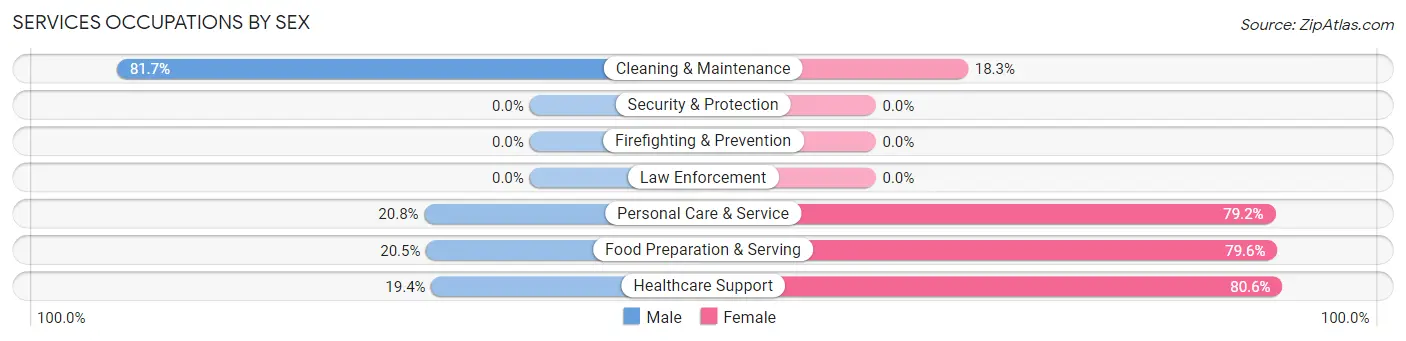
Services Occupations by Sex
Within the Services occupations in Cresco, the most male-oriented occupations are Cleaning & Maintenance (81.7%), Personal Care & Service (20.8%), and Food Preparation & Serving (20.4%), while the most female-oriented occupations are Healthcare Support (80.6%), Food Preparation & Serving (79.5%), and Personal Care & Service (79.2%).
| Occupation | Male | Female |
| Healthcare Support | 7 (19.4%) | 29 (80.6%) |
| Security & Protection | 0 (0.0%) | 0 (0.0%) |
| Firefighting & Prevention | 0 (0.0%) | 0 (0.0%) |
| Law Enforcement | 0 (0.0%) | 0 (0.0%) |
| Food Preparation & Serving | 9 (20.4%) | 35 (79.5%) |
| Cleaning & Maintenance | 85 (81.7%) | 19 (18.3%) |
| Personal Care & Service | 10 (20.8%) | 38 (79.2%) |
| Total (Category) | 111 (47.8%) | 121 (52.2%) |
| Total (Overall) | 1,020 (50.7%) | 990 (49.2%) |
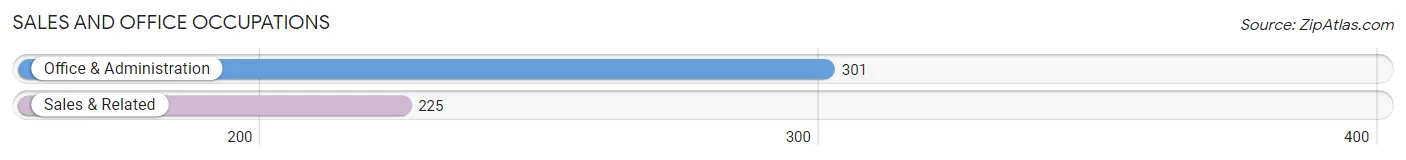
Sales and Office Occupations
The most common Sales and Office occupations in Cresco are Office & Administration (301 | 15.0%), and Sales & Related (225 | 11.2%).
Sales and Office Occupations by Sex
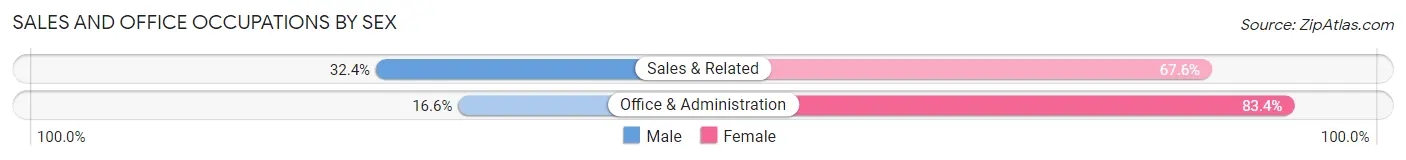
| Occupation | Male | Female |
| Sales & Related | 73 (32.4%) | 152 (67.6%) |
| Office & Administration | 50 (16.6%) | 251 (83.4%) |
| Total (Category) | 123 (23.4%) | 403 (76.6%) |
| Total (Overall) | 1,020 (50.7%) | 990 (49.2%) |
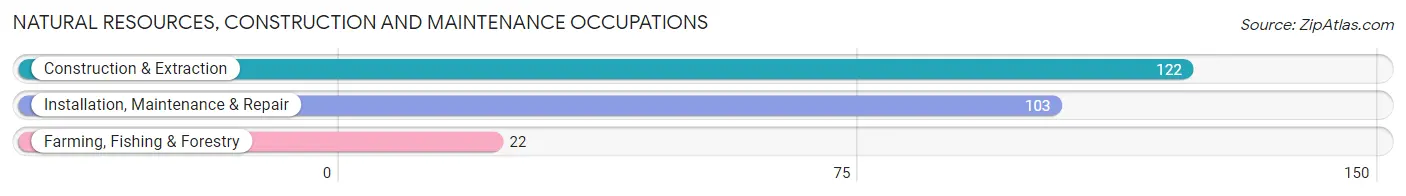
Natural Resources, Construction and Maintenance Occupations
The most common Natural Resources, Construction and Maintenance occupations in Cresco are Construction & Extraction (122 | 6.1%), Installation, Maintenance & Repair (103 | 5.1%), and Farming, Fishing & Forestry (22 | 1.1%).
Natural Resources, Construction and Maintenance Occupations by Sex
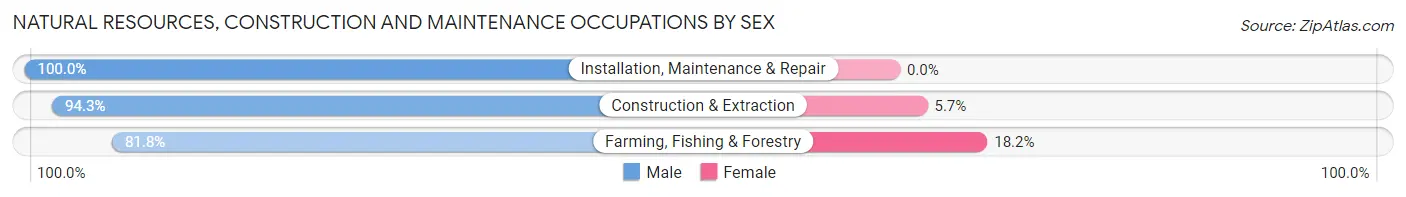
| Occupation | Male | Female |
| Farming, Fishing & Forestry | 18 (81.8%) | 4 (18.2%) |
| Construction & Extraction | 115 (94.3%) | 7 (5.7%) |
| Installation, Maintenance & Repair | 103 (100.0%) | 0 (0.0%) |
| Total (Category) | 236 (95.6%) | 11 (4.4%) |
| Total (Overall) | 1,020 (50.7%) | 990 (49.2%) |
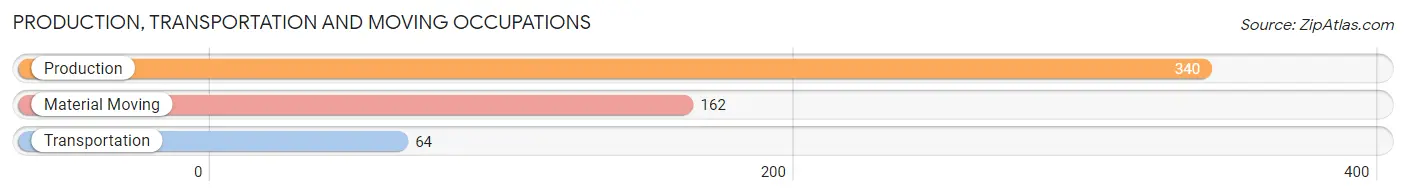
Production, Transportation and Moving Occupations
The most common Production, Transportation and Moving occupations in Cresco are Production (340 | 16.9%), Material Moving (162 | 8.1%), and Transportation (64 | 3.2%).
Production, Transportation and Moving Occupations by Sex
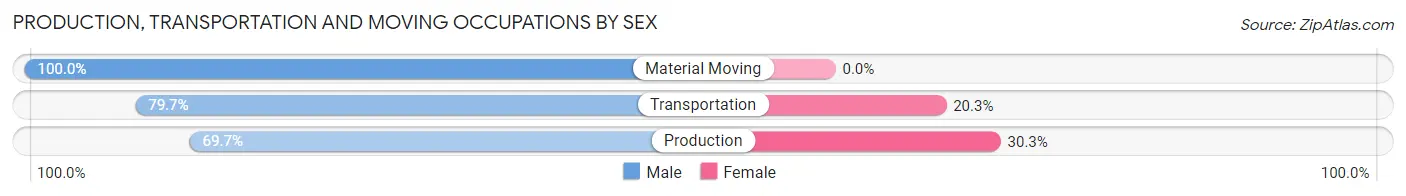
| Occupation | Male | Female |
| Production | 237 (69.7%) | 103 (30.3%) |
| Transportation | 51 (79.7%) | 13 (20.3%) |
| Material Moving | 162 (100.0%) | 0 (0.0%) |
| Total (Category) | 450 (79.5%) | 116 (20.5%) |
| Total (Overall) | 1,020 (50.7%) | 990 (49.2%) |
Employment Industries by Sex in Cresco
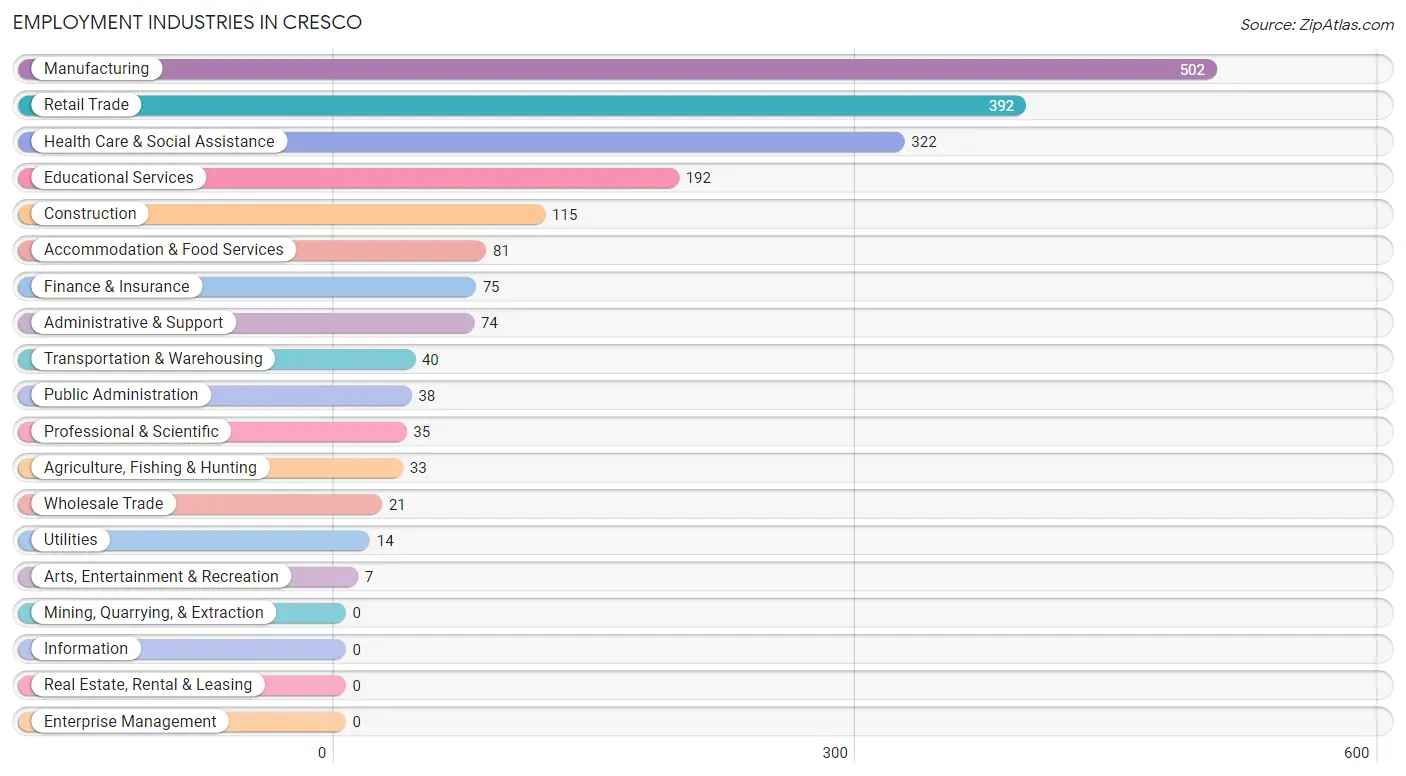
Employment Industries in Cresco
The major employment industries in Cresco include Manufacturing (502 | 25.0%), Retail Trade (392 | 19.5%), Health Care & Social Assistance (322 | 16.0%), Educational Services (192 | 9.6%), and Construction (115 | 5.7%).
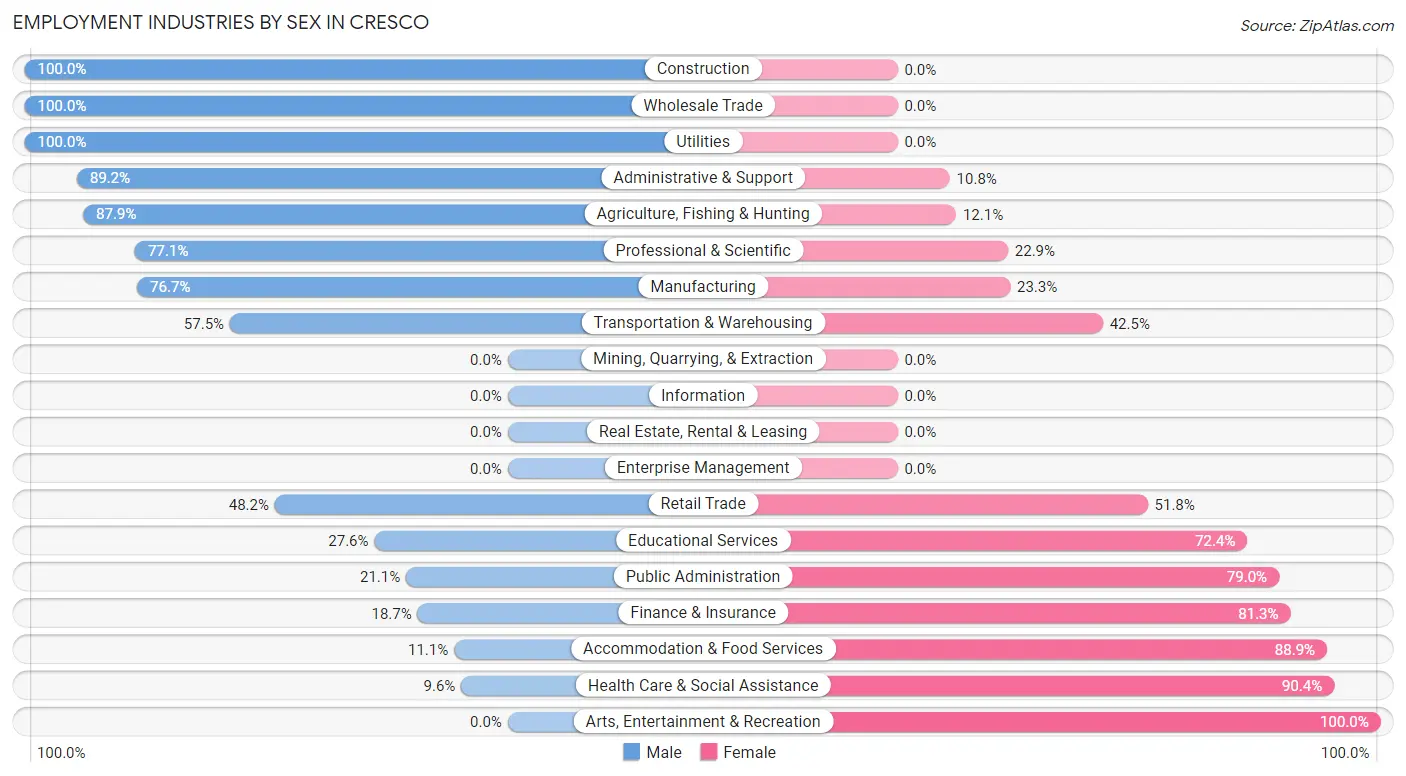
Employment Industries by Sex in Cresco
The Cresco industries that see more men than women are Construction (100.0%), Wholesale Trade (100.0%), and Utilities (100.0%), whereas the industries that tend to have a higher number of women are Arts, Entertainment & Recreation (100.0%), Health Care & Social Assistance (90.4%), and Accommodation & Food Services (88.9%).
| Industry | Male | Female |
| Agriculture, Fishing & Hunting | 29 (87.9%) | 4 (12.1%) |
| Mining, Quarrying, & Extraction | 0 (0.0%) | 0 (0.0%) |
| Construction | 115 (100.0%) | 0 (0.0%) |
| Manufacturing | 385 (76.7%) | 117 (23.3%) |
| Wholesale Trade | 21 (100.0%) | 0 (0.0%) |
| Retail Trade | 189 (48.2%) | 203 (51.8%) |
| Transportation & Warehousing | 23 (57.5%) | 17 (42.5%) |
| Utilities | 14 (100.0%) | 0 (0.0%) |
| Information | 0 (0.0%) | 0 (0.0%) |
| Finance & Insurance | 14 (18.7%) | 61 (81.3%) |
| Real Estate, Rental & Leasing | 0 (0.0%) | 0 (0.0%) |
| Professional & Scientific | 27 (77.1%) | 8 (22.9%) |
| Enterprise Management | 0 (0.0%) | 0 (0.0%) |
| Administrative & Support | 66 (89.2%) | 8 (10.8%) |
| Educational Services | 53 (27.6%) | 139 (72.4%) |
| Health Care & Social Assistance | 31 (9.6%) | 291 (90.4%) |
| Arts, Entertainment & Recreation | 0 (0.0%) | 7 (100.0%) |
| Accommodation & Food Services | 9 (11.1%) | 72 (88.9%) |
| Public Administration | 8 (21.0%) | 30 (78.9%) |
| Total | 1,020 (50.7%) | 990 (49.2%) |
Education in Cresco
School Enrollment in Cresco
The most common levels of schooling among the 784 students in Cresco are middle school (220 | 28.1%), high school (186 | 23.7%), and elementary school (152 | 19.4%).
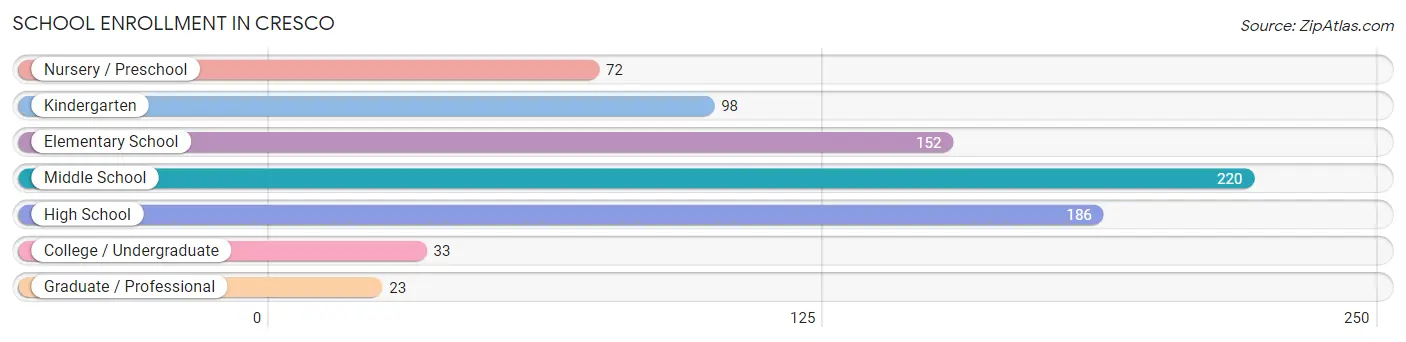
| School Level | # Students | % Students |
| Nursery / Preschool | 72 | 9.2% |
| Kindergarten | 98 | 12.5% |
| Elementary School | 152 | 19.4% |
| Middle School | 220 | 28.1% |
| High School | 186 | 23.7% |
| College / Undergraduate | 33 | 4.2% |
| Graduate / Professional | 23 | 2.9% |
| Total | 784 | 100.0% |
School Enrollment by Age by Funding Source in Cresco
Out of a total of 784 students who are enrolled in schools in Cresco, 141 (18.0%) attend a private institution, while the remaining 643 (82.0%) are enrolled in public schools. The age group of 3 to 4 year olds has the highest likelihood of being enrolled in private schools, with 29 (70.7% in the age bracket) enrolled. Conversely, the age group of 15 to 17 year olds has the lowest likelihood of being enrolled in a private school, with 162 (100.0% in the age bracket) attending a public institution.
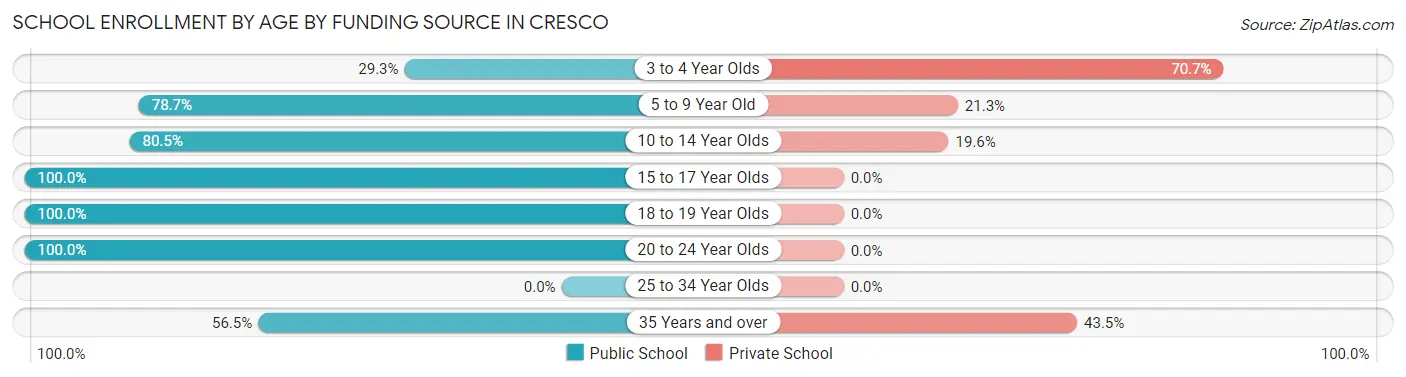
| Age Bracket | Public School | Private School |
| 3 to 4 Year Olds | 12 (29.3%) | 29 (70.7%) |
| 5 to 9 Year Old | 185 (78.7%) | 50 (21.3%) |
| 10 to 14 Year Olds | 214 (80.4%) | 52 (19.6%) |
| 15 to 17 Year Olds | 162 (100.0%) | 0 (0.0%) |
| 18 to 19 Year Olds | 24 (100.0%) | 0 (0.0%) |
| 20 to 24 Year Olds | 33 (100.0%) | 0 (0.0%) |
| 25 to 34 Year Olds | 0 (0.0%) | 0 (0.0%) |
| 35 Years and over | 13 (56.5%) | 10 (43.5%) |
| Total | 643 (82.0%) | 141 (18.0%) |
Educational Attainment by Field of Study in Cresco
Education (176 | 29.6%), business (175 | 29.5%), science & technology (59 | 9.9%), psychology (38 | 6.4%), and physical & health sciences (30 | 5.1%) are the most common fields of study among 594 individuals in Cresco who have obtained a bachelor's degree or higher.
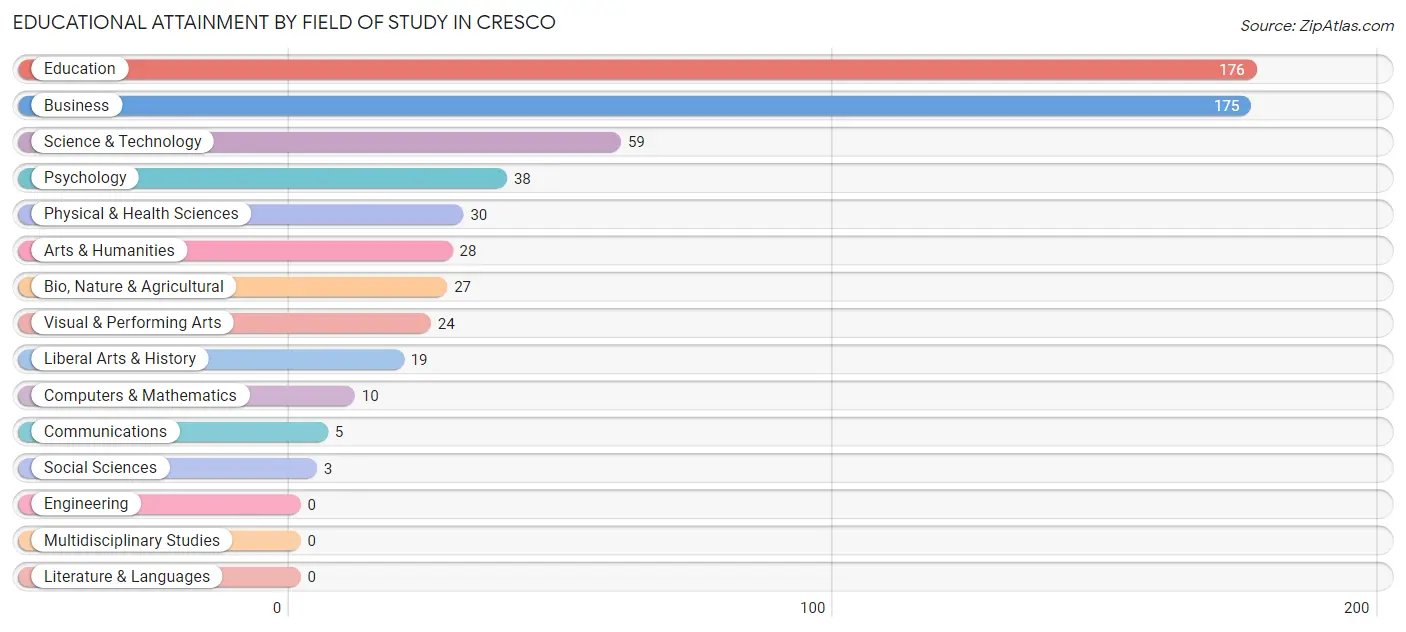
| Field of Study | # Graduates | % Graduates |
| Computers & Mathematics | 10 | 1.7% |
| Bio, Nature & Agricultural | 27 | 4.5% |
| Physical & Health Sciences | 30 | 5.1% |
| Psychology | 38 | 6.4% |
| Social Sciences | 3 | 0.5% |
| Engineering | 0 | 0.0% |
| Multidisciplinary Studies | 0 | 0.0% |
| Science & Technology | 59 | 9.9% |
| Business | 175 | 29.5% |
| Education | 176 | 29.6% |
| Literature & Languages | 0 | 0.0% |
| Liberal Arts & History | 19 | 3.2% |
| Visual & Performing Arts | 24 | 4.0% |
| Communications | 5 | 0.8% |
| Arts & Humanities | 28 | 4.7% |
| Total | 594 | 100.0% |
Transportation & Commute in Cresco
Vehicle Availability by Sex in Cresco
The most prevalent vehicle ownership categories in Cresco are males with 2 vehicles (451, accounting for 45.1%) and females with 2 vehicles (475, making up 46.4%).
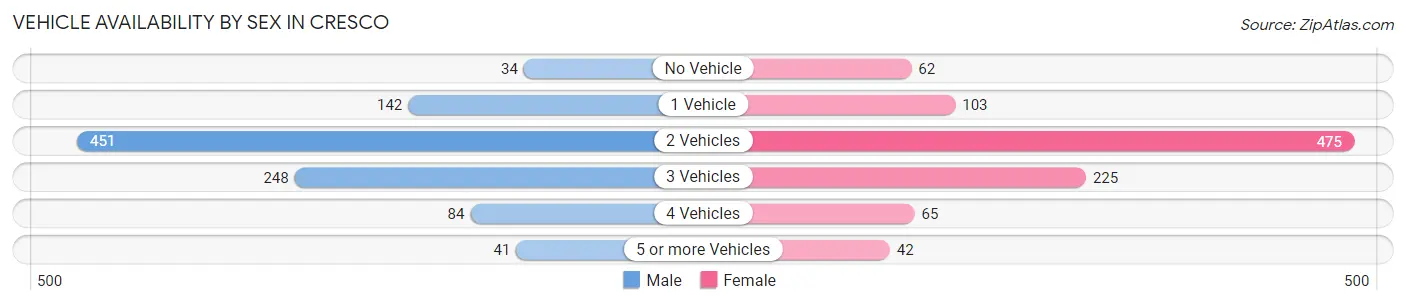
| Vehicles Available | Male | Female |
| No Vehicle | 34 (3.4%) | 62 (6.4%) |
| 1 Vehicle | 142 (14.2%) | 103 (10.6%) |
| 2 Vehicles | 451 (45.1%) | 475 (48.9%) |
| 3 Vehicles | 248 (24.8%) | 225 (23.2%) |
| 4 Vehicles | 84 (8.4%) | 65 (6.7%) |
| 5 or more Vehicles | 41 (4.1%) | 42 (4.3%) |
| Total | 1,000 (100.0%) | 972 (100.0%) |
Commute Time in Cresco
The most frequently occuring commute durations in Cresco are 5 to 9 minutes (601 commuters, 32.2%), less than 5 minutes (341 commuters, 18.2%), and 10 to 14 minutes (302 commuters, 16.2%).
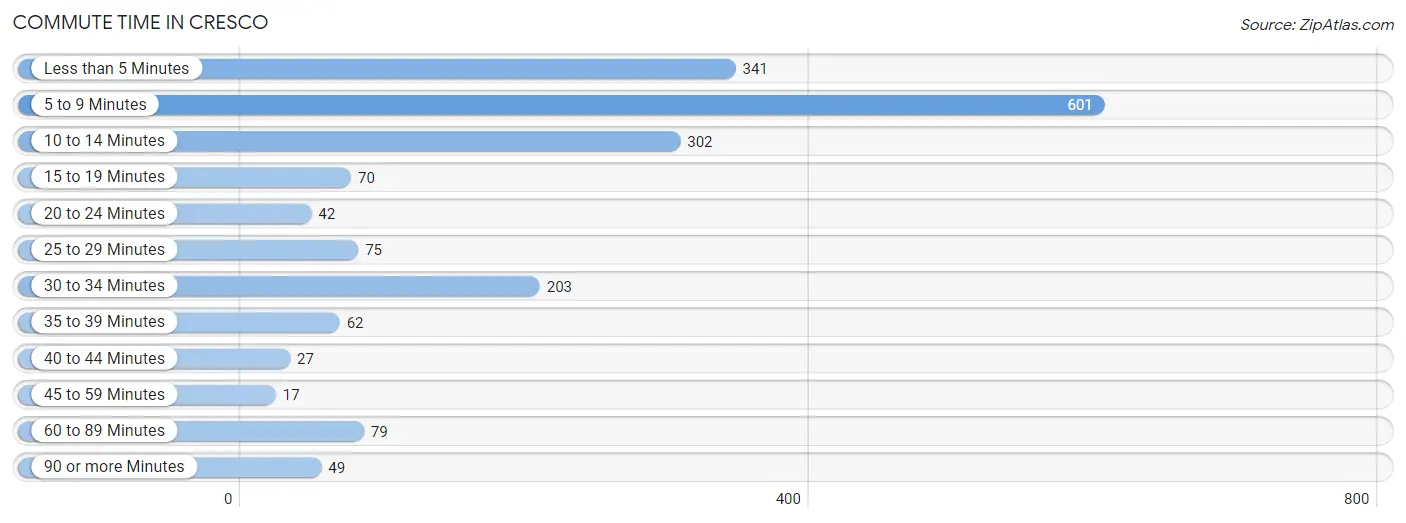
| Commute Time | # Commuters | % Commuters |
| Less than 5 Minutes | 341 | 18.2% |
| 5 to 9 Minutes | 601 | 32.2% |
| 10 to 14 Minutes | 302 | 16.2% |
| 15 to 19 Minutes | 70 | 3.7% |
| 20 to 24 Minutes | 42 | 2.2% |
| 25 to 29 Minutes | 75 | 4.0% |
| 30 to 34 Minutes | 203 | 10.9% |
| 35 to 39 Minutes | 62 | 3.3% |
| 40 to 44 Minutes | 27 | 1.5% |
| 45 to 59 Minutes | 17 | 0.9% |
| 60 to 89 Minutes | 79 | 4.2% |
| 90 or more Minutes | 49 | 2.6% |
Commute Time by Sex in Cresco
The most common commute times in Cresco are 5 to 9 minutes (319 commuters, 33.3%) for males and 5 to 9 minutes (282 commuters, 30.9%) for females.
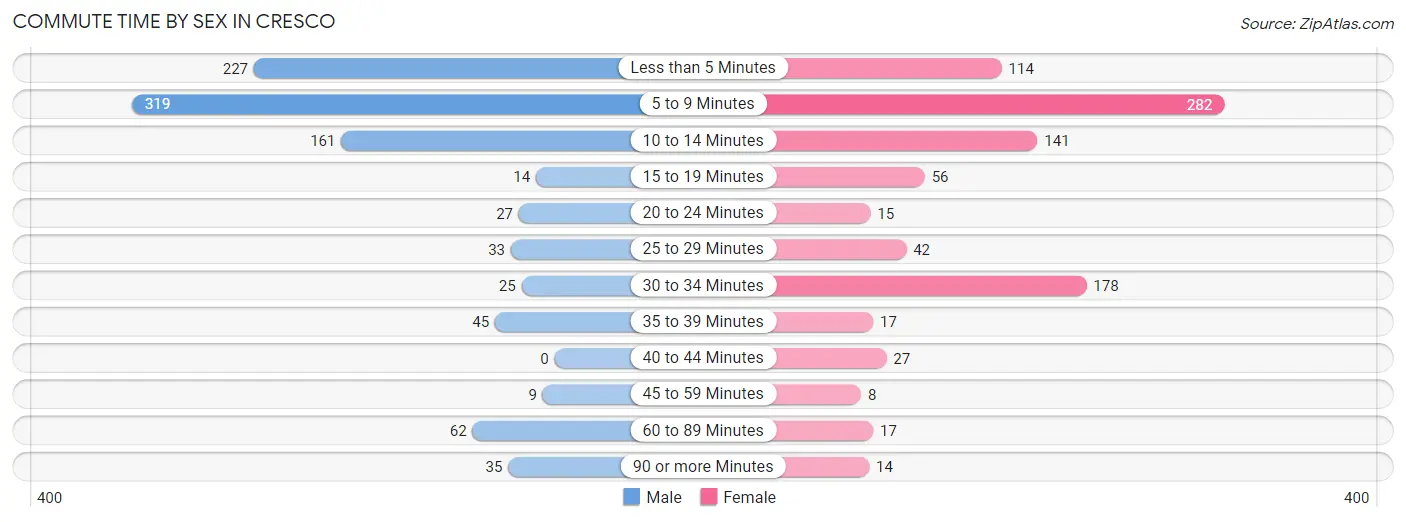
| Commute Time | Male | Female |
| Less than 5 Minutes | 227 (23.7%) | 114 (12.5%) |
| 5 to 9 Minutes | 319 (33.3%) | 282 (30.9%) |
| 10 to 14 Minutes | 161 (16.8%) | 141 (15.5%) |
| 15 to 19 Minutes | 14 (1.5%) | 56 (6.1%) |
| 20 to 24 Minutes | 27 (2.8%) | 15 (1.7%) |
| 25 to 29 Minutes | 33 (3.5%) | 42 (4.6%) |
| 30 to 34 Minutes | 25 (2.6%) | 178 (19.5%) |
| 35 to 39 Minutes | 45 (4.7%) | 17 (1.9%) |
| 40 to 44 Minutes | 0 (0.0%) | 27 (3.0%) |
| 45 to 59 Minutes | 9 (0.9%) | 8 (0.9%) |
| 60 to 89 Minutes | 62 (6.5%) | 17 (1.9%) |
| 90 or more Minutes | 35 (3.7%) | 14 (1.5%) |
Time of Departure to Work by Sex in Cresco
The most frequent times of departure to work in Cresco are 5:30 AM to 5:59 AM (242, 25.3%) for males and 7:30 AM to 7:59 AM (267, 29.3%) for females.
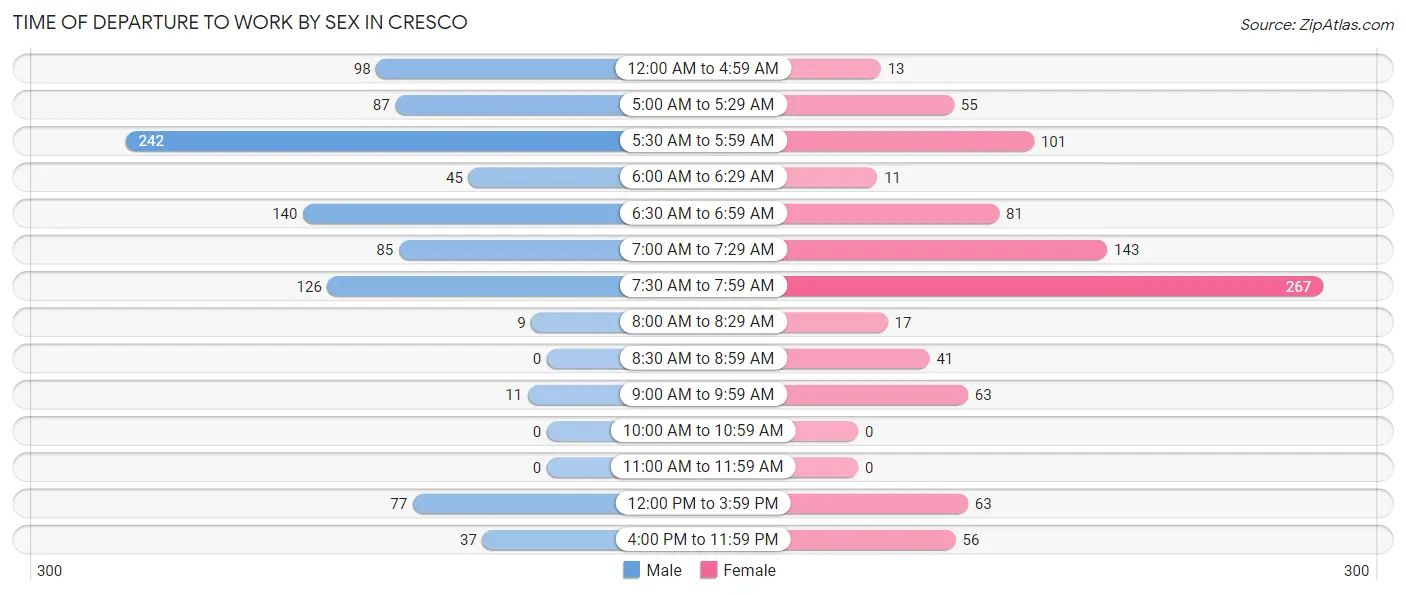
| Time of Departure | Male | Female |
| 12:00 AM to 4:59 AM | 98 (10.2%) | 13 (1.4%) |
| 5:00 AM to 5:29 AM | 87 (9.1%) | 55 (6.0%) |
| 5:30 AM to 5:59 AM | 242 (25.3%) | 101 (11.1%) |
| 6:00 AM to 6:29 AM | 45 (4.7%) | 11 (1.2%) |
| 6:30 AM to 6:59 AM | 140 (14.6%) | 81 (8.9%) |
| 7:00 AM to 7:29 AM | 85 (8.9%) | 143 (15.7%) |
| 7:30 AM to 7:59 AM | 126 (13.2%) | 267 (29.3%) |
| 8:00 AM to 8:29 AM | 9 (0.9%) | 17 (1.9%) |
| 8:30 AM to 8:59 AM | 0 (0.0%) | 41 (4.5%) |
| 9:00 AM to 9:59 AM | 11 (1.1%) | 63 (6.9%) |
| 10:00 AM to 10:59 AM | 0 (0.0%) | 0 (0.0%) |
| 11:00 AM to 11:59 AM | 0 (0.0%) | 0 (0.0%) |
| 12:00 PM to 3:59 PM | 77 (8.1%) | 63 (6.9%) |
| 4:00 PM to 11:59 PM | 37 (3.9%) | 56 (6.1%) |
| Total | 957 (100.0%) | 911 (100.0%) |
Housing Occupancy in Cresco
Occupancy by Ownership in Cresco
Of the total 1,495 dwellings in Cresco, owner-occupied units account for 1,012 (67.7%), while renter-occupied units make up 483 (32.3%).
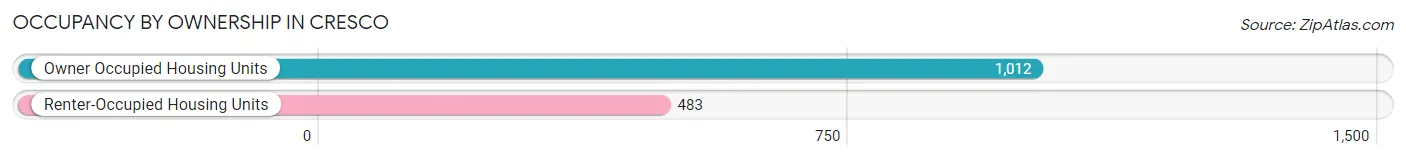
| Occupancy | # Housing Units | % Housing Units |
| Owner Occupied Housing Units | 1,012 | 67.7% |
| Renter-Occupied Housing Units | 483 | 32.3% |
| Total Occupied Housing Units | 1,495 | 100.0% |
Occupancy by Household Size in Cresco
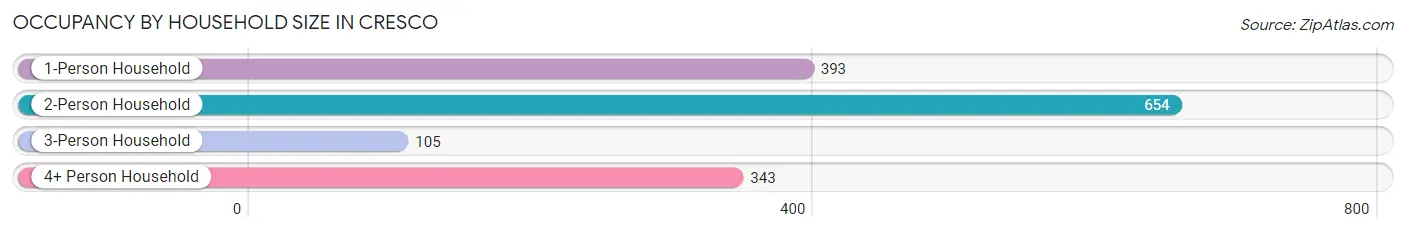
| Household Size | # Housing Units | % Housing Units |
| 1-Person Household | 393 | 26.3% |
| 2-Person Household | 654 | 43.8% |
| 3-Person Household | 105 | 7.0% |
| 4+ Person Household | 343 | 22.9% |
| Total Housing Units | 1,495 | 100.0% |
Occupancy by Ownership by Household Size in Cresco
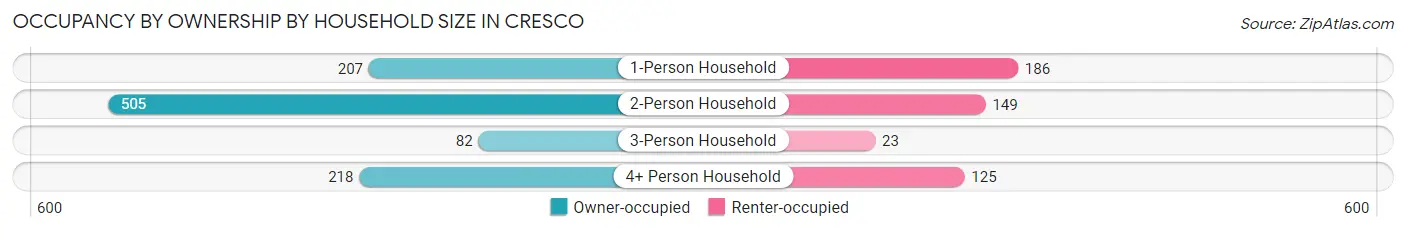
| Household Size | Owner-occupied | Renter-occupied |
| 1-Person Household | 207 (52.7%) | 186 (47.3%) |
| 2-Person Household | 505 (77.2%) | 149 (22.8%) |
| 3-Person Household | 82 (78.1%) | 23 (21.9%) |
| 4+ Person Household | 218 (63.6%) | 125 (36.4%) |
| Total Housing Units | 1,012 (67.7%) | 483 (32.3%) |
Occupancy by Educational Attainment in Cresco
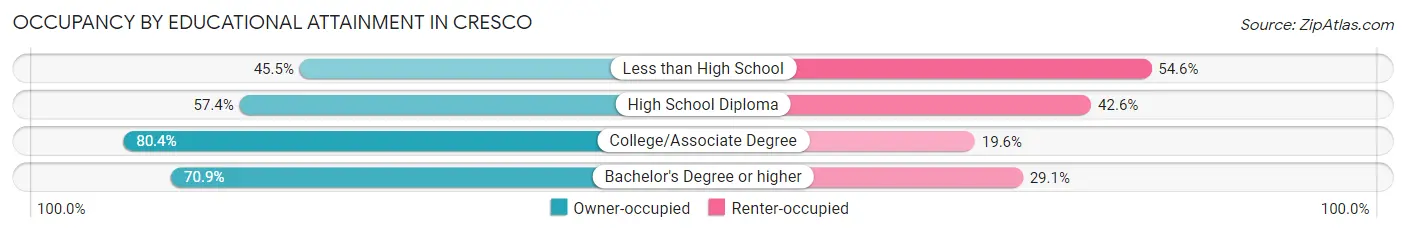
| Household Size | Owner-occupied | Renter-occupied |
| Less than High School | 35 (45.5%) | 42 (54.5%) |
| High School Diploma | 311 (57.4%) | 231 (42.6%) |
| College/Associate Degree | 378 (80.4%) | 92 (19.6%) |
| Bachelor's Degree or higher | 288 (70.9%) | 118 (29.1%) |
Occupancy by Age of Householder in Cresco
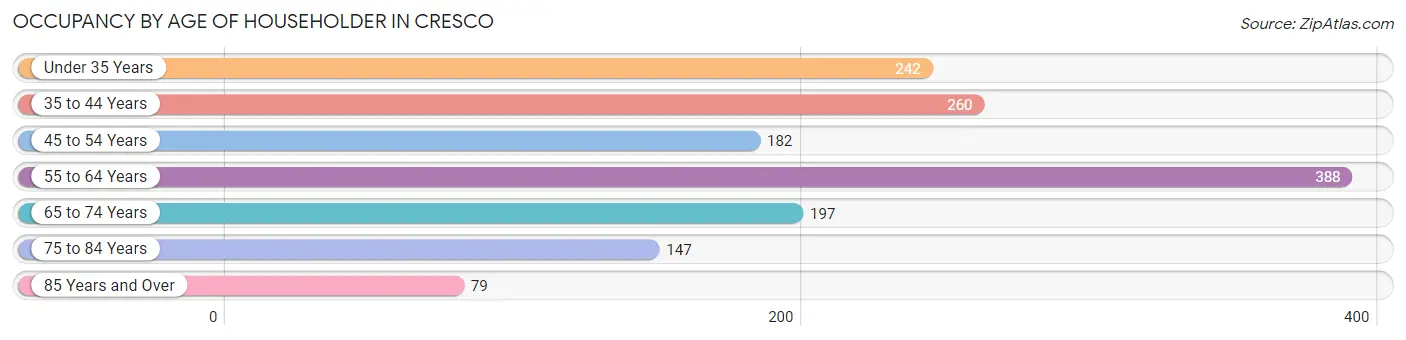
| Age Bracket | # Households | % Households |
| Under 35 Years | 242 | 16.2% |
| 35 to 44 Years | 260 | 17.4% |
| 45 to 54 Years | 182 | 12.2% |
| 55 to 64 Years | 388 | 26.0% |
| 65 to 74 Years | 197 | 13.2% |
| 75 to 84 Years | 147 | 9.8% |
| 85 Years and Over | 79 | 5.3% |
| Total | 1,495 | 100.0% |
Housing Finances in Cresco
Median Income by Occupancy in Cresco
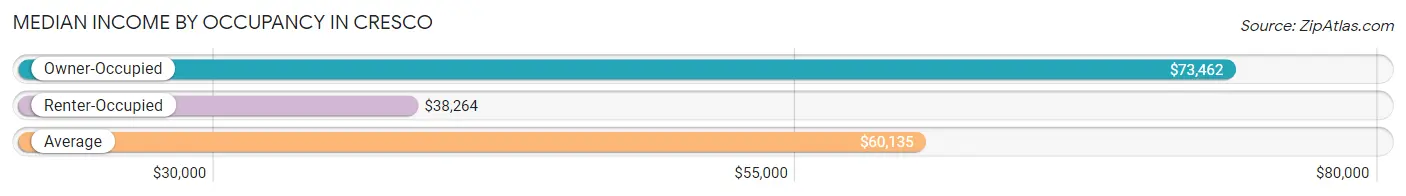
| Occupancy Type | # Households | Median Income |
| Owner-Occupied | 1,012 (67.7%) | $73,462 |
| Renter-Occupied | 483 (32.3%) | $38,264 |
| Average | 1,495 (100.0%) | $60,135 |
Occupancy by Householder Income Bracket in Cresco
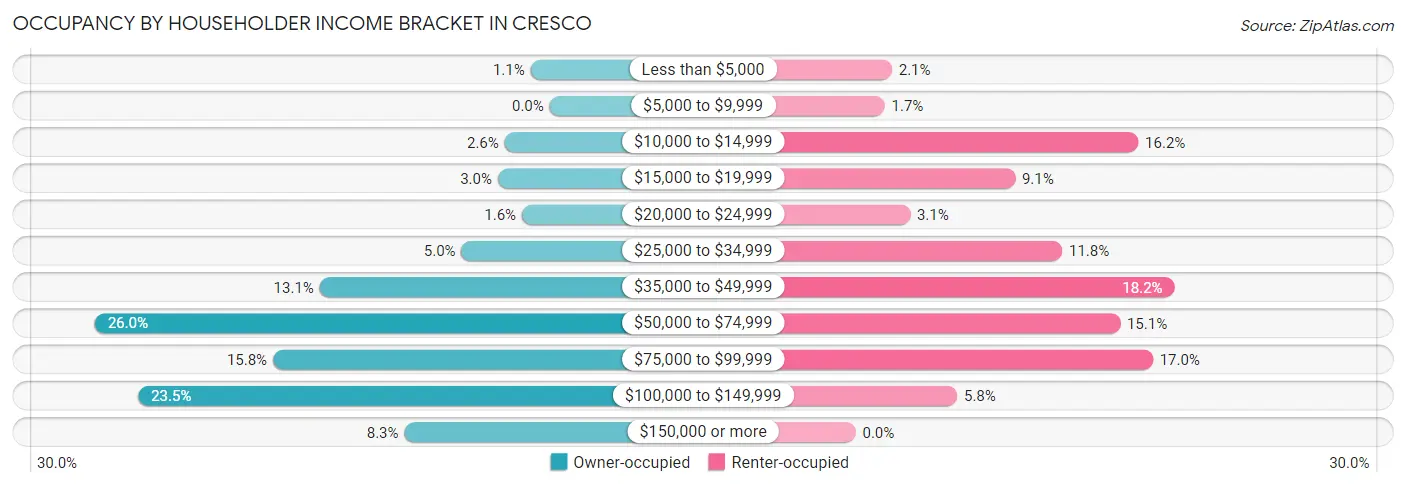
| Income Bracket | Owner-occupied | Renter-occupied |
| Less than $5,000 | 11 (1.1%) | 10 (2.1%) |
| $5,000 to $9,999 | 0 (0.0%) | 8 (1.7%) |
| $10,000 to $14,999 | 26 (2.6%) | 78 (16.2%) |
| $15,000 to $19,999 | 30 (3.0%) | 44 (9.1%) |
| $20,000 to $24,999 | 16 (1.6%) | 15 (3.1%) |
| $25,000 to $34,999 | 51 (5.0%) | 57 (11.8%) |
| $35,000 to $49,999 | 133 (13.1%) | 88 (18.2%) |
| $50,000 to $74,999 | 263 (26.0%) | 73 (15.1%) |
| $75,000 to $99,999 | 160 (15.8%) | 82 (17.0%) |
| $100,000 to $149,999 | 238 (23.5%) | 28 (5.8%) |
| $150,000 or more | 84 (8.3%) | 0 (0.0%) |
| Total | 1,012 (100.0%) | 483 (100.0%) |
Monthly Housing Cost Tiers in Cresco
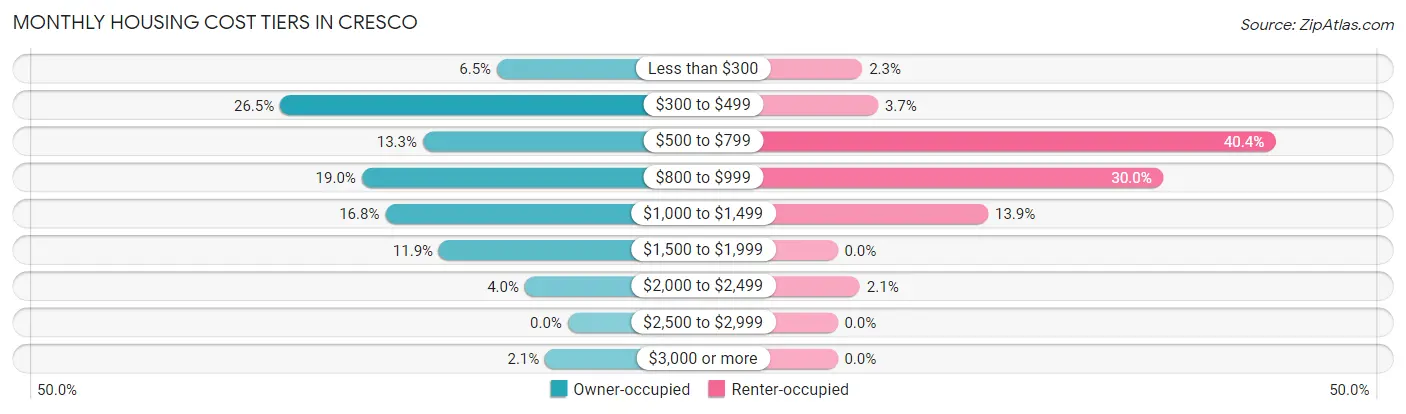
| Monthly Cost | Owner-occupied | Renter-occupied |
| Less than $300 | 66 (6.5%) | 11 (2.3%) |
| $300 to $499 | 268 (26.5%) | 18 (3.7%) |
| $500 to $799 | 135 (13.3%) | 195 (40.4%) |
| $800 to $999 | 192 (19.0%) | 145 (30.0%) |
| $1,000 to $1,499 | 170 (16.8%) | 67 (13.9%) |
| $1,500 to $1,999 | 120 (11.9%) | 0 (0.0%) |
| $2,000 to $2,499 | 40 (4.0%) | 10 (2.1%) |
| $2,500 to $2,999 | 0 (0.0%) | 0 (0.0%) |
| $3,000 or more | 21 (2.1%) | 0 (0.0%) |
| Total | 1,012 (100.0%) | 483 (100.0%) |
Physical Housing Characteristics in Cresco
Housing Structures in Cresco
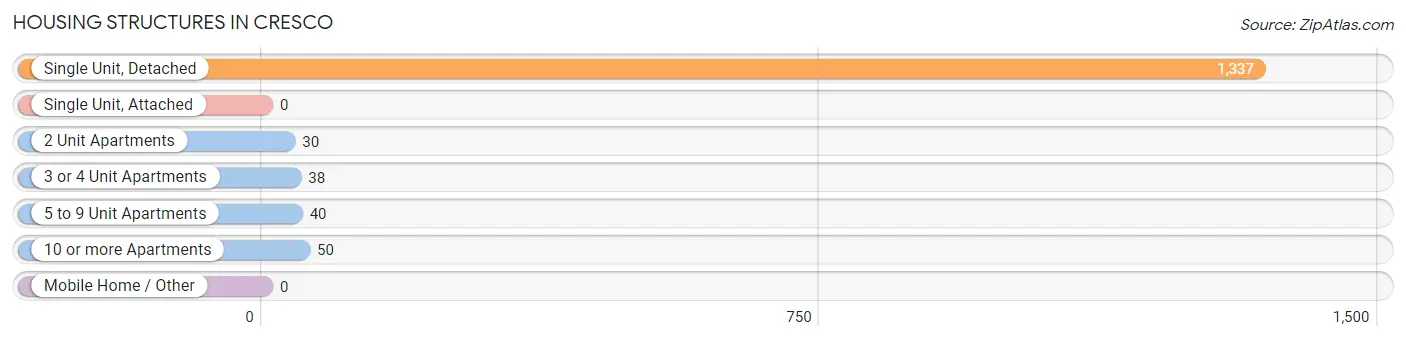
| Structure Type | # Housing Units | % Housing Units |
| Single Unit, Detached | 1,337 | 89.4% |
| Single Unit, Attached | 0 | 0.0% |
| 2 Unit Apartments | 30 | 2.0% |
| 3 or 4 Unit Apartments | 38 | 2.5% |
| 5 to 9 Unit Apartments | 40 | 2.7% |
| 10 or more Apartments | 50 | 3.3% |
| Mobile Home / Other | 0 | 0.0% |
| Total | 1,495 | 100.0% |
Housing Structures by Occupancy in Cresco
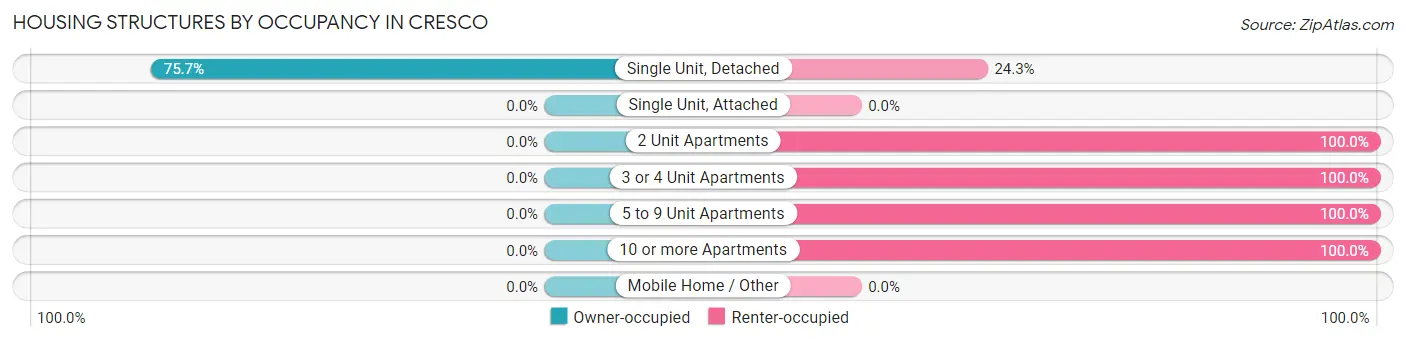
| Structure Type | Owner-occupied | Renter-occupied |
| Single Unit, Detached | 1,012 (75.7%) | 325 (24.3%) |
| Single Unit, Attached | 0 (0.0%) | 0 (0.0%) |
| 2 Unit Apartments | 0 (0.0%) | 30 (100.0%) |
| 3 or 4 Unit Apartments | 0 (0.0%) | 38 (100.0%) |
| 5 to 9 Unit Apartments | 0 (0.0%) | 40 (100.0%) |
| 10 or more Apartments | 0 (0.0%) | 50 (100.0%) |
| Mobile Home / Other | 0 (0.0%) | 0 (0.0%) |
| Total | 1,012 (67.7%) | 483 (32.3%) |
Housing Structures by Number of Rooms in Cresco
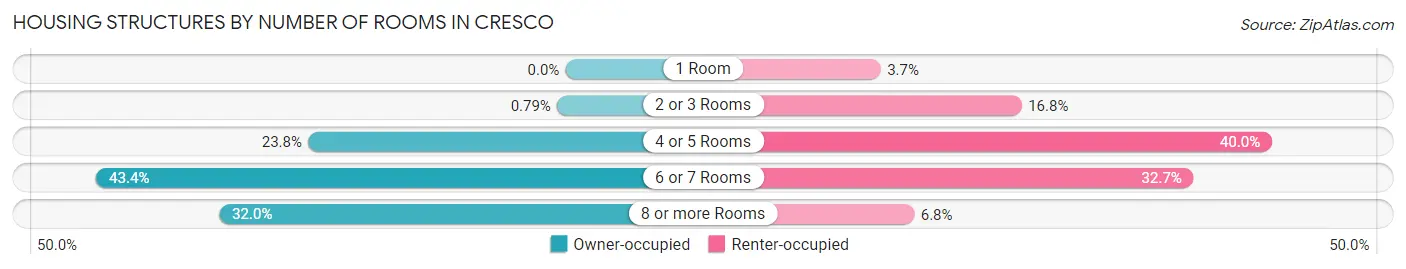
| Number of Rooms | Owner-occupied | Renter-occupied |
| 1 Room | 0 (0.0%) | 18 (3.7%) |
| 2 or 3 Rooms | 8 (0.8%) | 81 (16.8%) |
| 4 or 5 Rooms | 241 (23.8%) | 193 (40.0%) |
| 6 or 7 Rooms | 439 (43.4%) | 158 (32.7%) |
| 8 or more Rooms | 324 (32.0%) | 33 (6.8%) |
| Total | 1,012 (100.0%) | 483 (100.0%) |
Housing Structure by Heating Type in Cresco
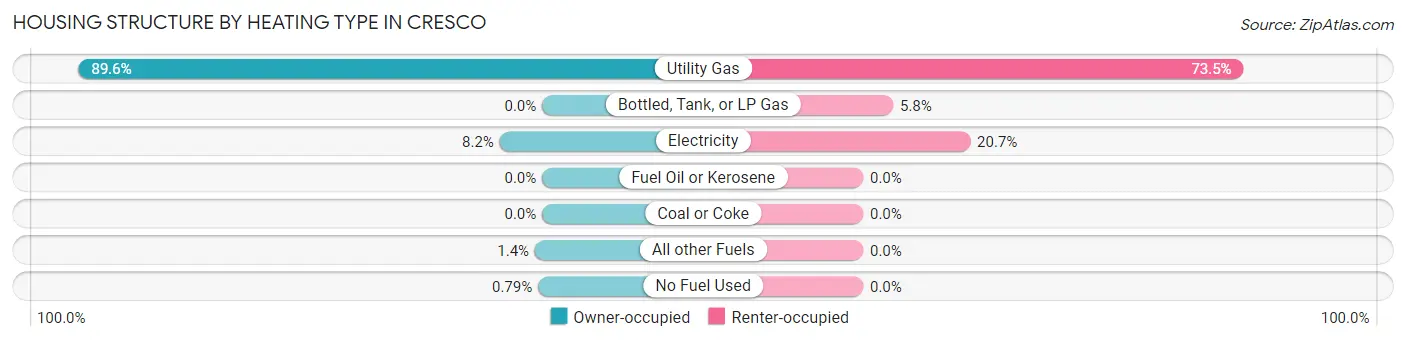
| Heating Type | Owner-occupied | Renter-occupied |
| Utility Gas | 907 (89.6%) | 355 (73.5%) |
| Bottled, Tank, or LP Gas | 0 (0.0%) | 28 (5.8%) |
| Electricity | 83 (8.2%) | 100 (20.7%) |
| Fuel Oil or Kerosene | 0 (0.0%) | 0 (0.0%) |
| Coal or Coke | 0 (0.0%) | 0 (0.0%) |
| All other Fuels | 14 (1.4%) | 0 (0.0%) |
| No Fuel Used | 8 (0.8%) | 0 (0.0%) |
| Total | 1,012 (100.0%) | 483 (100.0%) |
Household Vehicle Usage in Cresco
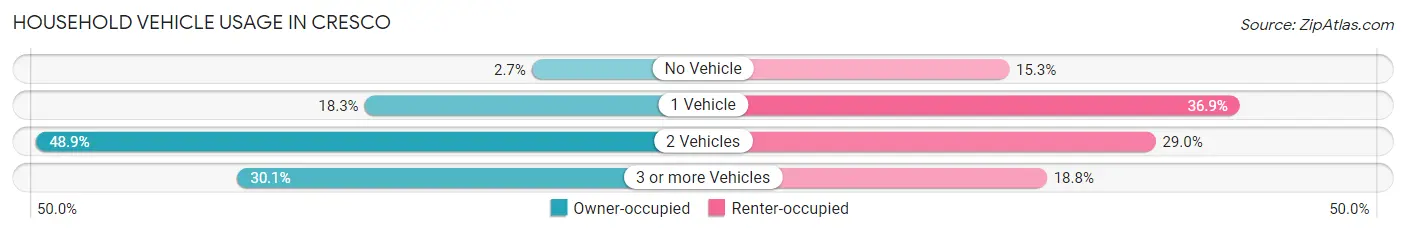
| Vehicles per Household | Owner-occupied | Renter-occupied |
| No Vehicle | 27 (2.7%) | 74 (15.3%) |
| 1 Vehicle | 185 (18.3%) | 178 (36.8%) |
| 2 Vehicles | 495 (48.9%) | 140 (29.0%) |
| 3 or more Vehicles | 305 (30.1%) | 91 (18.8%) |
| Total | 1,012 (100.0%) | 483 (100.0%) |
Real Estate & Mortgages in Cresco
Real Estate and Mortgage Overview in Cresco
| Characteristic | Without Mortgage | With Mortgage |
| Housing Units | 405 | 607 |
| Median Property Value | $79,900 | $113,400 |
| Median Household Income | $54,896 | $55 |
| Monthly Housing Costs | $436 | $10 |
| Real Estate Taxes | $1,912 | $8 |
Property Value by Mortgage Status in Cresco
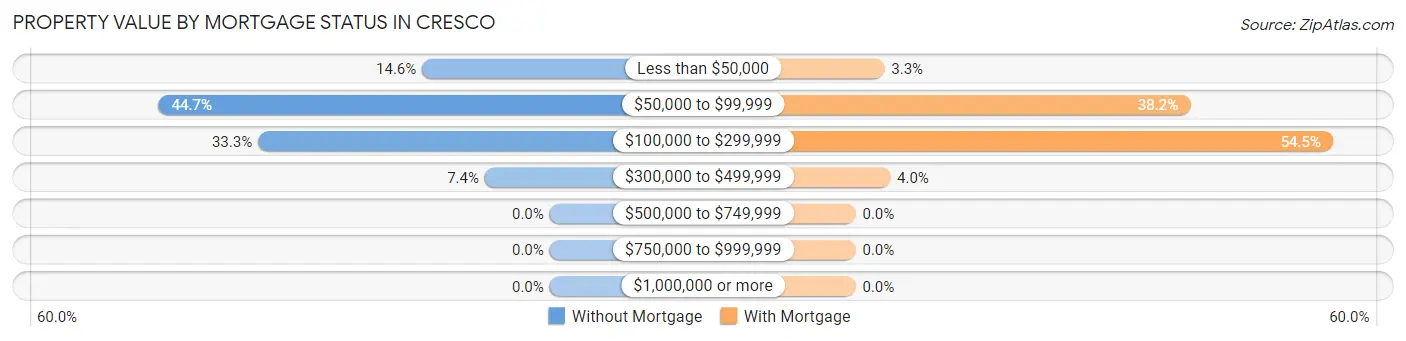
| Property Value | Without Mortgage | With Mortgage |
| Less than $50,000 | 59 (14.6%) | 20 (3.3%) |
| $50,000 to $99,999 | 181 (44.7%) | 232 (38.2%) |
| $100,000 to $299,999 | 135 (33.3%) | 331 (54.5%) |
| $300,000 to $499,999 | 30 (7.4%) | 24 (4.0%) |
| $500,000 to $749,999 | 0 (0.0%) | 0 (0.0%) |
| $750,000 to $999,999 | 0 (0.0%) | 0 (0.0%) |
| $1,000,000 or more | 0 (0.0%) | 0 (0.0%) |
| Total | 405 (100.0%) | 607 (100.0%) |
Household Income by Mortgage Status in Cresco
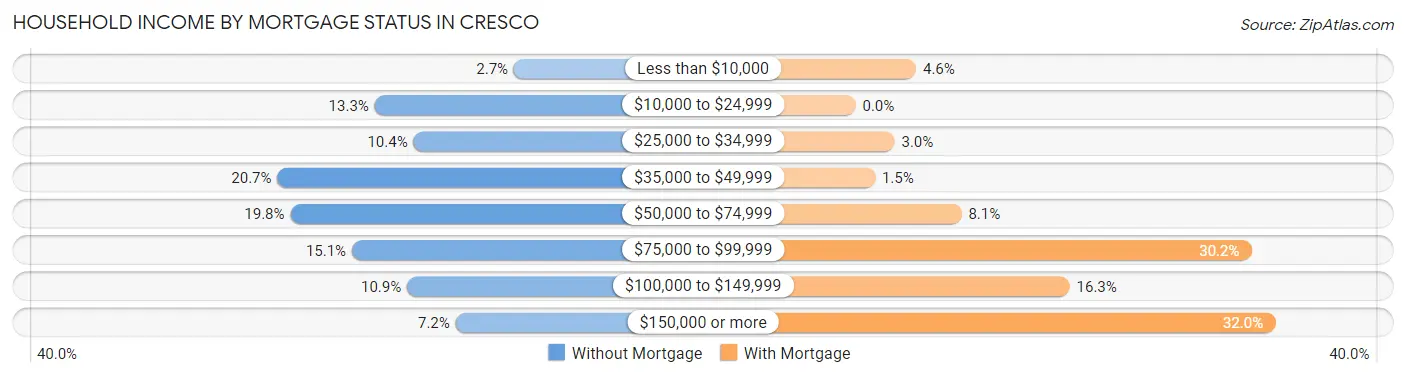
| Household Income | Without Mortgage | With Mortgage |
| Less than $10,000 | 11 (2.7%) | 28 (4.6%) |
| $10,000 to $24,999 | 54 (13.3%) | 0 (0.0%) |
| $25,000 to $34,999 | 42 (10.4%) | 18 (3.0%) |
| $35,000 to $49,999 | 84 (20.7%) | 9 (1.5%) |
| $50,000 to $74,999 | 80 (19.8%) | 49 (8.1%) |
| $75,000 to $99,999 | 61 (15.1%) | 183 (30.1%) |
| $100,000 to $149,999 | 44 (10.9%) | 99 (16.3%) |
| $150,000 or more | 29 (7.2%) | 194 (32.0%) |
| Total | 405 (100.0%) | 607 (100.0%) |
Property Value to Household Income Ratio in Cresco
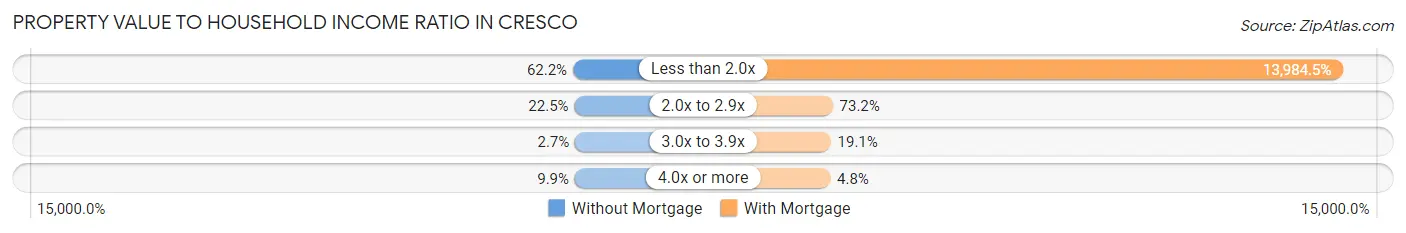
| Value-to-Income Ratio | Without Mortgage | With Mortgage |
| Less than 2.0x | 252 (62.2%) | 84,886 (13,984.5%) |
| 2.0x to 2.9x | 91 (22.5%) | 444 (73.2%) |
| 3.0x to 3.9x | 11 (2.7%) | 116 (19.1%) |
| 4.0x or more | 40 (9.9%) | 29 (4.8%) |
| Total | 405 (100.0%) | 607 (100.0%) |
Real Estate Taxes by Mortgage Status in Cresco
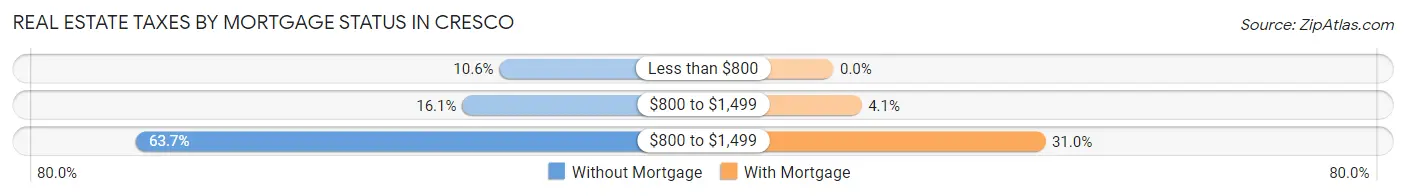
| Property Taxes | Without Mortgage | With Mortgage |
| Less than $800 | 43 (10.6%) | 0 (0.0%) |
| $800 to $1,499 | 65 (16.1%) | 25 (4.1%) |
| $800 to $1,499 | 258 (63.7%) | 188 (31.0%) |
| Total | 405 (100.0%) | 607 (100.0%) |
Health & Disability in Cresco
Health Insurance Coverage by Age in Cresco
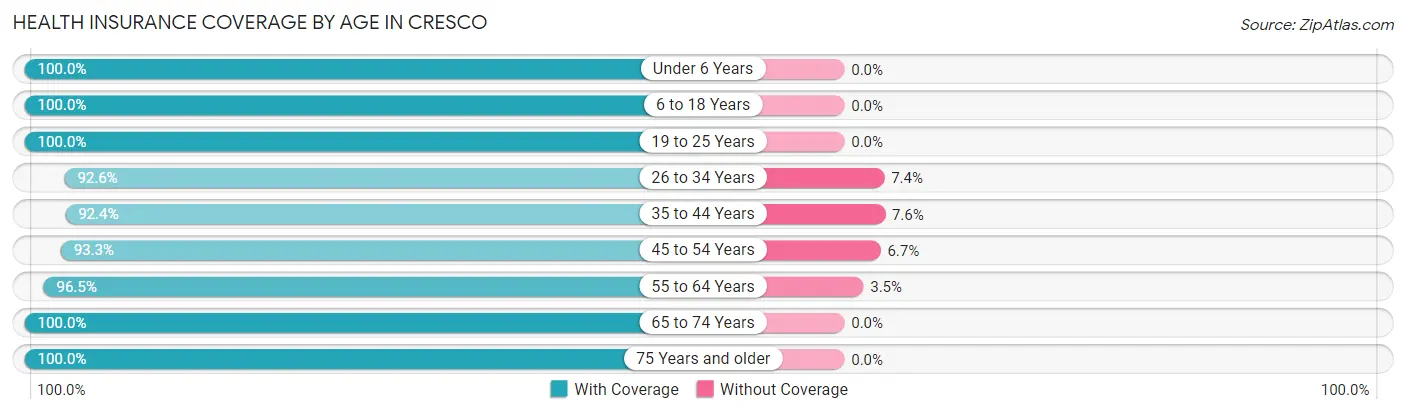
| Age Bracket | With Coverage | Without Coverage |
| Under 6 Years | 306 (100.0%) | 0 (0.0%) |
| 6 to 18 Years | 638 (100.0%) | 0 (0.0%) |
| 19 to 25 Years | 273 (100.0%) | 0 (0.0%) |
| 26 to 34 Years | 373 (92.6%) | 30 (7.4%) |
| 35 to 44 Years | 451 (92.4%) | 37 (7.6%) |
| 45 to 54 Years | 332 (93.3%) | 24 (6.7%) |
| 55 to 64 Years | 599 (96.5%) | 22 (3.5%) |
| 65 to 74 Years | 393 (100.0%) | 0 (0.0%) |
| 75 Years and older | 314 (100.0%) | 0 (0.0%) |
| Total | 3,679 (97.0%) | 113 (3.0%) |
Health Insurance Coverage by Citizenship Status in Cresco
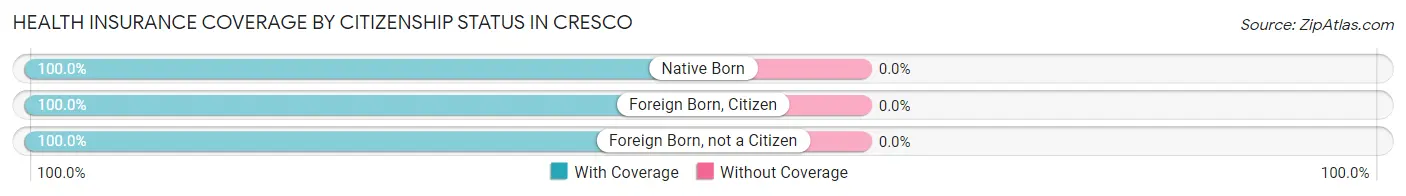
| Citizenship Status | With Coverage | Without Coverage |
| Native Born | 306 (100.0%) | 0 (0.0%) |
| Foreign Born, Citizen | 638 (100.0%) | 0 (0.0%) |
| Foreign Born, not a Citizen | 273 (100.0%) | 0 (0.0%) |
Health Insurance Coverage by Household Income in Cresco
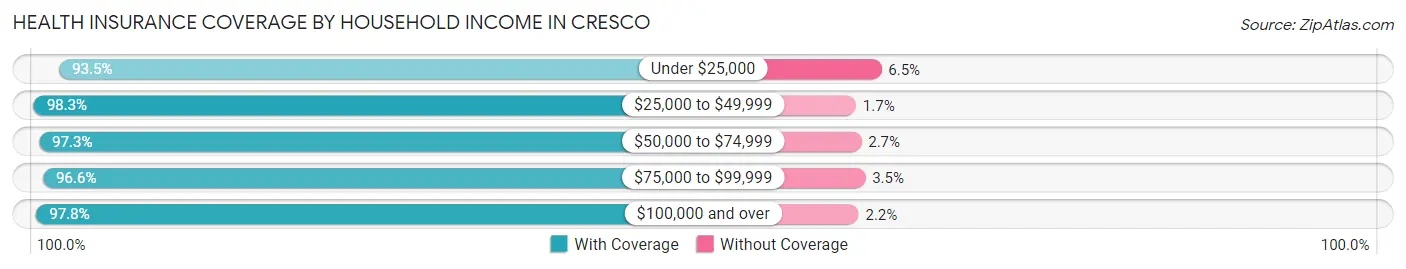
| Household Income | With Coverage | Without Coverage |
| Under $25,000 | 433 (93.5%) | 30 (6.5%) |
| $25,000 to $49,999 | 459 (98.3%) | 8 (1.7%) |
| $50,000 to $74,999 | 791 (97.3%) | 22 (2.7%) |
| $75,000 to $99,999 | 672 (96.6%) | 24 (3.5%) |
| $100,000 and over | 1,288 (97.8%) | 29 (2.2%) |
Public vs Private Health Insurance Coverage by Age in Cresco
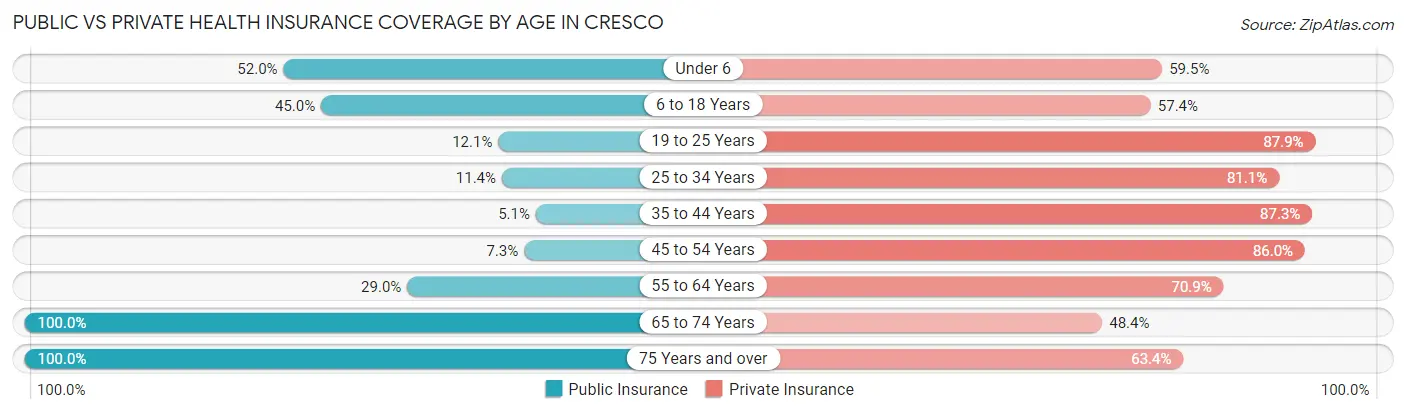
| Age Bracket | Public Insurance | Private Insurance |
| Under 6 | 159 (52.0%) | 182 (59.5%) |
| 6 to 18 Years | 287 (45.0%) | 366 (57.4%) |
| 19 to 25 Years | 33 (12.1%) | 240 (87.9%) |
| 25 to 34 Years | 46 (11.4%) | 327 (81.1%) |
| 35 to 44 Years | 25 (5.1%) | 426 (87.3%) |
| 45 to 54 Years | 26 (7.3%) | 306 (86.0%) |
| 55 to 64 Years | 180 (29.0%) | 440 (70.9%) |
| 65 to 74 Years | 393 (100.0%) | 190 (48.3%) |
| 75 Years and over | 314 (100.0%) | 199 (63.4%) |
| Total | 1,463 (38.6%) | 2,676 (70.6%) |
Disability Status by Sex by Age in Cresco
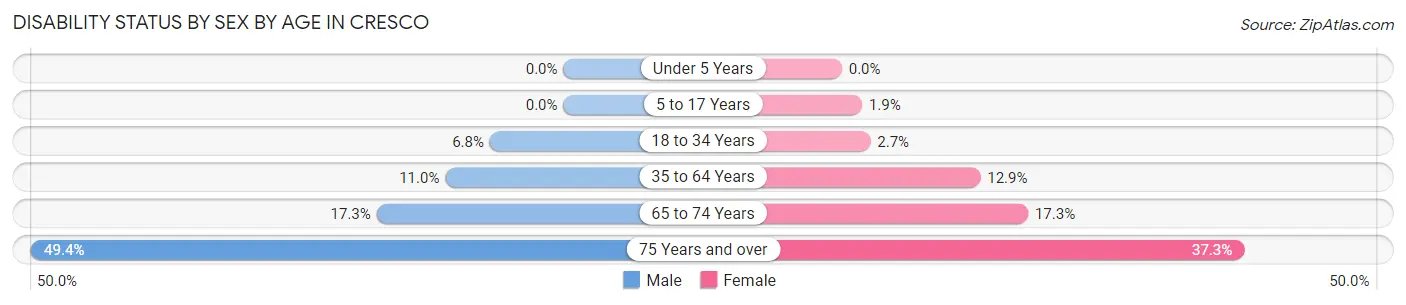
| Age Bracket | Male | Female |
| Under 5 Years | 0 (0.0%) | 0 (0.0%) |
| 5 to 17 Years | 0 (0.0%) | 7 (1.9%) |
| 18 to 34 Years | 22 (6.8%) | 10 (2.6%) |
| 35 to 64 Years | 83 (11.0%) | 91 (12.9%) |
| 65 to 74 Years | 35 (17.3%) | 33 (17.3%) |
| 75 Years and over | 81 (49.4%) | 56 (37.3%) |
Disability Class by Sex by Age in Cresco
Disability Class: Hearing Difficulty
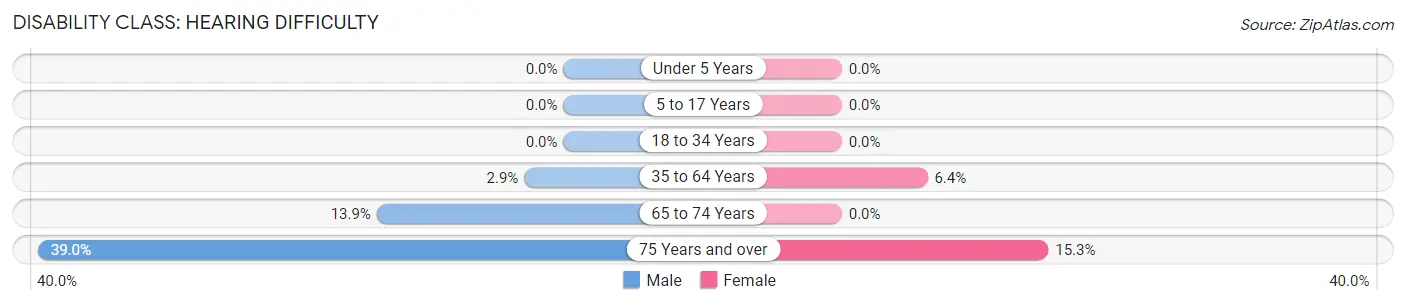
| Age Bracket | Male | Female |
| Under 5 Years | 0 (0.0%) | 0 (0.0%) |
| 5 to 17 Years | 0 (0.0%) | 0 (0.0%) |
| 18 to 34 Years | 0 (0.0%) | 0 (0.0%) |
| 35 to 64 Years | 22 (2.9%) | 45 (6.4%) |
| 65 to 74 Years | 28 (13.9%) | 0 (0.0%) |
| 75 Years and over | 64 (39.0%) | 23 (15.3%) |
Disability Class: Vision Difficulty
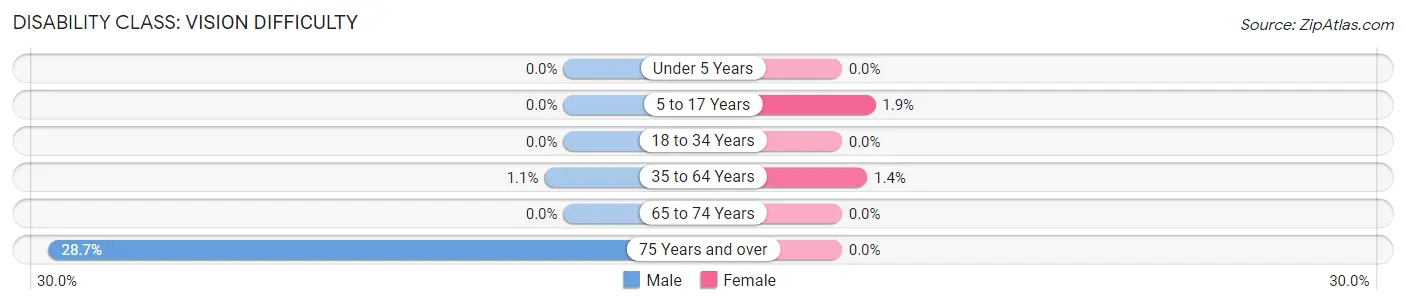
| Age Bracket | Male | Female |
| Under 5 Years | 0 (0.0%) | 0 (0.0%) |
| 5 to 17 Years | 0 (0.0%) | 7 (1.9%) |
| 18 to 34 Years | 0 (0.0%) | 0 (0.0%) |
| 35 to 64 Years | 8 (1.1%) | 10 (1.4%) |
| 65 to 74 Years | 0 (0.0%) | 0 (0.0%) |
| 75 Years and over | 47 (28.7%) | 0 (0.0%) |
Disability Class: Cognitive Difficulty
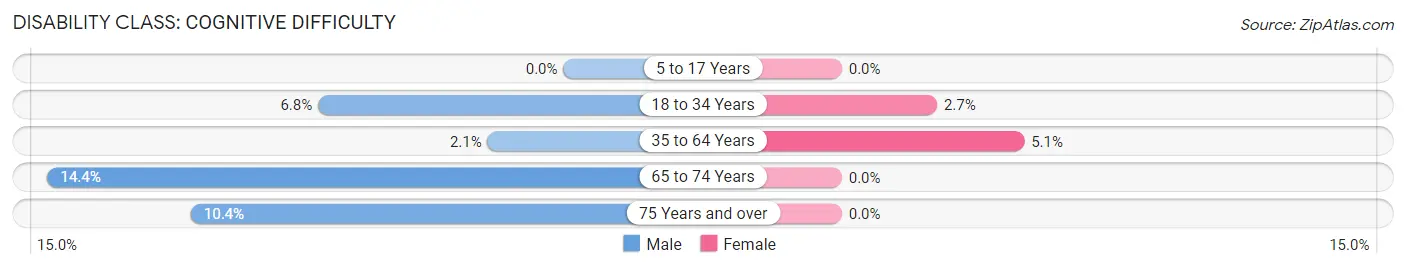
| Age Bracket | Male | Female |
| 5 to 17 Years | 0 (0.0%) | 0 (0.0%) |
| 18 to 34 Years | 22 (6.8%) | 10 (2.6%) |
| 35 to 64 Years | 16 (2.1%) | 36 (5.1%) |
| 65 to 74 Years | 29 (14.4%) | 0 (0.0%) |
| 75 Years and over | 17 (10.4%) | 0 (0.0%) |
Disability Class: Ambulatory Difficulty
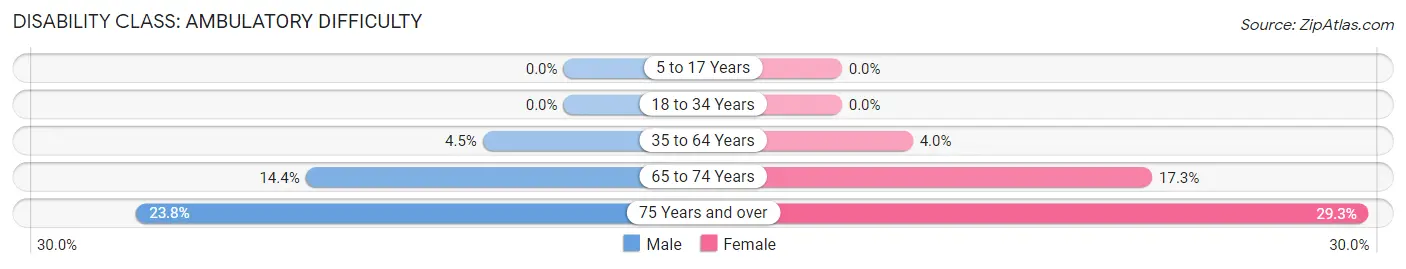
| Age Bracket | Male | Female |
| 5 to 17 Years | 0 (0.0%) | 0 (0.0%) |
| 18 to 34 Years | 0 (0.0%) | 0 (0.0%) |
| 35 to 64 Years | 34 (4.5%) | 28 (4.0%) |
| 65 to 74 Years | 29 (14.4%) | 33 (17.3%) |
| 75 Years and over | 39 (23.8%) | 44 (29.3%) |
Disability Class: Self-Care Difficulty
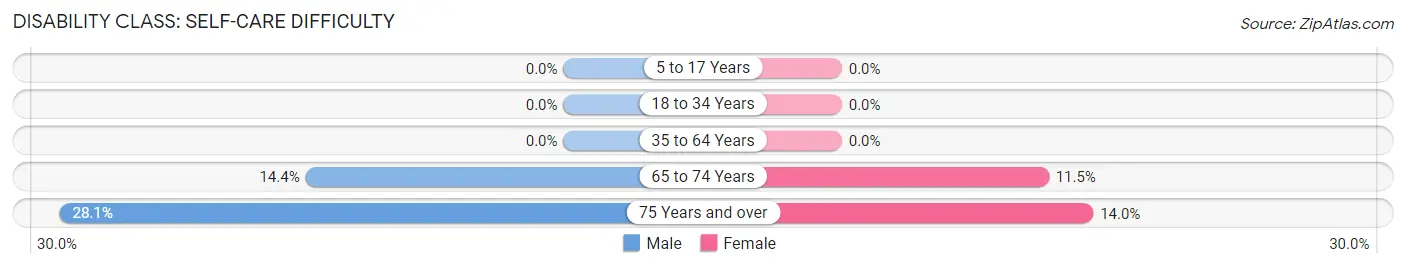
| Age Bracket | Male | Female |
| 5 to 17 Years | 0 (0.0%) | 0 (0.0%) |
| 18 to 34 Years | 0 (0.0%) | 0 (0.0%) |
| 35 to 64 Years | 0 (0.0%) | 0 (0.0%) |
| 65 to 74 Years | 29 (14.4%) | 22 (11.5%) |
| 75 Years and over | 46 (28.1%) | 21 (14.0%) |
Technology Access in Cresco
Computing Device Access in Cresco
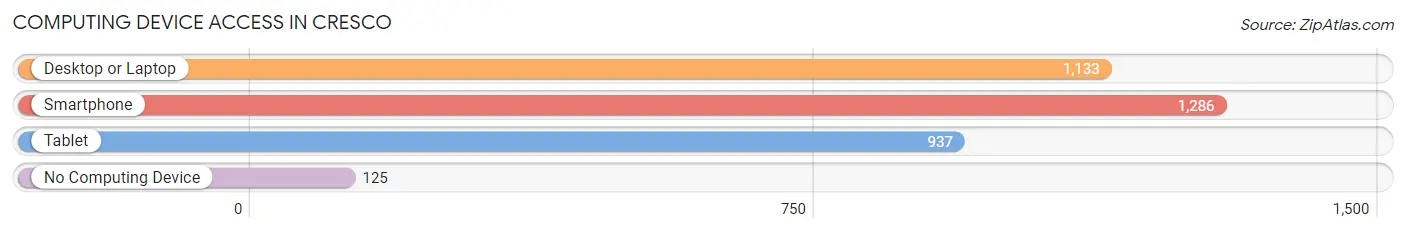
| Device Type | # Households | % Households |
| Desktop or Laptop | 1,133 | 75.8% |
| Smartphone | 1,286 | 86.0% |
| Tablet | 937 | 62.7% |
| No Computing Device | 125 | 8.4% |
| Total | 1,495 | 100.0% |
Internet Access in Cresco
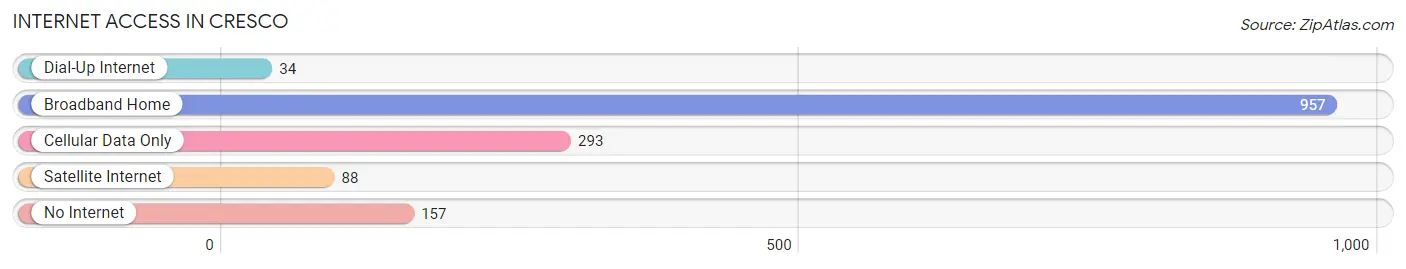
| Internet Type | # Households | % Households |
| Dial-Up Internet | 34 | 2.3% |
| Broadband Home | 957 | 64.0% |
| Cellular Data Only | 293 | 19.6% |
| Satellite Internet | 88 | 5.9% |
| No Internet | 157 | 10.5% |
| Total | 1,495 | 100.0% |
Cresco Summary
Cresco, Iowa is a small city located in Howard County in the northeastern part of the state. It is the county seat and the largest city in the county. The city was founded in 1873 and has a population of 3,719 as of the 2020 census.
Geography
Cresco is located in the Upper Iowa River Valley, which is part of the Driftless Area. The city is situated on the banks of the Upper Iowa River, which flows through the city. The city is surrounded by rolling hills and bluffs, and is located in a region of the state known for its scenic beauty. The city is located approximately 50 miles from the Minnesota border and is about a two-hour drive from the Twin Cities.
The city has a total area of 4.2 square miles, all of which is land. The city is located at an elevation of 1,068 feet above sea level. The climate in Cresco is classified as humid continental, with cold winters and hot, humid summers.
Economy
Cresco’s economy is largely based on agriculture and manufacturing. The city is home to several large agricultural businesses, including Cresco Seed and Supply, Cresco Feed and Grain, and Cresco Milling. The city is also home to several manufacturing companies, including Cresco Manufacturing, Cresco Plastics, and Cresco Metal Products.
The city is also home to several retail businesses, including a grocery store, a hardware store, and several restaurants. The city is also home to a number of small businesses, including a bakery, a florist, and a furniture store.
Demographics
As of the 2020 census, Cresco had a population of 3,719. The racial makeup of the city was 97.2% White, 0.3% African American, 0.2% Native American, 0.3% Asian, 0.1% Pacific Islander, 0.7% from other races, and 1.2% from two or more races. Hispanic or Latino of any race were 2.2% of the population.
The median household income in Cresco was $45,938 in 2019, and the median family income was $54,917. The per capita income in the city was $22,845. About 11.2% of the population was below the poverty line.
Conclusion
Cresco, Iowa is a small city located in Howard County in the northeastern part of the state. It is the county seat and the largest city in the county. The city was founded in 1873 and has a population of 3,719 as of the 2020 census. The city is situated on the banks of the Upper Iowa River and is surrounded by rolling hills and bluffs. The city’s economy is largely based on agriculture and manufacturing, and it is home to several retail businesses and small businesses. The racial makeup of the city is 97.2% White, 0.3% African American, 0.2% Native American, 0.3% Asian, 0.1% Pacific Islander, 0.7% from other races, and 1.2% from two or more races. The median household income in Cresco was $45,938 in 2019, and the median family income was $54,917.
Common Questions
What is Per Capita Income in Cresco?
Per Capita income in Cresco is $27,407.
What is the Median Family Income in Cresco?
Median Family Income in Cresco is $75,455.
What is the Median Household income in Cresco?
Median Household Income in Cresco is $60,135.
What is Income or Wage Gap in Cresco?
Income or Wage Gap in Cresco is 22.5%.
Women in Cresco earn 77.5 cents for every dollar earned by a man.
What is Inequality or Gini Index in Cresco?
Inequality or Gini Index in Cresco is 0.36.
What is the Total Population of Cresco?
Total Population of Cresco is 3,899.
What is the Total Male Population of Cresco?
Total Male Population of Cresco is 1,904.
What is the Total Female Population of Cresco?
Total Female Population of Cresco is 1,995.
What is the Ratio of Males per 100 Females in Cresco?
There are 95.44 Males per 100 Females in Cresco.
What is the Ratio of Females per 100 Males in Cresco?
There are 104.78 Females per 100 Males in Cresco.
What is the Median Population Age in Cresco?
Median Population Age in Cresco is 39.5 Years.
What is the Average Family Size in Cresco
Average Family Size in Cresco is 3.1 People.
What is the Average Household Size in Cresco
Average Household Size in Cresco is 2.5 People.
How Large is the Labor Force in Cresco?
There are 2,009 People in the Labor Forcein in Cresco.
What is the Percentage of People in the Labor Force in Cresco?
65.2% of People are in the Labor Force in Cresco.