Fontanelle, IA Map & Demographics
Fontanelle Map
Fontanelle Overview
$32,275
PER CAPITA INCOME
$75,208
AVG FAMILY INCOME
$56,042
AVG HOUSEHOLD INCOME
17.5%
WAGE / INCOME GAP [ % ]
82.5¢/ $1
WAGE / INCOME GAP [ $ ]
0.36
INEQUALITY / GINI INDEX
608
TOTAL POPULATION
296
MALE POPULATION
312
FEMALE POPULATION
94.87
MALES / 100 FEMALES
105.41
FEMALES / 100 MALES
43.0
MEDIAN AGE
2.7
AVG FAMILY SIZE
2.0
AVG HOUSEHOLD SIZE
285
LABOR FORCE [ PEOPLE ]
57.9%
PERCENT IN LABOR FORCE
3.5%
UNEMPLOYMENT RATE
Fontanelle Zip Codes
Fontanelle Area Codes
Income in Fontanelle
Income Overview in Fontanelle
Per Capita Income in Fontanelle is $32,275, while median incomes of families and households are $75,208 and $56,042 respectively.
| Characteristic | Number | Measure |
| Per Capita Income | 608 | $32,275 |
| Median Family Income | 153 | $75,208 |
| Mean Family Income | 153 | $82,682 |
| Median Household Income | 281 | $56,042 |
| Mean Household Income | 281 | $65,931 |
| Income Deficit | 153 | $0 |
| Wage / Income Gap (%) | 608 | 17.53% |
| Wage / Income Gap ($) | 608 | 82.47¢ per $1 |
| Gini / Inequality Index | 608 | 0.36 |
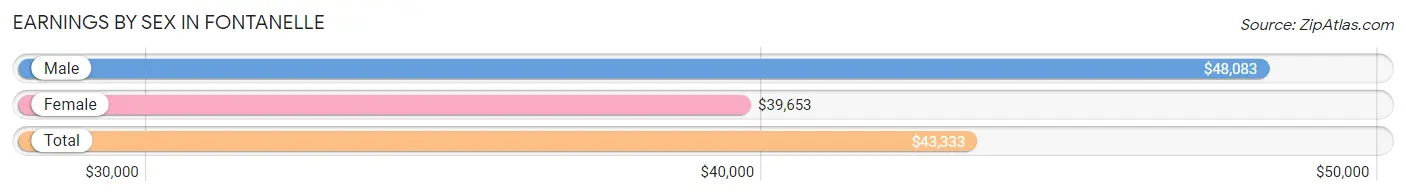
Earnings by Sex in Fontanelle
Average Earnings in Fontanelle are $43,333, $48,083 for men and $39,653 for women, a difference of 17.5%.
| Sex | Number | Average Earnings |
| Male | 153 (51.7%) | $48,083 |
| Female | 143 (48.3%) | $39,653 |
| Total | 296 (100.0%) | $43,333 |
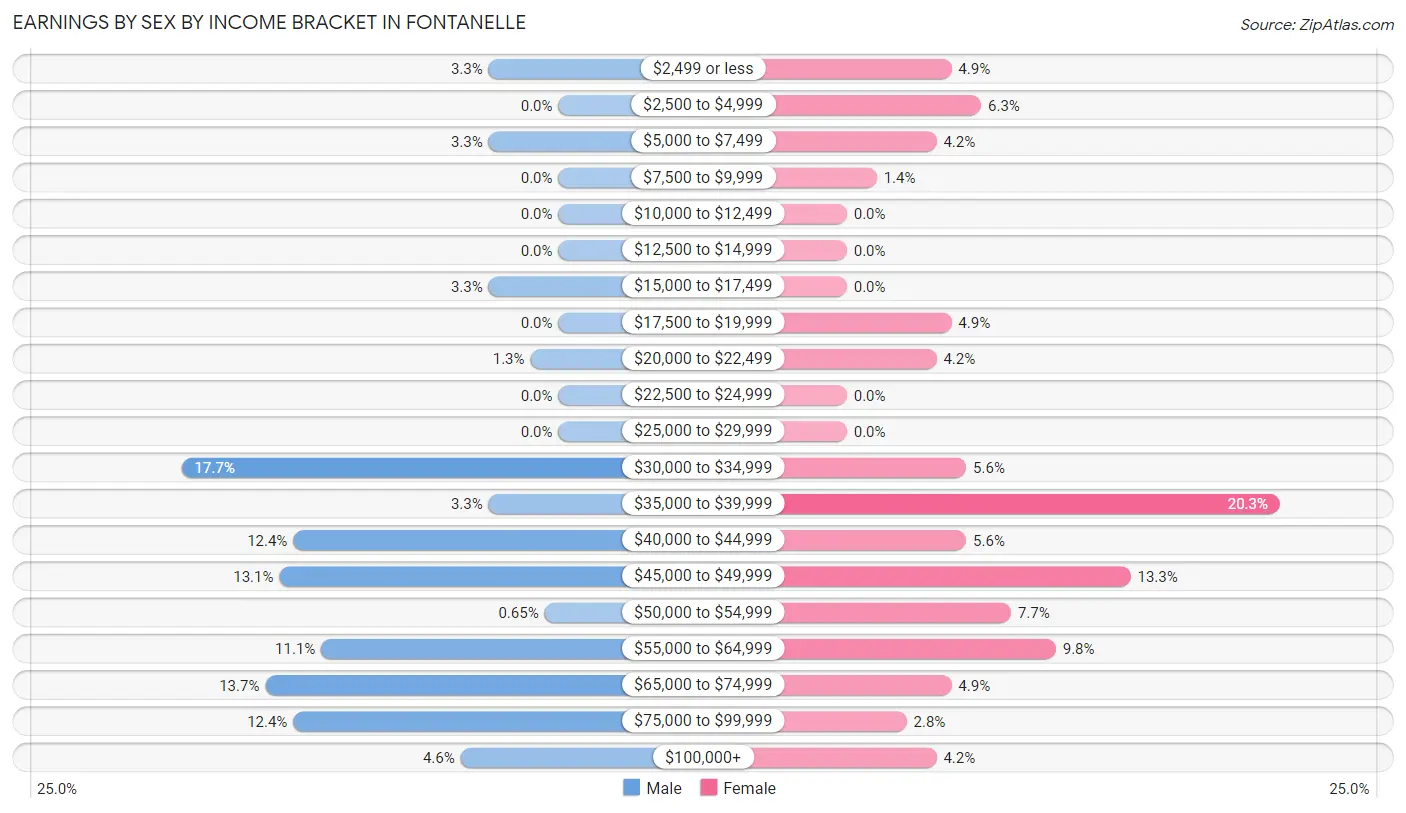
Earnings by Sex by Income Bracket in Fontanelle
The most common earnings brackets in Fontanelle are $30,000 to $34,999 for men (27 | 17.6%) and $35,000 to $39,999 for women (29 | 20.3%).
| Income | Male | Female |
| $2,499 or less | 5 (3.3%) | 7 (4.9%) |
| $2,500 to $4,999 | 0 (0.0%) | 9 (6.3%) |
| $5,000 to $7,499 | 5 (3.3%) | 6 (4.2%) |
| $7,500 to $9,999 | 0 (0.0%) | 2 (1.4%) |
| $10,000 to $12,499 | 0 (0.0%) | 0 (0.0%) |
| $12,500 to $14,999 | 0 (0.0%) | 0 (0.0%) |
| $15,000 to $17,499 | 5 (3.3%) | 0 (0.0%) |
| $17,500 to $19,999 | 0 (0.0%) | 7 (4.9%) |
| $20,000 to $22,499 | 2 (1.3%) | 6 (4.2%) |
| $22,500 to $24,999 | 0 (0.0%) | 0 (0.0%) |
| $25,000 to $29,999 | 0 (0.0%) | 0 (0.0%) |
| $30,000 to $34,999 | 27 (17.6%) | 8 (5.6%) |
| $35,000 to $39,999 | 5 (3.3%) | 29 (20.3%) |
| $40,000 to $44,999 | 19 (12.4%) | 8 (5.6%) |
| $45,000 to $49,999 | 20 (13.1%) | 19 (13.3%) |
| $50,000 to $54,999 | 1 (0.6%) | 11 (7.7%) |
| $55,000 to $64,999 | 17 (11.1%) | 14 (9.8%) |
| $65,000 to $74,999 | 21 (13.7%) | 7 (4.9%) |
| $75,000 to $99,999 | 19 (12.4%) | 4 (2.8%) |
| $100,000+ | 7 (4.6%) | 6 (4.2%) |
| Total | 153 (100.0%) | 143 (100.0%) |
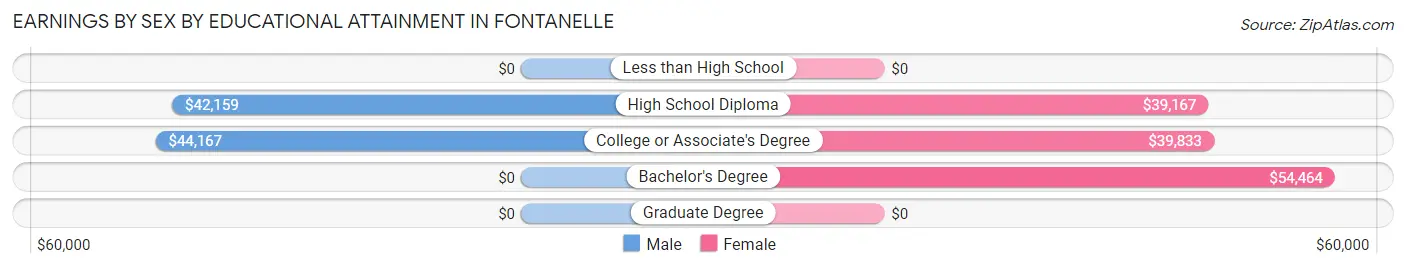
Earnings by Sex by Educational Attainment in Fontanelle
Average earnings in Fontanelle are $47,583 for men and $43,750 for women, a difference of 8.1%. Men with an educational attainment of college or associate's degree enjoy the highest average annual earnings of $44,167, while those with high school diploma education earn the least with $42,159. Women with an educational attainment of bachelor's degree earn the most with the average annual earnings of $54,464, while those with high school diploma education have the smallest earnings of $39,167.
| Educational Attainment | Male Income | Female Income |
| Less than High School | - | - |
| High School Diploma | $42,159 | $39,167 |
| College or Associate's Degree | $44,167 | $39,833 |
| Bachelor's Degree | - | - |
| Graduate Degree | - | - |
| Total | $47,583 | $43,750 |
Family Income in Fontanelle
Family Income Brackets in Fontanelle
According to the Fontanelle family income data, there are 31 families falling into the $100,000 to $149,999 income range, which is the most common income bracket and makes up 20.3% of all families. Conversely, the $10,000 to $14,999 income bracket is the least frequent group with only 2 families (1.3%) belonging to this category.
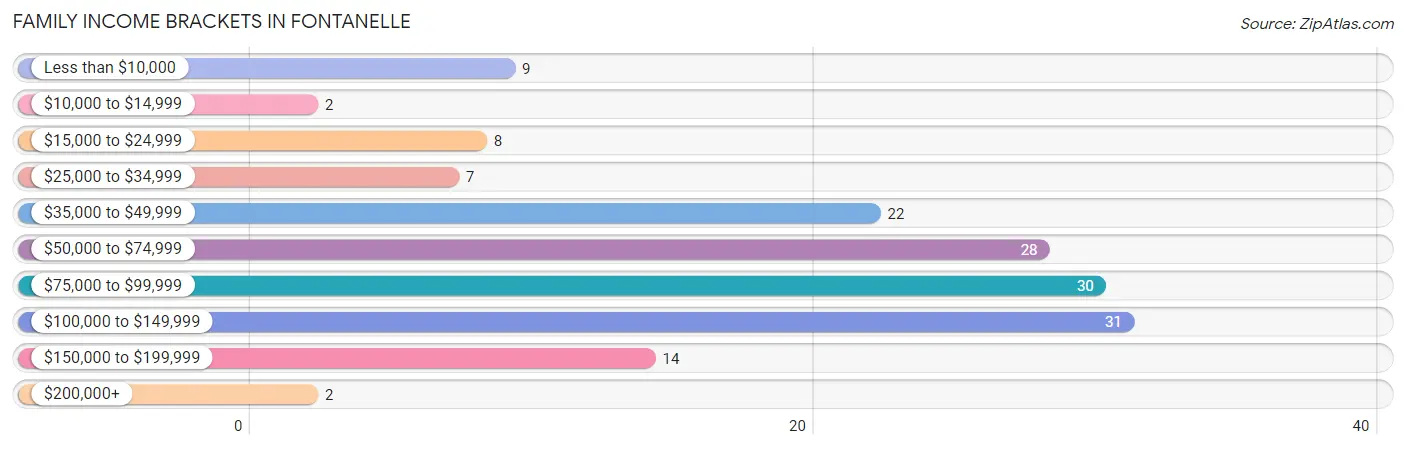
| Income Bracket | # Families | % Families |
| Less than $10,000 | 9 | 5.9% |
| $10,000 to $14,999 | 2 | 1.3% |
| $15,000 to $24,999 | 8 | 5.2% |
| $25,000 to $34,999 | 7 | 4.6% |
| $35,000 to $49,999 | 22 | 14.4% |
| $50,000 to $74,999 | 28 | 18.3% |
| $75,000 to $99,999 | 30 | 19.6% |
| $100,000 to $149,999 | 31 | 20.3% |
| $150,000 to $199,999 | 14 | 9.2% |
| $200,000+ | 2 | 1.3% |
Family Income by Famaliy Size in Fontanelle
4-person families (16 | 10.5%) account for the highest median family income in Fontanelle with $93,125 per family, while 2-person families (108 | 70.6%) have the highest median income of $37,916 per family member.
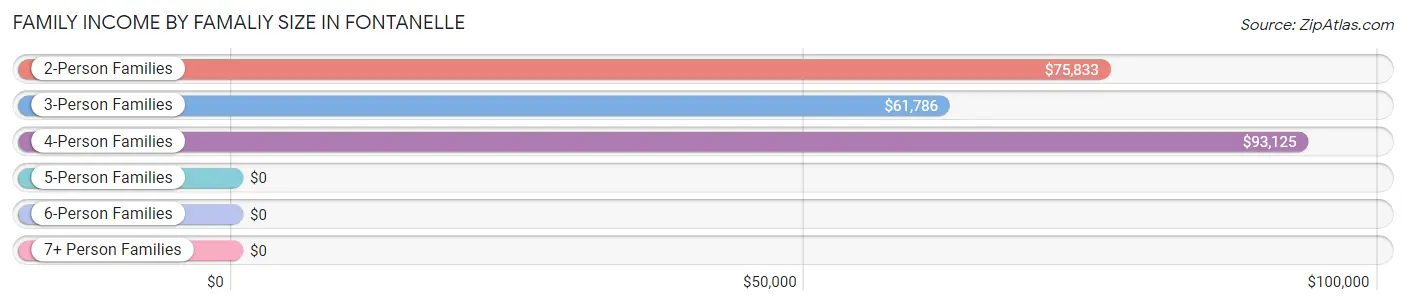
| Income Bracket | # Families | Median Income |
| 2-Person Families | 108 (70.6%) | $75,833 |
| 3-Person Families | 22 (14.4%) | $61,786 |
| 4-Person Families | 16 (10.5%) | $93,125 |
| 5-Person Families | 2 (1.3%) | $0 |
| 6-Person Families | 0 (0.0%) | $0 |
| 7+ Person Families | 5 (3.3%) | $0 |
| Total | 153 (100.0%) | $75,208 |
Family Income by Number of Earners in Fontanelle
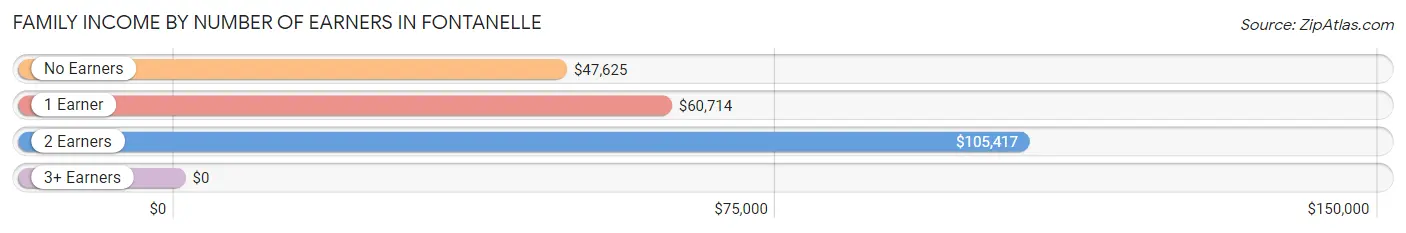
| Number of Earners | # Families | Median Income |
| No Earners | 39 (25.5%) | $47,625 |
| 1 Earner | 42 (27.5%) | $60,714 |
| 2 Earners | 72 (47.1%) | $105,417 |
| 3+ Earners | 0 (0.0%) | $0 |
| Total | 153 (100.0%) | $75,208 |
Household Income in Fontanelle
Household Income Brackets in Fontanelle
With 65 households falling in the category, the $50,000 to $74,999 income range is the most frequent in Fontanelle, accounting for 23.1% of all households. In contrast, only 2 households (0.7%) fall into the $200,000+ income bracket, making it the least populous group.
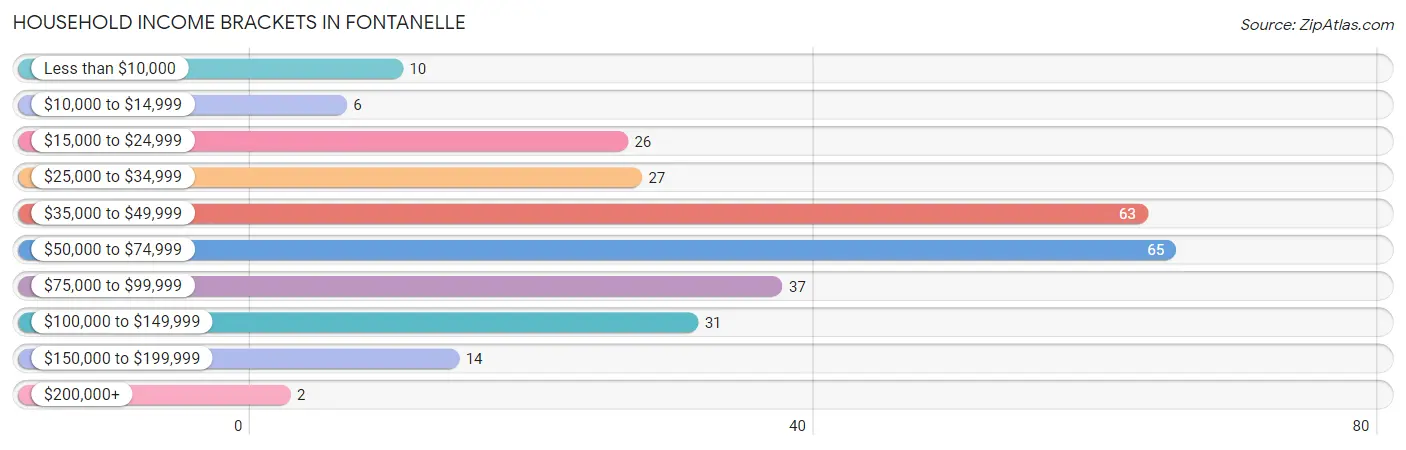
| Income Bracket | # Households | % Households |
| Less than $10,000 | 10 | 3.6% |
| $10,000 to $14,999 | 6 | 2.1% |
| $15,000 to $24,999 | 26 | 9.3% |
| $25,000 to $34,999 | 27 | 9.6% |
| $35,000 to $49,999 | 63 | 22.4% |
| $50,000 to $74,999 | 65 | 23.1% |
| $75,000 to $99,999 | 37 | 13.2% |
| $100,000 to $149,999 | 31 | 11.0% |
| $150,000 to $199,999 | 14 | 5.0% |
| $200,000+ | 2 | 0.7% |
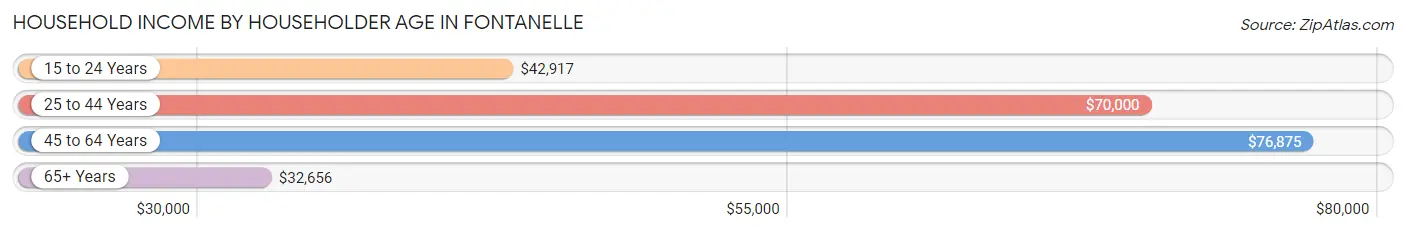
Household Income by Householder Age in Fontanelle
The median household income in Fontanelle is $56,042, with the highest median household income of $76,875 found in the 45 to 64 years age bracket for the primary householder. A total of 85 households (30.2%) fall into this category. Meanwhile, the 65+ years age bracket for the primary householder has the lowest median household income of $32,656, with 83 households (29.5%) in this group.
| Income Bracket | # Households | Median Income |
| 15 to 24 Years | 21 (7.5%) | $42,917 |
| 25 to 44 Years | 92 (32.7%) | $70,000 |
| 45 to 64 Years | 85 (30.2%) | $76,875 |
| 65+ Years | 83 (29.5%) | $32,656 |
| Total | 281 (100.0%) | $56,042 |
Poverty in Fontanelle
Income Below Poverty by Sex and Age in Fontanelle
With 4.9% poverty level for males and 9.7% for females among the residents of Fontanelle, 15 year old males and 45 to 54 year old females are the most vulnerable to poverty, with 3 males (100.0%) and 6 females (25.0%) in their respective age groups living below the poverty level.
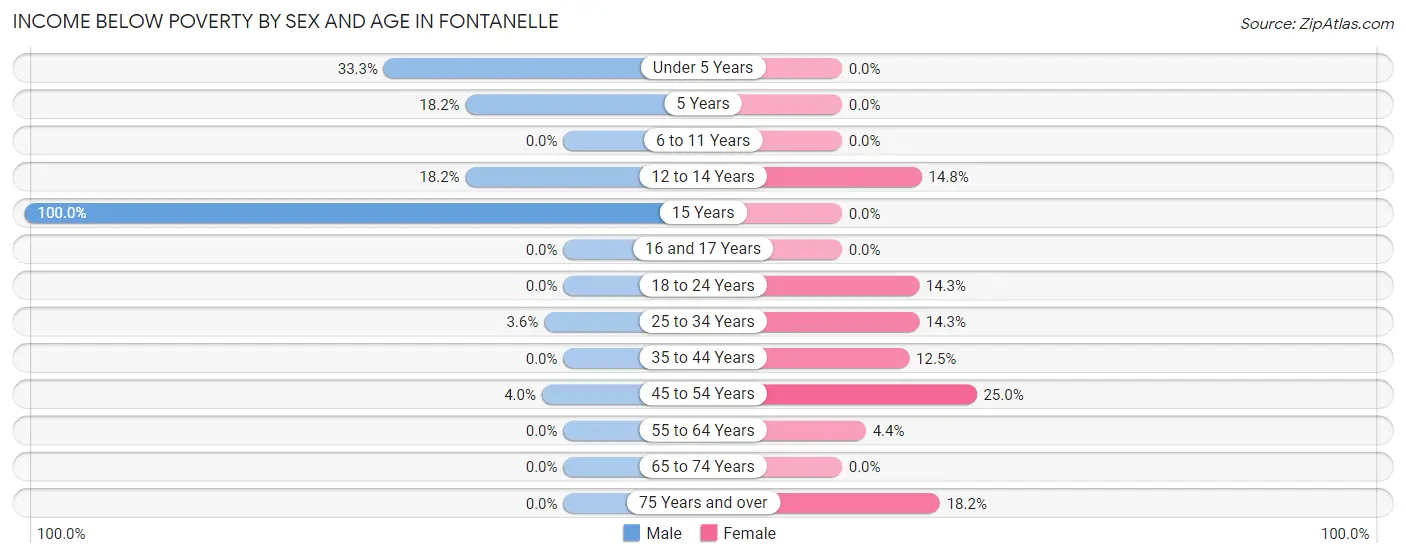
| Age Bracket | Male | Female |
| Under 5 Years | 3 (33.3%) | 0 (0.0%) |
| 5 Years | 2 (18.2%) | 0 (0.0%) |
| 6 to 11 Years | 0 (0.0%) | 0 (0.0%) |
| 12 to 14 Years | 2 (18.2%) | 4 (14.8%) |
| 15 Years | 3 (100.0%) | 0 (0.0%) |
| 16 and 17 Years | 0 (0.0%) | 0 (0.0%) |
| 18 to 24 Years | 0 (0.0%) | 3 (14.3%) |
| 25 to 34 Years | 2 (3.6%) | 6 (14.3%) |
| 35 to 44 Years | 0 (0.0%) | 3 (12.5%) |
| 45 to 54 Years | 2 (4.0%) | 6 (25.0%) |
| 55 to 64 Years | 0 (0.0%) | 2 (4.4%) |
| 65 to 74 Years | 0 (0.0%) | 0 (0.0%) |
| 75 Years and over | 0 (0.0%) | 4 (18.2%) |
| Total | 14 (4.9%) | 28 (9.7%) |
Income Above Poverty by Sex and Age in Fontanelle
According to the poverty statistics in Fontanelle, males aged 6 to 11 years and females aged under 5 years are the age groups that are most secure financially, with 100.0% of males and 100.0% of females in these age groups living above the poverty line.
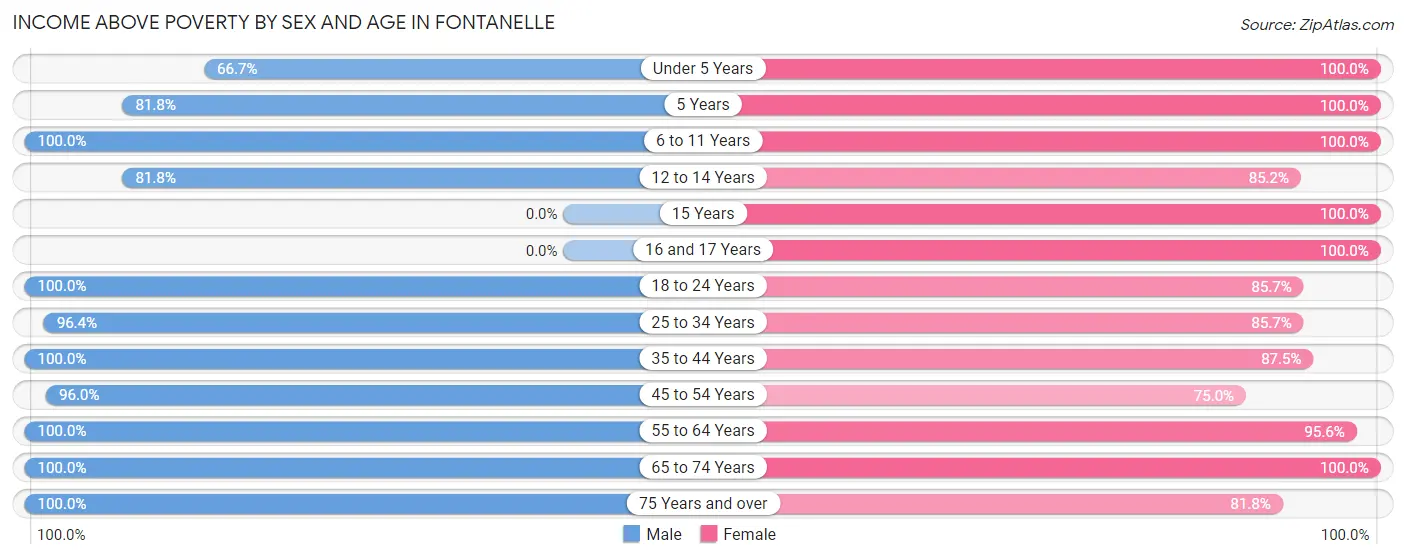
| Age Bracket | Male | Female |
| Under 5 Years | 6 (66.7%) | 10 (100.0%) |
| 5 Years | 9 (81.8%) | 3 (100.0%) |
| 6 to 11 Years | 29 (100.0%) | 9 (100.0%) |
| 12 to 14 Years | 9 (81.8%) | 23 (85.2%) |
| 15 Years | 0 (0.0%) | 1 (100.0%) |
| 16 and 17 Years | 0 (0.0%) | 4 (100.0%) |
| 18 to 24 Years | 10 (100.0%) | 18 (85.7%) |
| 25 to 34 Years | 54 (96.4%) | 36 (85.7%) |
| 35 to 44 Years | 36 (100.0%) | 21 (87.5%) |
| 45 to 54 Years | 48 (96.0%) | 18 (75.0%) |
| 55 to 64 Years | 24 (100.0%) | 43 (95.6%) |
| 65 to 74 Years | 35 (100.0%) | 57 (100.0%) |
| 75 Years and over | 10 (100.0%) | 18 (81.8%) |
| Total | 270 (95.1%) | 261 (90.3%) |
Income Below Poverty Among Married-Couple Families in Fontanelle
The poverty statistics for married-couple families in Fontanelle show that 1.8% or 2 of the total 112 families live below the poverty line. Families with no children have the highest poverty rate of 2.7%, comprising of 2 families. On the other hand, families with 1 or 2 children have the lowest poverty rate of 0.0%, which includes 0 families.
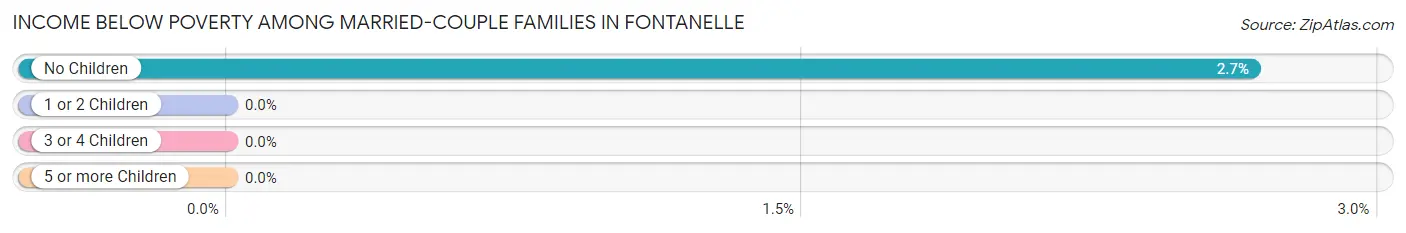
| Children | Above Poverty | Below Poverty |
| No Children | 73 (97.3%) | 2 (2.7%) |
| 1 or 2 Children | 30 (100.0%) | 0 (0.0%) |
| 3 or 4 Children | 5 (100.0%) | 0 (0.0%) |
| 5 or more Children | 2 (100.0%) | 0 (0.0%) |
| Total | 110 (98.2%) | 2 (1.8%) |
Income Below Poverty Among Single-Parent Households in Fontanelle
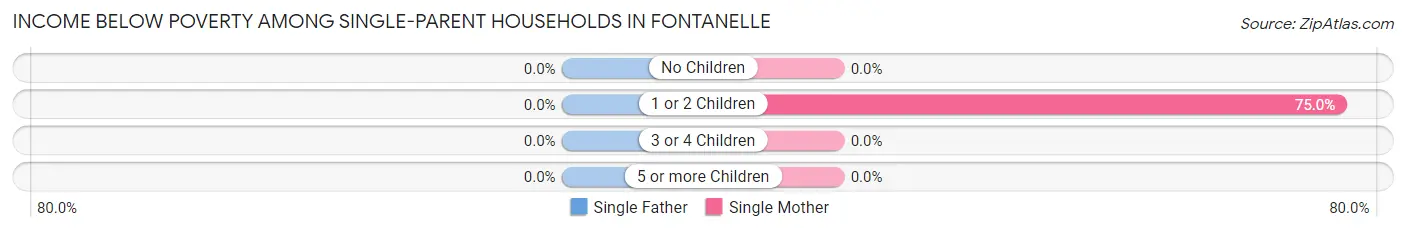
| Children | Single Father | Single Mother |
| No Children | 0 (0.0%) | 0 (0.0%) |
| 1 or 2 Children | 0 (0.0%) | 12 (75.0%) |
| 3 or 4 Children | 0 (0.0%) | 0 (0.0%) |
| 5 or more Children | 0 (0.0%) | 0 (0.0%) |
| Total | 0 (0.0%) | 12 (42.9%) |
Income Below Poverty Among Married-Couple vs Single-Parent Households in Fontanelle
The poverty data for Fontanelle shows that 2 of the married-couple family households (1.8%) and 12 of the single-parent households (29.3%) are living below the poverty level. Within the married-couple family households, those with no children have the highest poverty rate, with 2 households (2.7%) falling below the poverty line. Among the single-parent households, those with 1 or 2 children have the highest poverty rate, with 12 household (44.4%) living below poverty.
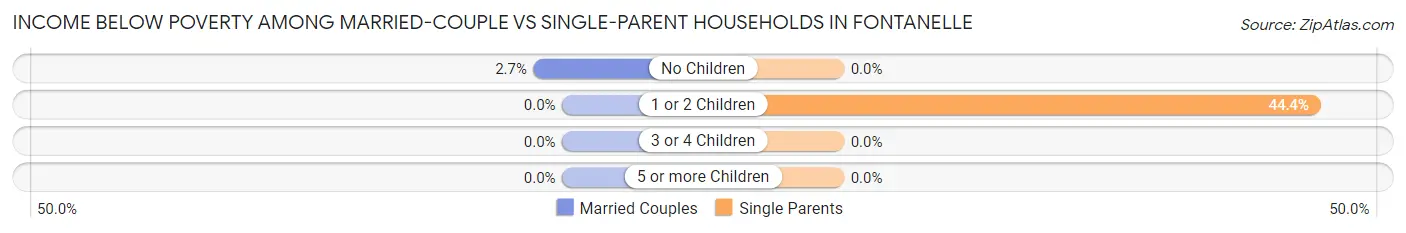
| Children | Married-Couple Families | Single-Parent Households |
| No Children | 2 (2.7%) | 0 (0.0%) |
| 1 or 2 Children | 0 (0.0%) | 12 (44.4%) |
| 3 or 4 Children | 0 (0.0%) | 0 (0.0%) |
| 5 or more Children | 0 (0.0%) | 0 (0.0%) |
| Total | 2 (1.8%) | 12 (29.3%) |
Race in Fontanelle
The most populous races in Fontanelle are White / Caucasian (568 | 93.4%), Two or more Races (25 | 4.1%), and Hispanic or Latino (10 | 1.6%).
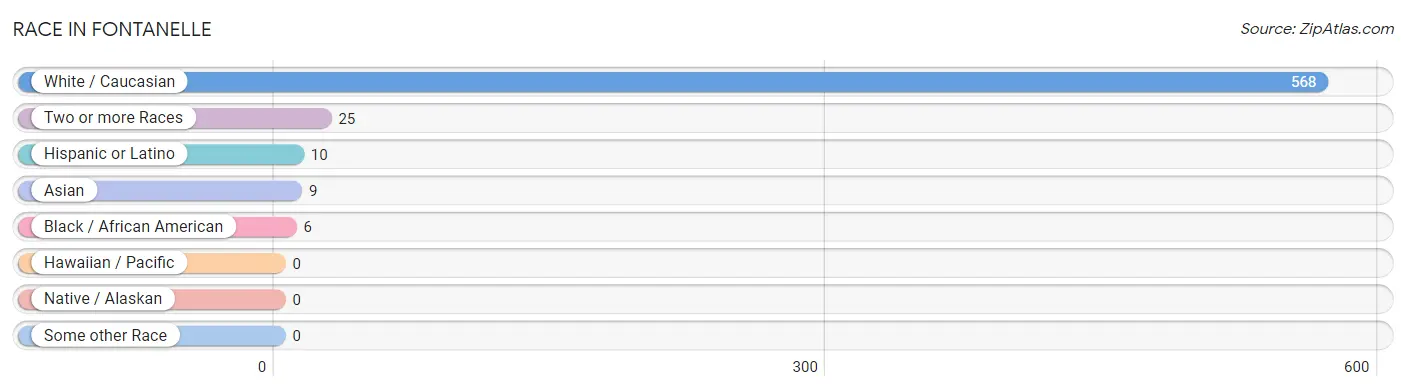
| Race | # Population | % Population |
| Asian | 9 | 1.5% |
| Black / African American | 6 | 1.0% |
| Hawaiian / Pacific | 0 | 0.0% |
| Hispanic or Latino | 10 | 1.6% |
| Native / Alaskan | 0 | 0.0% |
| White / Caucasian | 568 | 93.4% |
| Two or more Races | 25 | 4.1% |
| Some other Race | 0 | 0.0% |
| Total | 608 | 100.0% |
Ancestry in Fontanelle
The most populous ancestries reported in Fontanelle are German (196 | 32.2%), English (55 | 9.0%), American (50 | 8.2%), Irish (43 | 7.1%), and Danish (35 | 5.8%), together accounting for 62.3% of all Fontanelle residents.
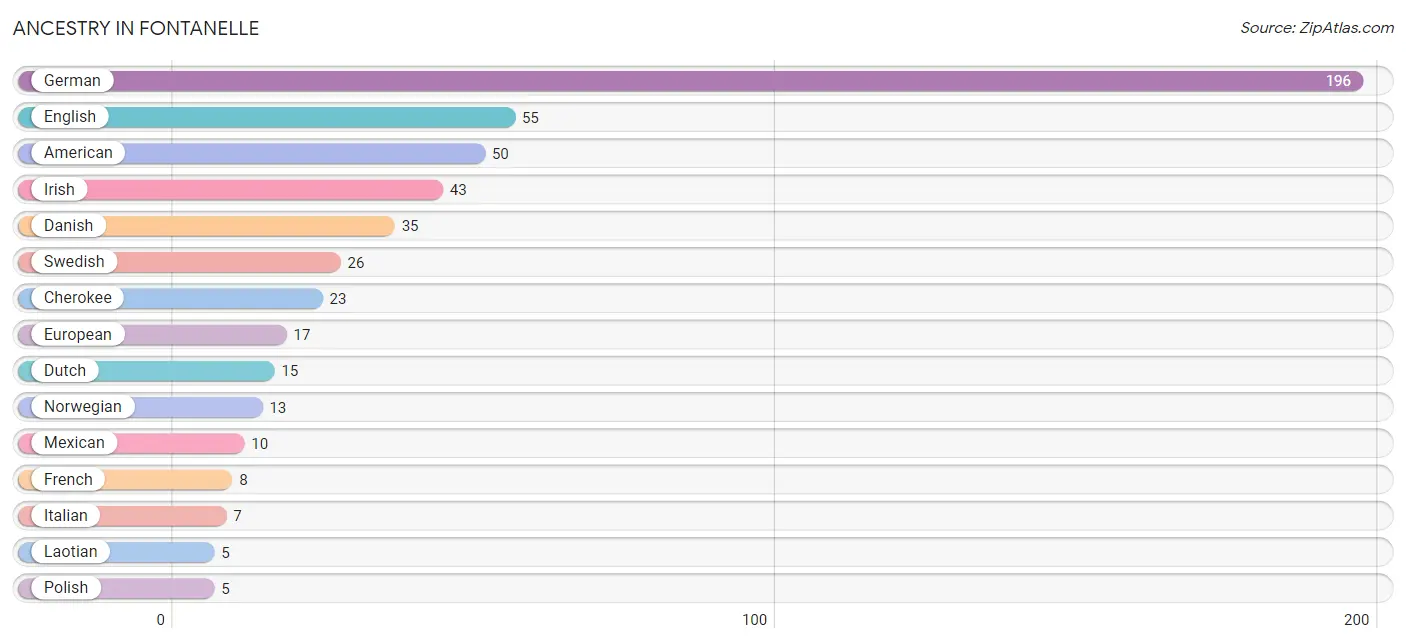
| Ancestry | # Population | % Population |
| American | 50 | 8.2% |
| Cherokee | 23 | 3.8% |
| Czech | 2 | 0.3% |
| Danish | 35 | 5.8% |
| Dutch | 15 | 2.5% |
| English | 55 | 9.0% |
| European | 17 | 2.8% |
| French | 8 | 1.3% |
| German | 196 | 32.2% |
| Irish | 43 | 7.1% |
| Italian | 7 | 1.1% |
| Korean | 4 | 0.7% |
| Laotian | 5 | 0.8% |
| Mexican | 10 | 1.6% |
| Norwegian | 13 | 2.1% |
| Polish | 5 | 0.8% |
| Scotch-Irish | 3 | 0.5% |
| Scottish | 5 | 0.8% |
| Swedish | 26 | 4.3% | View All 19 Rows |
Immigrants in Fontanelle
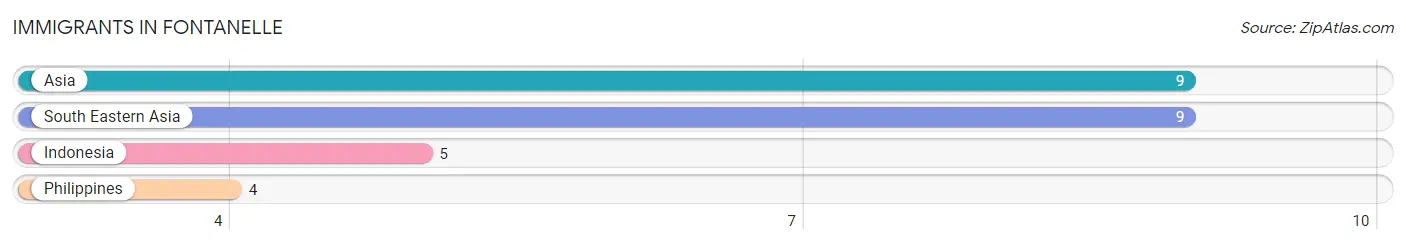
The most numerous immigrant groups reported in Fontanelle came from Asia (9 | 1.5%), South Eastern Asia (9 | 1.5%), Indonesia (5 | 0.8%), and Philippines (4 | 0.7%), together accounting for 4.4% of all Fontanelle residents.
| Immigration Origin | # Population | % Population |
| Asia | 9 | 1.5% |
| Indonesia | 5 | 0.8% |
| Philippines | 4 | 0.7% |
| South Eastern Asia | 9 | 1.5% | View All 4 Rows |
Sex and Age in Fontanelle
Sex and Age in Fontanelle
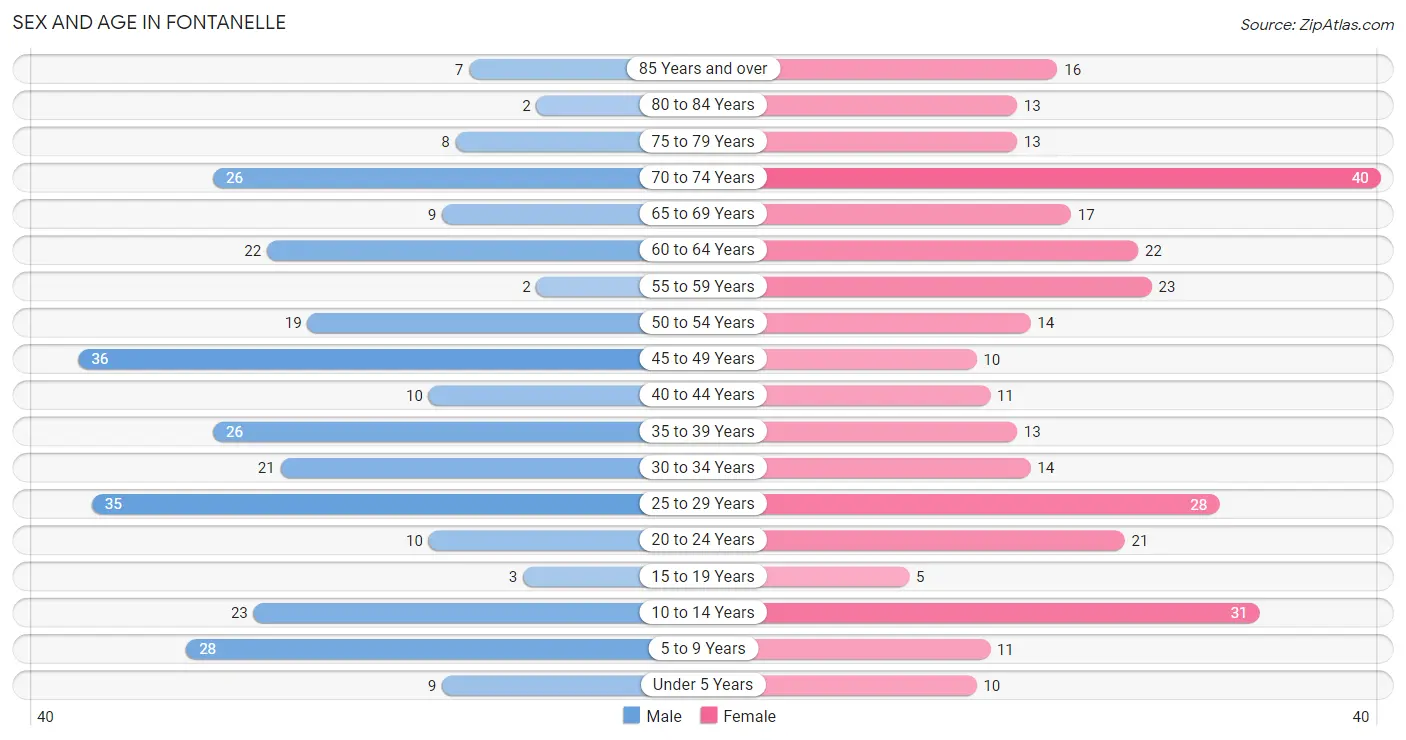
The most populous age groups in Fontanelle are 45 to 49 Years (36 | 12.2%) for men and 70 to 74 Years (40 | 12.8%) for women.
| Age Bracket | Male | Female |
| Under 5 Years | 9 (3.0%) | 10 (3.2%) |
| 5 to 9 Years | 28 (9.5%) | 11 (3.5%) |
| 10 to 14 Years | 23 (7.8%) | 31 (9.9%) |
| 15 to 19 Years | 3 (1.0%) | 5 (1.6%) |
| 20 to 24 Years | 10 (3.4%) | 21 (6.7%) |
| 25 to 29 Years | 35 (11.8%) | 28 (9.0%) |
| 30 to 34 Years | 21 (7.1%) | 14 (4.5%) |
| 35 to 39 Years | 26 (8.8%) | 13 (4.2%) |
| 40 to 44 Years | 10 (3.4%) | 11 (3.5%) |
| 45 to 49 Years | 36 (12.2%) | 10 (3.2%) |
| 50 to 54 Years | 19 (6.4%) | 14 (4.5%) |
| 55 to 59 Years | 2 (0.7%) | 23 (7.4%) |
| 60 to 64 Years | 22 (7.4%) | 22 (7.0%) |
| 65 to 69 Years | 9 (3.0%) | 17 (5.4%) |
| 70 to 74 Years | 26 (8.8%) | 40 (12.8%) |
| 75 to 79 Years | 8 (2.7%) | 13 (4.2%) |
| 80 to 84 Years | 2 (0.7%) | 13 (4.2%) |
| 85 Years and over | 7 (2.4%) | 16 (5.1%) |
| Total | 296 (100.0%) | 312 (100.0%) |
Families and Households in Fontanelle
Median Family Size in Fontanelle
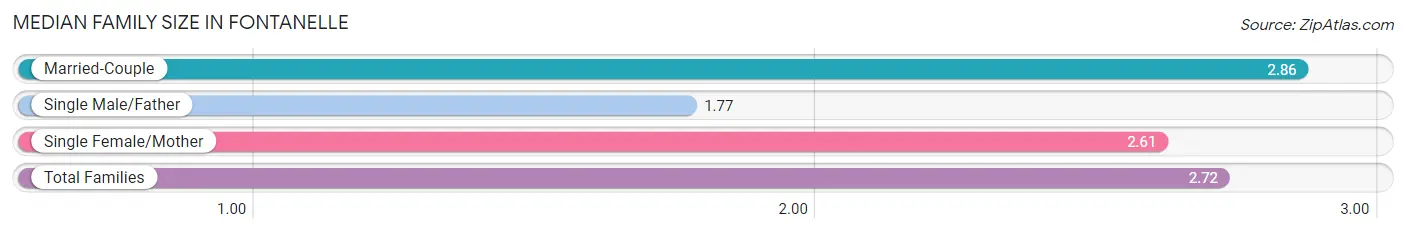
The median family size in Fontanelle is 2.72 persons per family, with married-couple families (112 | 73.2%) accounting for the largest median family size of 2.86 persons per family. On the other hand, single male/father families (13 | 8.5%) represent the smallest median family size with 1.77 persons per family.
| Family Type | # Families | Family Size |
| Married-Couple | 112 (73.2%) | 2.86 |
| Single Male/Father | 13 (8.5%) | 1.77 |
| Single Female/Mother | 28 (18.3%) | 2.61 |
| Total Families | 153 (100.0%) | 2.72 |
Median Household Size in Fontanelle
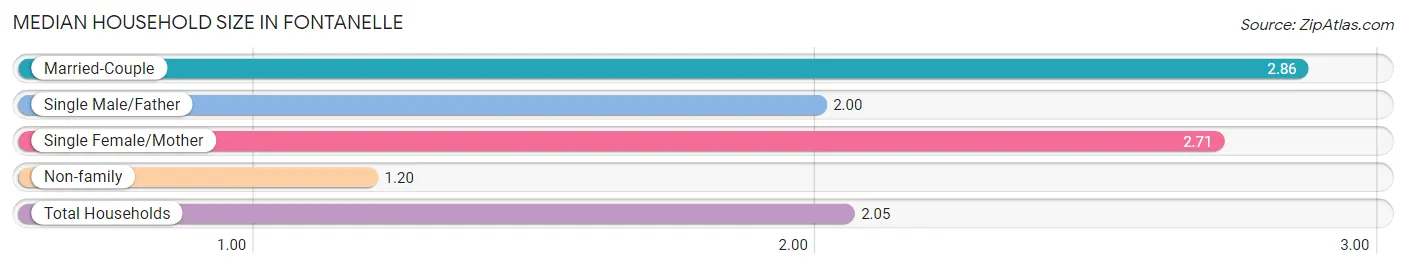
The median household size in Fontanelle is 2.05 persons per household, with married-couple households (112 | 39.9%) accounting for the largest median household size of 2.86 persons per household. non-family households (128 | 45.6%) represent the smallest median household size with 1.20 persons per household.
| Household Type | # Households | Household Size |
| Married-Couple | 112 (39.9%) | 2.86 |
| Single Male/Father | 13 (4.6%) | 2.00 |
| Single Female/Mother | 28 (10.0%) | 2.71 |
| Non-family | 128 (45.6%) | 1.20 |
| Total Households | 281 (100.0%) | 2.05 |
Household Size by Marriage Status in Fontanelle
Out of a total of 281 households in Fontanelle, 153 (54.4%) are family households, while 128 (45.6%) are nonfamily households. The most numerous type of family households are 2-person households, comprising 103, and the most common type of nonfamily households are 1-person households, comprising 103.
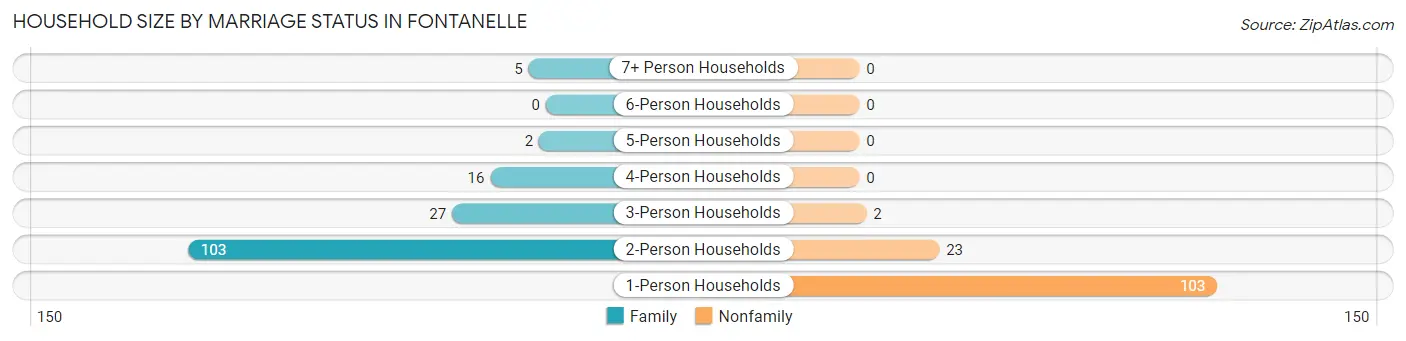
| Household Size | Family Households | Nonfamily Households |
| 1-Person Households | - | 103 (36.6%) |
| 2-Person Households | 103 (36.6%) | 23 (8.2%) |
| 3-Person Households | 27 (9.6%) | 2 (0.7%) |
| 4-Person Households | 16 (5.7%) | 0 (0.0%) |
| 5-Person Households | 2 (0.7%) | 0 (0.0%) |
| 6-Person Households | 0 (0.0%) | 0 (0.0%) |
| 7+ Person Households | 5 (1.8%) | 0 (0.0%) |
| Total | 153 (54.4%) | 128 (45.6%) |
Female Fertility in Fontanelle
Fertility by Age in Fontanelle
Average fertility rate in Fontanelle is 38.0 births per 1,000 women. Women in the age bracket of 35 to 50 years have the highest fertility rate with 56.0 births per 1,000 women. Women in the age bracket of 20 to 34 years acount for 50.0% of all women with births.
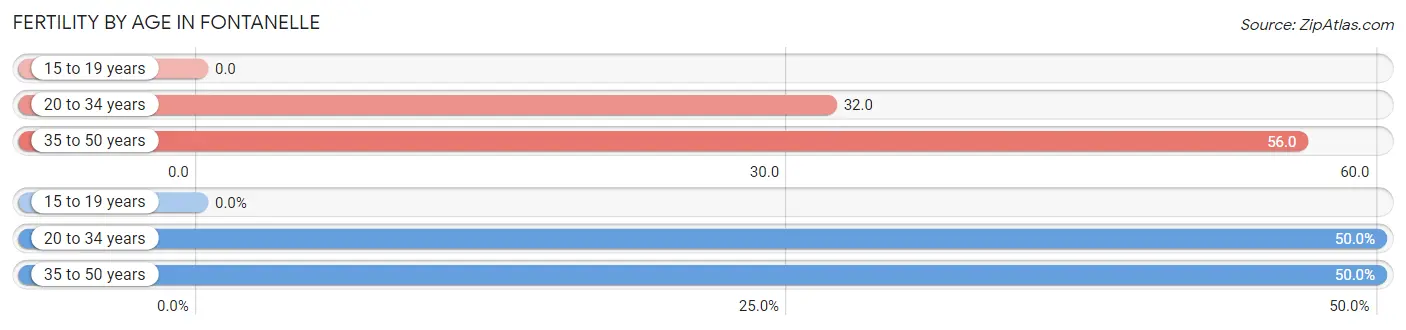
| Age Bracket | Women with Births | Births / 1,000 Women |
| 15 to 19 years | 0 (0.0%) | 0.0 |
| 20 to 34 years | 2 (50.0%) | 32.0 |
| 35 to 50 years | 2 (50.0%) | 56.0 |
| Total | 4 (100.0%) | 38.0 |
Fertility by Age by Marriage Status in Fontanelle
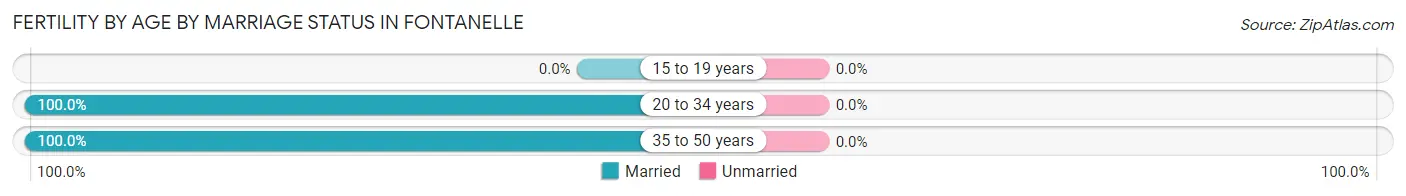
| Age Bracket | Married | Unmarried |
| 15 to 19 years | 0 (0.0%) | 0 (0.0%) |
| 20 to 34 years | 2 (100.0%) | 0 (0.0%) |
| 35 to 50 years | 2 (100.0%) | 0 (0.0%) |
| Total | 4 (100.0%) | 0 (0.0%) |
Fertility by Education in Fontanelle
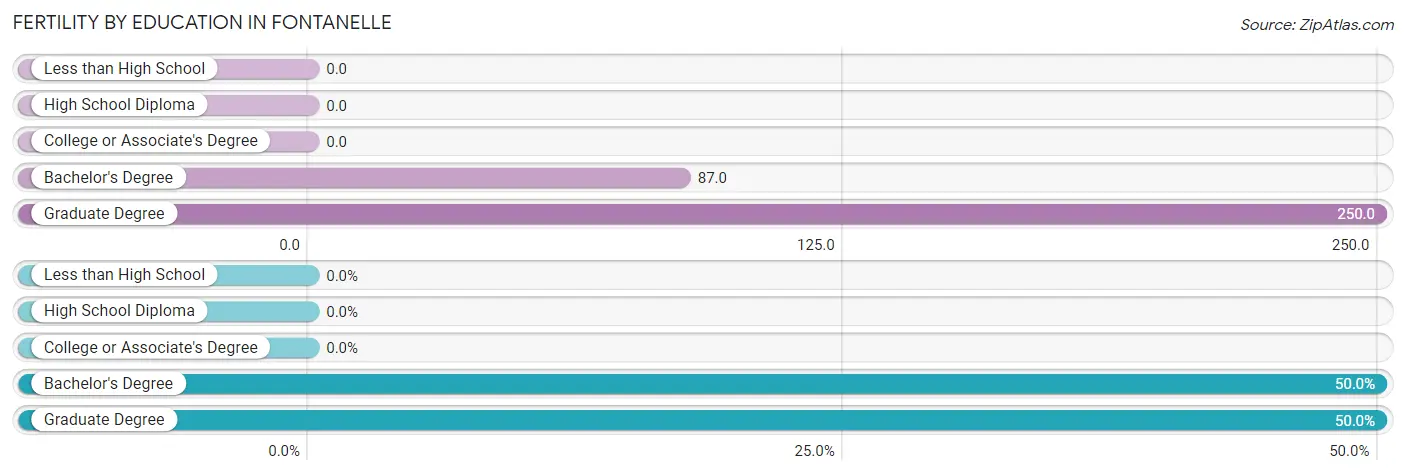
| Educational Attainment | Women with Births | Births / 1,000 Women |
| Less than High School | 0 (0.0%) | 0.0 |
| High School Diploma | 0 (0.0%) | 0.0 |
| College or Associate's Degree | 0 (0.0%) | 0.0 |
| Bachelor's Degree | 2 (50.0%) | 87.0 |
| Graduate Degree | 2 (50.0%) | 250.0 |
| Total | 4 (100.0%) | 38.0 |
Fertility by Education by Marriage Status in Fontanelle
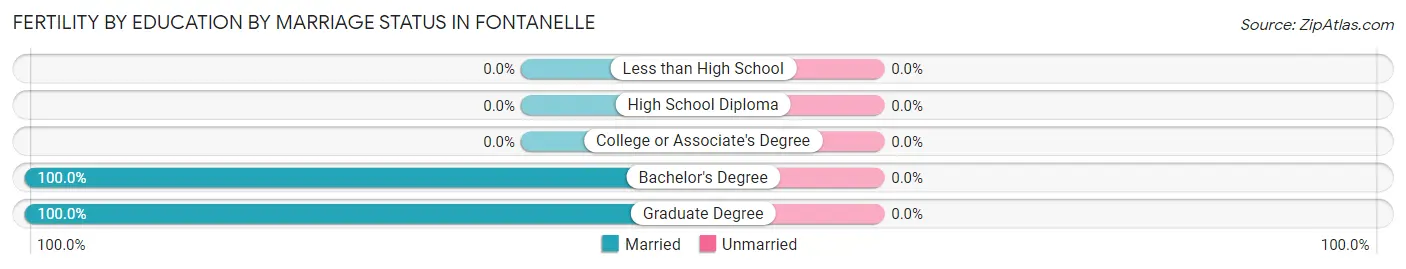
| Educational Attainment | Married | Unmarried |
| Less than High School | 0 (0.0%) | 0 (0.0%) |
| High School Diploma | 0 (0.0%) | 0 (0.0%) |
| College or Associate's Degree | 0 (0.0%) | 0 (0.0%) |
| Bachelor's Degree | 2 (100.0%) | 0 (0.0%) |
| Graduate Degree | 2 (100.0%) | 0 (0.0%) |
| Total | 4 (100.0%) | 0 (0.0%) |
Employment Characteristics in Fontanelle
Employment by Class of Employer in Fontanelle
Among the 273 employed individuals in Fontanelle, private company employees (182 | 66.7%), local government employees (33 | 12.1%), and not-for-profit organizations (29 | 10.6%) make up the most common classes of employment.
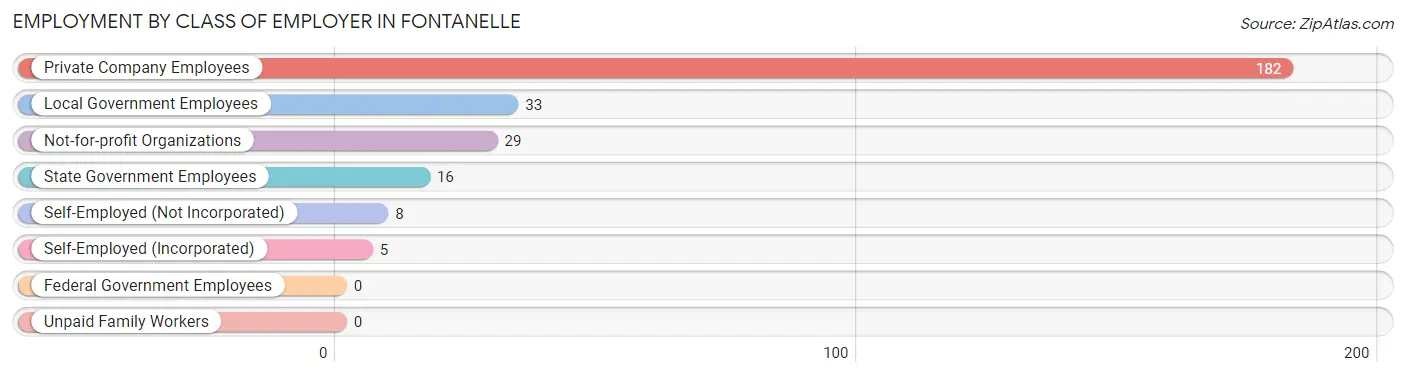
| Employer Class | # Employees | % Employees |
| Private Company Employees | 182 | 66.7% |
| Self-Employed (Incorporated) | 5 | 1.8% |
| Self-Employed (Not Incorporated) | 8 | 2.9% |
| Not-for-profit Organizations | 29 | 10.6% |
| Local Government Employees | 33 | 12.1% |
| State Government Employees | 16 | 5.9% |
| Federal Government Employees | 0 | 0.0% |
| Unpaid Family Workers | 0 | 0.0% |
| Total | 273 | 100.0% |
Employment Status by Age in Fontanelle
According to the labor force statistics for Fontanelle, out of the total population over 16 years of age (492), 57.9% or 285 individuals are in the labor force, with 3.5% or 10 of them unemployed. The age group with the highest labor force participation rate is 30 to 34 years, with 100.0% or 35 individuals in the labor force. Within the labor force, the 30 to 34 years age range has the highest percentage of unemployed individuals, with 20.0% or 7 of them being unemployed.
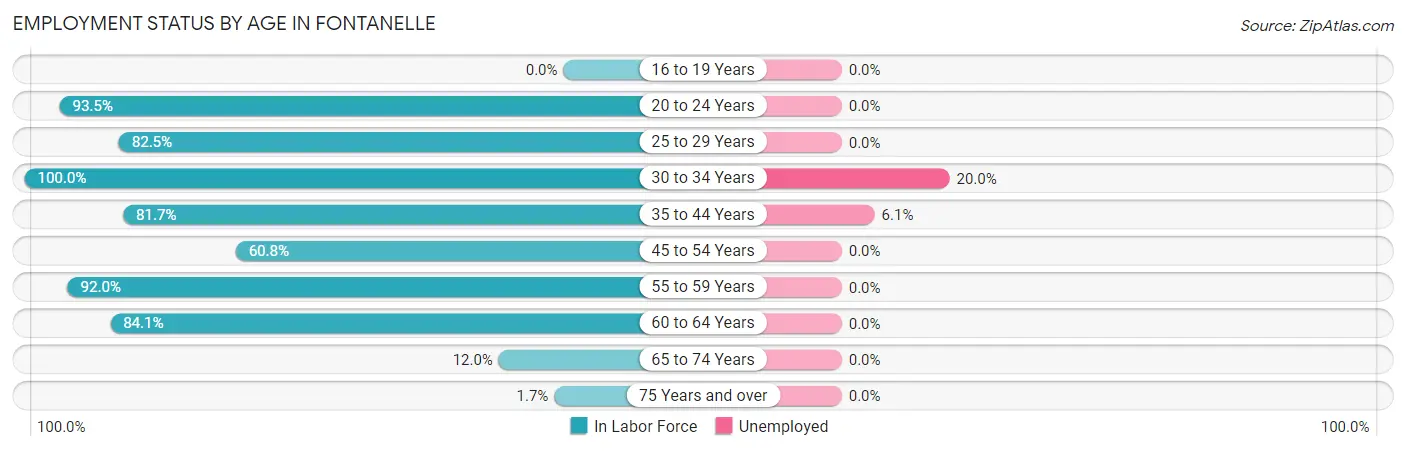
| Age Bracket | In Labor Force | Unemployed |
| 16 to 19 Years | 0 (0.0%) | 0 (0.0%) |
| 20 to 24 Years | 29 (93.5%) | 0 (0.0%) |
| 25 to 29 Years | 52 (82.5%) | 0 (0.0%) |
| 30 to 34 Years | 35 (100.0%) | 7 (20.0%) |
| 35 to 44 Years | 49 (81.7%) | 3 (6.1%) |
| 45 to 54 Years | 48 (60.8%) | 0 (0.0%) |
| 55 to 59 Years | 23 (92.0%) | 0 (0.0%) |
| 60 to 64 Years | 37 (84.1%) | 0 (0.0%) |
| 65 to 74 Years | 11 (12.0%) | 0 (0.0%) |
| 75 Years and over | 1 (1.7%) | 0 (0.0%) |
| Total | 285 (57.9%) | 10 (3.5%) |
Employment Status by Educational Attainment in Fontanelle
According to labor force statistics for Fontanelle, 79.7% of individuals (244) out of the total population between 25 and 64 years of age (306) are in the labor force, with 4.1% or 10 of them being unemployed. The group with the highest labor force participation rate are those with the educational attainment of high school diploma, with 81.6% or 102 individuals in the labor force. Within the labor force, individuals with bachelor's degree or higher education have the highest percentage of unemployment, with 7.7% or 3 of them being unemployed.
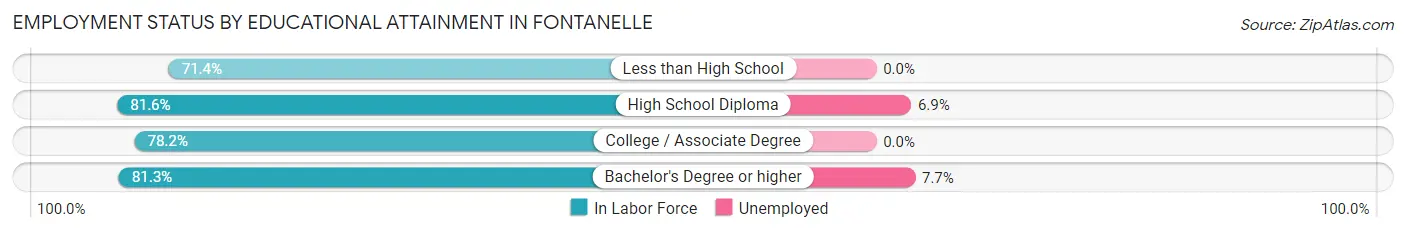
| Educational Attainment | In Labor Force | Unemployed |
| Less than High School | 10 (71.4%) | 0 (0.0%) |
| High School Diploma | 102 (81.6%) | 9 (6.9%) |
| College / Associate Degree | 93 (78.2%) | 0 (0.0%) |
| Bachelor's Degree or higher | 39 (81.3%) | 4 (7.7%) |
| Total | 244 (79.7%) | 13 (4.1%) |
Employment Occupations by Sex in Fontanelle
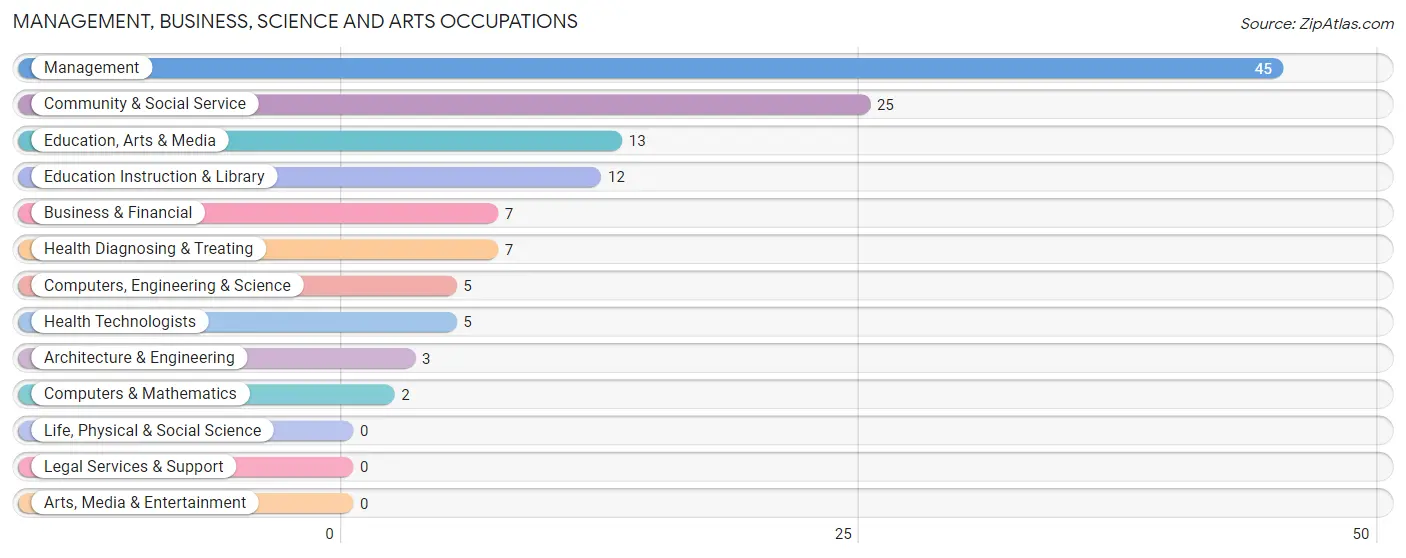
Management, Business, Science and Arts Occupations
The most common Management, Business, Science and Arts occupations in Fontanelle are Management (45 | 16.4%), Community & Social Service (25 | 9.1%), Education, Arts & Media (13 | 4.7%), Education Instruction & Library (12 | 4.4%), and Business & Financial (7 | 2.5%).
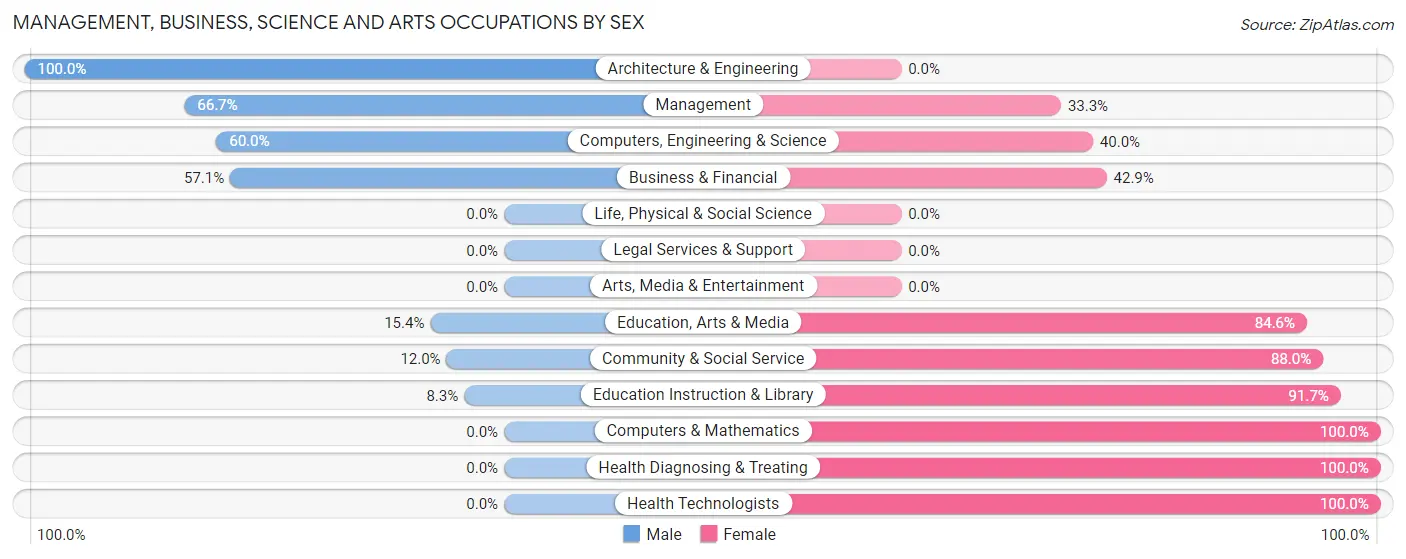
Management, Business, Science and Arts Occupations by Sex
Within the Management, Business, Science and Arts occupations in Fontanelle, the most male-oriented occupations are Architecture & Engineering (100.0%), Management (66.7%), and Computers, Engineering & Science (60.0%), while the most female-oriented occupations are Computers & Mathematics (100.0%), Health Diagnosing & Treating (100.0%), and Health Technologists (100.0%).
| Occupation | Male | Female |
| Management | 30 (66.7%) | 15 (33.3%) |
| Business & Financial | 4 (57.1%) | 3 (42.9%) |
| Computers, Engineering & Science | 3 (60.0%) | 2 (40.0%) |
| Computers & Mathematics | 0 (0.0%) | 2 (100.0%) |
| Architecture & Engineering | 3 (100.0%) | 0 (0.0%) |
| Life, Physical & Social Science | 0 (0.0%) | 0 (0.0%) |
| Community & Social Service | 3 (12.0%) | 22 (88.0%) |
| Education, Arts & Media | 2 (15.4%) | 11 (84.6%) |
| Legal Services & Support | 0 (0.0%) | 0 (0.0%) |
| Education Instruction & Library | 1 (8.3%) | 11 (91.7%) |
| Arts, Media & Entertainment | 0 (0.0%) | 0 (0.0%) |
| Health Diagnosing & Treating | 0 (0.0%) | 7 (100.0%) |
| Health Technologists | 0 (0.0%) | 5 (100.0%) |
| Total (Category) | 40 (44.9%) | 49 (55.1%) |
| Total (Overall) | 142 (51.6%) | 133 (48.4%) |
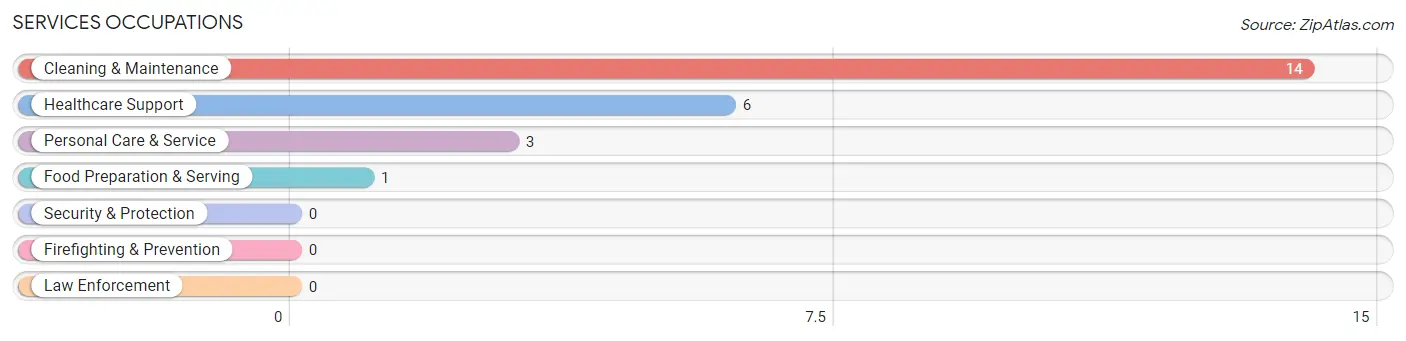
Services Occupations
The most common Services occupations in Fontanelle are Cleaning & Maintenance (14 | 5.1%), Healthcare Support (6 | 2.2%), Personal Care & Service (3 | 1.1%), and Food Preparation & Serving (1 | 0.4%).
Services Occupations by Sex
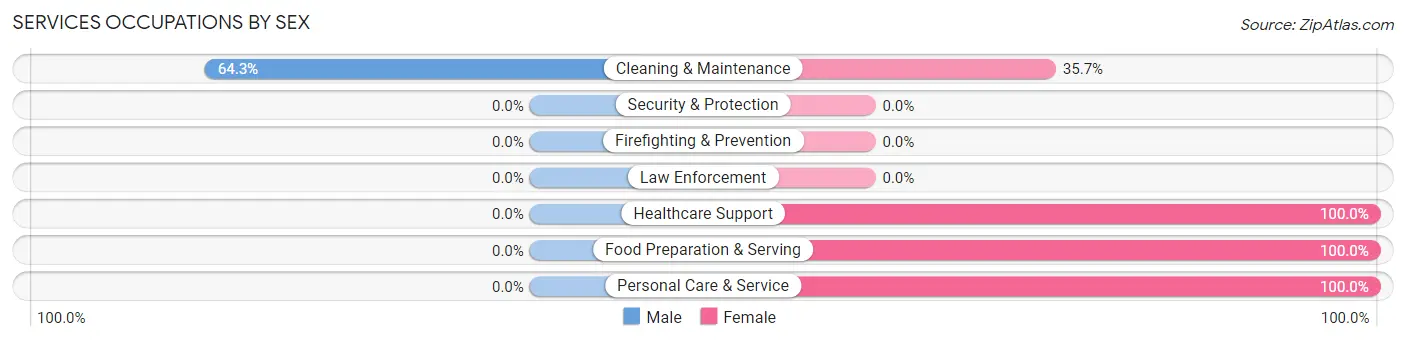
| Occupation | Male | Female |
| Healthcare Support | 0 (0.0%) | 6 (100.0%) |
| Security & Protection | 0 (0.0%) | 0 (0.0%) |
| Firefighting & Prevention | 0 (0.0%) | 0 (0.0%) |
| Law Enforcement | 0 (0.0%) | 0 (0.0%) |
| Food Preparation & Serving | 0 (0.0%) | 1 (100.0%) |
| Cleaning & Maintenance | 9 (64.3%) | 5 (35.7%) |
| Personal Care & Service | 0 (0.0%) | 3 (100.0%) |
| Total (Category) | 9 (37.5%) | 15 (62.5%) |
| Total (Overall) | 142 (51.6%) | 133 (48.4%) |
Sales and Office Occupations
The most common Sales and Office occupations in Fontanelle are Office & Administration (32 | 11.6%), and Sales & Related (11 | 4.0%).
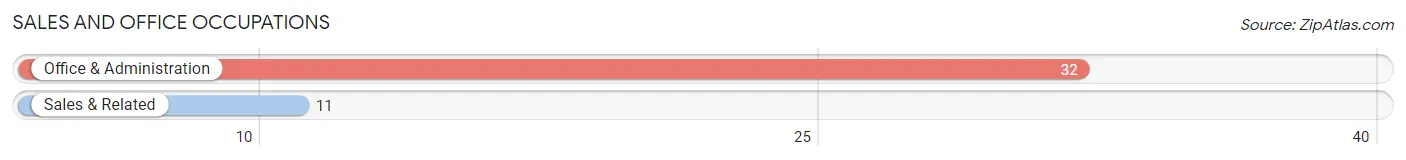
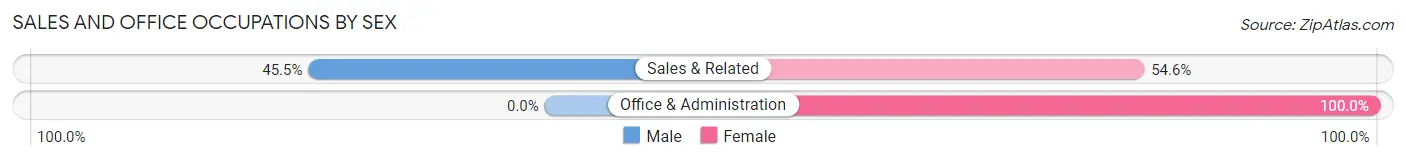
Sales and Office Occupations by Sex
| Occupation | Male | Female |
| Sales & Related | 5 (45.5%) | 6 (54.5%) |
| Office & Administration | 0 (0.0%) | 32 (100.0%) |
| Total (Category) | 5 (11.6%) | 38 (88.4%) |
| Total (Overall) | 142 (51.6%) | 133 (48.4%) |
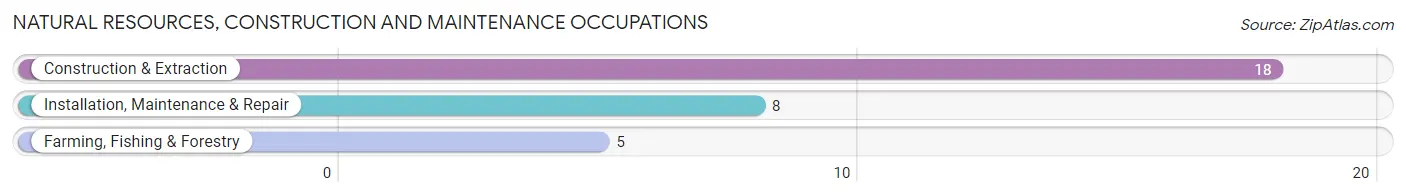
Natural Resources, Construction and Maintenance Occupations
The most common Natural Resources, Construction and Maintenance occupations in Fontanelle are Construction & Extraction (18 | 6.6%), Installation, Maintenance & Repair (8 | 2.9%), and Farming, Fishing & Forestry (5 | 1.8%).
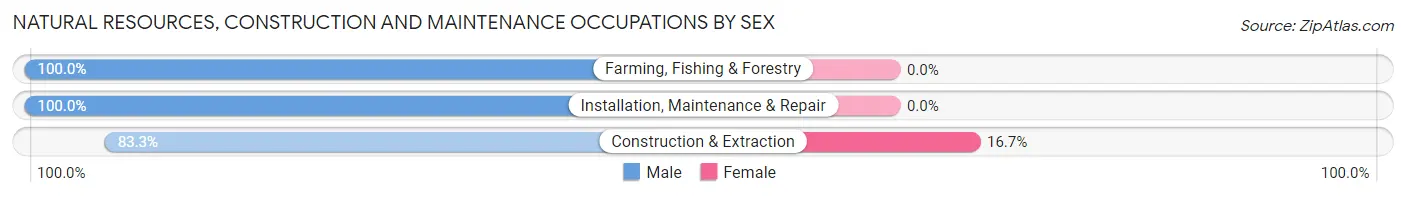
Natural Resources, Construction and Maintenance Occupations by Sex
| Occupation | Male | Female |
| Farming, Fishing & Forestry | 5 (100.0%) | 0 (0.0%) |
| Construction & Extraction | 15 (83.3%) | 3 (16.7%) |
| Installation, Maintenance & Repair | 8 (100.0%) | 0 (0.0%) |
| Total (Category) | 28 (90.3%) | 3 (9.7%) |
| Total (Overall) | 142 (51.6%) | 133 (48.4%) |
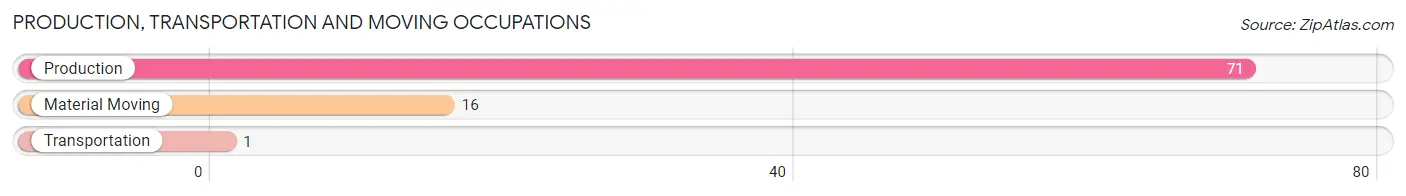
Production, Transportation and Moving Occupations
The most common Production, Transportation and Moving occupations in Fontanelle are Production (71 | 25.8%), Material Moving (16 | 5.8%), and Transportation (1 | 0.4%).
Production, Transportation and Moving Occupations by Sex
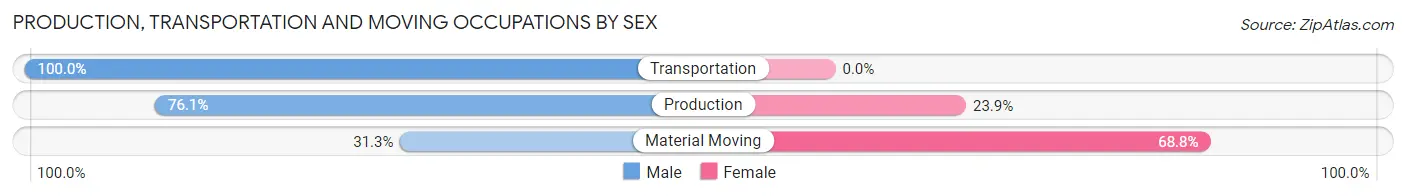
| Occupation | Male | Female |
| Production | 54 (76.1%) | 17 (23.9%) |
| Transportation | 1 (100.0%) | 0 (0.0%) |
| Material Moving | 5 (31.2%) | 11 (68.8%) |
| Total (Category) | 60 (68.2%) | 28 (31.8%) |
| Total (Overall) | 142 (51.6%) | 133 (48.4%) |
Employment Industries by Sex in Fontanelle
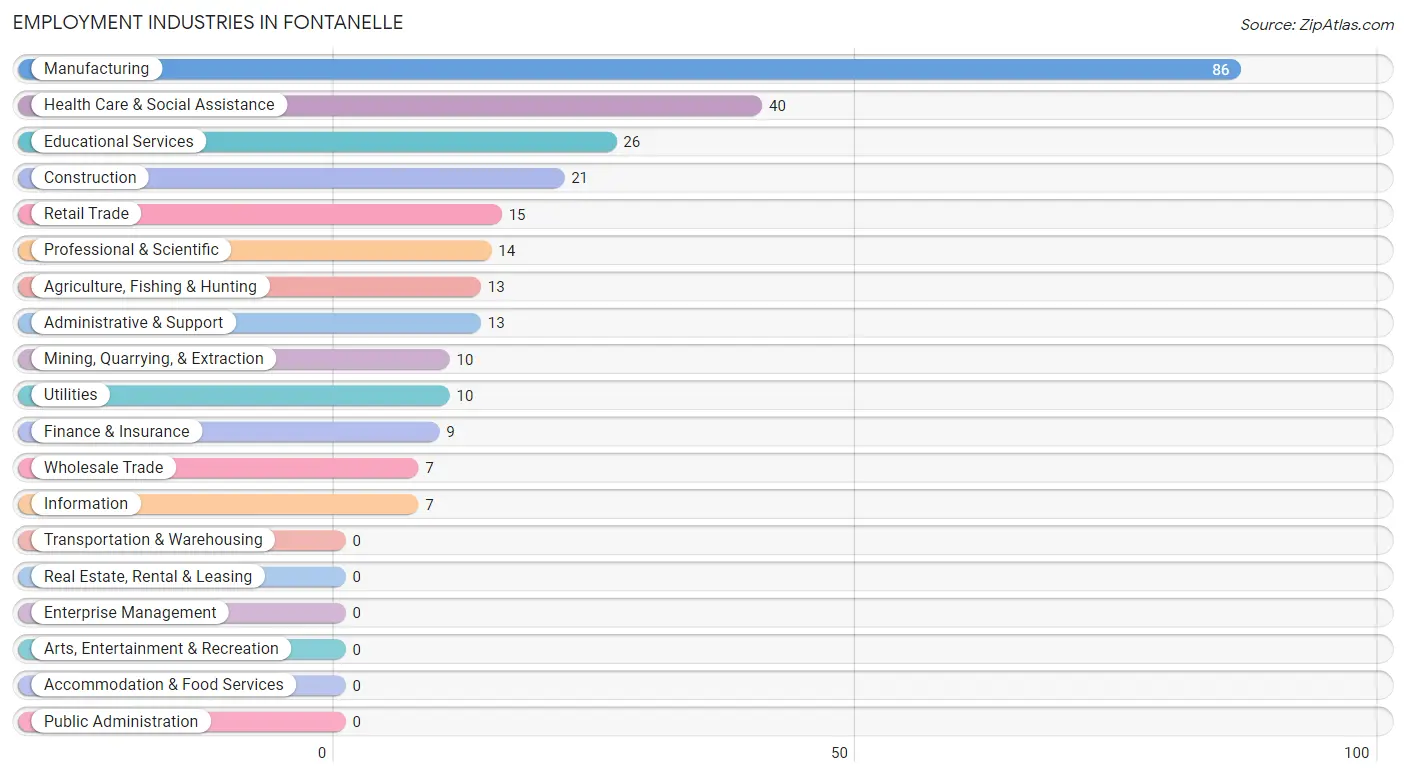
Employment Industries in Fontanelle
The major employment industries in Fontanelle include Manufacturing (86 | 31.3%), Health Care & Social Assistance (40 | 14.5%), Educational Services (26 | 9.5%), Construction (21 | 7.6%), and Retail Trade (15 | 5.4%).
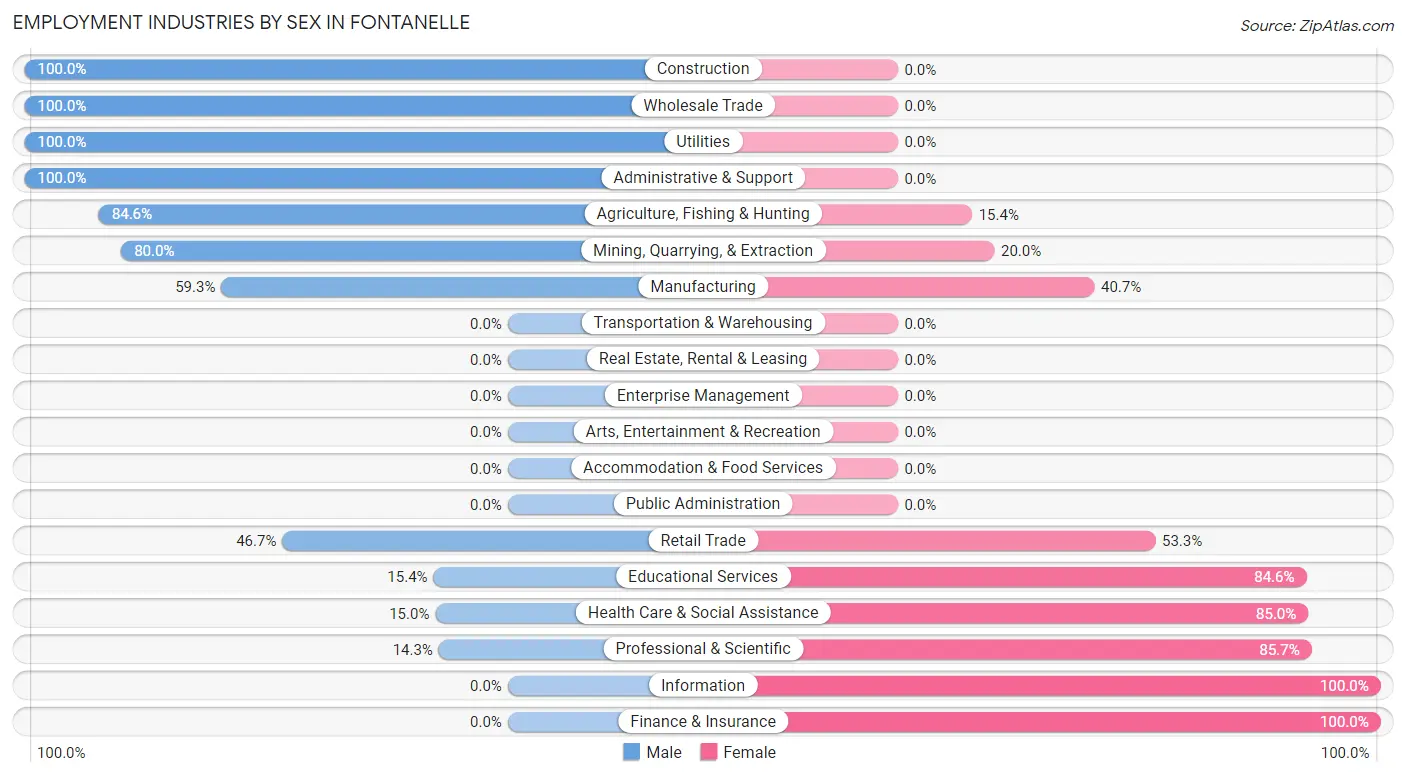
Employment Industries by Sex in Fontanelle
The Fontanelle industries that see more men than women are Construction (100.0%), Wholesale Trade (100.0%), and Utilities (100.0%), whereas the industries that tend to have a higher number of women are Information (100.0%), Finance & Insurance (100.0%), and Professional & Scientific (85.7%).
| Industry | Male | Female |
| Agriculture, Fishing & Hunting | 11 (84.6%) | 2 (15.4%) |
| Mining, Quarrying, & Extraction | 8 (80.0%) | 2 (20.0%) |
| Construction | 21 (100.0%) | 0 (0.0%) |
| Manufacturing | 51 (59.3%) | 35 (40.7%) |
| Wholesale Trade | 7 (100.0%) | 0 (0.0%) |
| Retail Trade | 7 (46.7%) | 8 (53.3%) |
| Transportation & Warehousing | 0 (0.0%) | 0 (0.0%) |
| Utilities | 10 (100.0%) | 0 (0.0%) |
| Information | 0 (0.0%) | 7 (100.0%) |
| Finance & Insurance | 0 (0.0%) | 9 (100.0%) |
| Real Estate, Rental & Leasing | 0 (0.0%) | 0 (0.0%) |
| Professional & Scientific | 2 (14.3%) | 12 (85.7%) |
| Enterprise Management | 0 (0.0%) | 0 (0.0%) |
| Administrative & Support | 13 (100.0%) | 0 (0.0%) |
| Educational Services | 4 (15.4%) | 22 (84.6%) |
| Health Care & Social Assistance | 6 (15.0%) | 34 (85.0%) |
| Arts, Entertainment & Recreation | 0 (0.0%) | 0 (0.0%) |
| Accommodation & Food Services | 0 (0.0%) | 0 (0.0%) |
| Public Administration | 0 (0.0%) | 0 (0.0%) |
| Total | 142 (51.6%) | 133 (48.4%) |
Education in Fontanelle
School Enrollment in Fontanelle
The most common levels of schooling among the 109 students in Fontanelle are middle school (33 | 30.3%), elementary school (28 | 25.7%), and high school (23 | 21.1%).
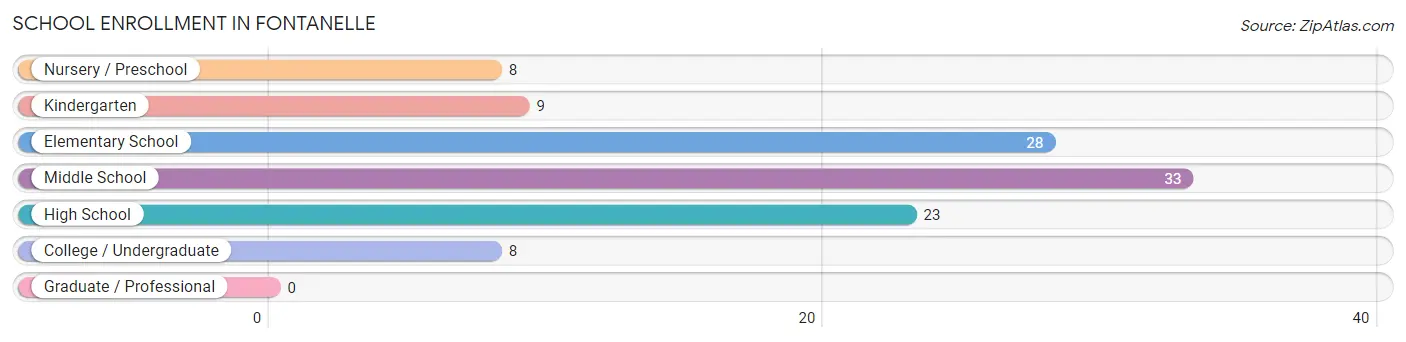
| School Level | # Students | % Students |
| Nursery / Preschool | 8 | 7.3% |
| Kindergarten | 9 | 8.3% |
| Elementary School | 28 | 25.7% |
| Middle School | 33 | 30.3% |
| High School | 23 | 21.1% |
| College / Undergraduate | 8 | 7.3% |
| Graduate / Professional | 0 | 0.0% |
| Total | 109 | 100.0% |
School Enrollment by Age by Funding Source in Fontanelle
Out of a total of 109 students who are enrolled in schools in Fontanelle, 5 (4.6%) attend a private institution, while the remaining 104 (95.4%) are enrolled in public schools. The age group of 35 years and over has the highest likelihood of being enrolled in private schools, with 3 (37.5% in the age bracket) enrolled. Conversely, the age group of 3 to 4 year olds has the lowest likelihood of being enrolled in a private school, with 3 (100.0% in the age bracket) attending a public institution.
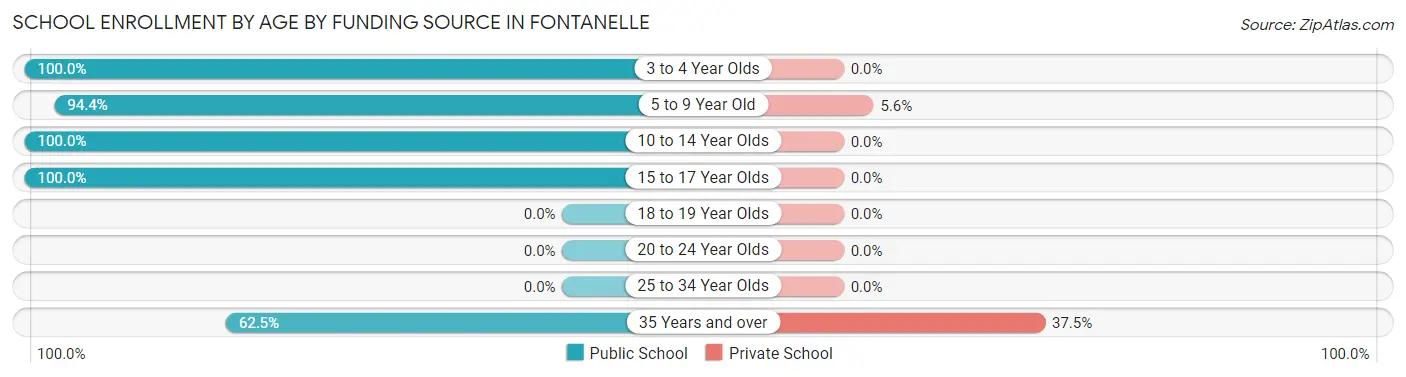
| Age Bracket | Public School | Private School |
| 3 to 4 Year Olds | 3 (100.0%) | 0 (0.0%) |
| 5 to 9 Year Old | 34 (94.4%) | 2 (5.6%) |
| 10 to 14 Year Olds | 54 (100.0%) | 0 (0.0%) |
| 15 to 17 Year Olds | 8 (100.0%) | 0 (0.0%) |
| 18 to 19 Year Olds | 0 (0.0%) | 0 (0.0%) |
| 20 to 24 Year Olds | 0 (0.0%) | 0 (0.0%) |
| 25 to 34 Year Olds | 0 (0.0%) | 0 (0.0%) |
| 35 Years and over | 5 (62.5%) | 3 (37.5%) |
| Total | 104 (95.4%) | 5 (4.6%) |
Educational Attainment by Field of Study in Fontanelle
Education (18 | 30.5%), psychology (15 | 25.4%), business (12 | 20.3%), science & technology (5 | 8.5%), and arts & humanities (3 | 5.1%) are the most common fields of study among 59 individuals in Fontanelle who have obtained a bachelor's degree or higher.
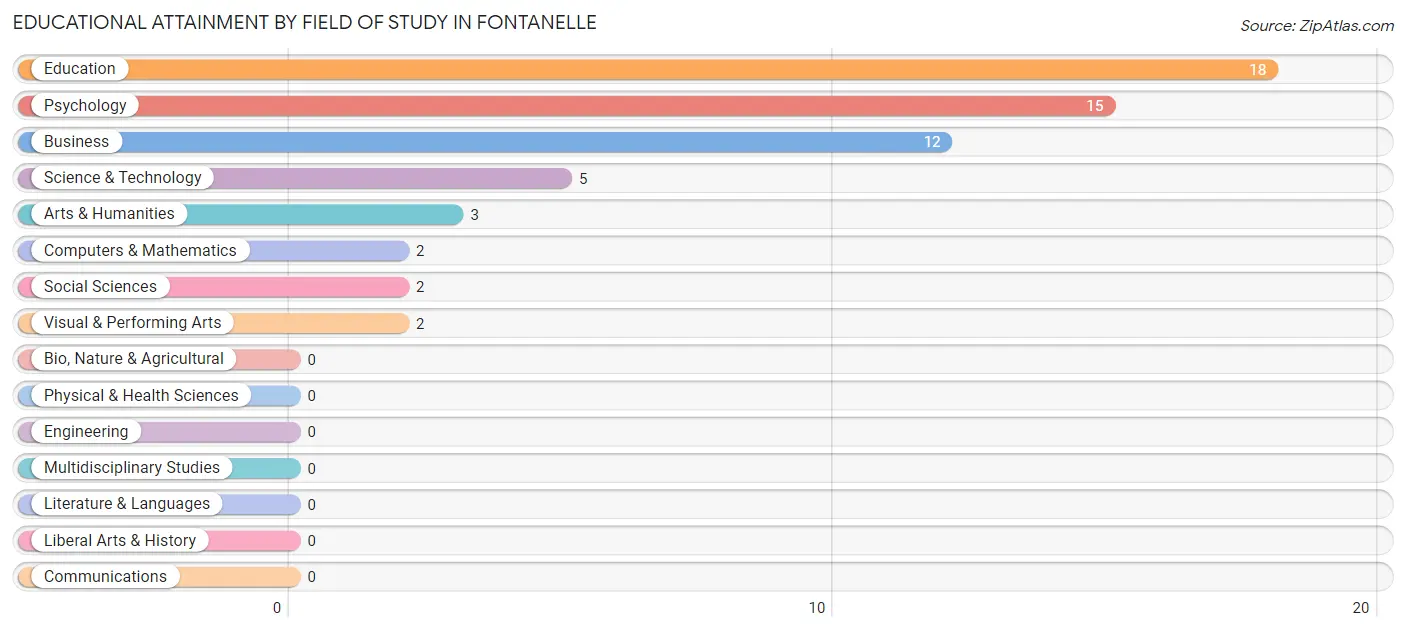
| Field of Study | # Graduates | % Graduates |
| Computers & Mathematics | 2 | 3.4% |
| Bio, Nature & Agricultural | 0 | 0.0% |
| Physical & Health Sciences | 0 | 0.0% |
| Psychology | 15 | 25.4% |
| Social Sciences | 2 | 3.4% |
| Engineering | 0 | 0.0% |
| Multidisciplinary Studies | 0 | 0.0% |
| Science & Technology | 5 | 8.5% |
| Business | 12 | 20.3% |
| Education | 18 | 30.5% |
| Literature & Languages | 0 | 0.0% |
| Liberal Arts & History | 0 | 0.0% |
| Visual & Performing Arts | 2 | 3.4% |
| Communications | 0 | 0.0% |
| Arts & Humanities | 3 | 5.1% |
| Total | 59 | 100.0% |
Transportation & Commute in Fontanelle
Vehicle Availability by Sex in Fontanelle
The most prevalent vehicle ownership categories in Fontanelle are males with 2 vehicles (59, accounting for 41.5%) and females with 2 vehicles (36, making up 45.0%).
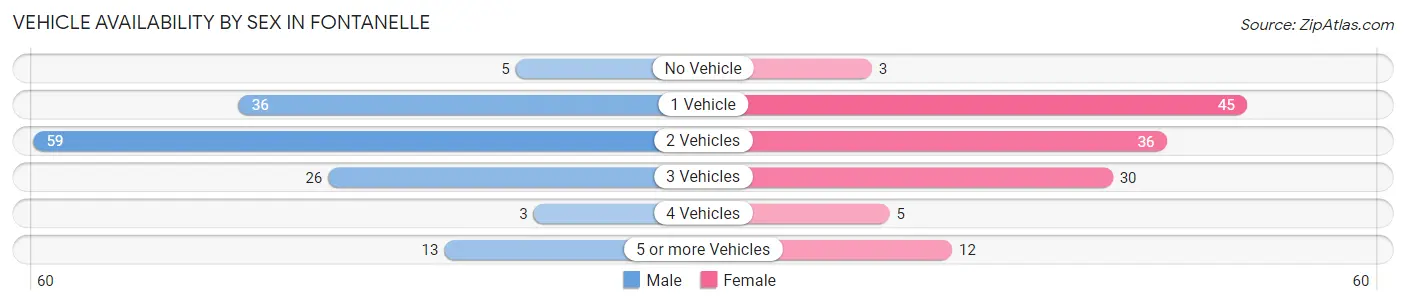
| Vehicles Available | Male | Female |
| No Vehicle | 5 (3.5%) | 3 (2.3%) |
| 1 Vehicle | 36 (25.4%) | 45 (34.4%) |
| 2 Vehicles | 59 (41.5%) | 36 (27.5%) |
| 3 Vehicles | 26 (18.3%) | 30 (22.9%) |
| 4 Vehicles | 3 (2.1%) | 5 (3.8%) |
| 5 or more Vehicles | 13 (9.1%) | 12 (9.2%) |
| Total | 142 (100.0%) | 131 (100.0%) |
Commute Time in Fontanelle
The most frequently occuring commute durations in Fontanelle are 10 to 14 minutes (59 commuters, 23.0%), 30 to 34 minutes (40 commuters, 15.6%), and 5 to 9 minutes (38 commuters, 14.8%).
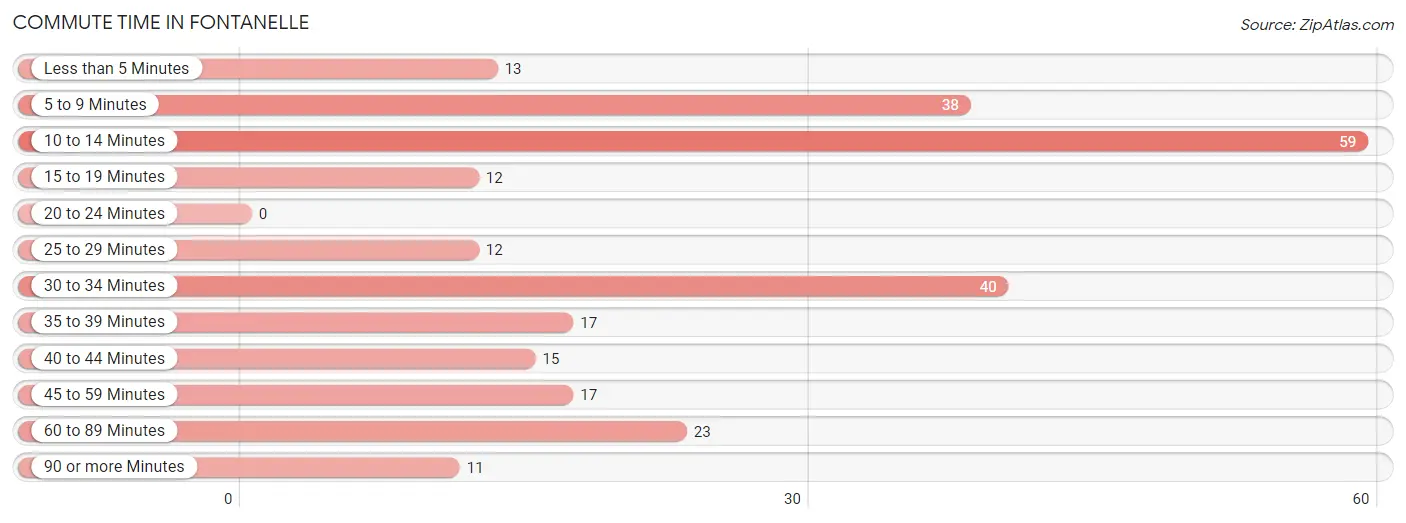
| Commute Time | # Commuters | % Commuters |
| Less than 5 Minutes | 13 | 5.1% |
| 5 to 9 Minutes | 38 | 14.8% |
| 10 to 14 Minutes | 59 | 23.0% |
| 15 to 19 Minutes | 12 | 4.7% |
| 20 to 24 Minutes | 0 | 0.0% |
| 25 to 29 Minutes | 12 | 4.7% |
| 30 to 34 Minutes | 40 | 15.6% |
| 35 to 39 Minutes | 17 | 6.6% |
| 40 to 44 Minutes | 15 | 5.8% |
| 45 to 59 Minutes | 17 | 6.6% |
| 60 to 89 Minutes | 23 | 8.9% |
| 90 or more Minutes | 11 | 4.3% |
Commute Time by Sex in Fontanelle
The most common commute times in Fontanelle are 30 to 34 minutes (34 commuters, 23.9%) for males and 10 to 14 minutes (28 commuters, 24.3%) for females.
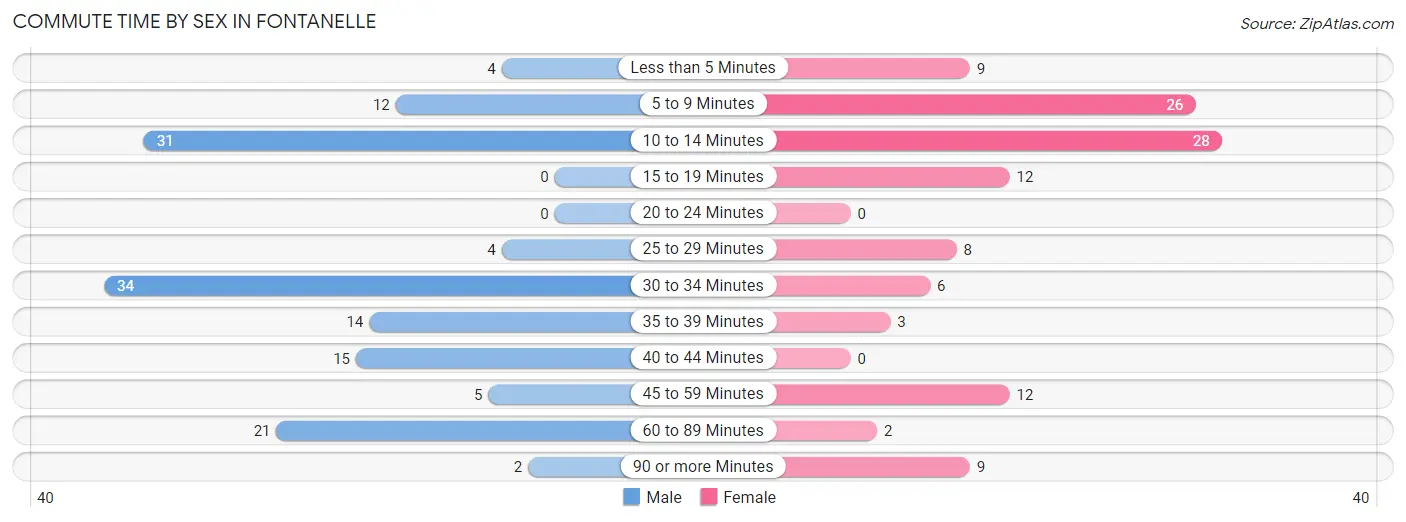
| Commute Time | Male | Female |
| Less than 5 Minutes | 4 (2.8%) | 9 (7.8%) |
| 5 to 9 Minutes | 12 (8.5%) | 26 (22.6%) |
| 10 to 14 Minutes | 31 (21.8%) | 28 (24.3%) |
| 15 to 19 Minutes | 0 (0.0%) | 12 (10.4%) |
| 20 to 24 Minutes | 0 (0.0%) | 0 (0.0%) |
| 25 to 29 Minutes | 4 (2.8%) | 8 (7.0%) |
| 30 to 34 Minutes | 34 (23.9%) | 6 (5.2%) |
| 35 to 39 Minutes | 14 (9.9%) | 3 (2.6%) |
| 40 to 44 Minutes | 15 (10.6%) | 0 (0.0%) |
| 45 to 59 Minutes | 5 (3.5%) | 12 (10.4%) |
| 60 to 89 Minutes | 21 (14.8%) | 2 (1.7%) |
| 90 or more Minutes | 2 (1.4%) | 9 (7.8%) |
Time of Departure to Work by Sex in Fontanelle
The most frequent times of departure to work in Fontanelle are 5:00 AM to 5:29 AM (30, 21.1%) for males and 7:30 AM to 7:59 AM (25, 21.7%) for females.
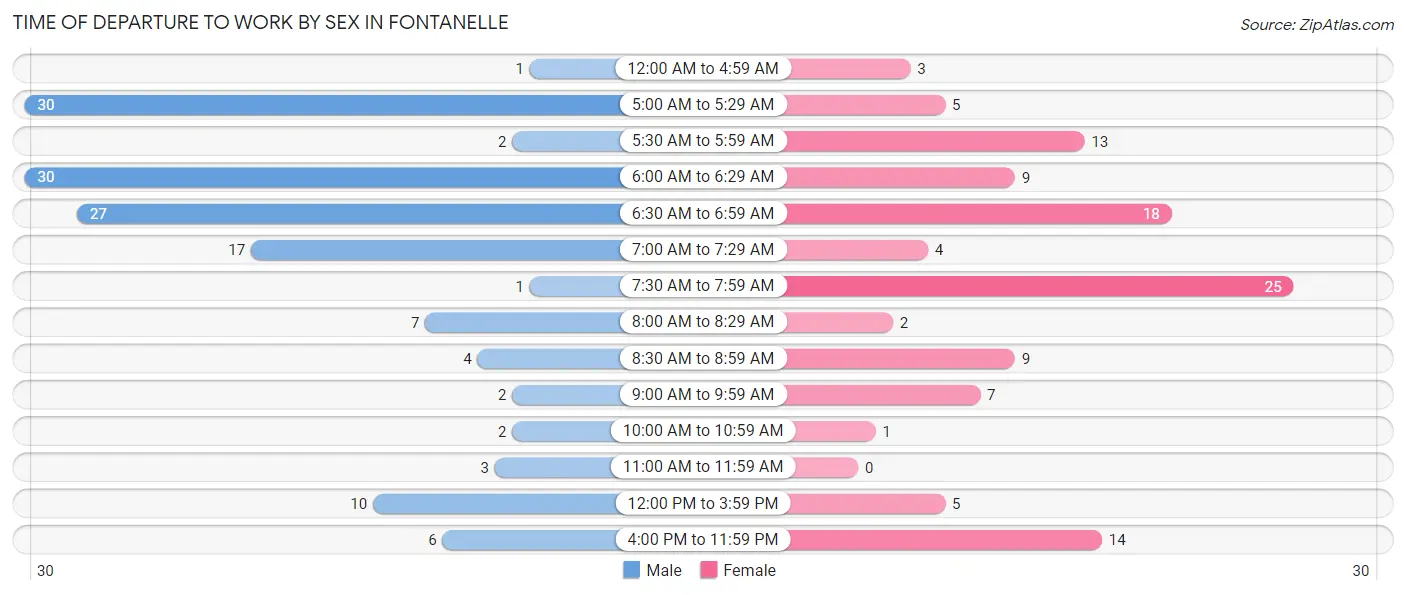
| Time of Departure | Male | Female |
| 12:00 AM to 4:59 AM | 1 (0.7%) | 3 (2.6%) |
| 5:00 AM to 5:29 AM | 30 (21.1%) | 5 (4.3%) |
| 5:30 AM to 5:59 AM | 2 (1.4%) | 13 (11.3%) |
| 6:00 AM to 6:29 AM | 30 (21.1%) | 9 (7.8%) |
| 6:30 AM to 6:59 AM | 27 (19.0%) | 18 (15.7%) |
| 7:00 AM to 7:29 AM | 17 (12.0%) | 4 (3.5%) |
| 7:30 AM to 7:59 AM | 1 (0.7%) | 25 (21.7%) |
| 8:00 AM to 8:29 AM | 7 (4.9%) | 2 (1.7%) |
| 8:30 AM to 8:59 AM | 4 (2.8%) | 9 (7.8%) |
| 9:00 AM to 9:59 AM | 2 (1.4%) | 7 (6.1%) |
| 10:00 AM to 10:59 AM | 2 (1.4%) | 1 (0.9%) |
| 11:00 AM to 11:59 AM | 3 (2.1%) | 0 (0.0%) |
| 12:00 PM to 3:59 PM | 10 (7.0%) | 5 (4.3%) |
| 4:00 PM to 11:59 PM | 6 (4.2%) | 14 (12.2%) |
| Total | 142 (100.0%) | 115 (100.0%) |
Housing Occupancy in Fontanelle
Occupancy by Ownership in Fontanelle
Of the total 281 dwellings in Fontanelle, owner-occupied units account for 203 (72.2%), while renter-occupied units make up 78 (27.8%).
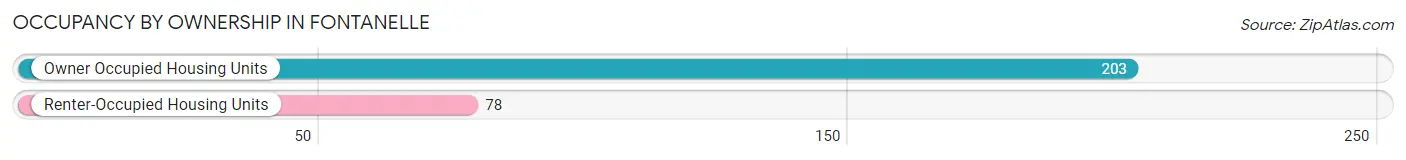
| Occupancy | # Housing Units | % Housing Units |
| Owner Occupied Housing Units | 203 | 72.2% |
| Renter-Occupied Housing Units | 78 | 27.8% |
| Total Occupied Housing Units | 281 | 100.0% |
Occupancy by Household Size in Fontanelle
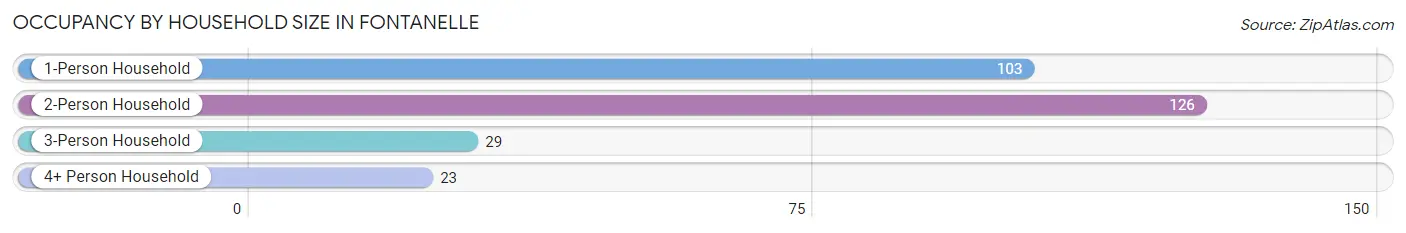
| Household Size | # Housing Units | % Housing Units |
| 1-Person Household | 103 | 36.6% |
| 2-Person Household | 126 | 44.8% |
| 3-Person Household | 29 | 10.3% |
| 4+ Person Household | 23 | 8.2% |
| Total Housing Units | 281 | 100.0% |
Occupancy by Ownership by Household Size in Fontanelle
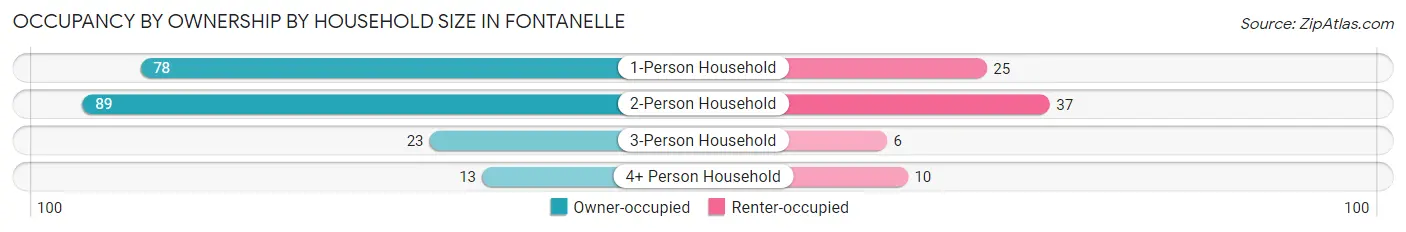
| Household Size | Owner-occupied | Renter-occupied |
| 1-Person Household | 78 (75.7%) | 25 (24.3%) |
| 2-Person Household | 89 (70.6%) | 37 (29.4%) |
| 3-Person Household | 23 (79.3%) | 6 (20.7%) |
| 4+ Person Household | 13 (56.5%) | 10 (43.5%) |
| Total Housing Units | 203 (72.2%) | 78 (27.8%) |
Occupancy by Educational Attainment in Fontanelle
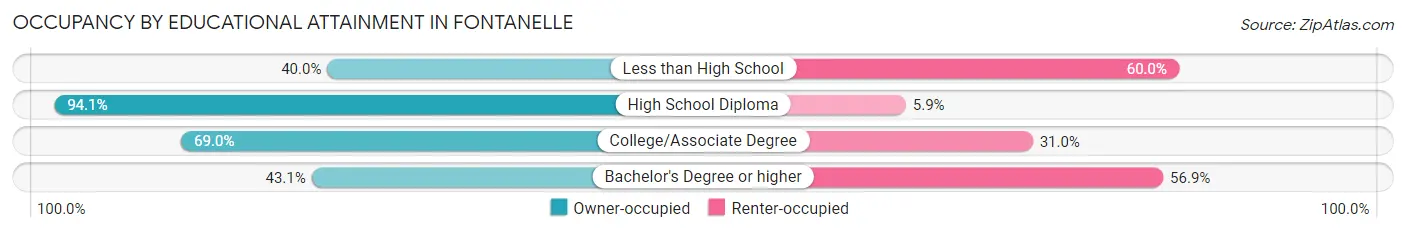
| Household Size | Owner-occupied | Renter-occupied |
| Less than High School | 2 (40.0%) | 3 (60.0%) |
| High School Diploma | 96 (94.1%) | 6 (5.9%) |
| College/Associate Degree | 80 (69.0%) | 36 (31.0%) |
| Bachelor's Degree or higher | 25 (43.1%) | 33 (56.9%) |
Occupancy by Age of Householder in Fontanelle
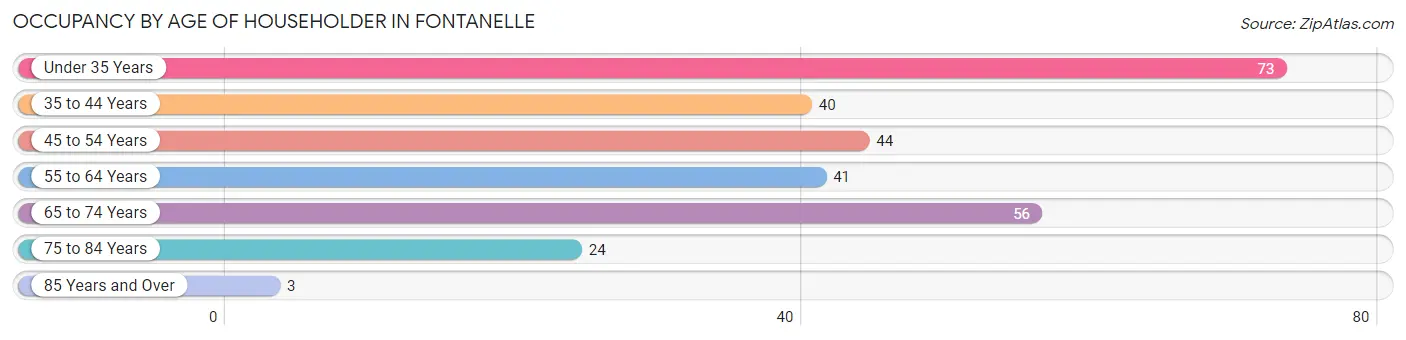
| Age Bracket | # Households | % Households |
| Under 35 Years | 73 | 26.0% |
| 35 to 44 Years | 40 | 14.2% |
| 45 to 54 Years | 44 | 15.7% |
| 55 to 64 Years | 41 | 14.6% |
| 65 to 74 Years | 56 | 19.9% |
| 75 to 84 Years | 24 | 8.5% |
| 85 Years and Over | 3 | 1.1% |
| Total | 281 | 100.0% |
Housing Finances in Fontanelle
Median Income by Occupancy in Fontanelle
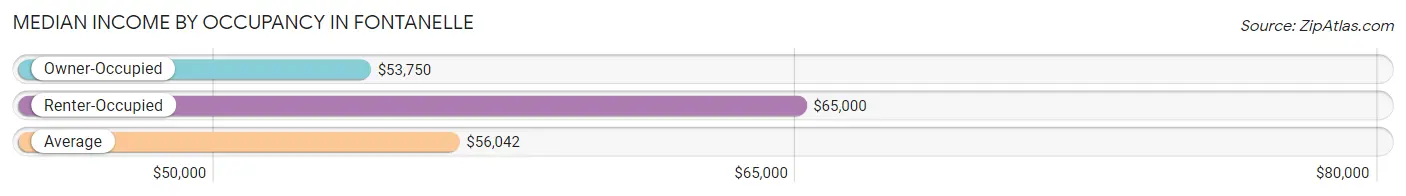
| Occupancy Type | # Households | Median Income |
| Owner-Occupied | 203 (72.2%) | $53,750 |
| Renter-Occupied | 78 (27.8%) | $65,000 |
| Average | 281 (100.0%) | $56,042 |
Occupancy by Householder Income Bracket in Fontanelle
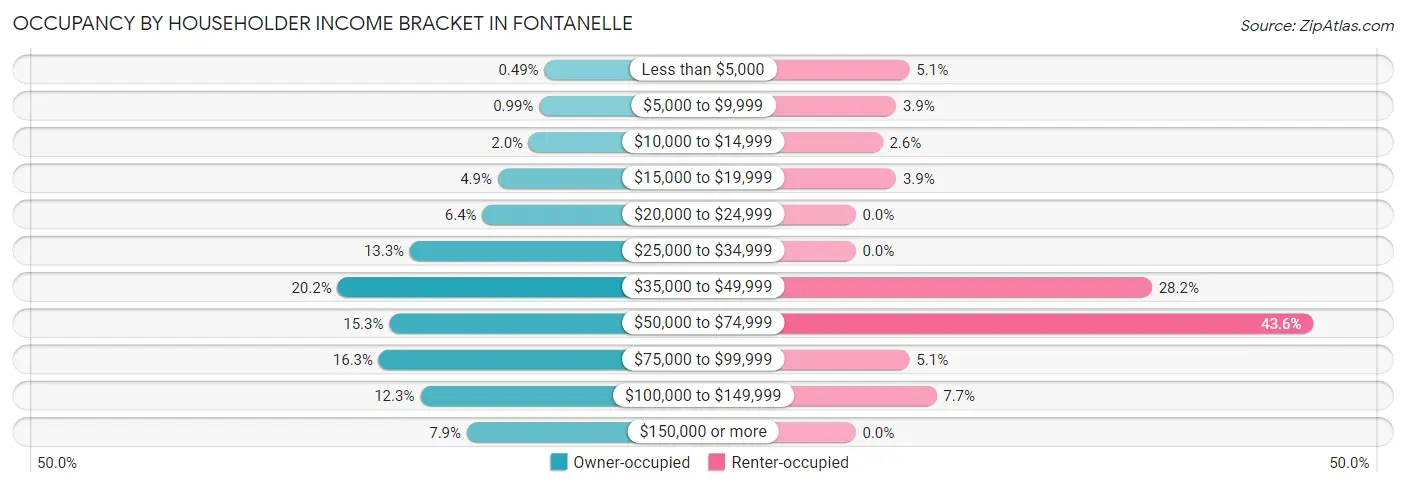
| Income Bracket | Owner-occupied | Renter-occupied |
| Less than $5,000 | 1 (0.5%) | 4 (5.1%) |
| $5,000 to $9,999 | 2 (1.0%) | 3 (3.8%) |
| $10,000 to $14,999 | 4 (2.0%) | 2 (2.6%) |
| $15,000 to $19,999 | 10 (4.9%) | 3 (3.8%) |
| $20,000 to $24,999 | 13 (6.4%) | 0 (0.0%) |
| $25,000 to $34,999 | 27 (13.3%) | 0 (0.0%) |
| $35,000 to $49,999 | 41 (20.2%) | 22 (28.2%) |
| $50,000 to $74,999 | 31 (15.3%) | 34 (43.6%) |
| $75,000 to $99,999 | 33 (16.3%) | 4 (5.1%) |
| $100,000 to $149,999 | 25 (12.3%) | 6 (7.7%) |
| $150,000 or more | 16 (7.9%) | 0 (0.0%) |
| Total | 203 (100.0%) | 78 (100.0%) |
Monthly Housing Cost Tiers in Fontanelle
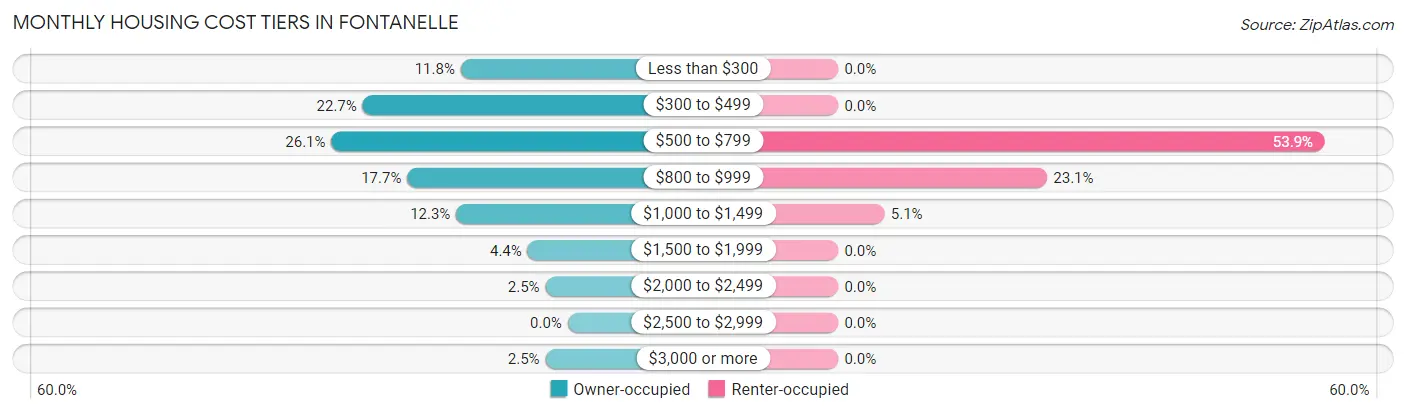
| Monthly Cost | Owner-occupied | Renter-occupied |
| Less than $300 | 24 (11.8%) | 0 (0.0%) |
| $300 to $499 | 46 (22.7%) | 0 (0.0%) |
| $500 to $799 | 53 (26.1%) | 42 (53.8%) |
| $800 to $999 | 36 (17.7%) | 18 (23.1%) |
| $1,000 to $1,499 | 25 (12.3%) | 4 (5.1%) |
| $1,500 to $1,999 | 9 (4.4%) | 0 (0.0%) |
| $2,000 to $2,499 | 5 (2.5%) | 0 (0.0%) |
| $2,500 to $2,999 | 0 (0.0%) | 0 (0.0%) |
| $3,000 or more | 5 (2.5%) | 0 (0.0%) |
| Total | 203 (100.0%) | 78 (100.0%) |
Physical Housing Characteristics in Fontanelle
Housing Structures in Fontanelle
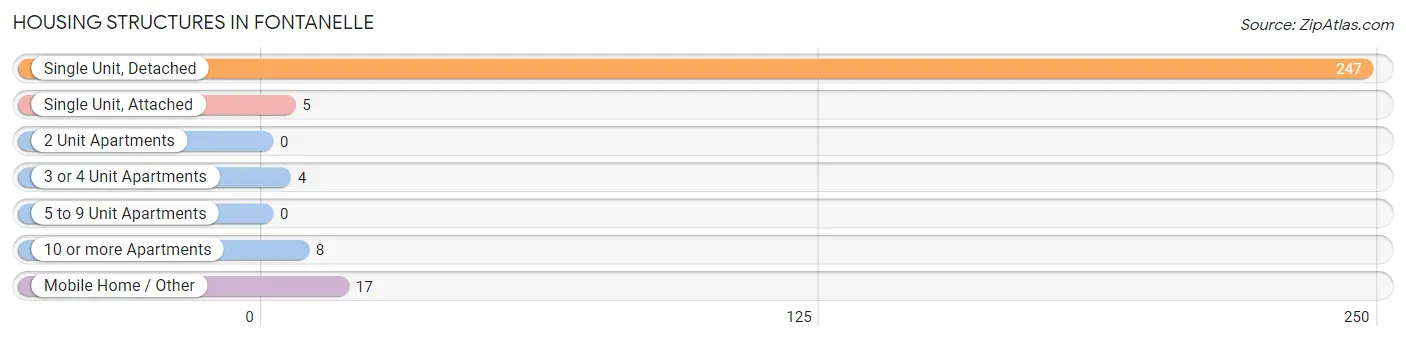
| Structure Type | # Housing Units | % Housing Units |
| Single Unit, Detached | 247 | 87.9% |
| Single Unit, Attached | 5 | 1.8% |
| 2 Unit Apartments | 0 | 0.0% |
| 3 or 4 Unit Apartments | 4 | 1.4% |
| 5 to 9 Unit Apartments | 0 | 0.0% |
| 10 or more Apartments | 8 | 2.9% |
| Mobile Home / Other | 17 | 6.0% |
| Total | 281 | 100.0% |
Housing Structures by Occupancy in Fontanelle
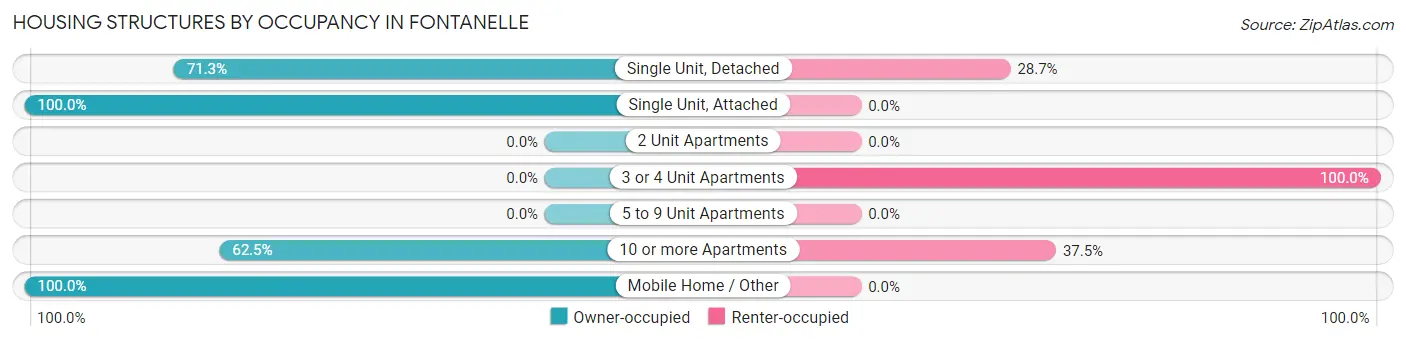
| Structure Type | Owner-occupied | Renter-occupied |
| Single Unit, Detached | 176 (71.3%) | 71 (28.7%) |
| Single Unit, Attached | 5 (100.0%) | 0 (0.0%) |
| 2 Unit Apartments | 0 (0.0%) | 0 (0.0%) |
| 3 or 4 Unit Apartments | 0 (0.0%) | 4 (100.0%) |
| 5 to 9 Unit Apartments | 0 (0.0%) | 0 (0.0%) |
| 10 or more Apartments | 5 (62.5%) | 3 (37.5%) |
| Mobile Home / Other | 17 (100.0%) | 0 (0.0%) |
| Total | 203 (72.2%) | 78 (27.8%) |
Housing Structures by Number of Rooms in Fontanelle
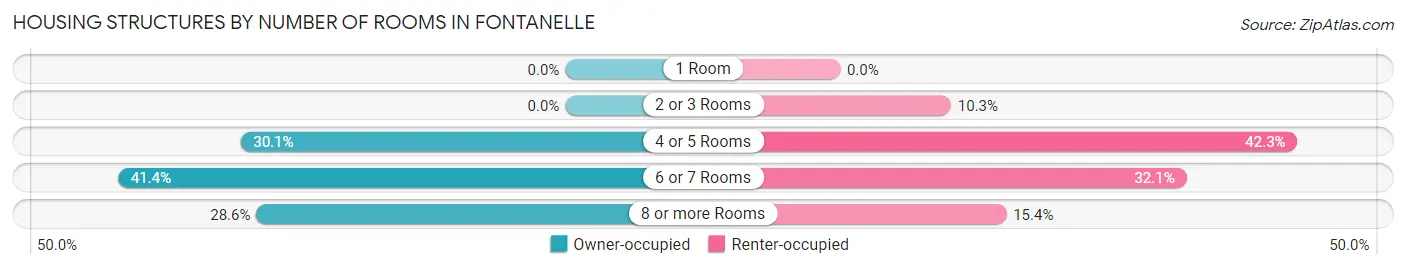
| Number of Rooms | Owner-occupied | Renter-occupied |
| 1 Room | 0 (0.0%) | 0 (0.0%) |
| 2 or 3 Rooms | 0 (0.0%) | 8 (10.3%) |
| 4 or 5 Rooms | 61 (30.0%) | 33 (42.3%) |
| 6 or 7 Rooms | 84 (41.4%) | 25 (32.1%) |
| 8 or more Rooms | 58 (28.6%) | 12 (15.4%) |
| Total | 203 (100.0%) | 78 (100.0%) |
Housing Structure by Heating Type in Fontanelle
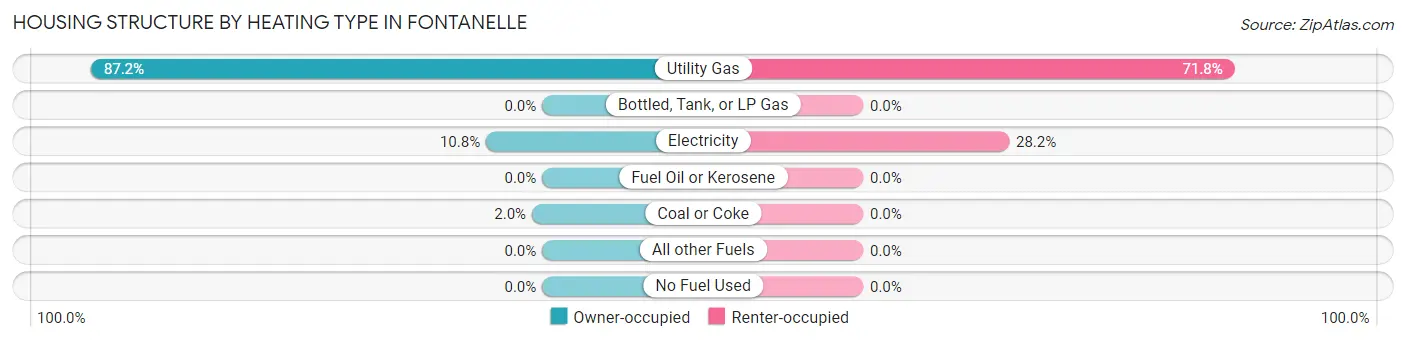
| Heating Type | Owner-occupied | Renter-occupied |
| Utility Gas | 177 (87.2%) | 56 (71.8%) |
| Bottled, Tank, or LP Gas | 0 (0.0%) | 0 (0.0%) |
| Electricity | 22 (10.8%) | 22 (28.2%) |
| Fuel Oil or Kerosene | 0 (0.0%) | 0 (0.0%) |
| Coal or Coke | 4 (2.0%) | 0 (0.0%) |
| All other Fuels | 0 (0.0%) | 0 (0.0%) |
| No Fuel Used | 0 (0.0%) | 0 (0.0%) |
| Total | 203 (100.0%) | 78 (100.0%) |
Household Vehicle Usage in Fontanelle
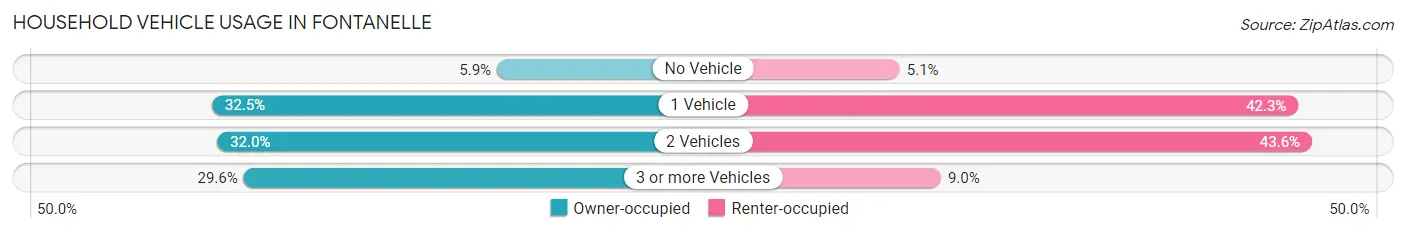
| Vehicles per Household | Owner-occupied | Renter-occupied |
| No Vehicle | 12 (5.9%) | 4 (5.1%) |
| 1 Vehicle | 66 (32.5%) | 33 (42.3%) |
| 2 Vehicles | 65 (32.0%) | 34 (43.6%) |
| 3 or more Vehicles | 60 (29.6%) | 7 (9.0%) |
| Total | 203 (100.0%) | 78 (100.0%) |
Real Estate & Mortgages in Fontanelle
Real Estate and Mortgage Overview in Fontanelle
| Characteristic | Without Mortgage | With Mortgage |
| Housing Units | 90 | 113 |
| Median Property Value | $90,000 | $84,400 |
| Median Household Income | $49,000 | $6 |
| Monthly Housing Costs | $440 | $5 |
| Real Estate Taxes | $1,214 | $0 |
Property Value by Mortgage Status in Fontanelle
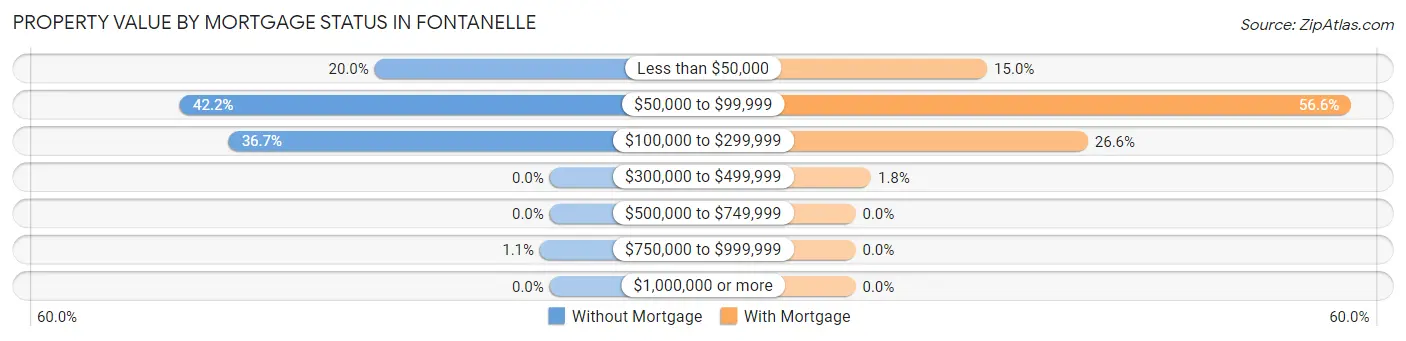
| Property Value | Without Mortgage | With Mortgage |
| Less than $50,000 | 18 (20.0%) | 17 (15.0%) |
| $50,000 to $99,999 | 38 (42.2%) | 64 (56.6%) |
| $100,000 to $299,999 | 33 (36.7%) | 30 (26.6%) |
| $300,000 to $499,999 | 0 (0.0%) | 2 (1.8%) |
| $500,000 to $749,999 | 0 (0.0%) | 0 (0.0%) |
| $750,000 to $999,999 | 1 (1.1%) | 0 (0.0%) |
| $1,000,000 or more | 0 (0.0%) | 0 (0.0%) |
| Total | 90 (100.0%) | 113 (100.0%) |
Household Income by Mortgage Status in Fontanelle
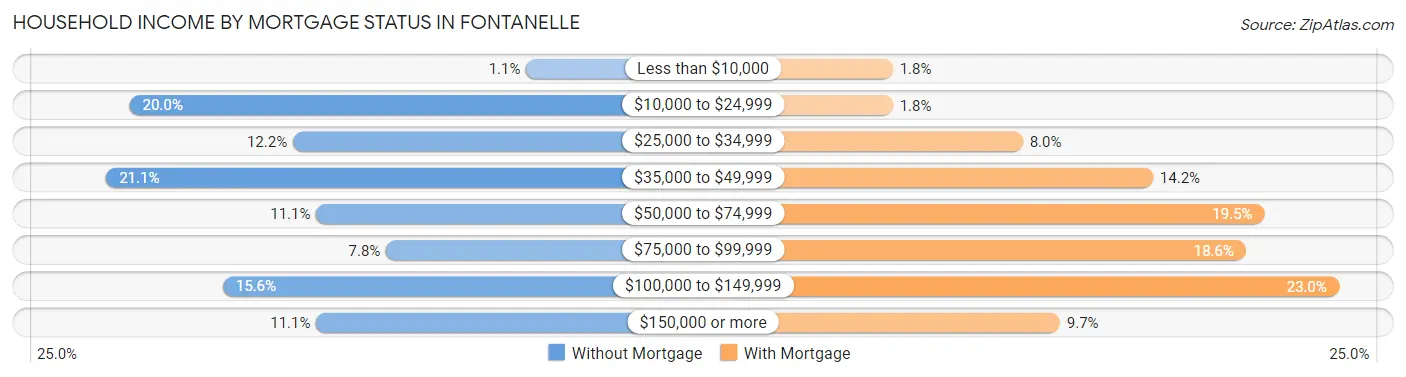
| Household Income | Without Mortgage | With Mortgage |
| Less than $10,000 | 1 (1.1%) | 2 (1.8%) |
| $10,000 to $24,999 | 18 (20.0%) | 2 (1.8%) |
| $25,000 to $34,999 | 11 (12.2%) | 9 (8.0%) |
| $35,000 to $49,999 | 19 (21.1%) | 16 (14.2%) |
| $50,000 to $74,999 | 10 (11.1%) | 22 (19.5%) |
| $75,000 to $99,999 | 7 (7.8%) | 21 (18.6%) |
| $100,000 to $149,999 | 14 (15.6%) | 26 (23.0%) |
| $150,000 or more | 10 (11.1%) | 11 (9.7%) |
| Total | 90 (100.0%) | 113 (100.0%) |
Property Value to Household Income Ratio in Fontanelle
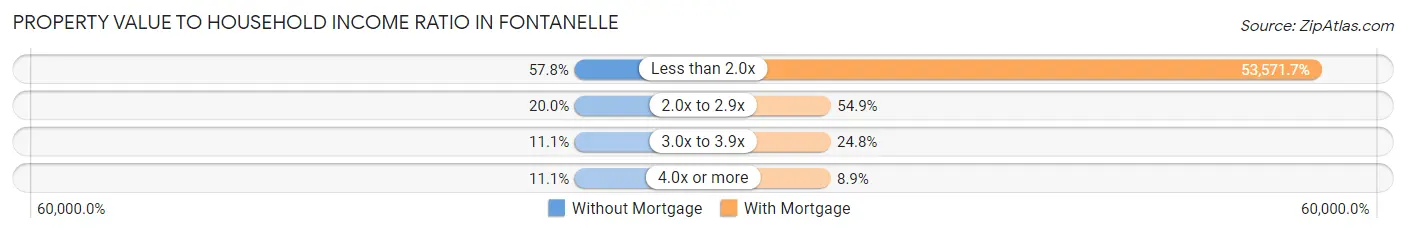
| Value-to-Income Ratio | Without Mortgage | With Mortgage |
| Less than 2.0x | 52 (57.8%) | 60,536 (53,571.7%) |
| 2.0x to 2.9x | 18 (20.0%) | 62 (54.9%) |
| 3.0x to 3.9x | 10 (11.1%) | 28 (24.8%) |
| 4.0x or more | 10 (11.1%) | 10 (8.8%) |
| Total | 90 (100.0%) | 113 (100.0%) |
Real Estate Taxes by Mortgage Status in Fontanelle
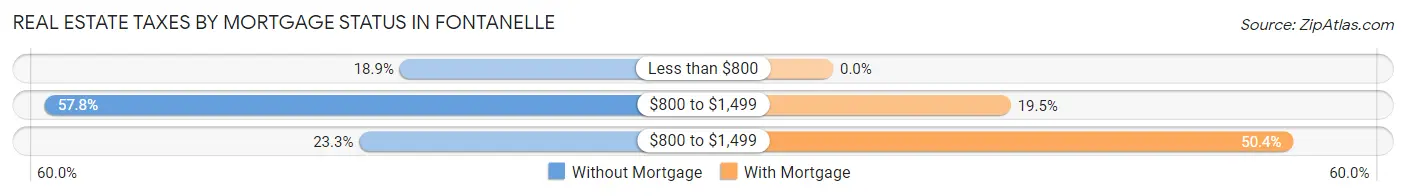
| Property Taxes | Without Mortgage | With Mortgage |
| Less than $800 | 17 (18.9%) | 0 (0.0%) |
| $800 to $1,499 | 52 (57.8%) | 22 (19.5%) |
| $800 to $1,499 | 21 (23.3%) | 57 (50.4%) |
| Total | 90 (100.0%) | 113 (100.0%) |
Health & Disability in Fontanelle
Health Insurance Coverage by Age in Fontanelle
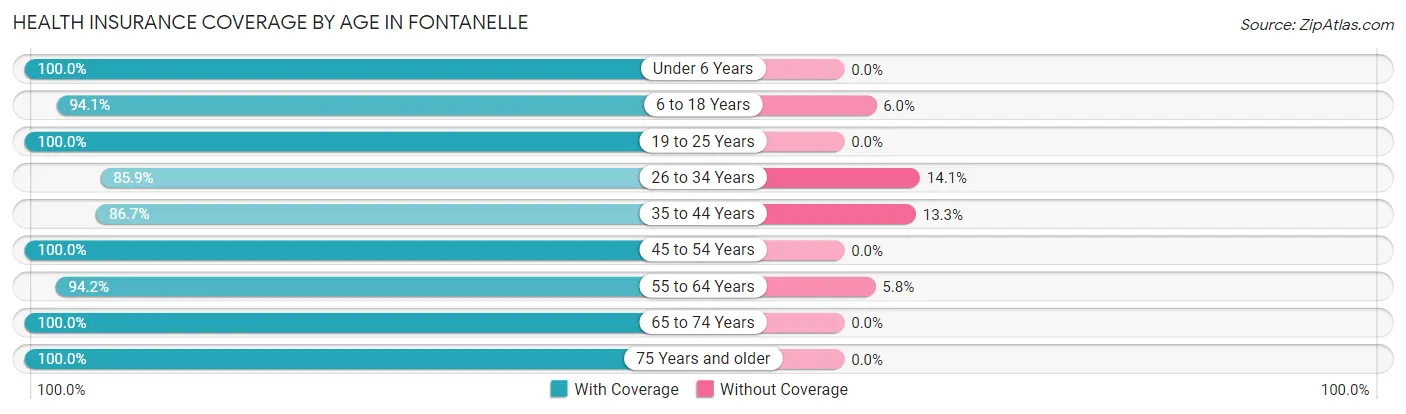
| Age Bracket | With Coverage | Without Coverage |
| Under 6 Years | 36 (100.0%) | 0 (0.0%) |
| 6 to 18 Years | 79 (94.1%) | 5 (5.9%) |
| 19 to 25 Years | 51 (100.0%) | 0 (0.0%) |
| 26 to 34 Years | 67 (85.9%) | 11 (14.1%) |
| 35 to 44 Years | 52 (86.7%) | 8 (13.3%) |
| 45 to 54 Years | 74 (100.0%) | 0 (0.0%) |
| 55 to 64 Years | 65 (94.2%) | 4 (5.8%) |
| 65 to 74 Years | 92 (100.0%) | 0 (0.0%) |
| 75 Years and older | 32 (100.0%) | 0 (0.0%) |
| Total | 548 (95.1%) | 28 (4.9%) |
Health Insurance Coverage by Citizenship Status in Fontanelle
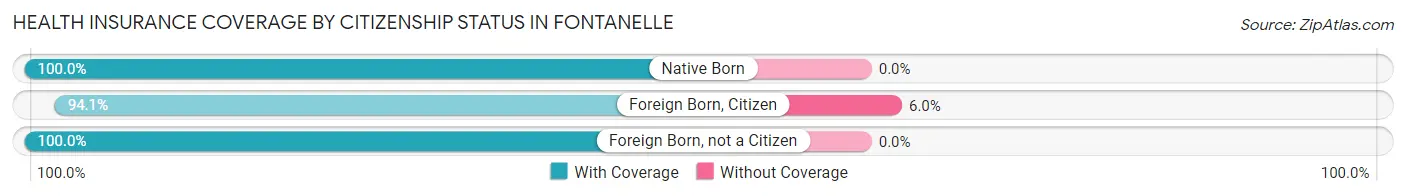
| Citizenship Status | With Coverage | Without Coverage |
| Native Born | 36 (100.0%) | 0 (0.0%) |
| Foreign Born, Citizen | 79 (94.1%) | 5 (5.9%) |
| Foreign Born, not a Citizen | 51 (100.0%) | 0 (0.0%) |
Health Insurance Coverage by Household Income in Fontanelle
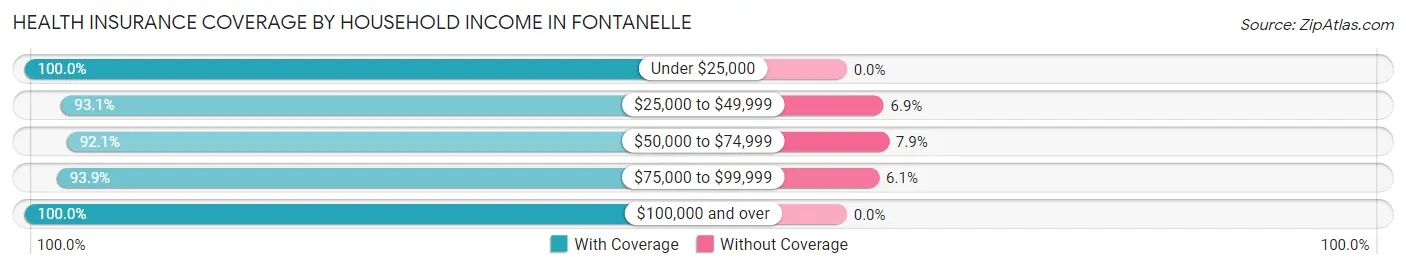
| Household Income | With Coverage | Without Coverage |
| Under $25,000 | 64 (100.0%) | 0 (0.0%) |
| $25,000 to $49,999 | 135 (93.1%) | 10 (6.9%) |
| $50,000 to $74,999 | 140 (92.1%) | 12 (7.9%) |
| $75,000 to $99,999 | 93 (93.9%) | 6 (6.1%) |
| $100,000 and over | 116 (100.0%) | 0 (0.0%) |
Public vs Private Health Insurance Coverage by Age in Fontanelle
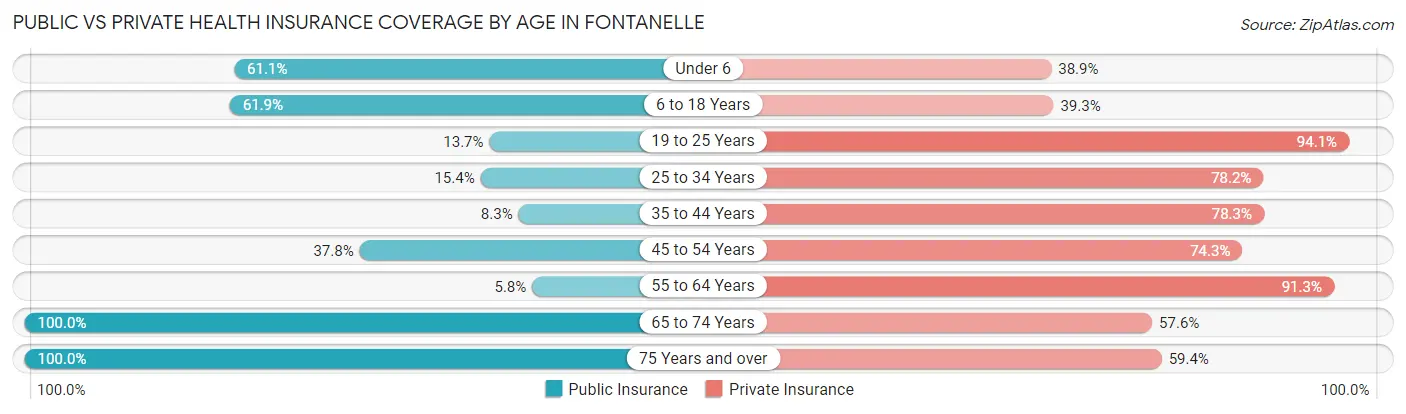
| Age Bracket | Public Insurance | Private Insurance |
| Under 6 | 22 (61.1%) | 14 (38.9%) |
| 6 to 18 Years | 52 (61.9%) | 33 (39.3%) |
| 19 to 25 Years | 7 (13.7%) | 48 (94.1%) |
| 25 to 34 Years | 12 (15.4%) | 61 (78.2%) |
| 35 to 44 Years | 5 (8.3%) | 47 (78.3%) |
| 45 to 54 Years | 28 (37.8%) | 55 (74.3%) |
| 55 to 64 Years | 4 (5.8%) | 63 (91.3%) |
| 65 to 74 Years | 92 (100.0%) | 53 (57.6%) |
| 75 Years and over | 32 (100.0%) | 19 (59.4%) |
| Total | 254 (44.1%) | 393 (68.2%) |
Disability Status by Sex by Age in Fontanelle
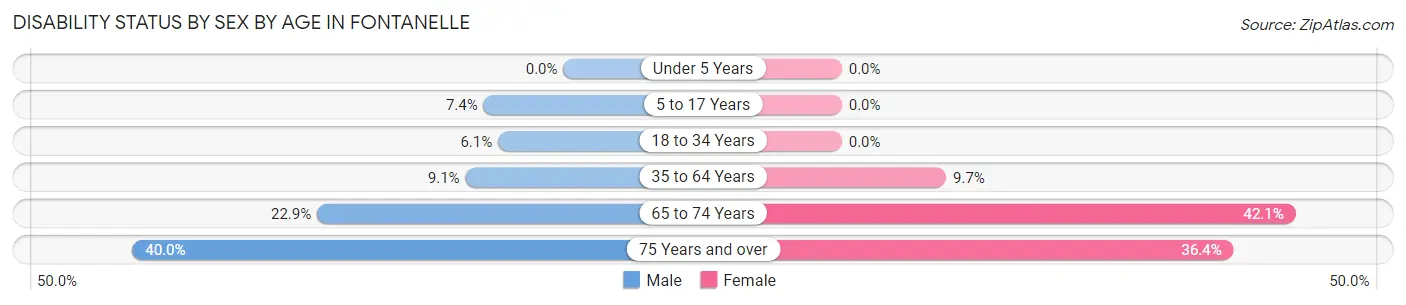
| Age Bracket | Male | Female |
| Under 5 Years | 0 (0.0%) | 0 (0.0%) |
| 5 to 17 Years | 4 (7.4%) | 0 (0.0%) |
| 18 to 34 Years | 4 (6.1%) | 0 (0.0%) |
| 35 to 64 Years | 10 (9.1%) | 9 (9.7%) |
| 65 to 74 Years | 8 (22.9%) | 24 (42.1%) |
| 75 Years and over | 4 (40.0%) | 8 (36.4%) |
Disability Class by Sex by Age in Fontanelle
Disability Class: Hearing Difficulty
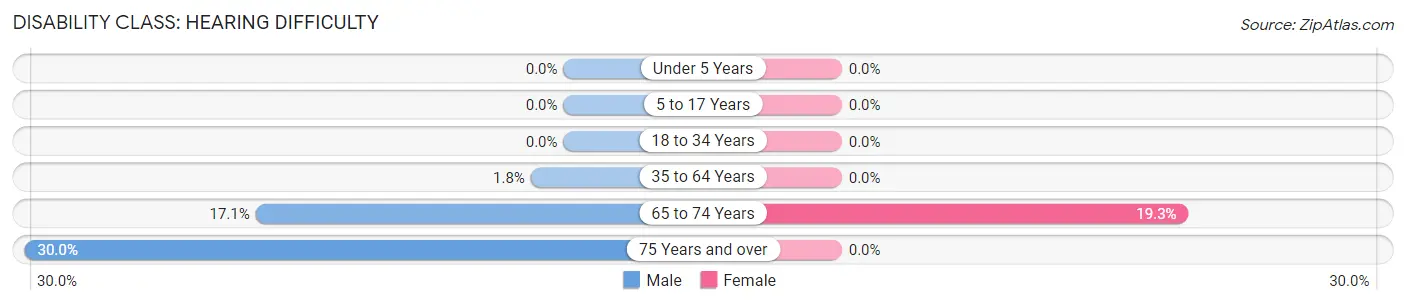
| Age Bracket | Male | Female |
| Under 5 Years | 0 (0.0%) | 0 (0.0%) |
| 5 to 17 Years | 0 (0.0%) | 0 (0.0%) |
| 18 to 34 Years | 0 (0.0%) | 0 (0.0%) |
| 35 to 64 Years | 2 (1.8%) | 0 (0.0%) |
| 65 to 74 Years | 6 (17.1%) | 11 (19.3%) |
| 75 Years and over | 3 (30.0%) | 0 (0.0%) |
Disability Class: Vision Difficulty
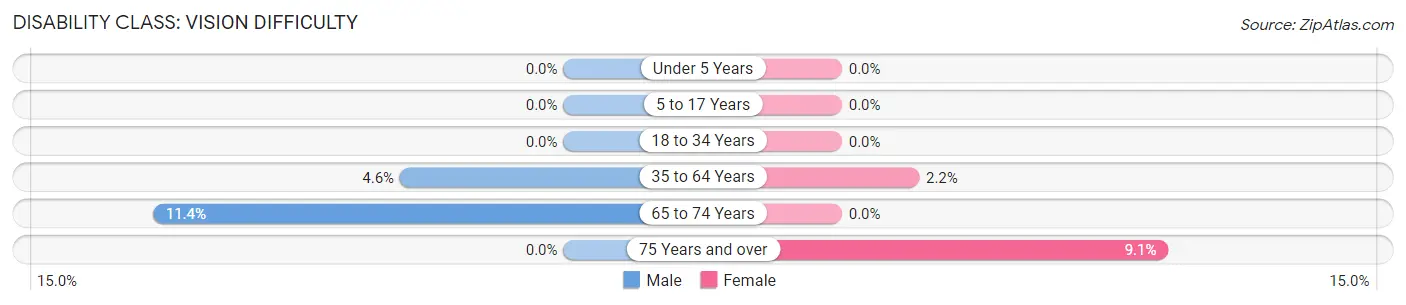
| Age Bracket | Male | Female |
| Under 5 Years | 0 (0.0%) | 0 (0.0%) |
| 5 to 17 Years | 0 (0.0%) | 0 (0.0%) |
| 18 to 34 Years | 0 (0.0%) | 0 (0.0%) |
| 35 to 64 Years | 5 (4.5%) | 2 (2.1%) |
| 65 to 74 Years | 4 (11.4%) | 0 (0.0%) |
| 75 Years and over | 0 (0.0%) | 2 (9.1%) |
Disability Class: Cognitive Difficulty
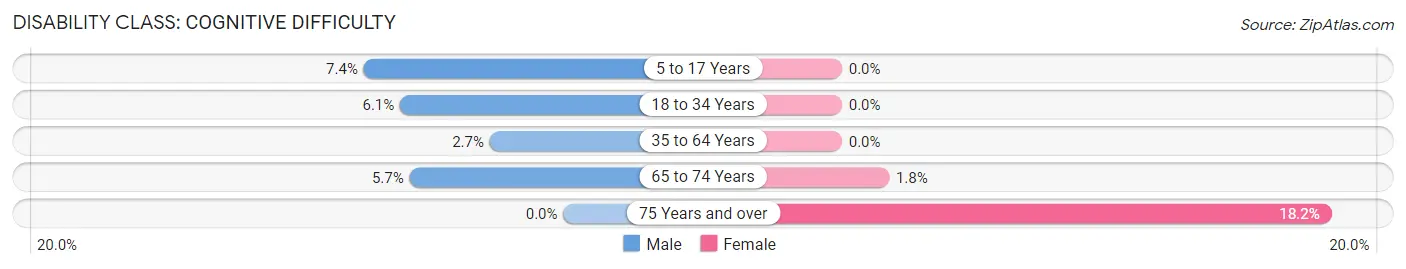
| Age Bracket | Male | Female |
| 5 to 17 Years | 4 (7.4%) | 0 (0.0%) |
| 18 to 34 Years | 4 (6.1%) | 0 (0.0%) |
| 35 to 64 Years | 3 (2.7%) | 0 (0.0%) |
| 65 to 74 Years | 2 (5.7%) | 1 (1.8%) |
| 75 Years and over | 0 (0.0%) | 4 (18.2%) |
Disability Class: Ambulatory Difficulty
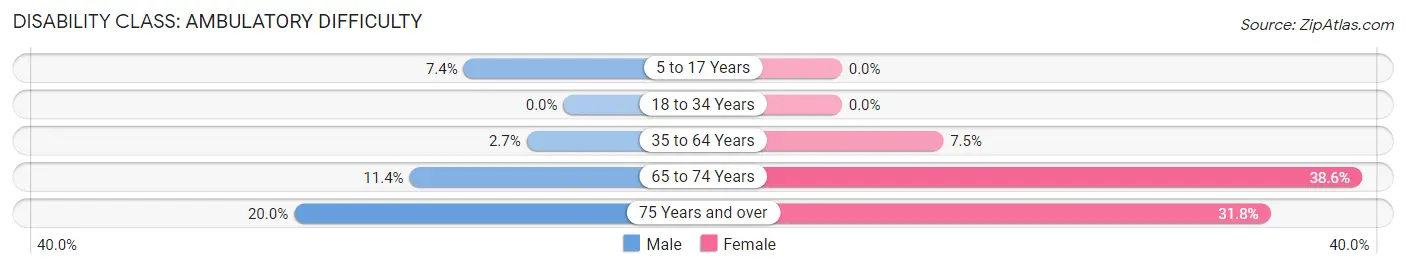
| Age Bracket | Male | Female |
| 5 to 17 Years | 4 (7.4%) | 0 (0.0%) |
| 18 to 34 Years | 0 (0.0%) | 0 (0.0%) |
| 35 to 64 Years | 3 (2.7%) | 7 (7.5%) |
| 65 to 74 Years | 4 (11.4%) | 22 (38.6%) |
| 75 Years and over | 2 (20.0%) | 7 (31.8%) |
Disability Class: Self-Care Difficulty
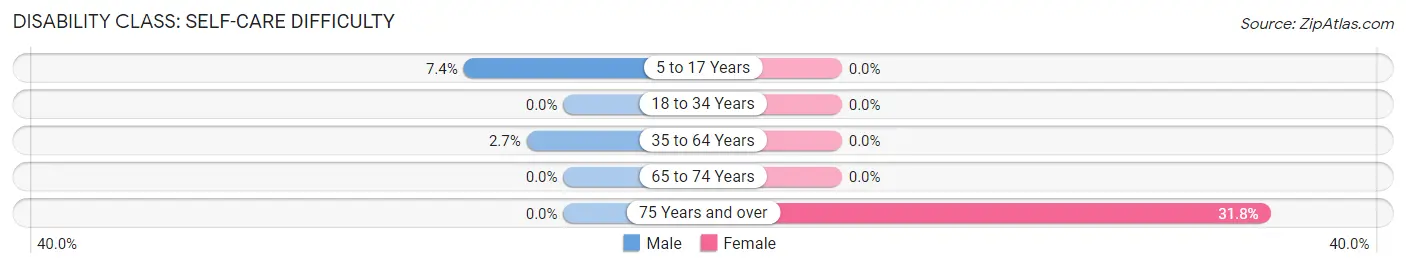
| Age Bracket | Male | Female |
| 5 to 17 Years | 4 (7.4%) | 0 (0.0%) |
| 18 to 34 Years | 0 (0.0%) | 0 (0.0%) |
| 35 to 64 Years | 3 (2.7%) | 0 (0.0%) |
| 65 to 74 Years | 0 (0.0%) | 0 (0.0%) |
| 75 Years and over | 0 (0.0%) | 7 (31.8%) |
Technology Access in Fontanelle
Computing Device Access in Fontanelle
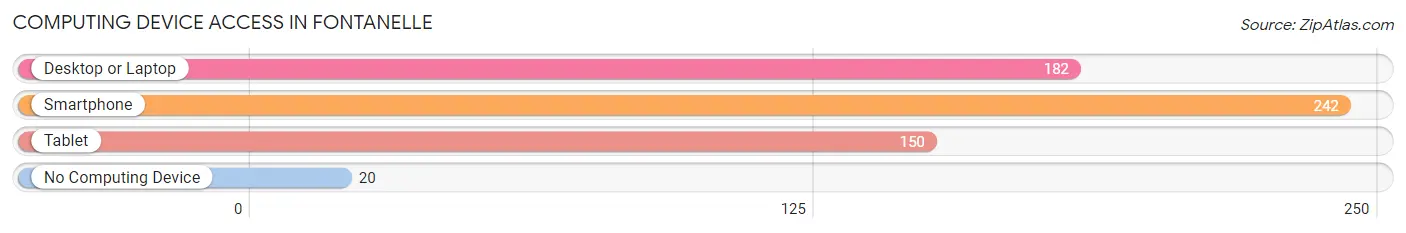
| Device Type | # Households | % Households |
| Desktop or Laptop | 182 | 64.8% |
| Smartphone | 242 | 86.1% |
| Tablet | 150 | 53.4% |
| No Computing Device | 20 | 7.1% |
| Total | 281 | 100.0% |
Internet Access in Fontanelle
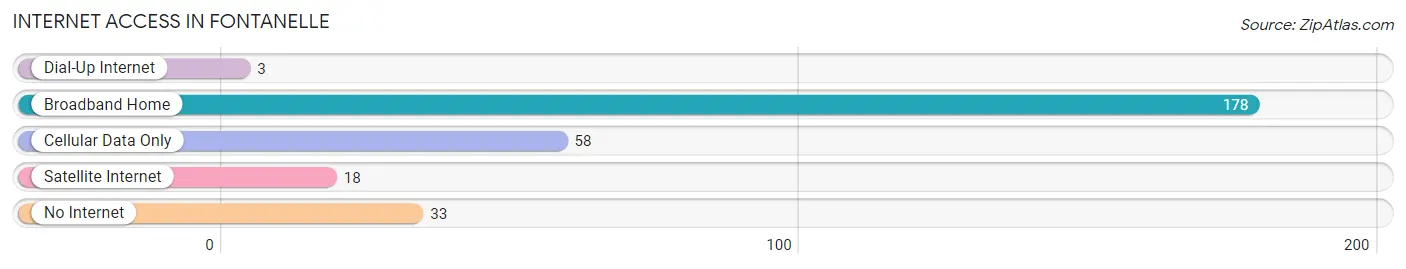
| Internet Type | # Households | % Households |
| Dial-Up Internet | 3 | 1.1% |
| Broadband Home | 178 | 63.3% |
| Cellular Data Only | 58 | 20.6% |
| Satellite Internet | 18 | 6.4% |
| No Internet | 33 | 11.7% |
| Total | 281 | 100.0% |
Fontanelle Summary
Fontanelle, Iowa is a small town located in Adair County, Iowa. It is situated on the banks of the East Nishnabotna River, approximately 20 miles east of the state capital of Des Moines. The population of Fontanelle was estimated to be 545 in 2020.
History
Fontanelle was founded in 1854 by a group of settlers from Ohio. The town was named after the nearby Fontanelle Creek, which was named after a French explorer who had visited the area in the late 1700s. The town was originally a farming community, but it soon became a center for the lumber industry. The town was incorporated in 1871 and the first mayor was elected in 1872.
In the late 1800s, Fontanelle was a thriving community with a population of over 1,000 people. The town had several stores, a bank, a hotel, a post office, a school, and a newspaper. The town was also home to several churches, including the Methodist Episcopal Church, the Baptist Church, and the Congregational Church.
In the early 1900s, the lumber industry began to decline and the town's population began to decline as well. By the 1950s, the population had dropped to just over 500 people. The town has remained relatively small since then, but it has seen some growth in recent years.
Geography
Fontanelle is located in Adair County, Iowa, approximately 20 miles east of the state capital of Des Moines. The town is situated on the banks of the East Nishnabotna River. The town is surrounded by rolling hills and farmland. The climate in Fontanelle is generally mild, with hot summers and cold winters.
Economy
The economy of Fontanelle is largely based on agriculture. The town is home to several farms, which produce corn, soybeans, and other crops. The town also has several small businesses, including a grocery store, a hardware store, and a few restaurants.
Demographics
As of 2020, the population of Fontanelle was estimated to be 545. The town is predominantly white, with 95.3% of the population identifying as white. The median household income in Fontanelle is $45,000, and the median age is 44. The town has a low unemployment rate of 3.2%.
Conclusion
Fontanelle, Iowa is a small town located in Adair County, Iowa. It was founded in 1854 and has a population of 545 as of 2020. The town is largely agricultural, with several farms producing corn, soybeans, and other crops. The town also has several small businesses, including a grocery store, a hardware store, and a few restaurants. The median household income in Fontanelle is $45,000, and the median age is 44. The town has a low unemployment rate of 3.2%.
Common Questions
What is Per Capita Income in Fontanelle?
Per Capita income in Fontanelle is $32,275.
What is the Median Family Income in Fontanelle?
Median Family Income in Fontanelle is $75,208.
What is the Median Household income in Fontanelle?
Median Household Income in Fontanelle is $56,042.
What is Income or Wage Gap in Fontanelle?
Income or Wage Gap in Fontanelle is 17.5%.
Women in Fontanelle earn 82.5 cents for every dollar earned by a man.
What is Inequality or Gini Index in Fontanelle?
Inequality or Gini Index in Fontanelle is 0.36.
What is the Total Population of Fontanelle?
Total Population of Fontanelle is 608.
What is the Total Male Population of Fontanelle?
Total Male Population of Fontanelle is 296.
What is the Total Female Population of Fontanelle?
Total Female Population of Fontanelle is 312.
What is the Ratio of Males per 100 Females in Fontanelle?
There are 94.87 Males per 100 Females in Fontanelle.
What is the Ratio of Females per 100 Males in Fontanelle?
There are 105.41 Females per 100 Males in Fontanelle.
What is the Median Population Age in Fontanelle?
Median Population Age in Fontanelle is 43.0 Years.
What is the Average Family Size in Fontanelle
Average Family Size in Fontanelle is 2.7 People.
What is the Average Household Size in Fontanelle
Average Household Size in Fontanelle is 2.0 People.
How Large is the Labor Force in Fontanelle?
There are 285 People in the Labor Forcein in Fontanelle.
What is the Percentage of People in the Labor Force in Fontanelle?
57.9% of People are in the Labor Force in Fontanelle.
What is the Unemployment Rate in Fontanelle?
Unemployment Rate in Fontanelle is 3.5%.