Cities with the Highest Percentage of German Population in Iowa
RELATED REPORTS & OPTIONS
German
Iowa
Compare Cities
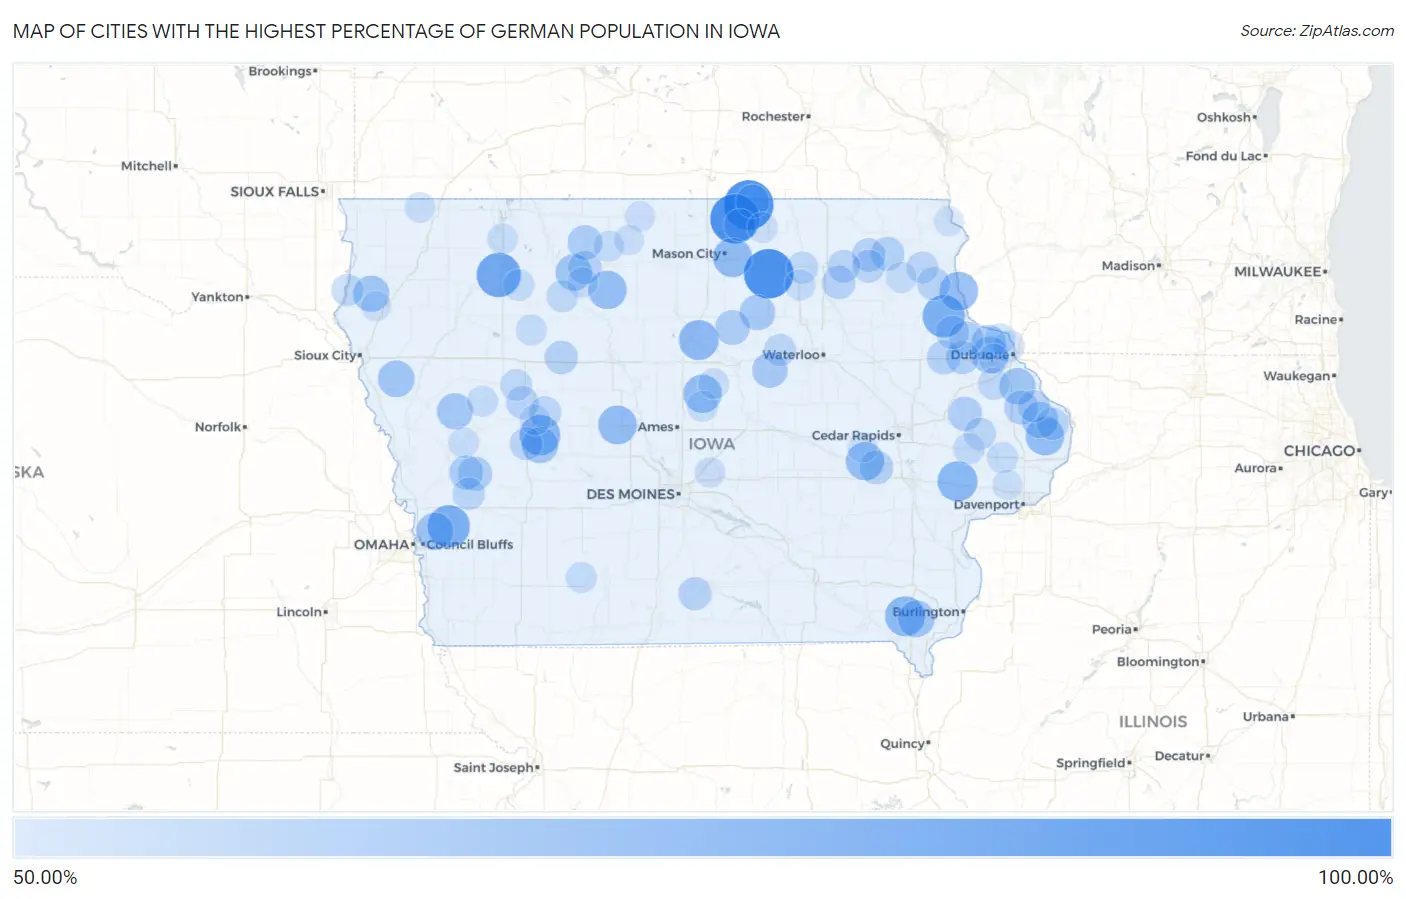
Map of Cities with the Highest Percentage of German Population in Iowa
0.00%
100.00%
Cities with the Highest Percentage of German Population in Iowa
| City | German | vs State | vs National | |
| 1. | Otranto | 100.00% | 31.31%(+68.7)#1 | 12.66%(+87.3)#47 |
| 2. | Roseville | 100.00% | 31.31%(+68.7)#2 | 12.66%(+87.3)#66 |
| 3. | Plainview | 100.00% | 31.31%(+68.7)#3 | 12.66%(+87.3)#73 |
| 4. | Bolan | 100.00% | 31.31%(+68.7)#4 | 12.66%(+87.3)#80 |
| 5. | Rossie | 87.01% | 31.31%(+55.7)#5 | 12.66%(+74.4)#119 |
| 6. | Big Rock | 83.33% | 31.31%(+52.0)#6 | 12.66%(+70.7)#137 |
| 7. | Bentley | 82.42% | 31.31%(+51.1)#7 | 12.66%(+69.8)#139 |
| 8. | Elkport | 82.35% | 31.31%(+51.0)#8 | 12.66%(+69.7)#142 |
| 9. | Willey | 78.23% | 31.31%(+46.9)#9 | 12.66%(+65.6)#174 |
| 10. | Rochester | 77.08% | 31.31%(+45.8)#10 | 12.66%(+64.4)#185 |
| 11. | Houghton | 76.62% | 31.31%(+45.3)#11 | 12.66%(+64.0)#188 |
| 12. | Popejoy | 76.42% | 31.31%(+45.1)#12 | 12.66%(+63.8)#189 |
| 13. | Portland | 75.00% | 31.31%(+43.7)#13 | 12.66%(+62.3)#206 |
| 14. | Clayton | 73.85% | 31.31%(+42.5)#14 | 12.66%(+61.2)#217 |
| 15. | Beaver | 73.68% | 31.31%(+42.4)#15 | 12.66%(+61.0)#218 |
| 16. | Goose Lake | 73.47% | 31.31%(+42.2)#16 | 12.66%(+60.8)#223 |
| 17. | Garden City | 73.23% | 31.31%(+41.9)#17 | 12.66%(+60.6)#227 |
| 18. | St Joseph | 73.13% | 31.31%(+41.8)#18 | 12.66%(+60.5)#230 |
| 19. | West Amana | 72.97% | 31.31%(+41.7)#19 | 12.66%(+60.3)#231 |
| 20. | Weston | 70.33% | 31.31%(+39.0)#20 | 12.66%(+57.7)#266 |
| 21. | St Paul | 69.23% | 31.31%(+37.9)#21 | 12.66%(+56.6)#289 |
| 22. | Graf | 69.23% | 31.31%(+37.9)#22 | 12.66%(+56.6)#291 |
| 23. | Climbing Hill | 69.01% | 31.31%(+37.7)#23 | 12.66%(+56.4)#295 |
| 24. | Rodman | 68.75% | 31.31%(+37.4)#24 | 12.66%(+56.1)#304 |
| 25. | La Motte | 68.54% | 31.31%(+37.2)#25 | 12.66%(+55.9)#308 |
| 26. | Dedham | 68.42% | 31.31%(+37.1)#26 | 12.66%(+55.8)#312 |
| 27. | Craig | 68.18% | 31.31%(+36.9)#27 | 12.66%(+55.5)#317 |
| 28. | Spragueville | 68.10% | 31.31%(+36.8)#28 | 12.66%(+55.4)#320 |
| 29. | Ricketts | 67.80% | 31.31%(+36.5)#29 | 12.66%(+55.1)#326 |
| 30. | Bristow | 66.47% | 31.31%(+35.2)#30 | 12.66%(+53.8)#364 |
| 31. | Holland | 66.16% | 31.31%(+34.9)#31 | 12.66%(+53.5)#377 |
| 32. | Geneva | 64.81% | 31.31%(+33.5)#32 | 12.66%(+52.2)#418 |
| 33. | Fenton | 64.52% | 31.31%(+33.2)#33 | 12.66%(+51.9)#425 |
| 34. | Rickardsville | 64.34% | 31.31%(+33.0)#34 | 12.66%(+51.7)#428 |
| 35. | Luxemburg | 63.96% | 31.31%(+32.7)#35 | 12.66%(+51.3)#441 |
| 36. | Westphalia | 63.89% | 31.31%(+32.6)#36 | 12.66%(+51.2)#446 |
| 37. | Panama | 63.56% | 31.31%(+32.3)#37 | 12.66%(+50.9)#458 |
| 38. | Andrew | 63.28% | 31.31%(+32.0)#38 | 12.66%(+50.6)#468 |
| 39. | Center Junction | 62.96% | 31.31%(+31.7)#39 | 12.66%(+50.3)#485 |
| 40. | Homestead | 62.70% | 31.31%(+31.4)#40 | 12.66%(+50.0)#491 |
| 41. | Earlville | 62.34% | 31.31%(+31.0)#41 | 12.66%(+49.7)#509 |
| 42. | Ossian | 62.22% | 31.31%(+30.9)#42 | 12.66%(+49.6)#513 |
| 43. | Fort Atkinson | 61.68% | 31.31%(+30.4)#43 | 12.66%(+49.0)#537 |
| 44. | Whittemore | 61.64% | 31.31%(+30.3)#44 | 12.66%(+49.0)#538 |
| 45. | Mona | 61.54% | 31.31%(+30.2)#45 | 12.66%(+48.9)#545 |
| 46. | Twin Lakes | 61.47% | 31.31%(+30.2)#46 | 12.66%(+48.8)#548 |
| 47. | Dyersville | 61.46% | 31.31%(+30.2)#47 | 12.66%(+48.8)#552 |
| 48. | Fredericksburg | 61.43% | 31.31%(+30.1)#48 | 12.66%(+48.8)#555 |
| 49. | Swedesburg | 61.11% | 31.31%(+29.8)#49 | 12.66%(+48.5)#569 |
| 50. | Colesburg | 61.09% | 31.31%(+29.8)#50 | 12.66%(+48.4)#570 |
| 51. | Farmersburg | 61.01% | 31.31%(+29.7)#51 | 12.66%(+48.4)#575 |
| 52. | Derby | 60.91% | 31.31%(+29.6)#52 | 12.66%(+48.2)#579 |
| 53. | Breda | 60.36% | 31.31%(+29.1)#53 | 12.66%(+47.7)#597 |
| 54. | Templeton | 60.30% | 31.31%(+29.0)#54 | 12.66%(+47.6)#598 |
| 55. | St Lucas | 60.27% | 31.31%(+29.0)#55 | 12.66%(+47.6)#600 |
| 56. | Lawler | 60.21% | 31.31%(+28.9)#56 | 12.66%(+47.6)#601 |
| 57. | Yarmouth | 60.00% | 31.31%(+28.7)#57 | 12.66%(+47.3)#610 |
| 58. | Tennant | 59.32% | 31.31%(+28.0)#58 | 12.66%(+46.7)#638 |
| 59. | Miles | 59.30% | 31.31%(+28.0)#59 | 12.66%(+46.6)#640 |
| 60. | Lidderdale | 59.06% | 31.31%(+27.8)#60 | 12.66%(+46.4)#655 |
| 61. | Stout | 58.67% | 31.31%(+27.4)#61 | 12.66%(+46.0)#670 |
| 62. | Grafton | 58.60% | 31.31%(+27.3)#62 | 12.66%(+45.9)#674 |
| 63. | Springbrook | 58.59% | 31.31%(+27.3)#63 | 12.66%(+45.9)#675 |
| 64. | Chatsworth | 58.44% | 31.31%(+27.1)#64 | 12.66%(+45.8)#679 |
| 65. | Sperry | 58.42% | 31.31%(+27.1)#65 | 12.66%(+45.8)#684 |
| 66. | Oxford Junction | 58.33% | 31.31%(+27.0)#66 | 12.66%(+45.7)#686 |
| 67. | Luana | 58.26% | 31.31%(+27.0)#67 | 12.66%(+45.6)#692 |
| 68. | Lake View | 58.15% | 31.31%(+26.8)#68 | 12.66%(+45.5)#695 |
| 69. | Plover | 58.14% | 31.31%(+26.8)#69 | 12.66%(+45.5)#697 |
| 70. | Bernard | 58.06% | 31.31%(+26.8)#70 | 12.66%(+45.4)#702 |
| 71. | Bassett | 58.00% | 31.31%(+26.7)#71 | 12.66%(+45.3)#704 |
| 72. | Webb | 57.03% | 31.31%(+25.7)#72 | 12.66%(+44.4)#748 |
| 73. | Clarence | 56.87% | 31.31%(+25.6)#73 | 12.66%(+44.2)#758 |
| 74. | Calamus | 56.62% | 31.31%(+25.3)#74 | 12.66%(+44.0)#765 |
| 75. | Sageville | 56.58% | 31.31%(+25.3)#75 | 12.66%(+43.9)#767 |
| 76. | Clermont | 56.33% | 31.31%(+25.0)#76 | 12.66%(+43.7)#780 |
| 77. | Varina | 56.25% | 31.31%(+24.9)#77 | 12.66%(+43.6)#785 |
| 78. | Sherrill | 56.22% | 31.31%(+24.9)#78 | 12.66%(+43.6)#788 |
| 79. | Burt | 56.09% | 31.31%(+24.8)#79 | 12.66%(+43.4)#795 |
| 80. | Cromwell | 56.00% | 31.31%(+24.7)#80 | 12.66%(+43.3)#797 |
| 81. | Kiron | 55.96% | 31.31%(+24.7)#81 | 12.66%(+43.3)#804 |
| 82. | Nashua | 55.91% | 31.31%(+24.6)#82 | 12.66%(+43.2)#808 |
| 83. | Mccallsburg | 55.79% | 31.31%(+24.5)#83 | 12.66%(+43.1)#812 |
| 84. | Fostoria | 55.75% | 31.31%(+24.4)#84 | 12.66%(+43.1)#818 |
| 85. | Carroll | 55.60% | 31.31%(+24.3)#85 | 12.66%(+42.9)#827 |
| 86. | Dow City | 55.23% | 31.31%(+23.9)#86 | 12.66%(+42.6)#858 |
| 87. | Hubbard | 55.18% | 31.31%(+23.9)#87 | 12.66%(+42.5)#859 |
| 88. | Little Rock | 55.12% | 31.31%(+23.8)#88 | 12.66%(+42.5)#862 |
| 89. | Mitchell | 54.84% | 31.31%(+23.5)#89 | 12.66%(+42.2)#876 |
| 90. | Valeria | 54.76% | 31.31%(+23.5)#90 | 12.66%(+42.1)#880 |
| 91. | Argyle | 54.76% | 31.31%(+23.5)#91 | 12.66%(+42.1)#881 |
| 92. | West Bend | 54.70% | 31.31%(+23.4)#92 | 12.66%(+42.0)#883 |
| 93. | Buffalo Center | 54.59% | 31.31%(+23.3)#93 | 12.66%(+41.9)#886 |
| 94. | Titonka | 54.44% | 31.31%(+23.1)#94 | 12.66%(+41.8)#899 |
| 95. | Maysville | 54.39% | 31.31%(+23.1)#95 | 12.66%(+41.7)#902 |
| 96. | Augusta | 54.39% | 31.31%(+23.1)#96 | 12.66%(+41.7)#903 |
| 97. | Brunsville | 54.17% | 31.31%(+22.9)#97 | 12.66%(+41.5)#912 |
| 98. | Centralia | 54.03% | 31.31%(+22.7)#98 | 12.66%(+41.4)#920 |
| 99. | Watkins | 53.97% | 31.31%(+22.7)#99 | 12.66%(+41.3)#924 |
| 100. | Lansing | 53.94% | 31.31%(+22.6)#100 | 12.66%(+41.3)#926 |
Common Questions
What are the Top 10 Cities with the Highest Percentage of German Population in Iowa?
Top 10 Cities with the Highest Percentage of German Population in Iowa are:
What city has the Highest Percentage of German Population in Iowa?
Otranto has the Highest Percentage of German Population in Iowa with 100.00%.
What is the Percentage of German Population in the State of Iowa?
Percentage of German Population in Iowa is 31.31%.
What is the Percentage of German Population in the United States?
Percentage of German Population in the United States is 12.66%.