University Park, IA Map & Demographics
University Park Map
University Park Overview
$24,268
PER CAPITA INCOME
$69,750
AVG FAMILY INCOME
$63,162
AVG HOUSEHOLD INCOME
30.0%
WAGE / INCOME GAP [ % ]
70.0¢/ $1
WAGE / INCOME GAP [ $ ]
0.34
INEQUALITY / GINI INDEX
566
TOTAL POPULATION
302
MALE POPULATION
264
FEMALE POPULATION
114.39
MALES / 100 FEMALES
87.42
FEMALES / 100 MALES
35.1
MEDIAN AGE
3.2
AVG FAMILY SIZE
2.5
AVG HOUSEHOLD SIZE
290
LABOR FORCE [ PEOPLE ]
73.8%
PERCENT IN LABOR FORCE
3.4%
UNEMPLOYMENT RATE
University Park Zip Codes
University Park Area Codes
Income in University Park
Income Overview in University Park
Per Capita Income in University Park is $24,268, while median incomes of families and households are $69,750 and $63,162 respectively.
| Characteristic | Number | Measure |
| Per Capita Income | 566 | $24,268 |
| Median Family Income | 135 | $69,750 |
| Mean Family Income | 135 | $76,082 |
| Median Household Income | 227 | $63,162 |
| Mean Household Income | 227 | $62,901 |
| Income Deficit | 135 | $0 |
| Wage / Income Gap (%) | 566 | 30.00% |
| Wage / Income Gap ($) | 566 | 70.00¢ per $1 |
| Gini / Inequality Index | 566 | 0.34 |
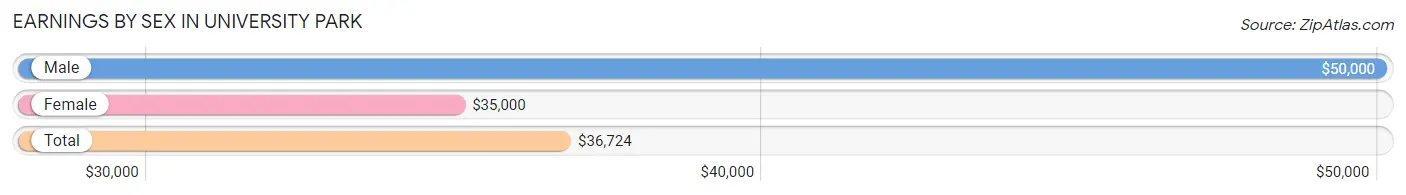
Earnings by Sex in University Park
Average Earnings in University Park are $36,724, $50,000 for men and $35,000 for women, a difference of 30.0%.
| Sex | Number | Average Earnings |
| Male | 150 (47.5%) | $50,000 |
| Female | 166 (52.5%) | $35,000 |
| Total | 316 (100.0%) | $36,724 |
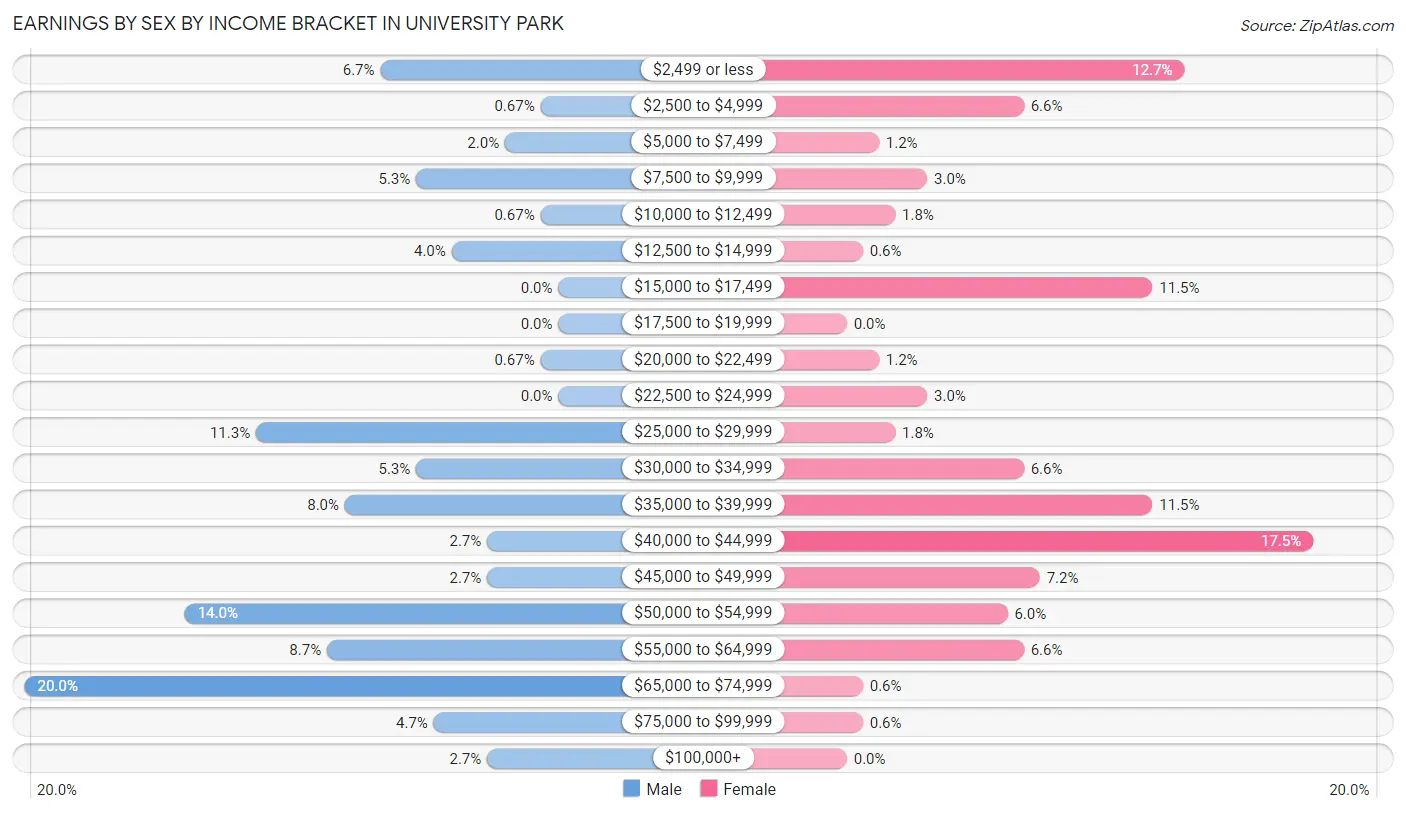
Earnings by Sex by Income Bracket in University Park
The most common earnings brackets in University Park are $65,000 to $74,999 for men (30 | 20.0%) and $40,000 to $44,999 for women (29 | 17.5%).
| Income | Male | Female |
| $2,499 or less | 10 (6.7%) | 21 (12.7%) |
| $2,500 to $4,999 | 1 (0.7%) | 11 (6.6%) |
| $5,000 to $7,499 | 3 (2.0%) | 2 (1.2%) |
| $7,500 to $9,999 | 8 (5.3%) | 5 (3.0%) |
| $10,000 to $12,499 | 1 (0.7%) | 3 (1.8%) |
| $12,500 to $14,999 | 6 (4.0%) | 1 (0.6%) |
| $15,000 to $17,499 | 0 (0.0%) | 19 (11.5%) |
| $17,500 to $19,999 | 0 (0.0%) | 0 (0.0%) |
| $20,000 to $22,499 | 1 (0.7%) | 2 (1.2%) |
| $22,500 to $24,999 | 0 (0.0%) | 5 (3.0%) |
| $25,000 to $29,999 | 17 (11.3%) | 3 (1.8%) |
| $30,000 to $34,999 | 8 (5.3%) | 11 (6.6%) |
| $35,000 to $39,999 | 12 (8.0%) | 19 (11.5%) |
| $40,000 to $44,999 | 4 (2.7%) | 29 (17.5%) |
| $45,000 to $49,999 | 4 (2.7%) | 12 (7.2%) |
| $50,000 to $54,999 | 21 (14.0%) | 10 (6.0%) |
| $55,000 to $64,999 | 13 (8.7%) | 11 (6.6%) |
| $65,000 to $74,999 | 30 (20.0%) | 1 (0.6%) |
| $75,000 to $99,999 | 7 (4.7%) | 1 (0.6%) |
| $100,000+ | 4 (2.7%) | 0 (0.0%) |
| Total | 150 (100.0%) | 166 (100.0%) |
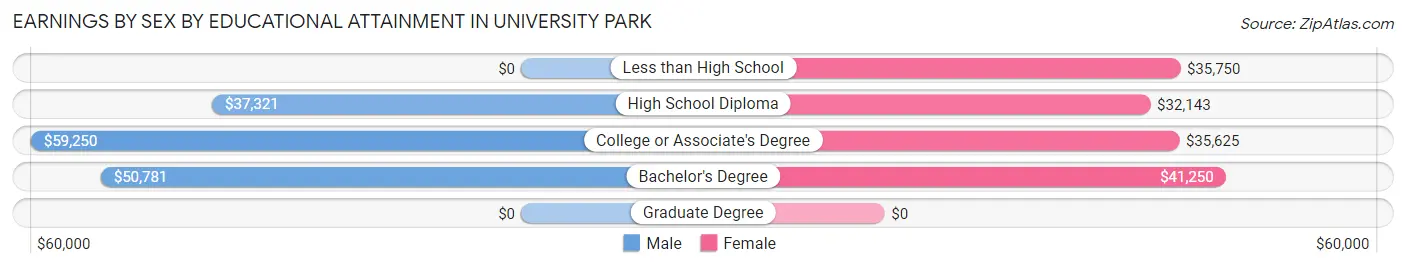
Earnings by Sex by Educational Attainment in University Park
Average earnings in University Park are $51,923 for men and $35,921 for women, a difference of 30.8%. Men with an educational attainment of college or associate's degree enjoy the highest average annual earnings of $59,250, while those with high school diploma education earn the least with $37,321. Women with an educational attainment of bachelor's degree earn the most with the average annual earnings of $41,250, while those with high school diploma education have the smallest earnings of $32,143.
| Educational Attainment | Male Income | Female Income |
| Less than High School | - | - |
| High School Diploma | $37,321 | $32,143 |
| College or Associate's Degree | $59,250 | $35,625 |
| Bachelor's Degree | $50,781 | $41,250 |
| Graduate Degree | - | - |
| Total | $51,923 | $35,921 |
Family Income in University Park
Family Income Brackets in University Park
According to the University Park family income data, there are 43 families falling into the $75,000 to $99,999 income range, which is the most common income bracket and makes up 31.9% of all families.
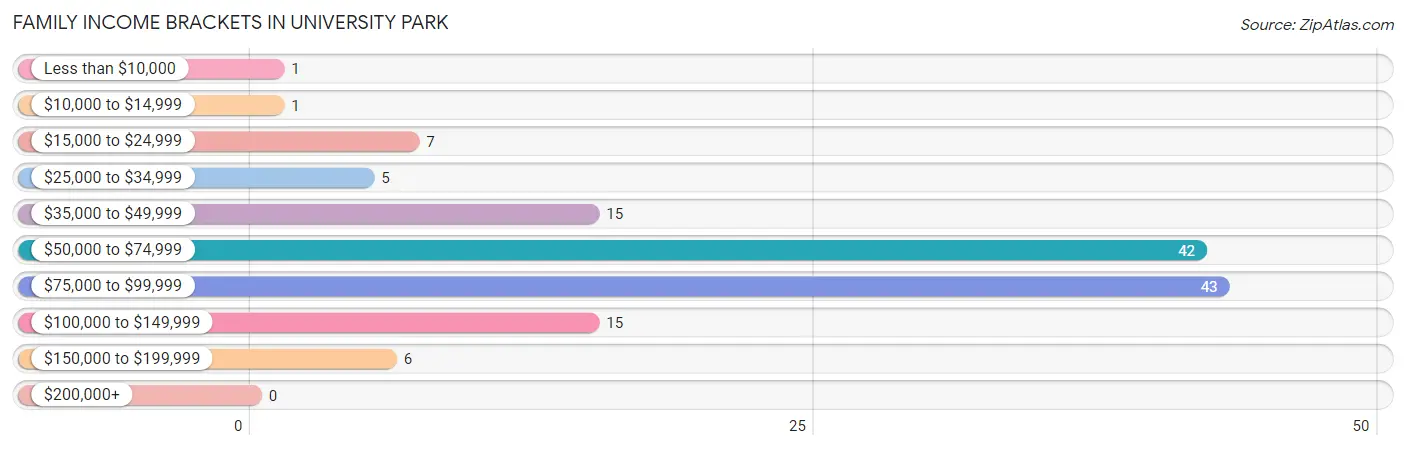
| Income Bracket | # Families | % Families |
| Less than $10,000 | 1 | 0.7% |
| $10,000 to $14,999 | 1 | 0.7% |
| $15,000 to $24,999 | 7 | 5.2% |
| $25,000 to $34,999 | 5 | 3.7% |
| $35,000 to $49,999 | 15 | 11.1% |
| $50,000 to $74,999 | 42 | 31.1% |
| $75,000 to $99,999 | 43 | 31.9% |
| $100,000 to $149,999 | 15 | 11.1% |
| $150,000 to $199,999 | 6 | 4.4% |
| $200,000+ | 0 | 0.0% |
Family Income by Famaliy Size in University Park
6-person families (20 | 14.8%) account for the highest median family income in University Park with $95,938 per family, while 2-person families (63 | 46.7%) have the highest median income of $33,375 per family member.
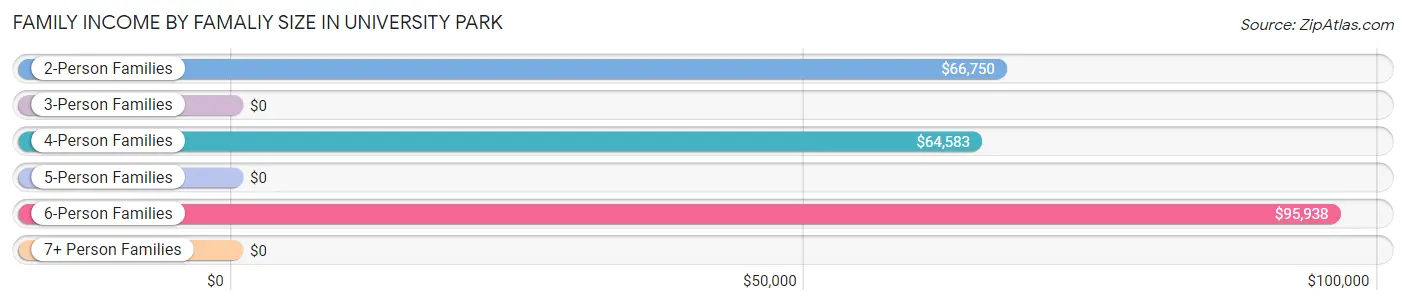
| Income Bracket | # Families | Median Income |
| 2-Person Families | 63 (46.7%) | $66,750 |
| 3-Person Families | 8 (5.9%) | $0 |
| 4-Person Families | 36 (26.7%) | $64,583 |
| 5-Person Families | 3 (2.2%) | $0 |
| 6-Person Families | 20 (14.8%) | $95,938 |
| 7+ Person Families | 5 (3.7%) | $0 |
| Total | 135 (100.0%) | $69,750 |
Family Income by Number of Earners in University Park
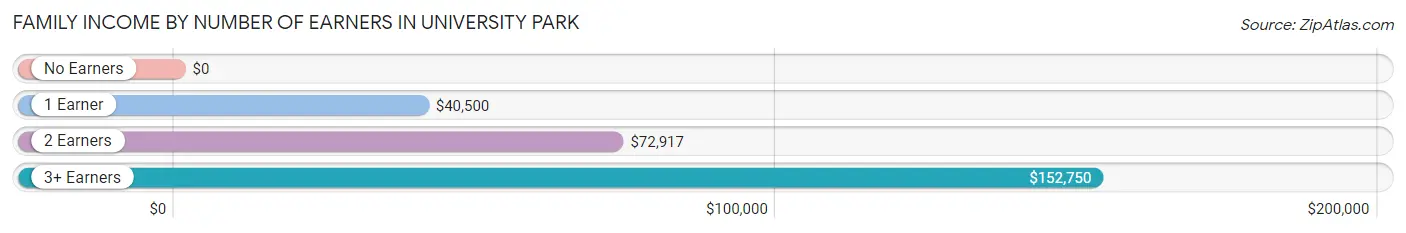
| Number of Earners | # Families | Median Income |
| No Earners | 3 (2.2%) | $0 |
| 1 Earner | 20 (14.8%) | $40,500 |
| 2 Earners | 103 (76.3%) | $72,917 |
| 3+ Earners | 9 (6.7%) | $152,750 |
| Total | 135 (100.0%) | $69,750 |
Household Income in University Park
Household Income Brackets in University Park
With 61 households falling in the category, the $50,000 to $74,999 income range is the most frequent in University Park, accounting for 26.9% of all households.
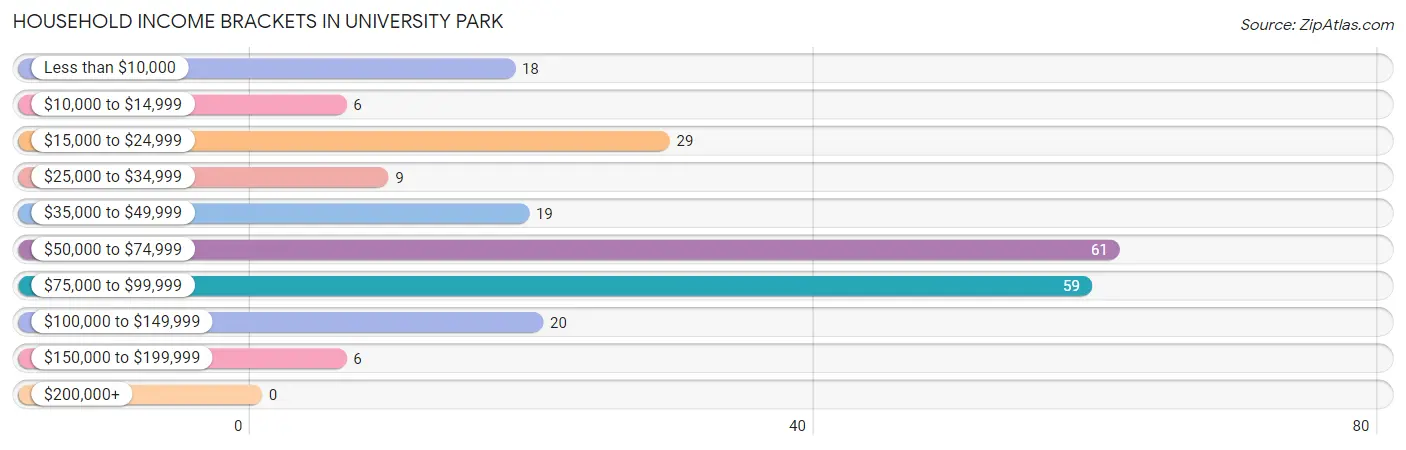
| Income Bracket | # Households | % Households |
| Less than $10,000 | 18 | 7.9% |
| $10,000 to $14,999 | 6 | 2.6% |
| $15,000 to $24,999 | 29 | 12.8% |
| $25,000 to $34,999 | 9 | 4.0% |
| $35,000 to $49,999 | 19 | 8.4% |
| $50,000 to $74,999 | 61 | 26.9% |
| $75,000 to $99,999 | 59 | 26.0% |
| $100,000 to $149,999 | 20 | 8.8% |
| $150,000 to $199,999 | 6 | 2.6% |
| $200,000+ | 0 | 0.0% |
Household Income by Householder Age in University Park
The median household income in University Park is $63,162, with the highest median household income of $65,833 found in the 25 to 44 years age bracket for the primary householder. A total of 88 households (38.8%) fall into this category. Meanwhile, the 15 to 24 years age bracket for the primary householder has the lowest median household income of $0, with 14 households (6.2%) in this group.
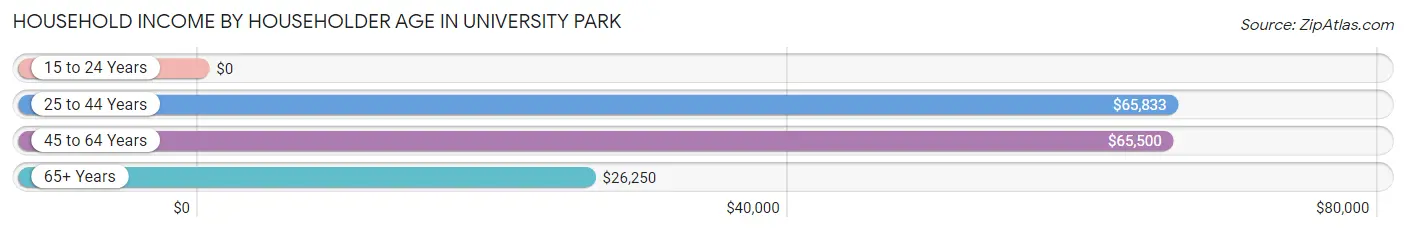
| Income Bracket | # Households | Median Income |
| 15 to 24 Years | 14 (6.2%) | $0 |
| 25 to 44 Years | 88 (38.8%) | $65,833 |
| 45 to 64 Years | 94 (41.4%) | $65,500 |
| 65+ Years | 31 (13.7%) | $26,250 |
| Total | 227 (100.0%) | $63,162 |
Poverty in University Park
Income Below Poverty by Sex and Age in University Park
With 10.9% poverty level for males and 14.0% for females among the residents of University Park, 18 to 24 year old males and 18 to 24 year old females are the most vulnerable to poverty, with 11 males (55.0%) and 11 females (57.9%) in their respective age groups living below the poverty level.
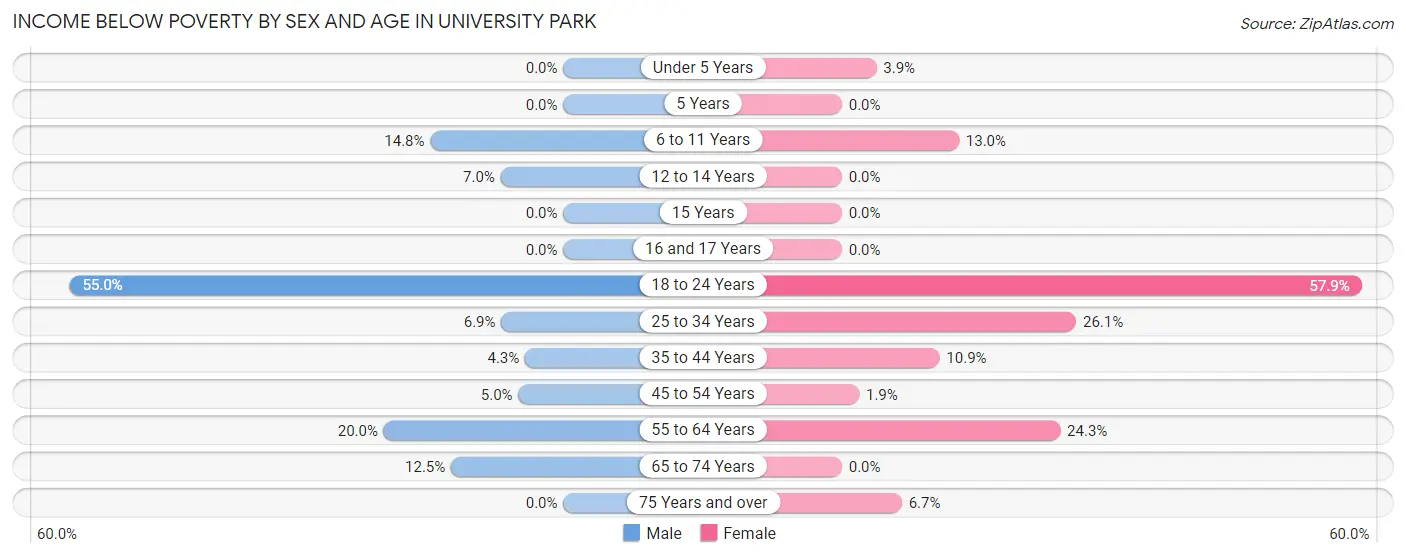
| Age Bracket | Male | Female |
| Under 5 Years | 0 (0.0%) | 1 (3.8%) |
| 5 Years | 0 (0.0%) | 0 (0.0%) |
| 6 to 11 Years | 4 (14.8%) | 3 (13.0%) |
| 12 to 14 Years | 3 (7.0%) | 0 (0.0%) |
| 15 Years | 0 (0.0%) | 0 (0.0%) |
| 16 and 17 Years | 0 (0.0%) | 0 (0.0%) |
| 18 to 24 Years | 11 (55.0%) | 11 (57.9%) |
| 25 to 34 Years | 2 (6.9%) | 6 (26.1%) |
| 35 to 44 Years | 2 (4.3%) | 5 (10.9%) |
| 45 to 54 Years | 1 (5.0%) | 1 (1.9%) |
| 55 to 64 Years | 9 (20.0%) | 9 (24.3%) |
| 65 to 74 Years | 1 (12.5%) | 0 (0.0%) |
| 75 Years and over | 0 (0.0%) | 1 (6.7%) |
| Total | 33 (10.9%) | 37 (14.0%) |
Income Above Poverty by Sex and Age in University Park
According to the poverty statistics in University Park, males aged under 5 years and females aged 5 years are the age groups that are most secure financially, with 100.0% of males and 100.0% of females in these age groups living above the poverty line.
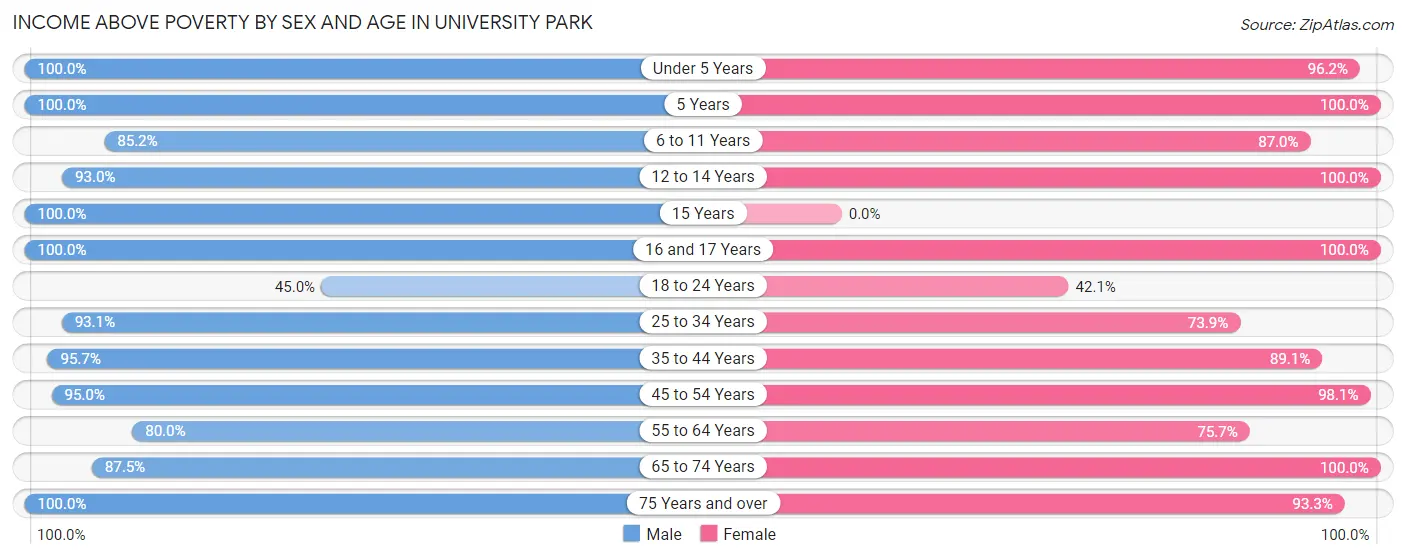
| Age Bracket | Male | Female |
| Under 5 Years | 43 (100.0%) | 25 (96.2%) |
| 5 Years | 1 (100.0%) | 3 (100.0%) |
| 6 to 11 Years | 23 (85.2%) | 20 (87.0%) |
| 12 to 14 Years | 40 (93.0%) | 6 (100.0%) |
| 15 Years | 1 (100.0%) | 0 (0.0%) |
| 16 and 17 Years | 14 (100.0%) | 4 (100.0%) |
| 18 to 24 Years | 9 (45.0%) | 8 (42.1%) |
| 25 to 34 Years | 27 (93.1%) | 17 (73.9%) |
| 35 to 44 Years | 45 (95.7%) | 41 (89.1%) |
| 45 to 54 Years | 19 (95.0%) | 51 (98.1%) |
| 55 to 64 Years | 36 (80.0%) | 28 (75.7%) |
| 65 to 74 Years | 7 (87.5%) | 10 (100.0%) |
| 75 Years and over | 4 (100.0%) | 14 (93.3%) |
| Total | 269 (89.1%) | 227 (86.0%) |
Income Below Poverty Among Married-Couple Families in University Park
The poverty statistics for married-couple families in University Park show that 5.0% or 5 of the total 100 families live below the poverty line. Families with no children have the highest poverty rate of 8.0%, comprising of 4 families. On the other hand, families with 1 or 2 children have the lowest poverty rate of 0.0%, which includes 0 families.
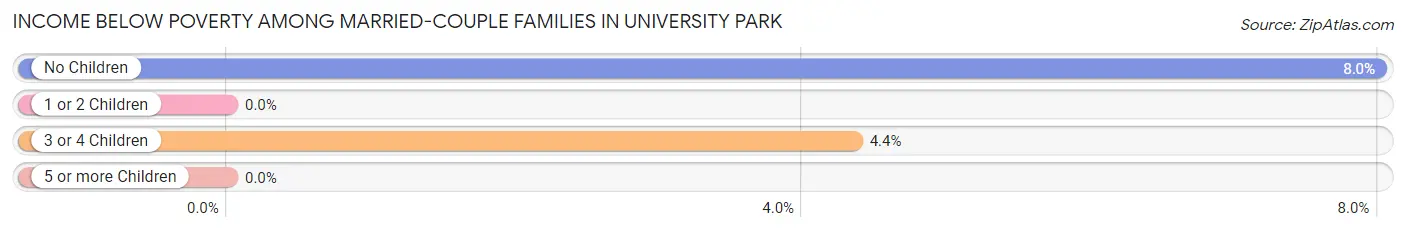
| Children | Above Poverty | Below Poverty |
| No Children | 46 (92.0%) | 4 (8.0%) |
| 1 or 2 Children | 27 (100.0%) | 0 (0.0%) |
| 3 or 4 Children | 22 (95.7%) | 1 (4.3%) |
| 5 or more Children | 0 (0.0%) | 0 (0.0%) |
| Total | 95 (95.0%) | 5 (5.0%) |
Income Below Poverty Among Single-Parent Households in University Park
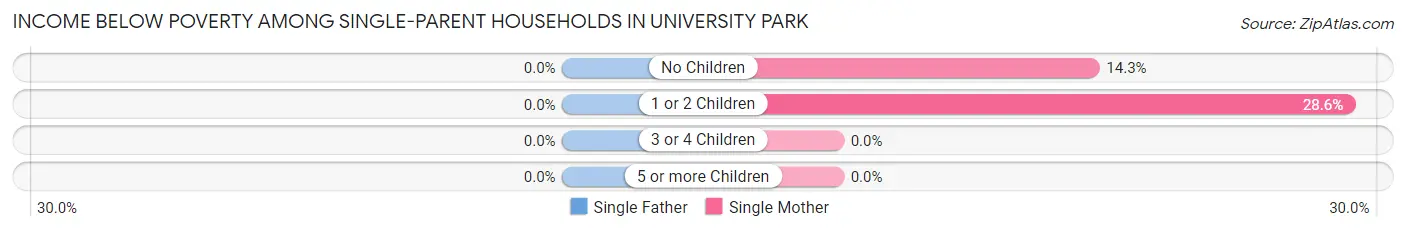
| Children | Single Father | Single Mother |
| No Children | 0 (0.0%) | 1 (14.3%) |
| 1 or 2 Children | 0 (0.0%) | 2 (28.6%) |
| 3 or 4 Children | 0 (0.0%) | 0 (0.0%) |
| 5 or more Children | 0 (0.0%) | 0 (0.0%) |
| Total | 0 (0.0%) | 3 (9.4%) |
Income Below Poverty Among Married-Couple vs Single-Parent Households in University Park
The poverty data for University Park shows that 5 of the married-couple family households (5.0%) and 3 of the single-parent households (8.6%) are living below the poverty level. Within the married-couple family households, those with no children have the highest poverty rate, with 4 households (8.0%) falling below the poverty line. Among the single-parent households, those with 1 or 2 children have the highest poverty rate, with 2 household (22.2%) living below poverty.
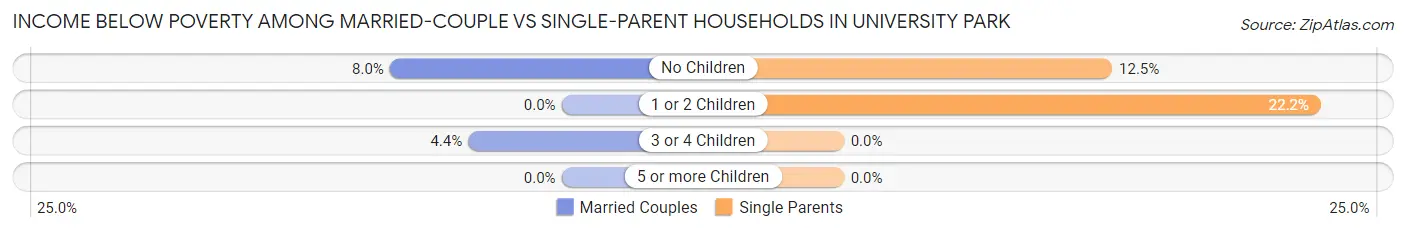
| Children | Married-Couple Families | Single-Parent Households |
| No Children | 4 (8.0%) | 1 (12.5%) |
| 1 or 2 Children | 0 (0.0%) | 2 (22.2%) |
| 3 or 4 Children | 1 (4.3%) | 0 (0.0%) |
| 5 or more Children | 0 (0.0%) | 0 (0.0%) |
| Total | 5 (5.0%) | 3 (8.6%) |
Race in University Park
The most populous races in University Park are White / Caucasian (486 | 85.9%), Two or more Races (60 | 10.6%), and Hispanic or Latino (24 | 4.2%).
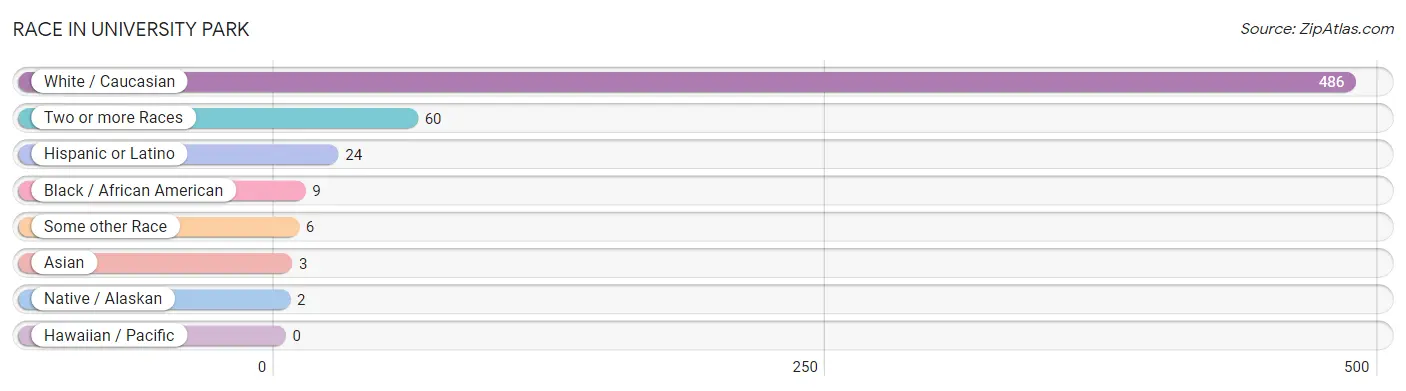
| Race | # Population | % Population |
| Asian | 3 | 0.5% |
| Black / African American | 9 | 1.6% |
| Hawaiian / Pacific | 0 | 0.0% |
| Hispanic or Latino | 24 | 4.2% |
| Native / Alaskan | 2 | 0.4% |
| White / Caucasian | 486 | 85.9% |
| Two or more Races | 60 | 10.6% |
| Some other Race | 6 | 1.1% |
| Total | 566 | 100.0% |
Ancestry in University Park
The most populous ancestries reported in University Park are German (163 | 28.8%), Irish (123 | 21.7%), American (58 | 10.2%), Dutch (46 | 8.1%), and French (33 | 5.8%), together accounting for 74.7% of all University Park residents.
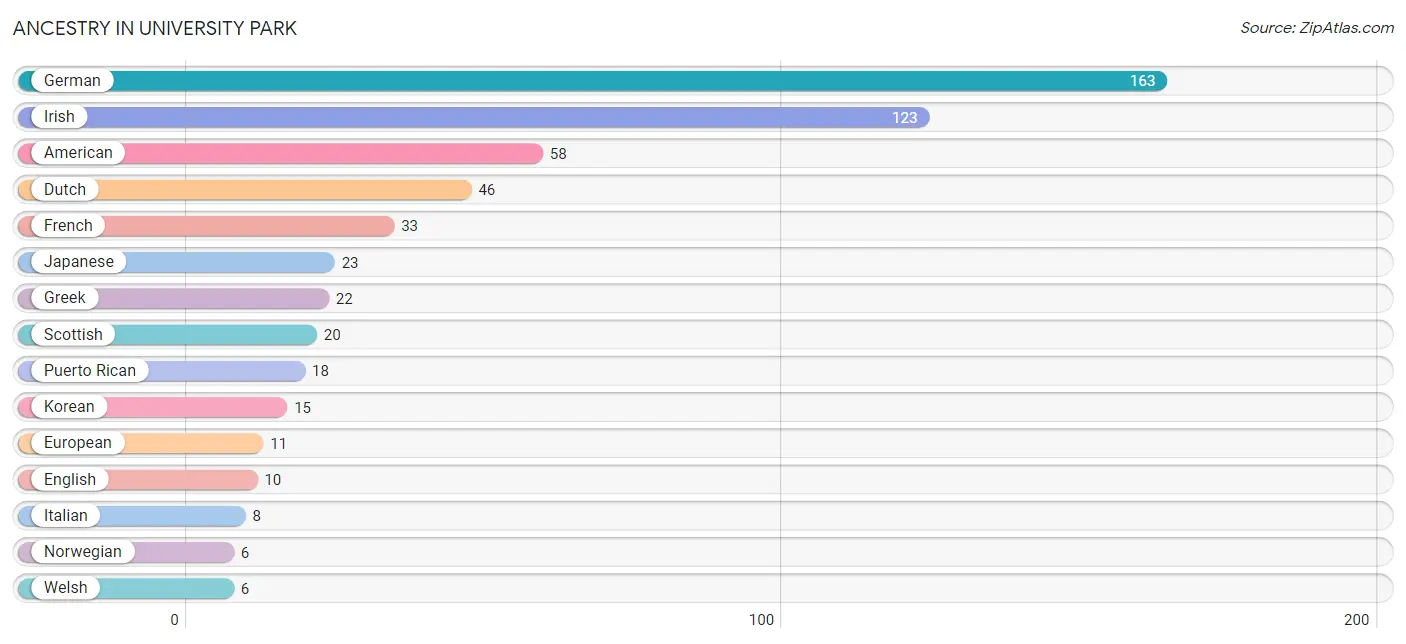
| Ancestry | # Population | % Population |
| American | 58 | 10.2% |
| Arab | 4 | 0.7% |
| Armenian | 1 | 0.2% |
| Blackfeet | 4 | 0.7% |
| Cherokee | 1 | 0.2% |
| Czech | 2 | 0.4% |
| Danish | 2 | 0.4% |
| Dutch | 46 | 8.1% |
| English | 10 | 1.8% |
| European | 11 | 1.9% |
| French | 33 | 5.8% |
| German | 163 | 28.8% |
| Greek | 22 | 3.9% |
| Guamanian / Chamorro | 1 | 0.2% |
| Hopi | 1 | 0.2% |
| Irish | 123 | 21.7% |
| Italian | 8 | 1.4% |
| Japanese | 23 | 4.1% |
| Korean | 15 | 2.6% |
| Moroccan | 4 | 0.7% |
| Norwegian | 6 | 1.1% |
| Polish | 1 | 0.2% |
| Puerto Rican | 18 | 3.2% |
| Romanian | 4 | 0.7% |
| Scotch-Irish | 3 | 0.5% |
| Scottish | 20 | 3.5% |
| Swedish | 2 | 0.4% |
| Swiss | 3 | 0.5% |
| Welsh | 6 | 1.1% | View All 29 Rows |
Immigrants in University Park
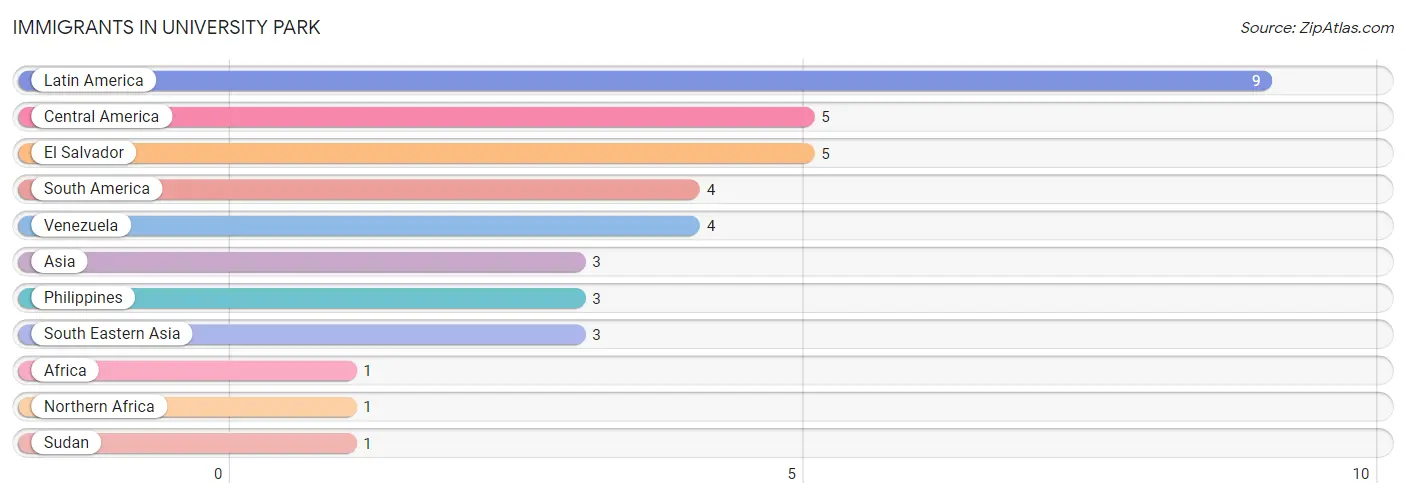
The most numerous immigrant groups reported in University Park came from Latin America (9 | 1.6%), Central America (5 | 0.9%), El Salvador (5 | 0.9%), South America (4 | 0.7%), and Venezuela (4 | 0.7%), together accounting for 4.8% of all University Park residents.
| Immigration Origin | # Population | % Population |
| Africa | 1 | 0.2% |
| Asia | 3 | 0.5% |
| Central America | 5 | 0.9% |
| El Salvador | 5 | 0.9% |
| Latin America | 9 | 1.6% |
| Northern Africa | 1 | 0.2% |
| Philippines | 3 | 0.5% |
| South America | 4 | 0.7% |
| South Eastern Asia | 3 | 0.5% |
| Sudan | 1 | 0.2% |
| Venezuela | 4 | 0.7% | View All 11 Rows |
Sex and Age in University Park
Sex and Age in University Park
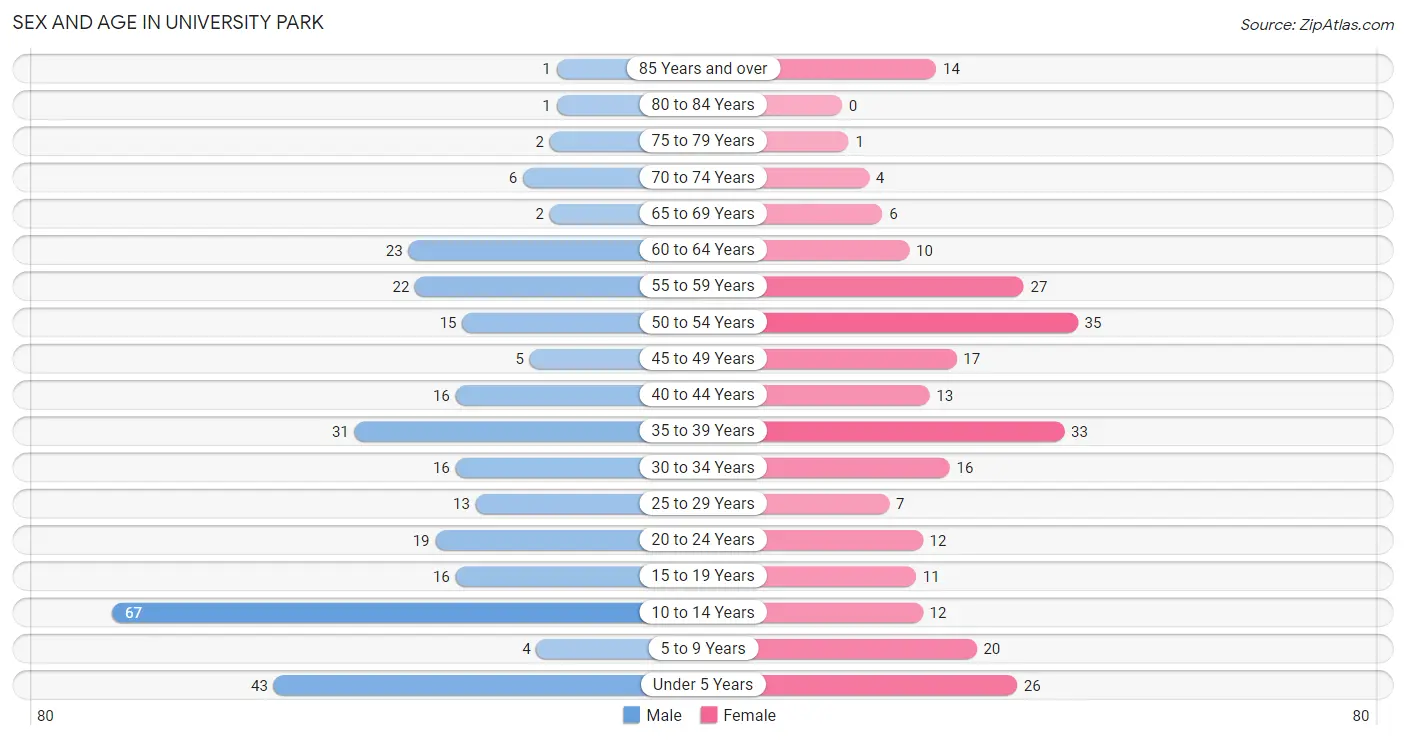
The most populous age groups in University Park are 10 to 14 Years (67 | 22.2%) for men and 50 to 54 Years (35 | 13.3%) for women.
| Age Bracket | Male | Female |
| Under 5 Years | 43 (14.2%) | 26 (9.9%) |
| 5 to 9 Years | 4 (1.3%) | 20 (7.6%) |
| 10 to 14 Years | 67 (22.2%) | 12 (4.5%) |
| 15 to 19 Years | 16 (5.3%) | 11 (4.2%) |
| 20 to 24 Years | 19 (6.3%) | 12 (4.5%) |
| 25 to 29 Years | 13 (4.3%) | 7 (2.6%) |
| 30 to 34 Years | 16 (5.3%) | 16 (6.1%) |
| 35 to 39 Years | 31 (10.3%) | 33 (12.5%) |
| 40 to 44 Years | 16 (5.3%) | 13 (4.9%) |
| 45 to 49 Years | 5 (1.7%) | 17 (6.4%) |
| 50 to 54 Years | 15 (5.0%) | 35 (13.3%) |
| 55 to 59 Years | 22 (7.3%) | 27 (10.2%) |
| 60 to 64 Years | 23 (7.6%) | 10 (3.8%) |
| 65 to 69 Years | 2 (0.7%) | 6 (2.3%) |
| 70 to 74 Years | 6 (2.0%) | 4 (1.5%) |
| 75 to 79 Years | 2 (0.7%) | 1 (0.4%) |
| 80 to 84 Years | 1 (0.3%) | 0 (0.0%) |
| 85 Years and over | 1 (0.3%) | 14 (5.3%) |
| Total | 302 (100.0%) | 264 (100.0%) |
Families and Households in University Park
Median Family Size in University Park
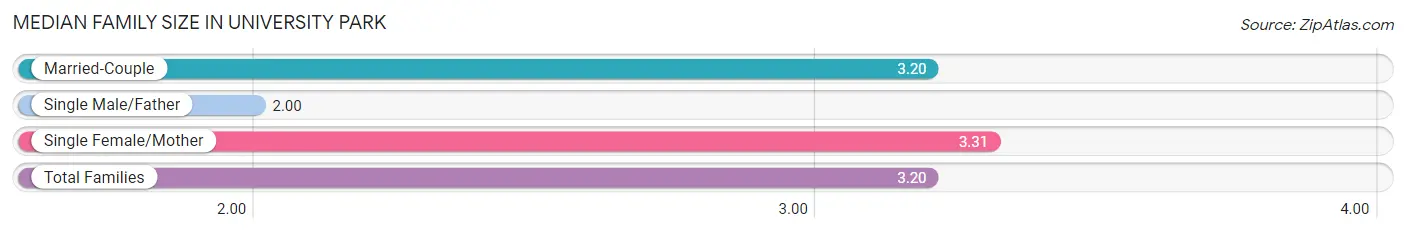
The median family size in University Park is 3.20 persons per family, with single female/mother families (32 | 23.7%) accounting for the largest median family size of 3.31 persons per family. On the other hand, single male/father families (3 | 2.2%) represent the smallest median family size with 2.00 persons per family.
| Family Type | # Families | Family Size |
| Married-Couple | 100 (74.1%) | 3.20 |
| Single Male/Father | 3 (2.2%) | 2.00 |
| Single Female/Mother | 32 (23.7%) | 3.31 |
| Total Families | 135 (100.0%) | 3.20 |
Median Household Size in University Park
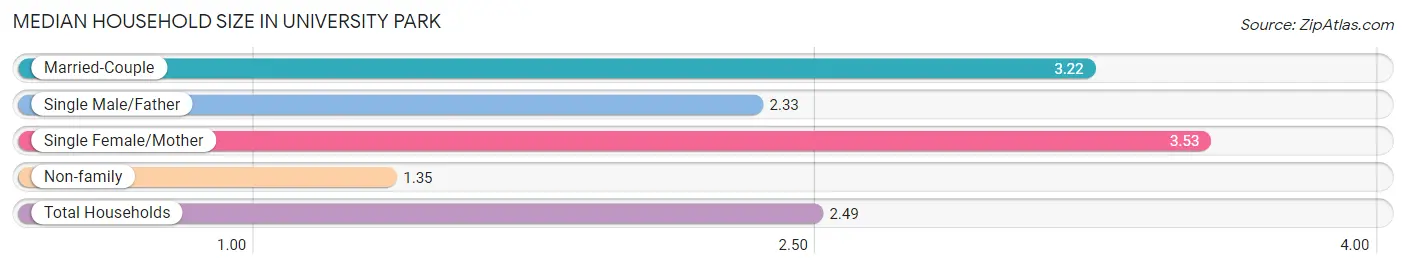
The median household size in University Park is 2.49 persons per household, with single female/mother households (32 | 14.1%) accounting for the largest median household size of 3.53 persons per household. non-family households (92 | 40.5%) represent the smallest median household size with 1.35 persons per household.
| Household Type | # Households | Household Size |
| Married-Couple | 100 (44.1%) | 3.22 |
| Single Male/Father | 3 (1.3%) | 2.33 |
| Single Female/Mother | 32 (14.1%) | 3.53 |
| Non-family | 92 (40.5%) | 1.35 |
| Total Households | 227 (100.0%) | 2.49 |
Household Size by Marriage Status in University Park
Out of a total of 227 households in University Park, 135 (59.5%) are family households, while 92 (40.5%) are nonfamily households. The most numerous type of family households are 2-person households, comprising 55, and the most common type of nonfamily households are 1-person households, comprising 67.
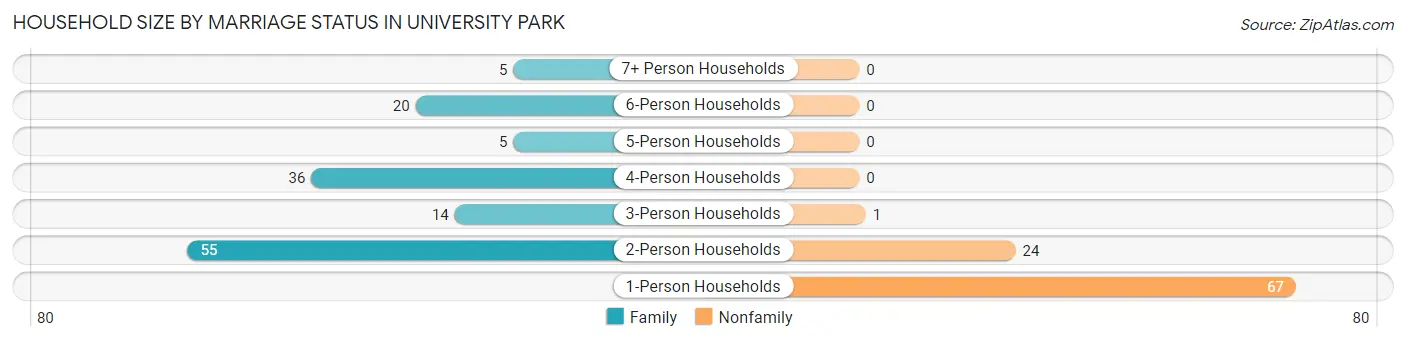
| Household Size | Family Households | Nonfamily Households |
| 1-Person Households | - | 67 (29.5%) |
| 2-Person Households | 55 (24.2%) | 24 (10.6%) |
| 3-Person Households | 14 (6.2%) | 1 (0.4%) |
| 4-Person Households | 36 (15.9%) | 0 (0.0%) |
| 5-Person Households | 5 (2.2%) | 0 (0.0%) |
| 6-Person Households | 20 (8.8%) | 0 (0.0%) |
| 7+ Person Households | 5 (2.2%) | 0 (0.0%) |
| Total | 135 (59.5%) | 92 (40.5%) |
Female Fertility in University Park
Fertility by Age in University Park
Average fertility rate in University Park is 50.0 births per 1,000 women. Women in the age bracket of 20 to 34 years have the highest fertility rate with 114.0 births per 1,000 women. Women in the age bracket of 20 to 34 years acount for 66.7% of all women with births.
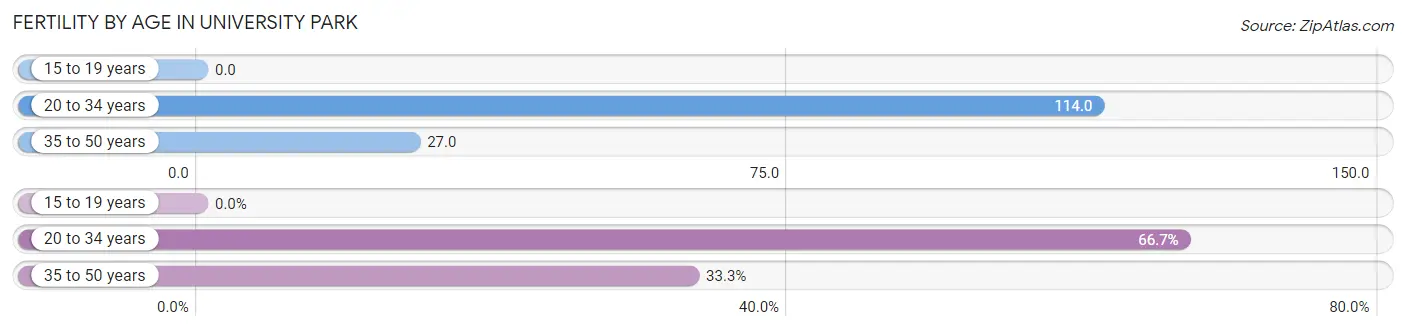
| Age Bracket | Women with Births | Births / 1,000 Women |
| 15 to 19 years | 0 (0.0%) | 0.0 |
| 20 to 34 years | 4 (66.7%) | 114.0 |
| 35 to 50 years | 2 (33.3%) | 27.0 |
| Total | 6 (100.0%) | 50.0 |
Fertility by Age by Marriage Status in University Park
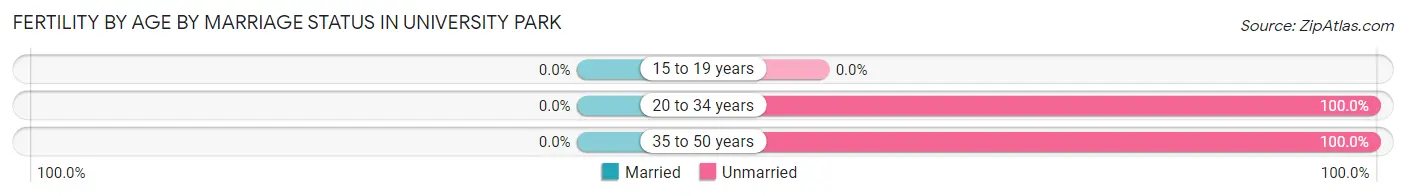
| Age Bracket | Married | Unmarried |
| 15 to 19 years | 0 (0.0%) | 0 (0.0%) |
| 20 to 34 years | 0 (0.0%) | 4 (100.0%) |
| 35 to 50 years | 0 (0.0%) | 2 (100.0%) |
| Total | 0 (0.0%) | 6 (100.0%) |
Fertility by Education in University Park
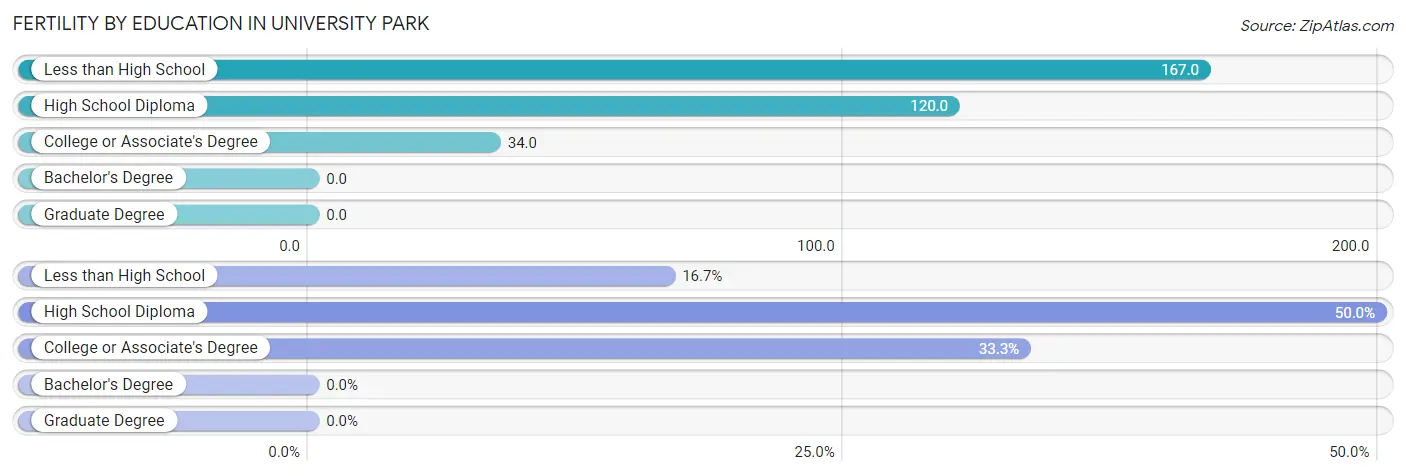
| Educational Attainment | Women with Births | Births / 1,000 Women |
| Less than High School | 1 (16.7%) | 167.0 |
| High School Diploma | 3 (50.0%) | 120.0 |
| College or Associate's Degree | 2 (33.3%) | 34.0 |
| Bachelor's Degree | 0 (0.0%) | 0.0 |
| Graduate Degree | 0 (0.0%) | 0.0 |
| Total | 6 (100.0%) | 50.0 |
Fertility by Education by Marriage Status in University Park
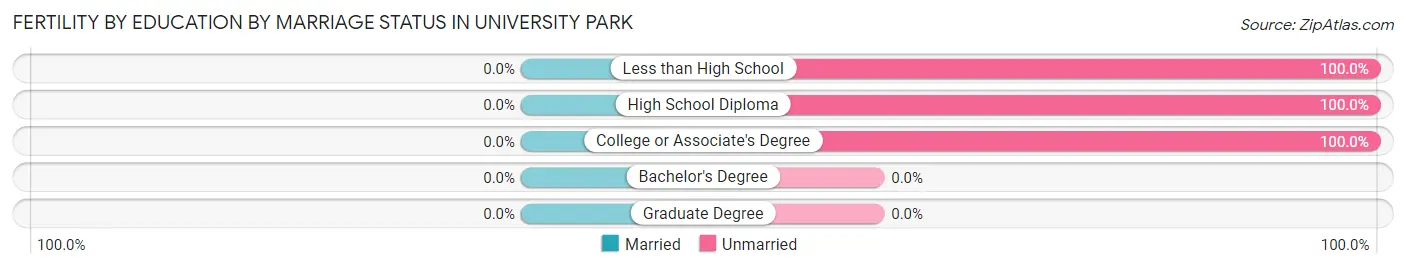
| Educational Attainment | Married | Unmarried |
| Less than High School | 0 (0.0%) | 1 (100.0%) |
| High School Diploma | 0 (0.0%) | 3 (100.0%) |
| College or Associate's Degree | 0 (0.0%) | 2 (100.0%) |
| Bachelor's Degree | 0 (0.0%) | 0 (0.0%) |
| Graduate Degree | 0 (0.0%) | 0 (0.0%) |
| Total | 0 (0.0%) | 6 (100.0%) |
Employment Characteristics in University Park
Employment by Class of Employer in University Park
Among the 280 employed individuals in University Park, private company employees (169 | 60.4%), not-for-profit organizations (39 | 13.9%), and self-employed (not incorporated) (31 | 11.1%) make up the most common classes of employment.
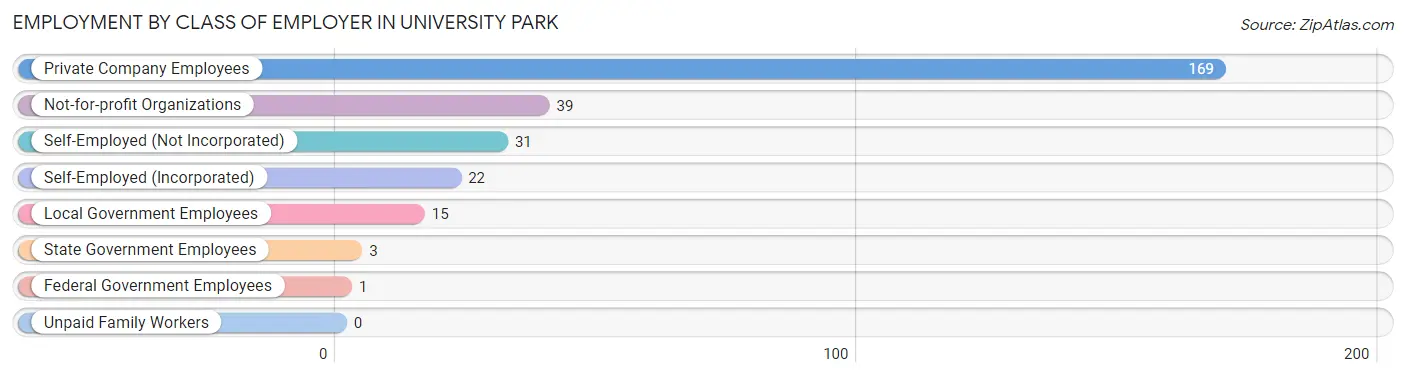
| Employer Class | # Employees | % Employees |
| Private Company Employees | 169 | 60.4% |
| Self-Employed (Incorporated) | 22 | 7.9% |
| Self-Employed (Not Incorporated) | 31 | 11.1% |
| Not-for-profit Organizations | 39 | 13.9% |
| Local Government Employees | 15 | 5.4% |
| State Government Employees | 3 | 1.1% |
| Federal Government Employees | 1 | 0.4% |
| Unpaid Family Workers | 0 | 0.0% |
| Total | 280 | 100.0% |
Employment Status by Age in University Park
According to the labor force statistics for University Park, out of the total population over 16 years of age (393), 73.8% or 290 individuals are in the labor force, with 3.4% or 10 of them unemployed. The age group with the highest labor force participation rate is 25 to 29 years, with 100.0% or 20 individuals in the labor force. Within the labor force, the 30 to 34 years age range has the highest percentage of unemployed individuals, with 25.0% or 7 of them being unemployed.
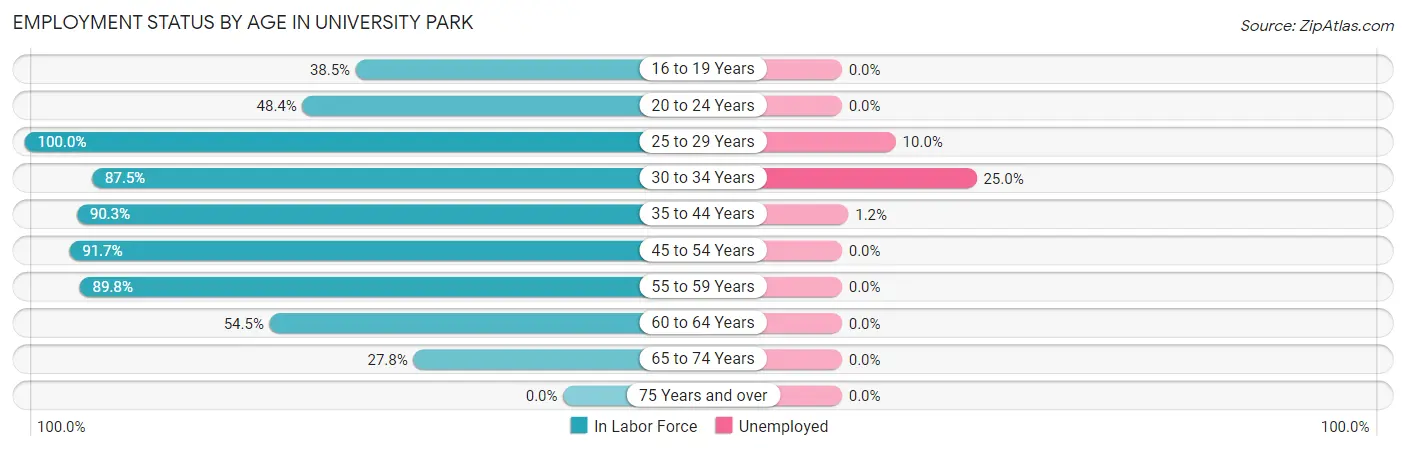
| Age Bracket | In Labor Force | Unemployed |
| 16 to 19 Years | 10 (38.5%) | 0 (0.0%) |
| 20 to 24 Years | 15 (48.4%) | 0 (0.0%) |
| 25 to 29 Years | 20 (100.0%) | 2 (10.0%) |
| 30 to 34 Years | 28 (87.5%) | 7 (25.0%) |
| 35 to 44 Years | 84 (90.3%) | 1 (1.2%) |
| 45 to 54 Years | 66 (91.7%) | 0 (0.0%) |
| 55 to 59 Years | 44 (89.8%) | 0 (0.0%) |
| 60 to 64 Years | 18 (54.5%) | 0 (0.0%) |
| 65 to 74 Years | 5 (27.8%) | 0 (0.0%) |
| 75 Years and over | 0 (0.0%) | 0 (0.0%) |
| Total | 290 (73.8%) | 10 (3.4%) |
Employment Status by Educational Attainment in University Park
According to labor force statistics for University Park, 87.0% of individuals (260) out of the total population between 25 and 64 years of age (299) are in the labor force, with 3.8% or 10 of them being unemployed. The group with the highest labor force participation rate are those with the educational attainment of high school diploma, with 93.8% or 76 individuals in the labor force. Within the labor force, individuals with high school diploma education have the highest percentage of unemployment, with 10.5% or 8 of them being unemployed.
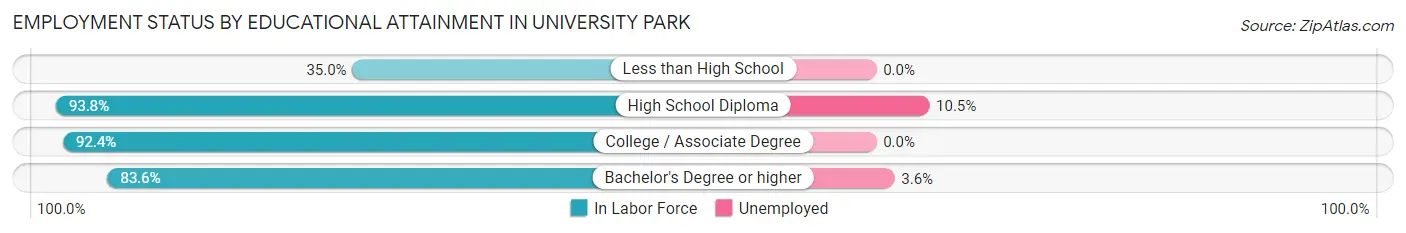
| Educational Attainment | In Labor Force | Unemployed |
| Less than High School | 7 (35.0%) | 0 (0.0%) |
| High School Diploma | 76 (93.8%) | 9 (10.5%) |
| College / Associate Degree | 121 (92.4%) | 0 (0.0%) |
| Bachelor's Degree or higher | 56 (83.6%) | 2 (3.6%) |
| Total | 260 (87.0%) | 11 (3.8%) |
Employment Occupations by Sex in University Park
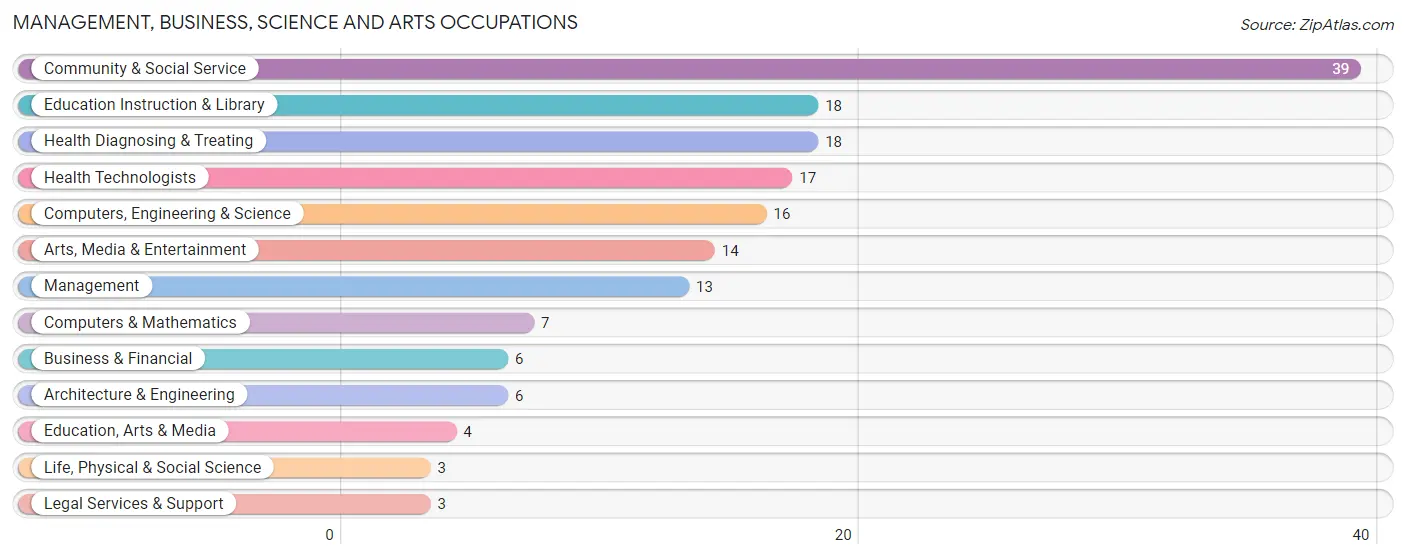
Management, Business, Science and Arts Occupations
The most common Management, Business, Science and Arts occupations in University Park are Community & Social Service (39 | 13.9%), Education Instruction & Library (18 | 6.4%), Health Diagnosing & Treating (18 | 6.4%), Health Technologists (17 | 6.1%), and Computers, Engineering & Science (16 | 5.7%).
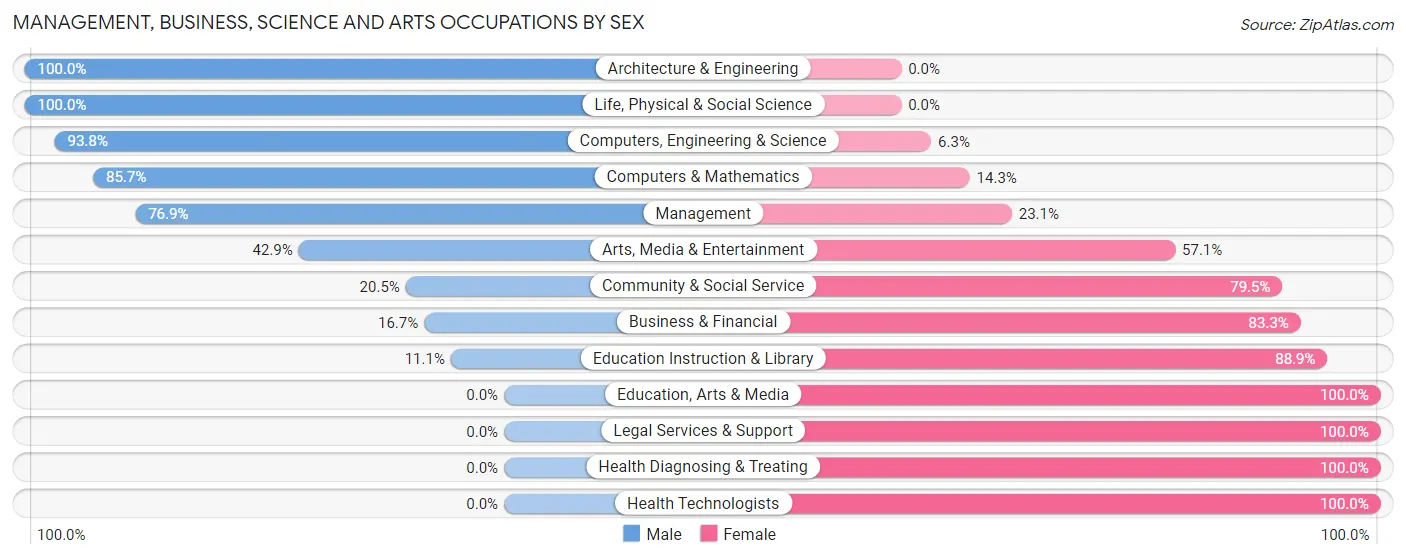
Management, Business, Science and Arts Occupations by Sex
Within the Management, Business, Science and Arts occupations in University Park, the most male-oriented occupations are Architecture & Engineering (100.0%), Life, Physical & Social Science (100.0%), and Computers, Engineering & Science (93.8%), while the most female-oriented occupations are Education, Arts & Media (100.0%), Legal Services & Support (100.0%), and Health Diagnosing & Treating (100.0%).
| Occupation | Male | Female |
| Management | 10 (76.9%) | 3 (23.1%) |
| Business & Financial | 1 (16.7%) | 5 (83.3%) |
| Computers, Engineering & Science | 15 (93.8%) | 1 (6.2%) |
| Computers & Mathematics | 6 (85.7%) | 1 (14.3%) |
| Architecture & Engineering | 6 (100.0%) | 0 (0.0%) |
| Life, Physical & Social Science | 3 (100.0%) | 0 (0.0%) |
| Community & Social Service | 8 (20.5%) | 31 (79.5%) |
| Education, Arts & Media | 0 (0.0%) | 4 (100.0%) |
| Legal Services & Support | 0 (0.0%) | 3 (100.0%) |
| Education Instruction & Library | 2 (11.1%) | 16 (88.9%) |
| Arts, Media & Entertainment | 6 (42.9%) | 8 (57.1%) |
| Health Diagnosing & Treating | 0 (0.0%) | 18 (100.0%) |
| Health Technologists | 0 (0.0%) | 17 (100.0%) |
| Total (Category) | 34 (37.0%) | 58 (63.0%) |
| Total (Overall) | 136 (48.6%) | 144 (51.4%) |
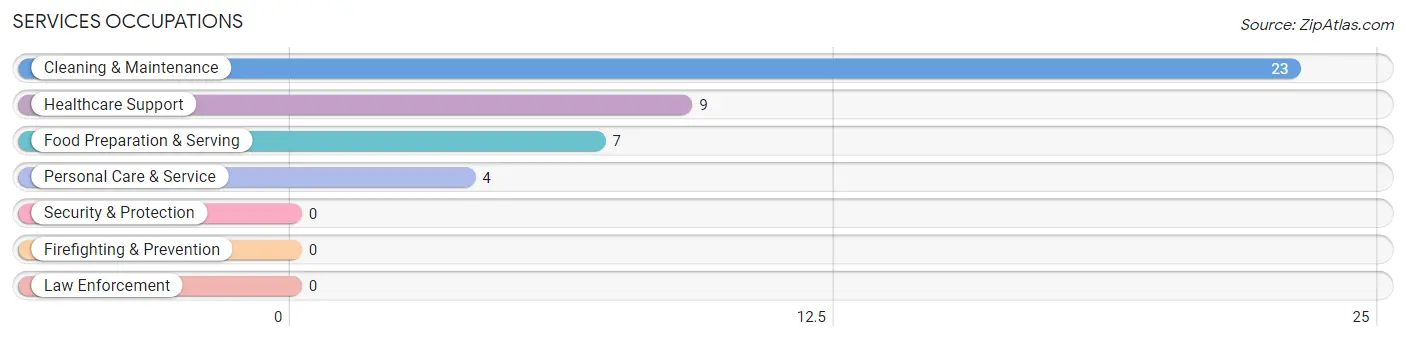
Services Occupations
The most common Services occupations in University Park are Cleaning & Maintenance (23 | 8.2%), Healthcare Support (9 | 3.2%), Food Preparation & Serving (7 | 2.5%), and Personal Care & Service (4 | 1.4%).
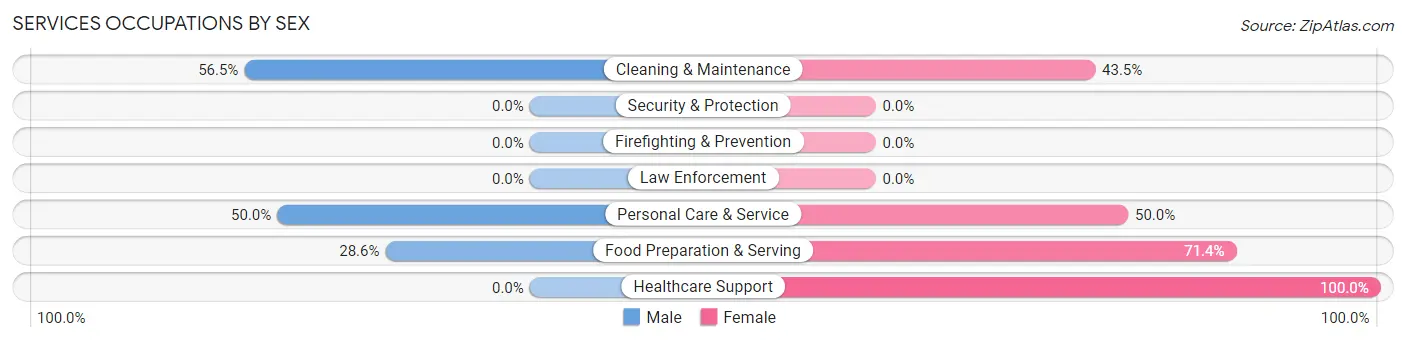
Services Occupations by Sex
Within the Services occupations in University Park, the most male-oriented occupations are Cleaning & Maintenance (56.5%), Personal Care & Service (50.0%), and Food Preparation & Serving (28.6%), while the most female-oriented occupations are Healthcare Support (100.0%), Food Preparation & Serving (71.4%), and Personal Care & Service (50.0%).
| Occupation | Male | Female |
| Healthcare Support | 0 (0.0%) | 9 (100.0%) |
| Security & Protection | 0 (0.0%) | 0 (0.0%) |
| Firefighting & Prevention | 0 (0.0%) | 0 (0.0%) |
| Law Enforcement | 0 (0.0%) | 0 (0.0%) |
| Food Preparation & Serving | 2 (28.6%) | 5 (71.4%) |
| Cleaning & Maintenance | 13 (56.5%) | 10 (43.5%) |
| Personal Care & Service | 2 (50.0%) | 2 (50.0%) |
| Total (Category) | 17 (39.5%) | 26 (60.5%) |
| Total (Overall) | 136 (48.6%) | 144 (51.4%) |
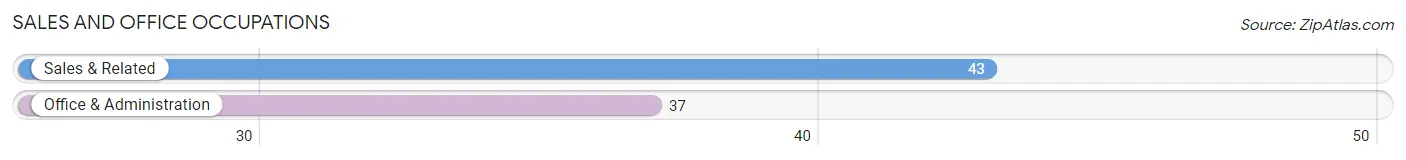
Sales and Office Occupations
The most common Sales and Office occupations in University Park are Sales & Related (43 | 15.4%), and Office & Administration (37 | 13.2%).
Sales and Office Occupations by Sex
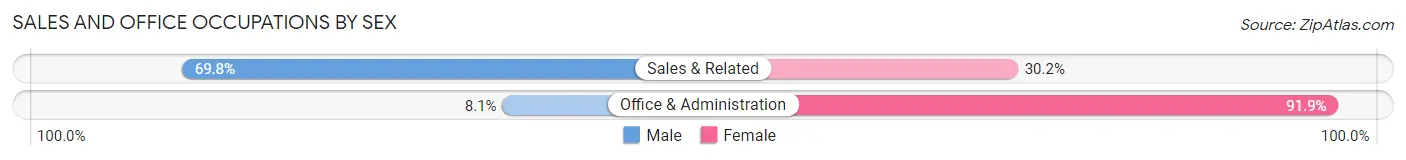
| Occupation | Male | Female |
| Sales & Related | 30 (69.8%) | 13 (30.2%) |
| Office & Administration | 3 (8.1%) | 34 (91.9%) |
| Total (Category) | 33 (41.2%) | 47 (58.8%) |
| Total (Overall) | 136 (48.6%) | 144 (51.4%) |
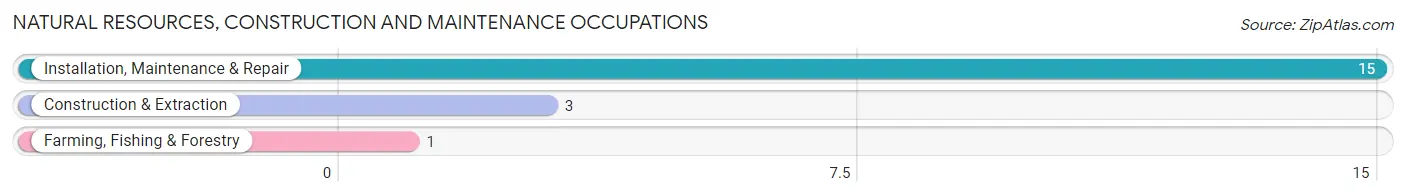
Natural Resources, Construction and Maintenance Occupations
The most common Natural Resources, Construction and Maintenance occupations in University Park are Installation, Maintenance & Repair (15 | 5.4%), Construction & Extraction (3 | 1.1%), and Farming, Fishing & Forestry (1 | 0.4%).
Natural Resources, Construction and Maintenance Occupations by Sex
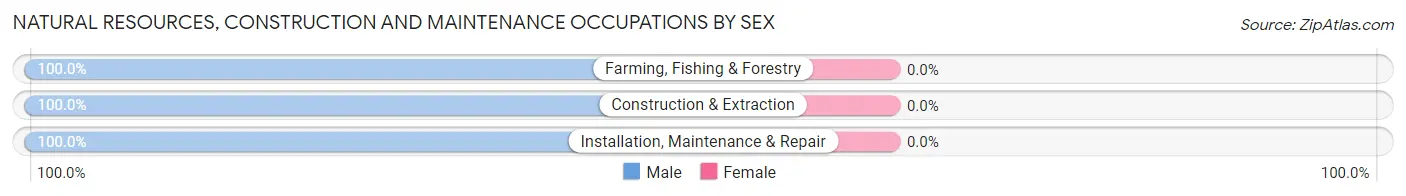
| Occupation | Male | Female |
| Farming, Fishing & Forestry | 1 (100.0%) | 0 (0.0%) |
| Construction & Extraction | 3 (100.0%) | 0 (0.0%) |
| Installation, Maintenance & Repair | 15 (100.0%) | 0 (0.0%) |
| Total (Category) | 19 (100.0%) | 0 (0.0%) |
| Total (Overall) | 136 (48.6%) | 144 (51.4%) |
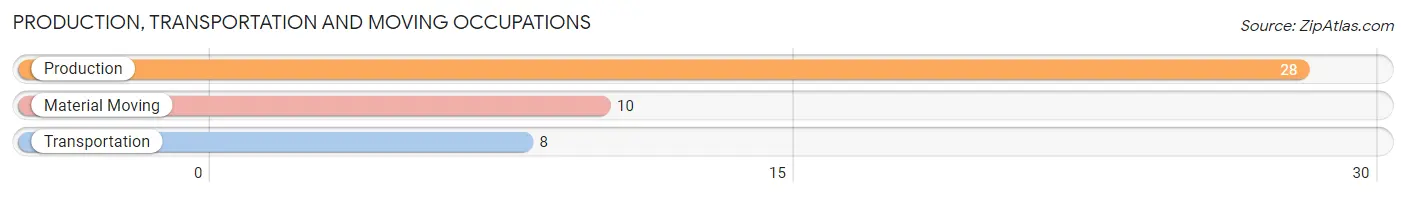
Production, Transportation and Moving Occupations
The most common Production, Transportation and Moving occupations in University Park are Production (28 | 10.0%), Material Moving (10 | 3.6%), and Transportation (8 | 2.9%).
Production, Transportation and Moving Occupations by Sex
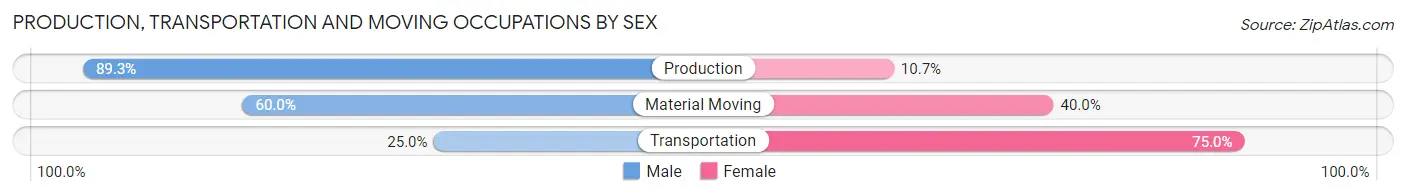
| Occupation | Male | Female |
| Production | 25 (89.3%) | 3 (10.7%) |
| Transportation | 2 (25.0%) | 6 (75.0%) |
| Material Moving | 6 (60.0%) | 4 (40.0%) |
| Total (Category) | 33 (71.7%) | 13 (28.3%) |
| Total (Overall) | 136 (48.6%) | 144 (51.4%) |
Employment Industries by Sex in University Park
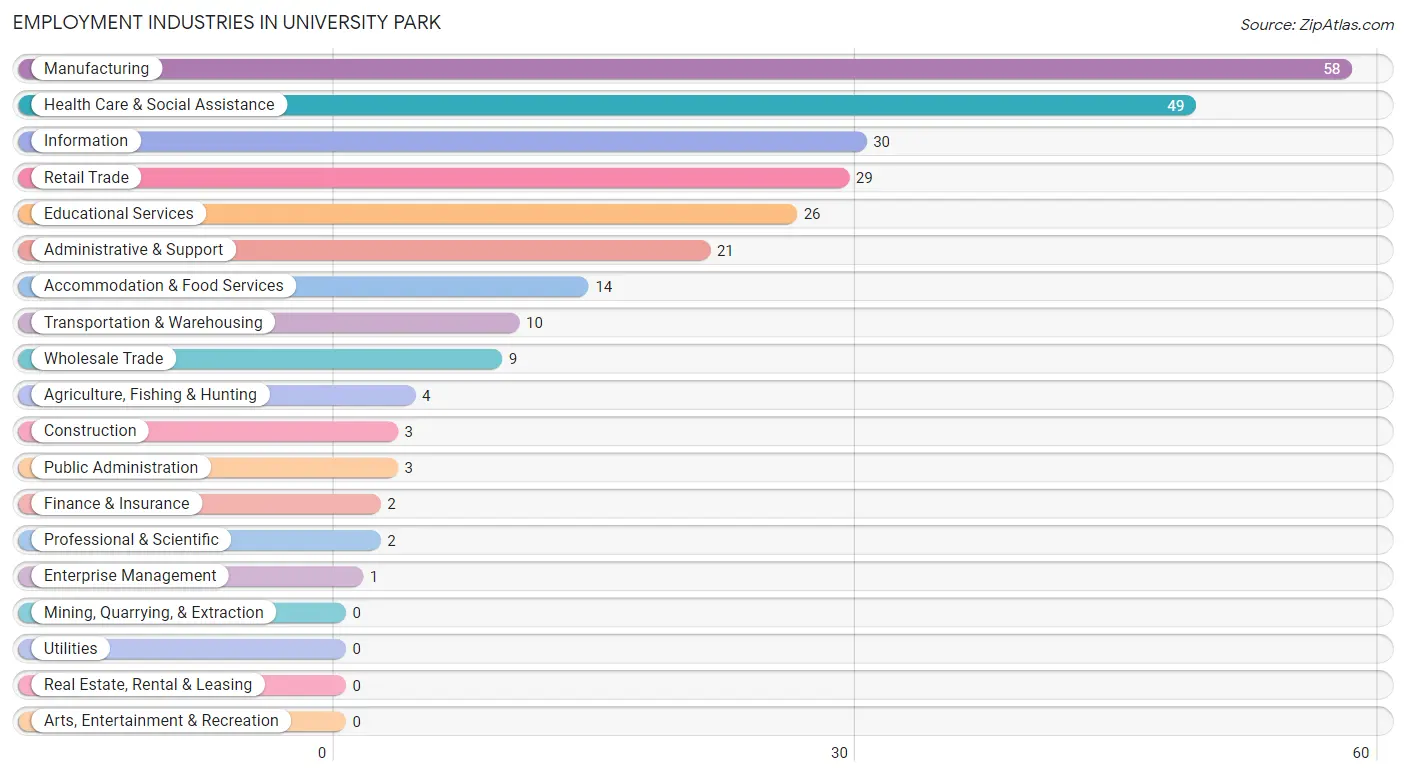
Employment Industries in University Park
The major employment industries in University Park include Manufacturing (58 | 20.7%), Health Care & Social Assistance (49 | 17.5%), Information (30 | 10.7%), Retail Trade (29 | 10.4%), and Educational Services (26 | 9.3%).
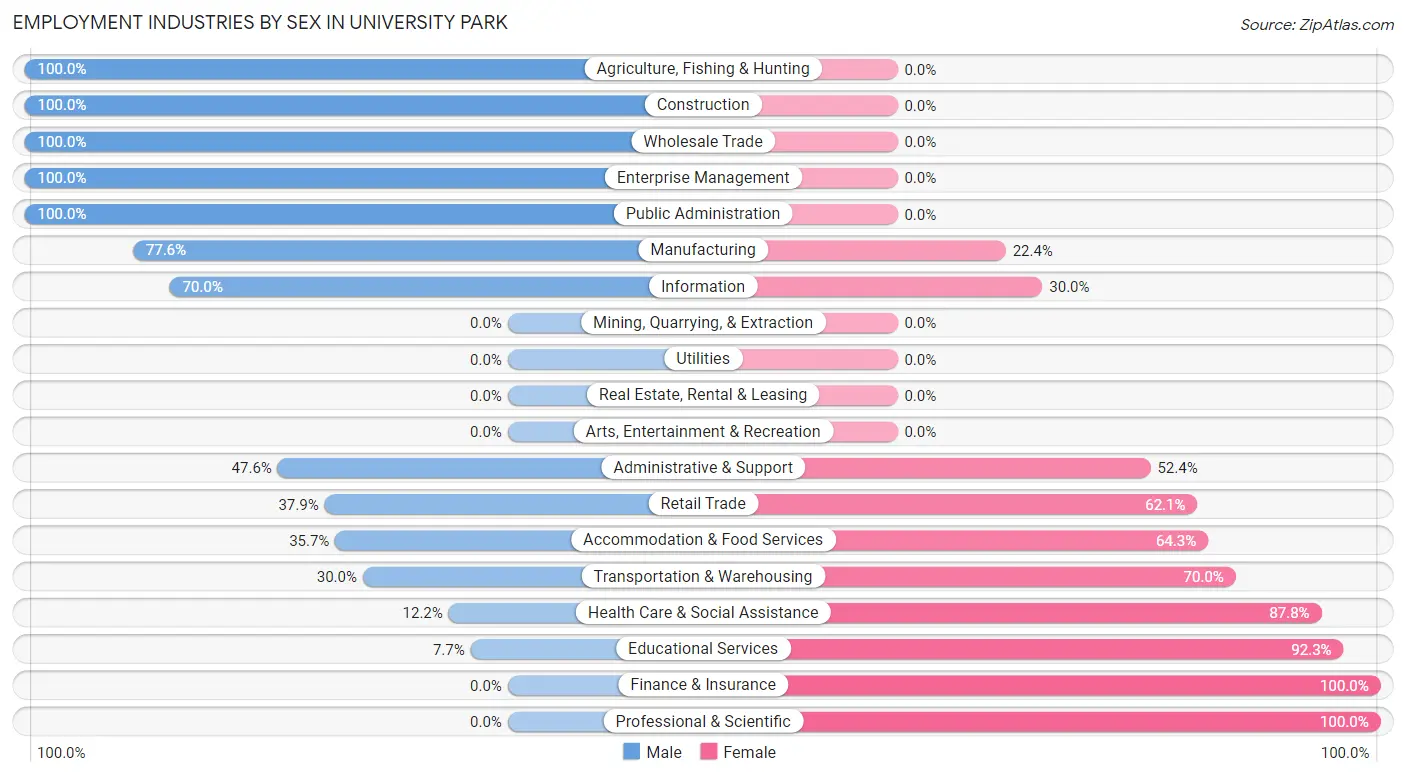
Employment Industries by Sex in University Park
The University Park industries that see more men than women are Agriculture, Fishing & Hunting (100.0%), Construction (100.0%), and Wholesale Trade (100.0%), whereas the industries that tend to have a higher number of women are Finance & Insurance (100.0%), Professional & Scientific (100.0%), and Educational Services (92.3%).
| Industry | Male | Female |
| Agriculture, Fishing & Hunting | 4 (100.0%) | 0 (0.0%) |
| Mining, Quarrying, & Extraction | 0 (0.0%) | 0 (0.0%) |
| Construction | 3 (100.0%) | 0 (0.0%) |
| Manufacturing | 45 (77.6%) | 13 (22.4%) |
| Wholesale Trade | 9 (100.0%) | 0 (0.0%) |
| Retail Trade | 11 (37.9%) | 18 (62.1%) |
| Transportation & Warehousing | 3 (30.0%) | 7 (70.0%) |
| Utilities | 0 (0.0%) | 0 (0.0%) |
| Information | 21 (70.0%) | 9 (30.0%) |
| Finance & Insurance | 0 (0.0%) | 2 (100.0%) |
| Real Estate, Rental & Leasing | 0 (0.0%) | 0 (0.0%) |
| Professional & Scientific | 0 (0.0%) | 2 (100.0%) |
| Enterprise Management | 1 (100.0%) | 0 (0.0%) |
| Administrative & Support | 10 (47.6%) | 11 (52.4%) |
| Educational Services | 2 (7.7%) | 24 (92.3%) |
| Health Care & Social Assistance | 6 (12.2%) | 43 (87.8%) |
| Arts, Entertainment & Recreation | 0 (0.0%) | 0 (0.0%) |
| Accommodation & Food Services | 5 (35.7%) | 9 (64.3%) |
| Public Administration | 3 (100.0%) | 0 (0.0%) |
| Total | 136 (48.6%) | 144 (51.4%) |
Education in University Park
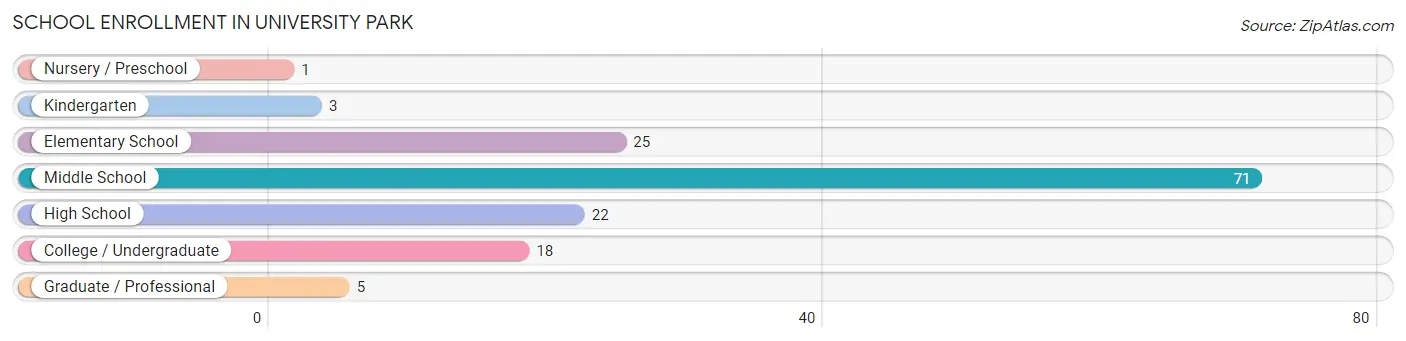
School Enrollment in University Park
The most common levels of schooling among the 145 students in University Park are middle school (71 | 49.0%), elementary school (25 | 17.2%), and high school (22 | 15.2%).
| School Level | # Students | % Students |
| Nursery / Preschool | 1 | 0.7% |
| Kindergarten | 3 | 2.1% |
| Elementary School | 25 | 17.2% |
| Middle School | 71 | 49.0% |
| High School | 22 | 15.2% |
| College / Undergraduate | 18 | 12.4% |
| Graduate / Professional | 5 | 3.5% |
| Total | 145 | 100.0% |
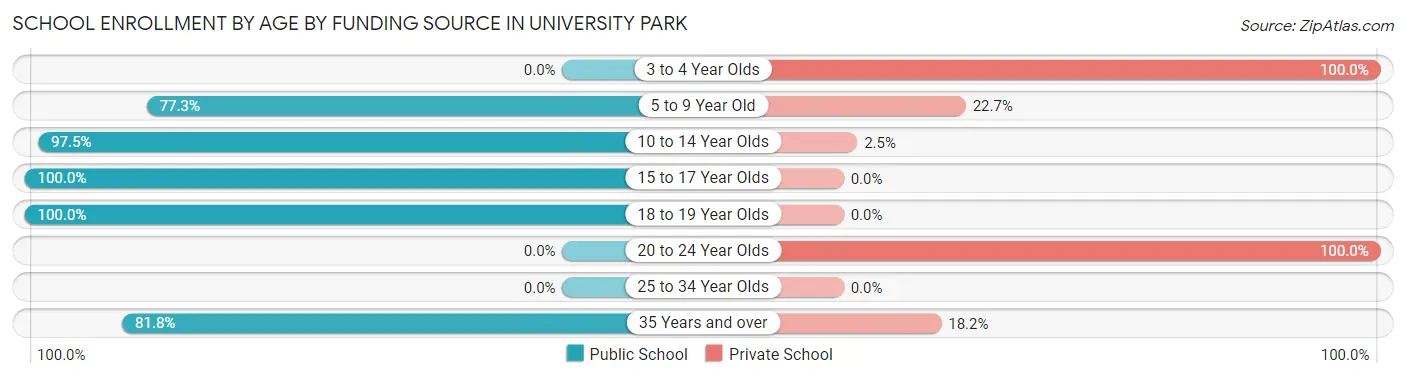
School Enrollment by Age by Funding Source in University Park
Out of a total of 145 students who are enrolled in schools in University Park, 20 (13.8%) attend a private institution, while the remaining 125 (86.2%) are enrolled in public schools. The age group of 3 to 4 year olds has the highest likelihood of being enrolled in private schools, with 1 (100.0% in the age bracket) enrolled. Conversely, the age group of 15 to 17 year olds has the lowest likelihood of being enrolled in a private school, with 19 (100.0% in the age bracket) attending a public institution.
| Age Bracket | Public School | Private School |
| 3 to 4 Year Olds | 0 (0.0%) | 1 (100.0%) |
| 5 to 9 Year Old | 17 (77.3%) | 5 (22.7%) |
| 10 to 14 Year Olds | 77 (97.5%) | 2 (2.5%) |
| 15 to 17 Year Olds | 19 (100.0%) | 0 (0.0%) |
| 18 to 19 Year Olds | 3 (100.0%) | 0 (0.0%) |
| 20 to 24 Year Olds | 0 (0.0%) | 10 (100.0%) |
| 25 to 34 Year Olds | 0 (0.0%) | 0 (0.0%) |
| 35 Years and over | 9 (81.8%) | 2 (18.2%) |
| Total | 125 (86.2%) | 20 (13.8%) |
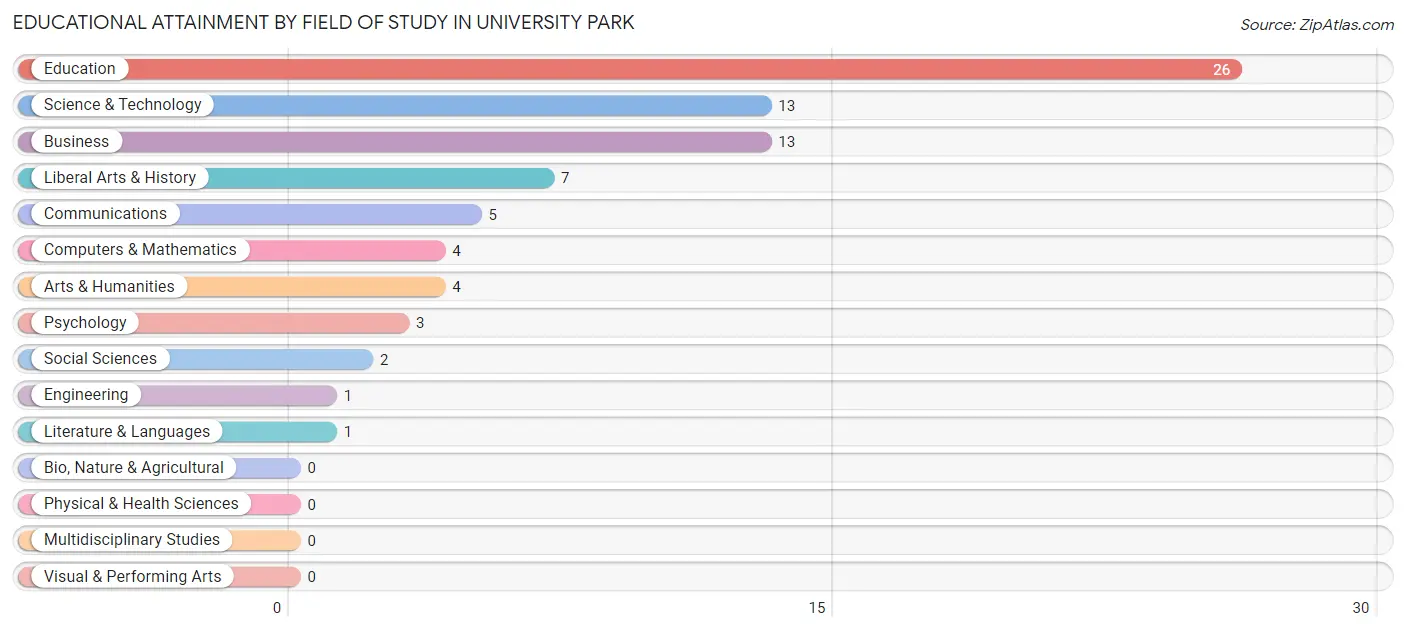
Educational Attainment by Field of Study in University Park
Education (26 | 32.9%), science & technology (13 | 16.5%), business (13 | 16.5%), liberal arts & history (7 | 8.9%), and communications (5 | 6.3%) are the most common fields of study among 79 individuals in University Park who have obtained a bachelor's degree or higher.
| Field of Study | # Graduates | % Graduates |
| Computers & Mathematics | 4 | 5.1% |
| Bio, Nature & Agricultural | 0 | 0.0% |
| Physical & Health Sciences | 0 | 0.0% |
| Psychology | 3 | 3.8% |
| Social Sciences | 2 | 2.5% |
| Engineering | 1 | 1.3% |
| Multidisciplinary Studies | 0 | 0.0% |
| Science & Technology | 13 | 16.5% |
| Business | 13 | 16.5% |
| Education | 26 | 32.9% |
| Literature & Languages | 1 | 1.3% |
| Liberal Arts & History | 7 | 8.9% |
| Visual & Performing Arts | 0 | 0.0% |
| Communications | 5 | 6.3% |
| Arts & Humanities | 4 | 5.1% |
| Total | 79 | 100.0% |
Transportation & Commute in University Park
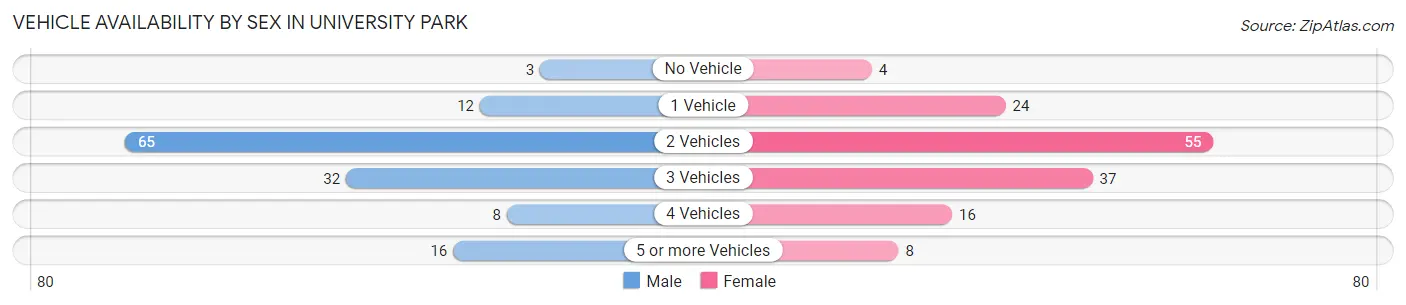
Vehicle Availability by Sex in University Park
The most prevalent vehicle ownership categories in University Park are males with 2 vehicles (65, accounting for 47.8%) and females with 2 vehicles (55, making up 45.1%).
| Vehicles Available | Male | Female |
| No Vehicle | 3 (2.2%) | 4 (2.8%) |
| 1 Vehicle | 12 (8.8%) | 24 (16.7%) |
| 2 Vehicles | 65 (47.8%) | 55 (38.2%) |
| 3 Vehicles | 32 (23.5%) | 37 (25.7%) |
| 4 Vehicles | 8 (5.9%) | 16 (11.1%) |
| 5 or more Vehicles | 16 (11.8%) | 8 (5.6%) |
| Total | 136 (100.0%) | 144 (100.0%) |
Commute Time in University Park
The most frequently occuring commute durations in University Park are 5 to 9 minutes (52 commuters, 19.9%), 20 to 24 minutes (49 commuters, 18.8%), and less than 5 minutes (47 commuters, 18.0%).
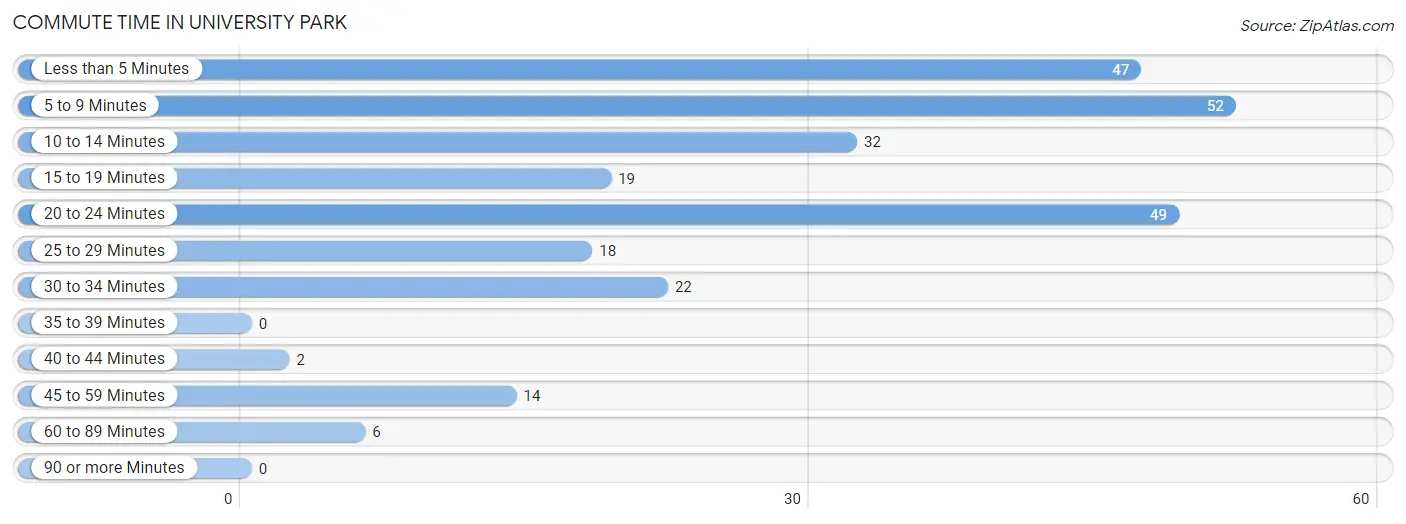
| Commute Time | # Commuters | % Commuters |
| Less than 5 Minutes | 47 | 18.0% |
| 5 to 9 Minutes | 52 | 19.9% |
| 10 to 14 Minutes | 32 | 12.3% |
| 15 to 19 Minutes | 19 | 7.3% |
| 20 to 24 Minutes | 49 | 18.8% |
| 25 to 29 Minutes | 18 | 6.9% |
| 30 to 34 Minutes | 22 | 8.4% |
| 35 to 39 Minutes | 0 | 0.0% |
| 40 to 44 Minutes | 2 | 0.8% |
| 45 to 59 Minutes | 14 | 5.4% |
| 60 to 89 Minutes | 6 | 2.3% |
| 90 or more Minutes | 0 | 0.0% |
Commute Time by Sex in University Park
The most common commute times in University Park are less than 5 minutes (33 commuters, 25.8%) for males and 5 to 9 minutes (34 commuters, 25.6%) for females.
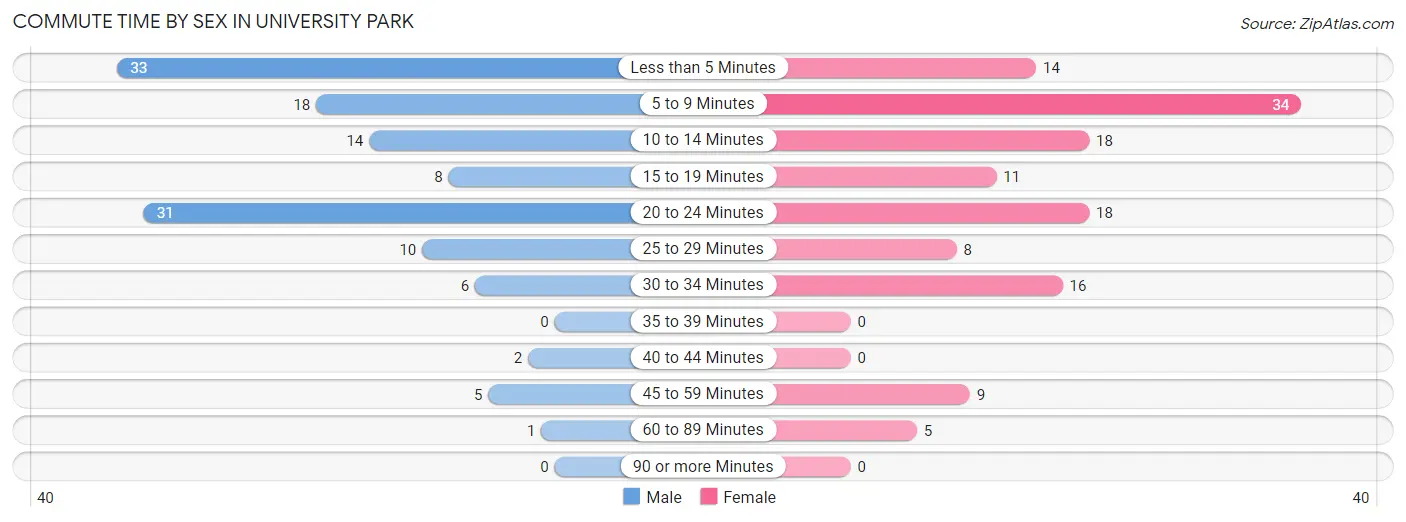
| Commute Time | Male | Female |
| Less than 5 Minutes | 33 (25.8%) | 14 (10.5%) |
| 5 to 9 Minutes | 18 (14.1%) | 34 (25.6%) |
| 10 to 14 Minutes | 14 (10.9%) | 18 (13.5%) |
| 15 to 19 Minutes | 8 (6.2%) | 11 (8.3%) |
| 20 to 24 Minutes | 31 (24.2%) | 18 (13.5%) |
| 25 to 29 Minutes | 10 (7.8%) | 8 (6.0%) |
| 30 to 34 Minutes | 6 (4.7%) | 16 (12.0%) |
| 35 to 39 Minutes | 0 (0.0%) | 0 (0.0%) |
| 40 to 44 Minutes | 2 (1.6%) | 0 (0.0%) |
| 45 to 59 Minutes | 5 (3.9%) | 9 (6.8%) |
| 60 to 89 Minutes | 1 (0.8%) | 5 (3.8%) |
| 90 or more Minutes | 0 (0.0%) | 0 (0.0%) |
Time of Departure to Work by Sex in University Park
The most frequent times of departure to work in University Park are 12:00 AM to 4:59 AM (28, 21.9%) for males and 7:30 AM to 7:59 AM (42, 31.6%) for females.
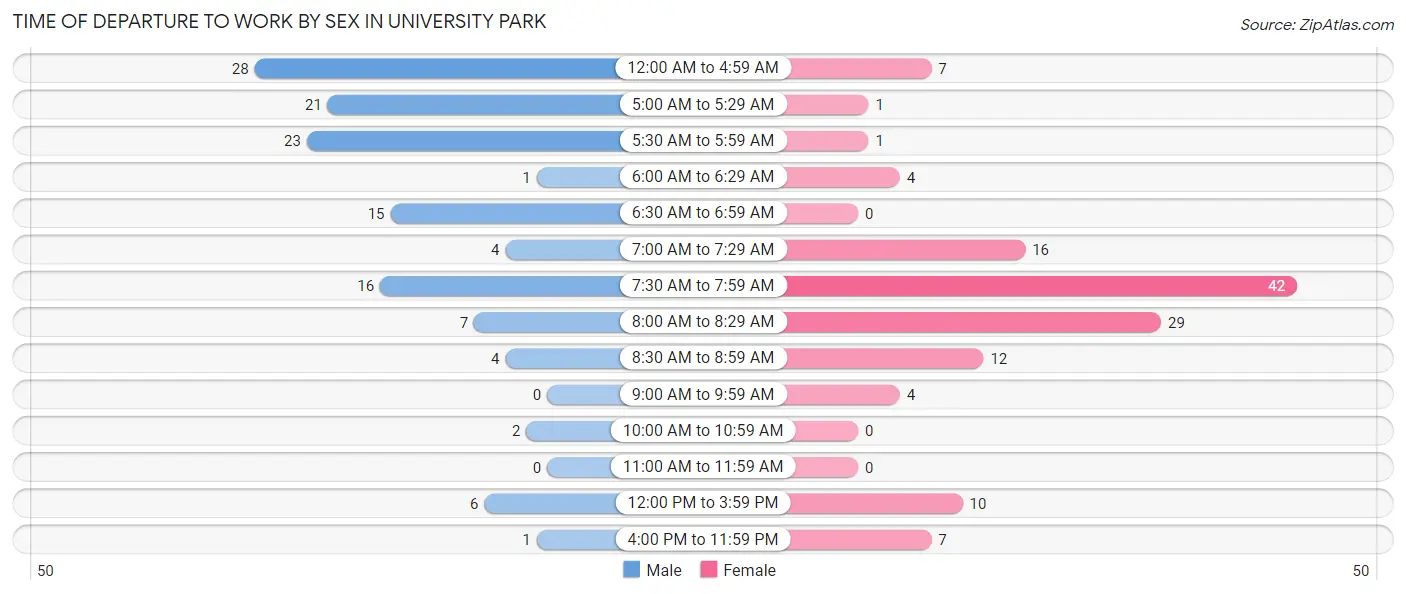
| Time of Departure | Male | Female |
| 12:00 AM to 4:59 AM | 28 (21.9%) | 7 (5.3%) |
| 5:00 AM to 5:29 AM | 21 (16.4%) | 1 (0.7%) |
| 5:30 AM to 5:59 AM | 23 (18.0%) | 1 (0.7%) |
| 6:00 AM to 6:29 AM | 1 (0.8%) | 4 (3.0%) |
| 6:30 AM to 6:59 AM | 15 (11.7%) | 0 (0.0%) |
| 7:00 AM to 7:29 AM | 4 (3.1%) | 16 (12.0%) |
| 7:30 AM to 7:59 AM | 16 (12.5%) | 42 (31.6%) |
| 8:00 AM to 8:29 AM | 7 (5.5%) | 29 (21.8%) |
| 8:30 AM to 8:59 AM | 4 (3.1%) | 12 (9.0%) |
| 9:00 AM to 9:59 AM | 0 (0.0%) | 4 (3.0%) |
| 10:00 AM to 10:59 AM | 2 (1.6%) | 0 (0.0%) |
| 11:00 AM to 11:59 AM | 0 (0.0%) | 0 (0.0%) |
| 12:00 PM to 3:59 PM | 6 (4.7%) | 10 (7.5%) |
| 4:00 PM to 11:59 PM | 1 (0.8%) | 7 (5.3%) |
| Total | 128 (100.0%) | 133 (100.0%) |
Housing Occupancy in University Park
Occupancy by Ownership in University Park
Of the total 227 dwellings in University Park, owner-occupied units account for 140 (61.7%), while renter-occupied units make up 87 (38.3%).
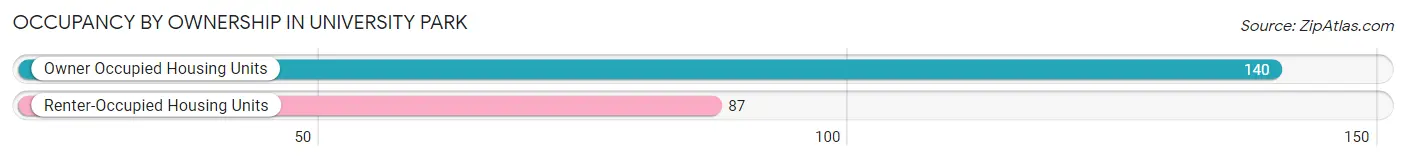
| Occupancy | # Housing Units | % Housing Units |
| Owner Occupied Housing Units | 140 | 61.7% |
| Renter-Occupied Housing Units | 87 | 38.3% |
| Total Occupied Housing Units | 227 | 100.0% |
Occupancy by Household Size in University Park
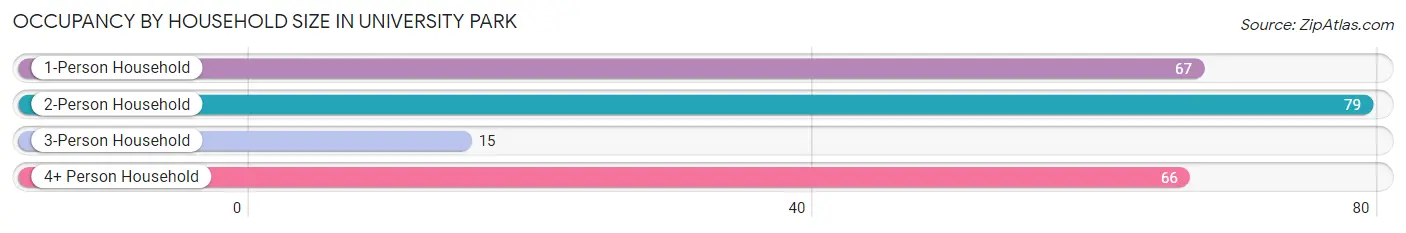
| Household Size | # Housing Units | % Housing Units |
| 1-Person Household | 67 | 29.5% |
| 2-Person Household | 79 | 34.8% |
| 3-Person Household | 15 | 6.6% |
| 4+ Person Household | 66 | 29.1% |
| Total Housing Units | 227 | 100.0% |
Occupancy by Ownership by Household Size in University Park
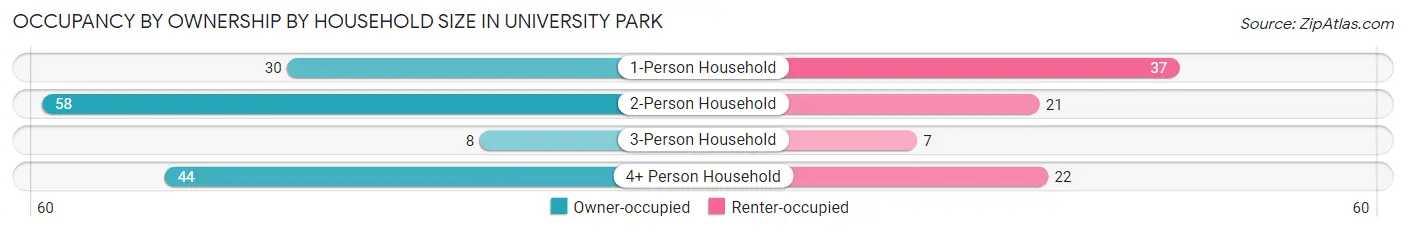
| Household Size | Owner-occupied | Renter-occupied |
| 1-Person Household | 30 (44.8%) | 37 (55.2%) |
| 2-Person Household | 58 (73.4%) | 21 (26.6%) |
| 3-Person Household | 8 (53.3%) | 7 (46.7%) |
| 4+ Person Household | 44 (66.7%) | 22 (33.3%) |
| Total Housing Units | 140 (61.7%) | 87 (38.3%) |
Occupancy by Educational Attainment in University Park
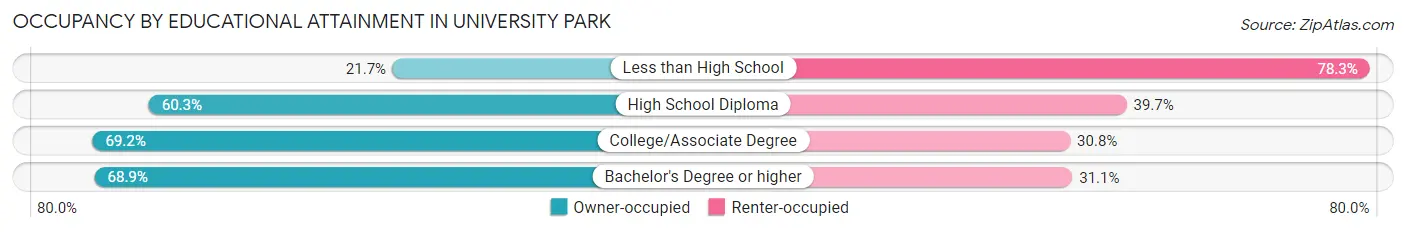
| Household Size | Owner-occupied | Renter-occupied |
| Less than High School | 5 (21.7%) | 18 (78.3%) |
| High School Diploma | 41 (60.3%) | 27 (39.7%) |
| College/Associate Degree | 63 (69.2%) | 28 (30.8%) |
| Bachelor's Degree or higher | 31 (68.9%) | 14 (31.1%) |
Occupancy by Age of Householder in University Park
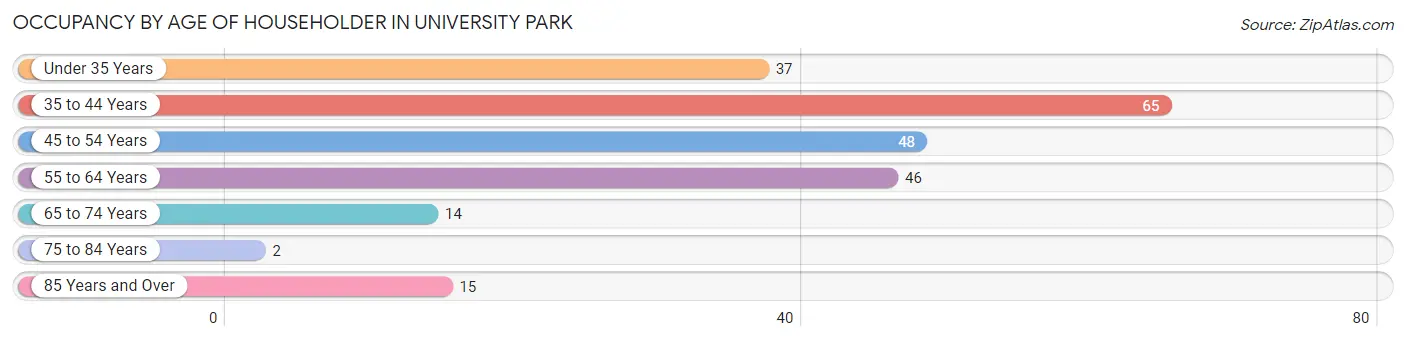
| Age Bracket | # Households | % Households |
| Under 35 Years | 37 | 16.3% |
| 35 to 44 Years | 65 | 28.6% |
| 45 to 54 Years | 48 | 21.1% |
| 55 to 64 Years | 46 | 20.3% |
| 65 to 74 Years | 14 | 6.2% |
| 75 to 84 Years | 2 | 0.9% |
| 85 Years and Over | 15 | 6.6% |
| Total | 227 | 100.0% |
Housing Finances in University Park
Median Income by Occupancy in University Park
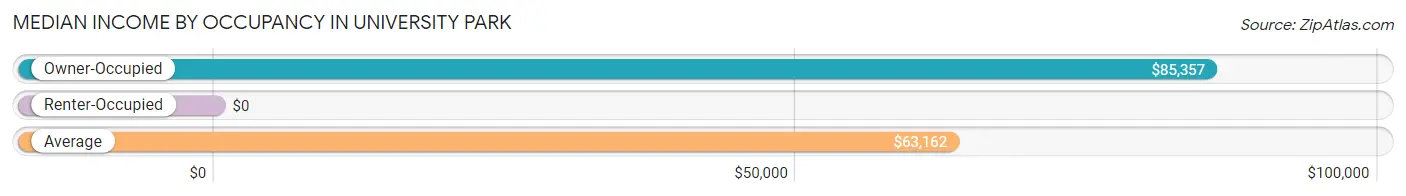
| Occupancy Type | # Households | Median Income |
| Owner-Occupied | 140 (61.7%) | $85,357 |
| Renter-Occupied | 87 (38.3%) | $0 |
| Average | 227 (100.0%) | $63,162 |
Occupancy by Householder Income Bracket in University Park
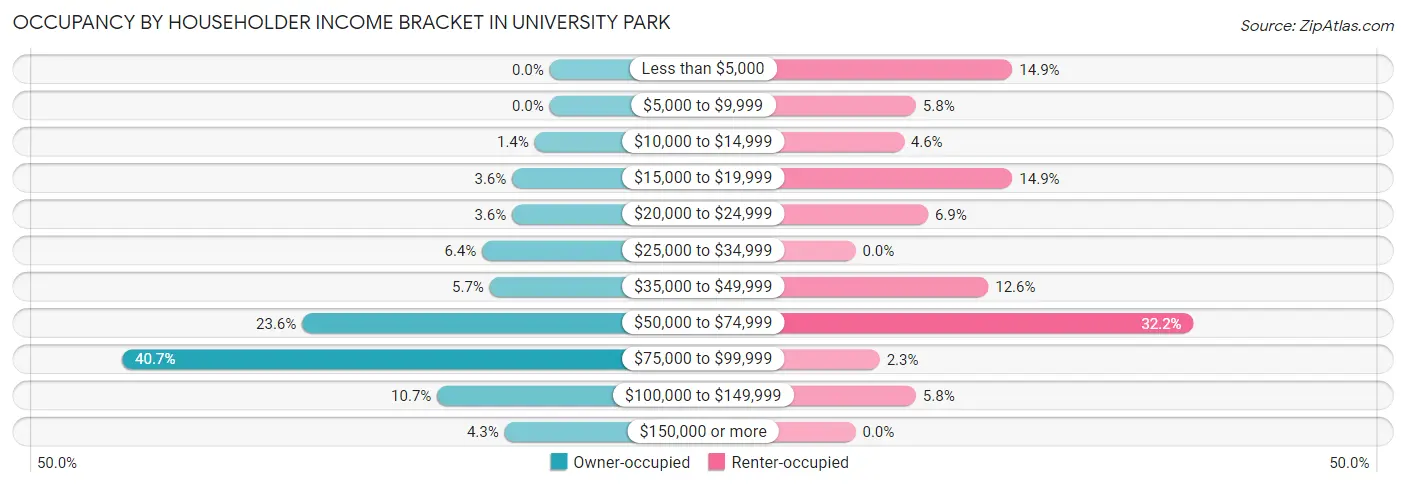
| Income Bracket | Owner-occupied | Renter-occupied |
| Less than $5,000 | 0 (0.0%) | 13 (14.9%) |
| $5,000 to $9,999 | 0 (0.0%) | 5 (5.8%) |
| $10,000 to $14,999 | 2 (1.4%) | 4 (4.6%) |
| $15,000 to $19,999 | 5 (3.6%) | 13 (14.9%) |
| $20,000 to $24,999 | 5 (3.6%) | 6 (6.9%) |
| $25,000 to $34,999 | 9 (6.4%) | 0 (0.0%) |
| $35,000 to $49,999 | 8 (5.7%) | 11 (12.6%) |
| $50,000 to $74,999 | 33 (23.6%) | 28 (32.2%) |
| $75,000 to $99,999 | 57 (40.7%) | 2 (2.3%) |
| $100,000 to $149,999 | 15 (10.7%) | 5 (5.8%) |
| $150,000 or more | 6 (4.3%) | 0 (0.0%) |
| Total | 140 (100.0%) | 87 (100.0%) |
Monthly Housing Cost Tiers in University Park
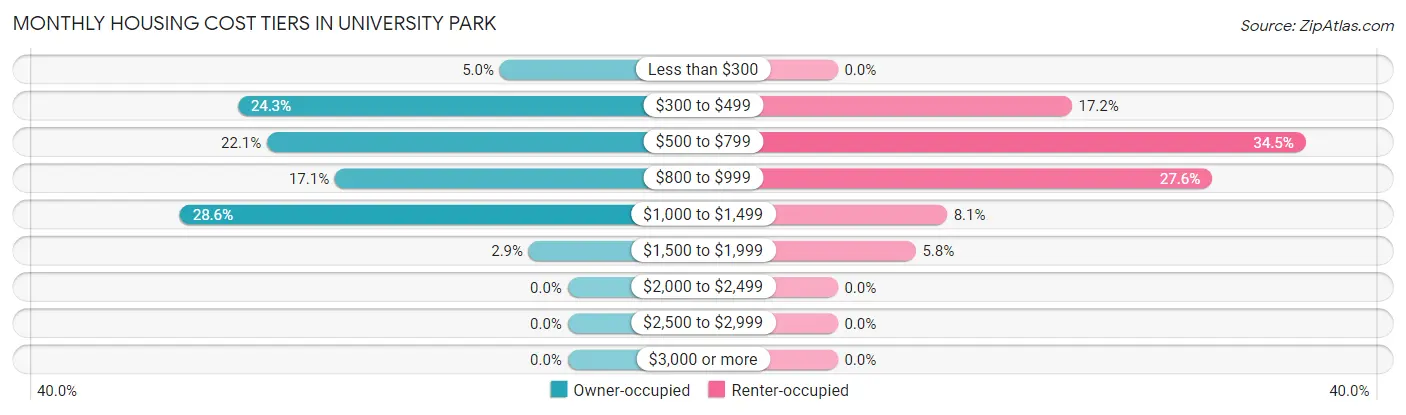
| Monthly Cost | Owner-occupied | Renter-occupied |
| Less than $300 | 7 (5.0%) | 0 (0.0%) |
| $300 to $499 | 34 (24.3%) | 15 (17.2%) |
| $500 to $799 | 31 (22.1%) | 30 (34.5%) |
| $800 to $999 | 24 (17.1%) | 24 (27.6%) |
| $1,000 to $1,499 | 40 (28.6%) | 7 (8.1%) |
| $1,500 to $1,999 | 4 (2.9%) | 5 (5.8%) |
| $2,000 to $2,499 | 0 (0.0%) | 0 (0.0%) |
| $2,500 to $2,999 | 0 (0.0%) | 0 (0.0%) |
| $3,000 or more | 0 (0.0%) | 0 (0.0%) |
| Total | 140 (100.0%) | 87 (100.0%) |
Physical Housing Characteristics in University Park
Housing Structures in University Park
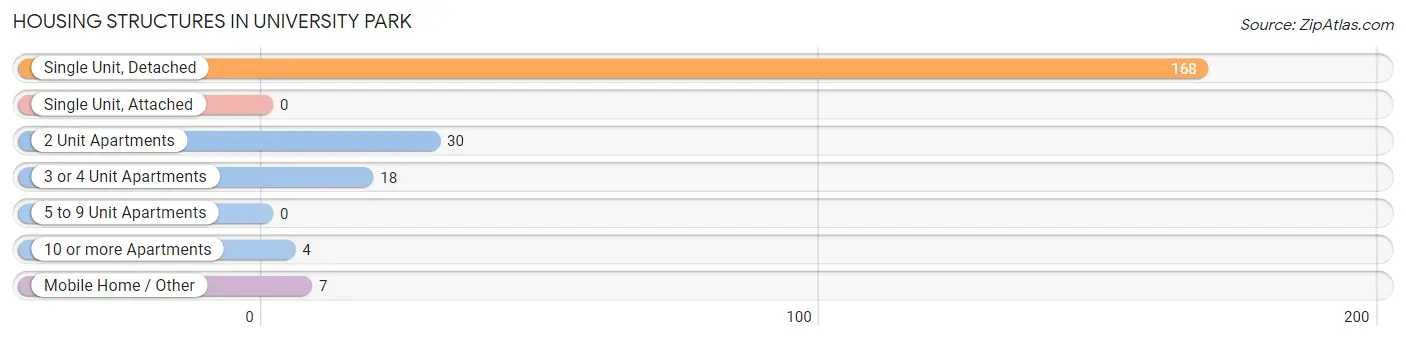
| Structure Type | # Housing Units | % Housing Units |
| Single Unit, Detached | 168 | 74.0% |
| Single Unit, Attached | 0 | 0.0% |
| 2 Unit Apartments | 30 | 13.2% |
| 3 or 4 Unit Apartments | 18 | 7.9% |
| 5 to 9 Unit Apartments | 0 | 0.0% |
| 10 or more Apartments | 4 | 1.8% |
| Mobile Home / Other | 7 | 3.1% |
| Total | 227 | 100.0% |
Housing Structures by Occupancy in University Park
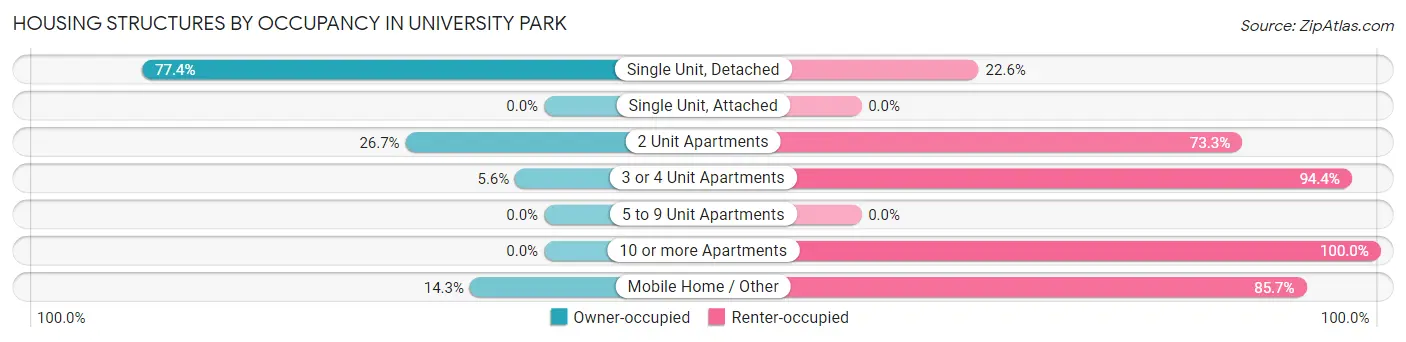
| Structure Type | Owner-occupied | Renter-occupied |
| Single Unit, Detached | 130 (77.4%) | 38 (22.6%) |
| Single Unit, Attached | 0 (0.0%) | 0 (0.0%) |
| 2 Unit Apartments | 8 (26.7%) | 22 (73.3%) |
| 3 or 4 Unit Apartments | 1 (5.6%) | 17 (94.4%) |
| 5 to 9 Unit Apartments | 0 (0.0%) | 0 (0.0%) |
| 10 or more Apartments | 0 (0.0%) | 4 (100.0%) |
| Mobile Home / Other | 1 (14.3%) | 6 (85.7%) |
| Total | 140 (61.7%) | 87 (38.3%) |
Housing Structures by Number of Rooms in University Park
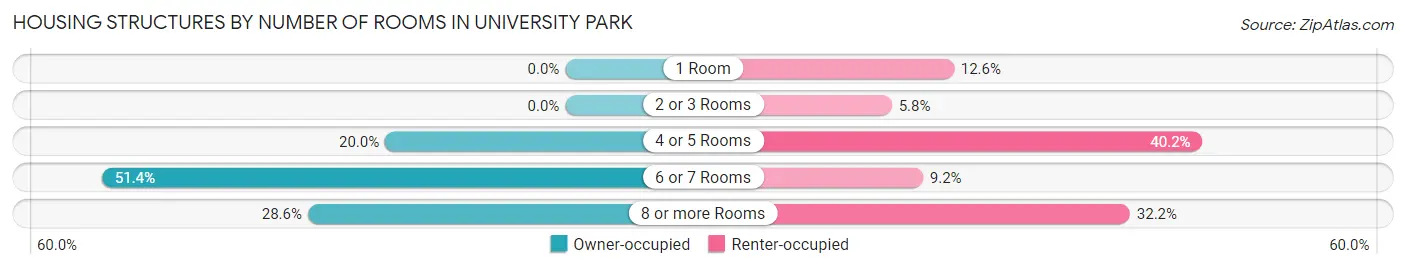
| Number of Rooms | Owner-occupied | Renter-occupied |
| 1 Room | 0 (0.0%) | 11 (12.6%) |
| 2 or 3 Rooms | 0 (0.0%) | 5 (5.8%) |
| 4 or 5 Rooms | 28 (20.0%) | 35 (40.2%) |
| 6 or 7 Rooms | 72 (51.4%) | 8 (9.2%) |
| 8 or more Rooms | 40 (28.6%) | 28 (32.2%) |
| Total | 140 (100.0%) | 87 (100.0%) |
Housing Structure by Heating Type in University Park
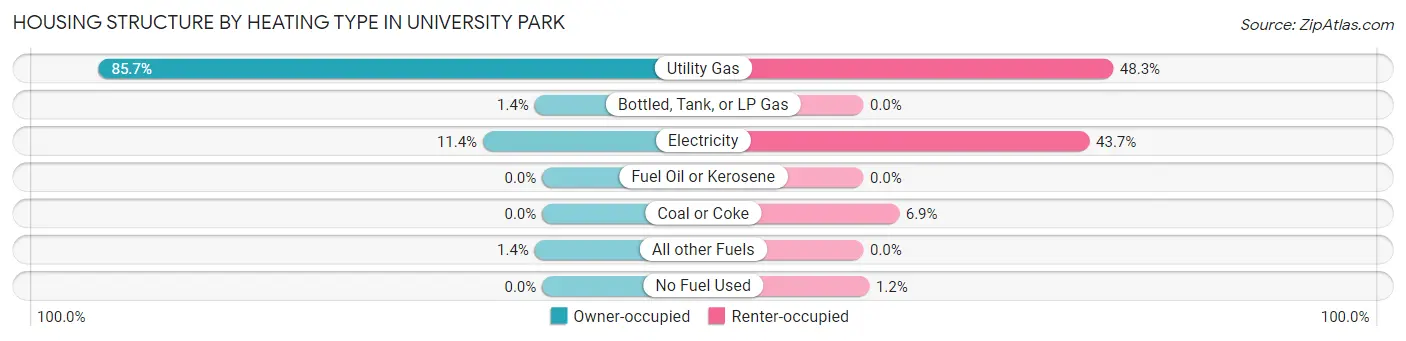
| Heating Type | Owner-occupied | Renter-occupied |
| Utility Gas | 120 (85.7%) | 42 (48.3%) |
| Bottled, Tank, or LP Gas | 2 (1.4%) | 0 (0.0%) |
| Electricity | 16 (11.4%) | 38 (43.7%) |
| Fuel Oil or Kerosene | 0 (0.0%) | 0 (0.0%) |
| Coal or Coke | 0 (0.0%) | 6 (6.9%) |
| All other Fuels | 2 (1.4%) | 0 (0.0%) |
| No Fuel Used | 0 (0.0%) | 1 (1.1%) |
| Total | 140 (100.0%) | 87 (100.0%) |
Household Vehicle Usage in University Park
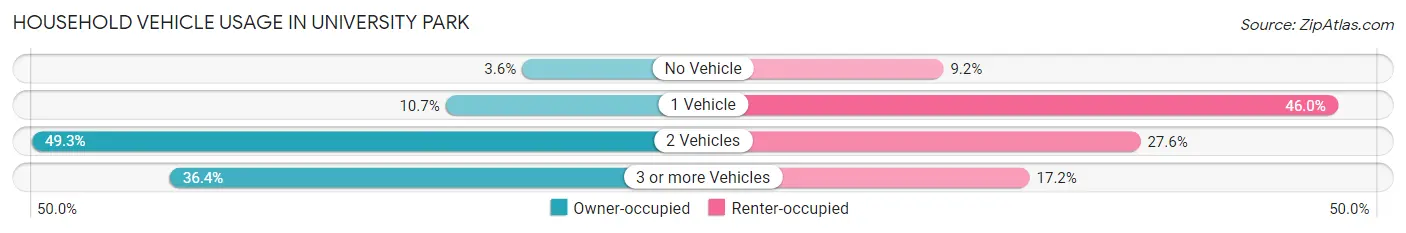
| Vehicles per Household | Owner-occupied | Renter-occupied |
| No Vehicle | 5 (3.6%) | 8 (9.2%) |
| 1 Vehicle | 15 (10.7%) | 40 (46.0%) |
| 2 Vehicles | 69 (49.3%) | 24 (27.6%) |
| 3 or more Vehicles | 51 (36.4%) | 15 (17.2%) |
| Total | 140 (100.0%) | 87 (100.0%) |
Real Estate & Mortgages in University Park
Real Estate and Mortgage Overview in University Park
| Characteristic | Without Mortgage | With Mortgage |
| Housing Units | 47 | 93 |
| Median Property Value | $88,800 | $90,400 |
| Median Household Income | $54,375 | $5 |
| Monthly Housing Costs | $417 | $0 |
| Real Estate Taxes | $1,100 | $0 |
Property Value by Mortgage Status in University Park
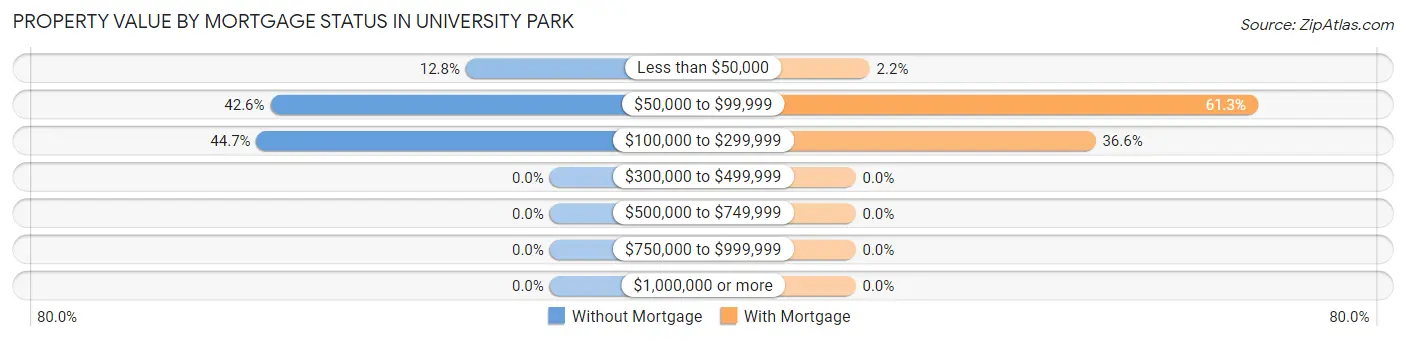
| Property Value | Without Mortgage | With Mortgage |
| Less than $50,000 | 6 (12.8%) | 2 (2.1%) |
| $50,000 to $99,999 | 20 (42.5%) | 57 (61.3%) |
| $100,000 to $299,999 | 21 (44.7%) | 34 (36.6%) |
| $300,000 to $499,999 | 0 (0.0%) | 0 (0.0%) |
| $500,000 to $749,999 | 0 (0.0%) | 0 (0.0%) |
| $750,000 to $999,999 | 0 (0.0%) | 0 (0.0%) |
| $1,000,000 or more | 0 (0.0%) | 0 (0.0%) |
| Total | 47 (100.0%) | 93 (100.0%) |
Household Income by Mortgage Status in University Park
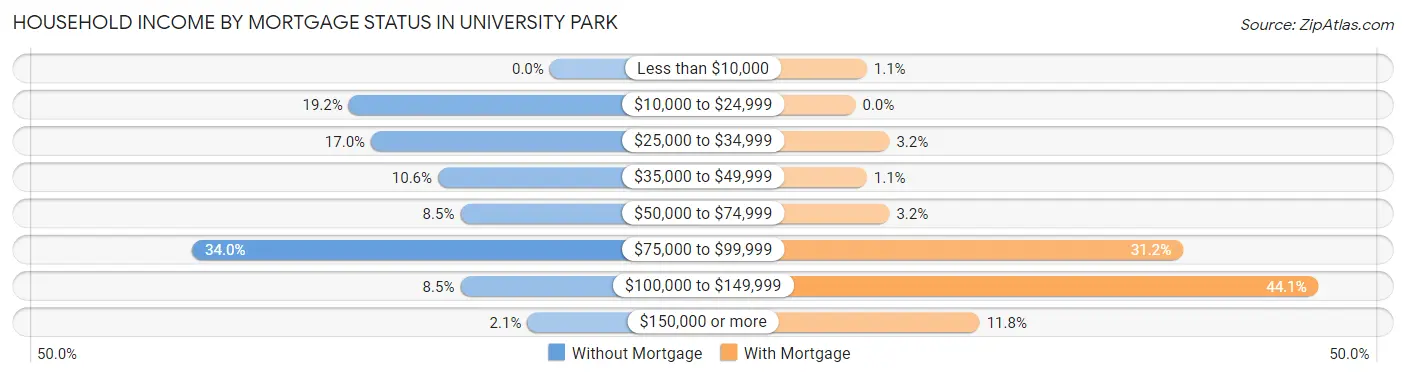
| Household Income | Without Mortgage | With Mortgage |
| Less than $10,000 | 0 (0.0%) | 1 (1.1%) |
| $10,000 to $24,999 | 9 (19.2%) | 0 (0.0%) |
| $25,000 to $34,999 | 8 (17.0%) | 3 (3.2%) |
| $35,000 to $49,999 | 5 (10.6%) | 1 (1.1%) |
| $50,000 to $74,999 | 4 (8.5%) | 3 (3.2%) |
| $75,000 to $99,999 | 16 (34.0%) | 29 (31.2%) |
| $100,000 to $149,999 | 4 (8.5%) | 41 (44.1%) |
| $150,000 or more | 1 (2.1%) | 11 (11.8%) |
| Total | 47 (100.0%) | 93 (100.0%) |
Property Value to Household Income Ratio in University Park
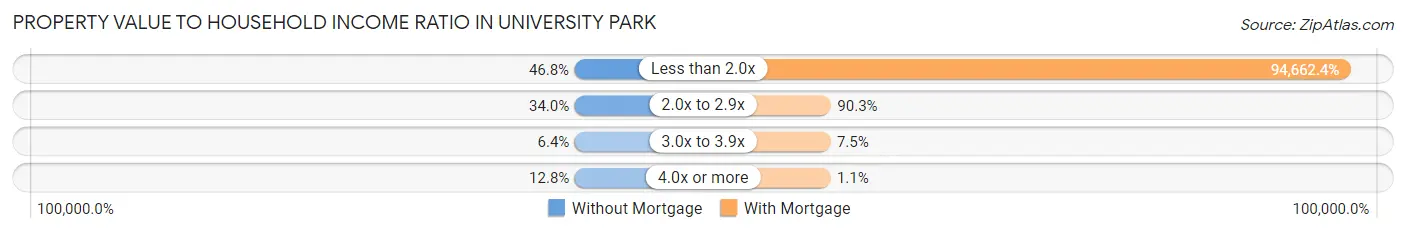
| Value-to-Income Ratio | Without Mortgage | With Mortgage |
| Less than 2.0x | 22 (46.8%) | 88,036 (94,662.4%) |
| 2.0x to 2.9x | 16 (34.0%) | 84 (90.3%) |
| 3.0x to 3.9x | 3 (6.4%) | 7 (7.5%) |
| 4.0x or more | 6 (12.8%) | 1 (1.1%) |
| Total | 47 (100.0%) | 93 (100.0%) |
Real Estate Taxes by Mortgage Status in University Park
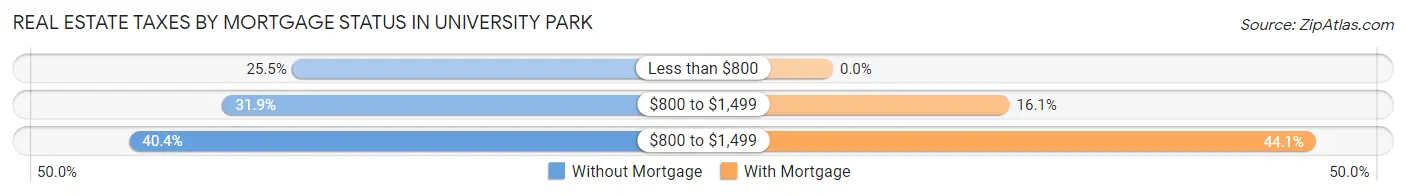
| Property Taxes | Without Mortgage | With Mortgage |
| Less than $800 | 12 (25.5%) | 0 (0.0%) |
| $800 to $1,499 | 15 (31.9%) | 15 (16.1%) |
| $800 to $1,499 | 19 (40.4%) | 41 (44.1%) |
| Total | 47 (100.0%) | 93 (100.0%) |
Health & Disability in University Park
Health Insurance Coverage by Age in University Park
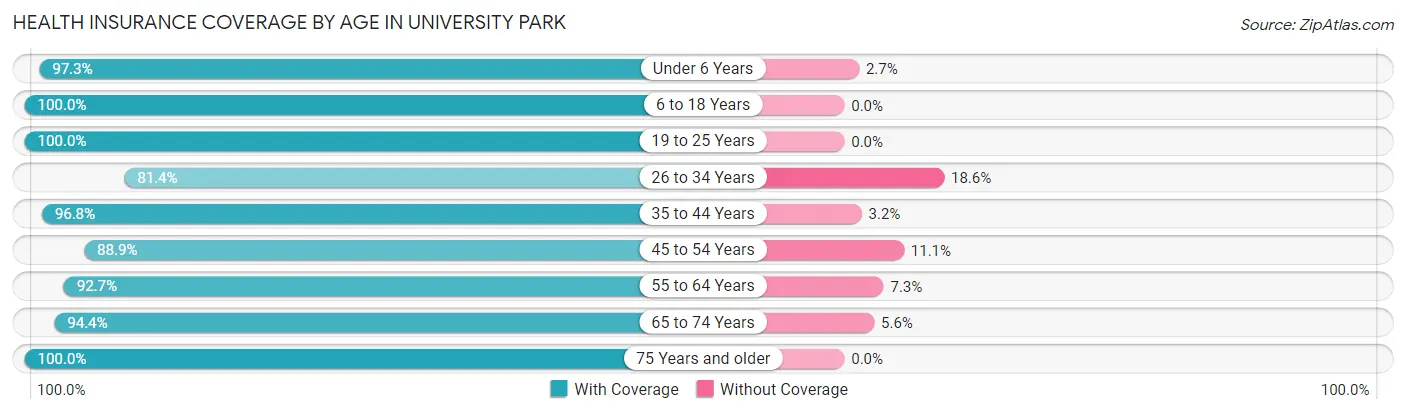
| Age Bracket | With Coverage | Without Coverage |
| Under 6 Years | 71 (97.3%) | 2 (2.7%) |
| 6 to 18 Years | 119 (100.0%) | 0 (0.0%) |
| 19 to 25 Years | 47 (100.0%) | 0 (0.0%) |
| 26 to 34 Years | 35 (81.4%) | 8 (18.6%) |
| 35 to 44 Years | 90 (96.8%) | 3 (3.2%) |
| 45 to 54 Years | 64 (88.9%) | 8 (11.1%) |
| 55 to 64 Years | 76 (92.7%) | 6 (7.3%) |
| 65 to 74 Years | 17 (94.4%) | 1 (5.6%) |
| 75 Years and older | 19 (100.0%) | 0 (0.0%) |
| Total | 538 (95.1%) | 28 (5.0%) |
Health Insurance Coverage by Citizenship Status in University Park
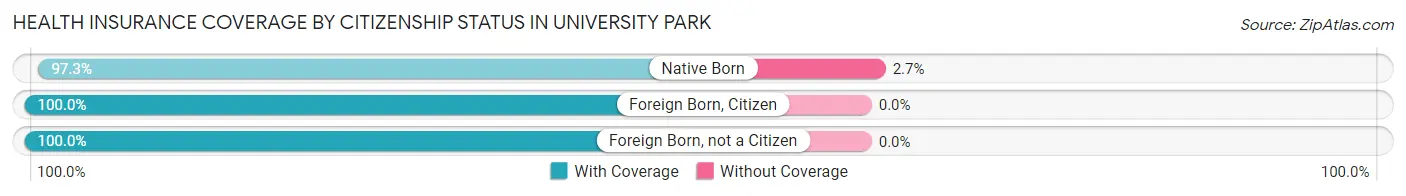
| Citizenship Status | With Coverage | Without Coverage |
| Native Born | 71 (97.3%) | 2 (2.7%) |
| Foreign Born, Citizen | 119 (100.0%) | 0 (0.0%) |
| Foreign Born, not a Citizen | 47 (100.0%) | 0 (0.0%) |
Health Insurance Coverage by Household Income in University Park
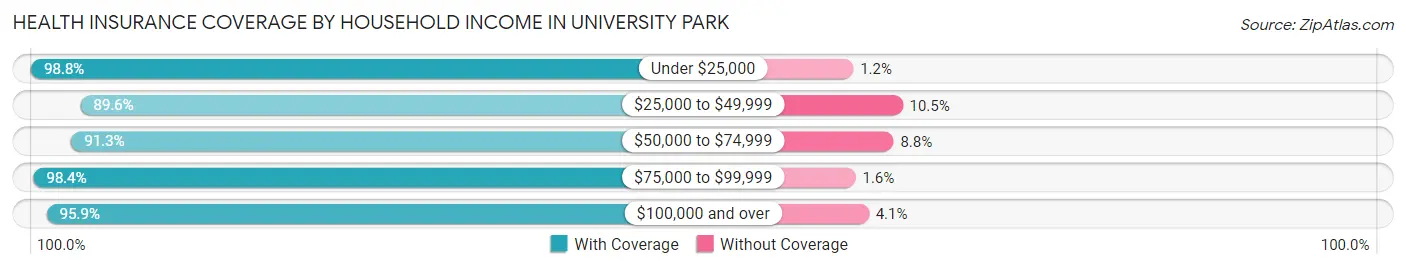
| Household Income | With Coverage | Without Coverage |
| Under $25,000 | 82 (98.8%) | 1 (1.2%) |
| $25,000 to $49,999 | 60 (89.5%) | 7 (10.4%) |
| $50,000 to $74,999 | 146 (91.2%) | 14 (8.7%) |
| $75,000 to $99,999 | 180 (98.4%) | 3 (1.6%) |
| $100,000 and over | 70 (95.9%) | 3 (4.1%) |
Public vs Private Health Insurance Coverage by Age in University Park
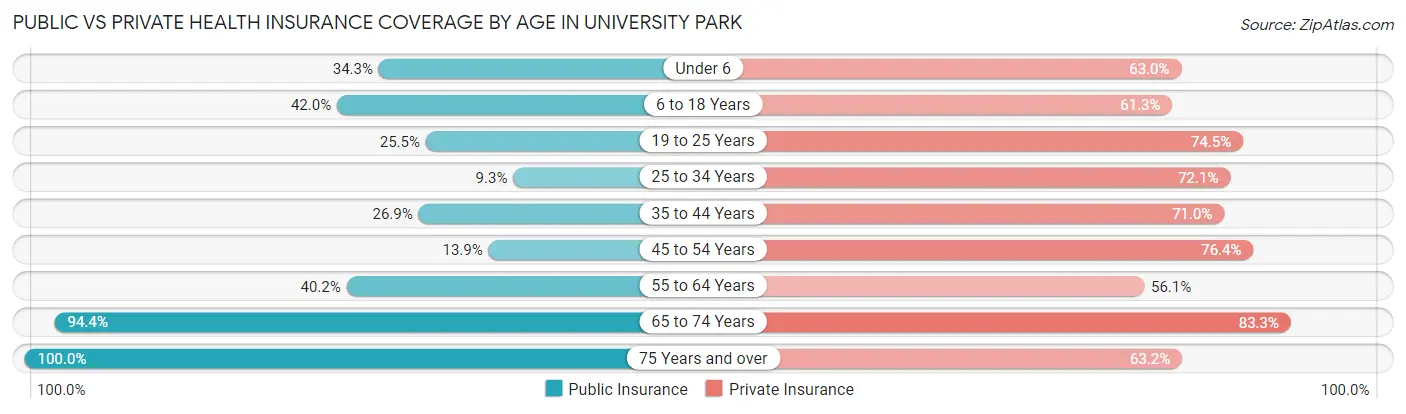
| Age Bracket | Public Insurance | Private Insurance |
| Under 6 | 25 (34.3%) | 46 (63.0%) |
| 6 to 18 Years | 50 (42.0%) | 73 (61.3%) |
| 19 to 25 Years | 12 (25.5%) | 35 (74.5%) |
| 25 to 34 Years | 4 (9.3%) | 31 (72.1%) |
| 35 to 44 Years | 25 (26.9%) | 66 (71.0%) |
| 45 to 54 Years | 10 (13.9%) | 55 (76.4%) |
| 55 to 64 Years | 33 (40.2%) | 46 (56.1%) |
| 65 to 74 Years | 17 (94.4%) | 15 (83.3%) |
| 75 Years and over | 19 (100.0%) | 12 (63.2%) |
| Total | 195 (34.4%) | 379 (67.0%) |
Disability Status by Sex by Age in University Park
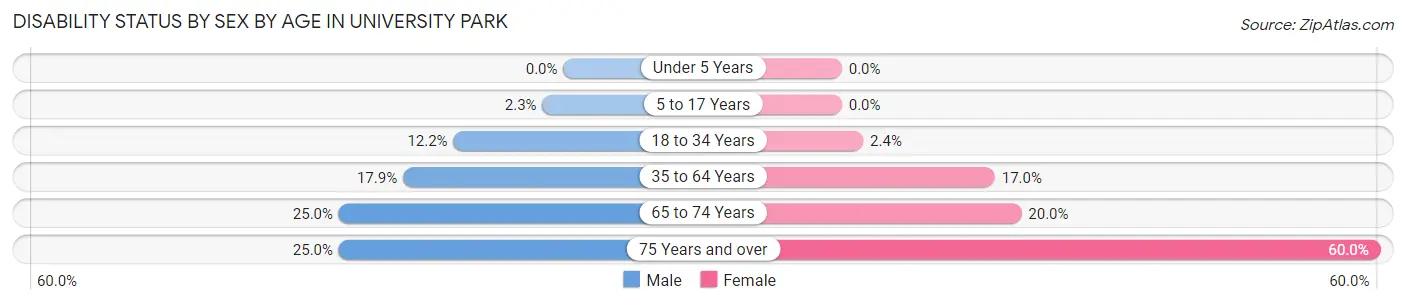
| Age Bracket | Male | Female |
| Under 5 Years | 0 (0.0%) | 0 (0.0%) |
| 5 to 17 Years | 2 (2.3%) | 0 (0.0%) |
| 18 to 34 Years | 6 (12.2%) | 1 (2.4%) |
| 35 to 64 Years | 20 (17.9%) | 23 (17.0%) |
| 65 to 74 Years | 2 (25.0%) | 2 (20.0%) |
| 75 Years and over | 1 (25.0%) | 9 (60.0%) |
Disability Class by Sex by Age in University Park
Disability Class: Hearing Difficulty
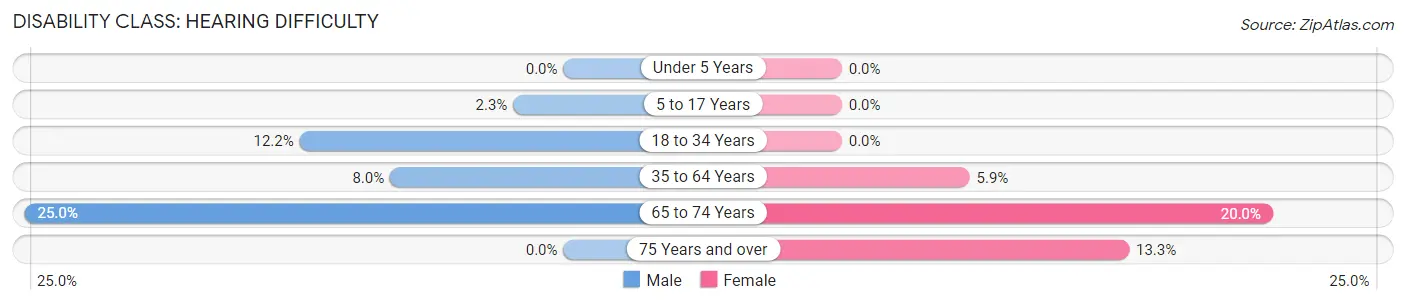
| Age Bracket | Male | Female |
| Under 5 Years | 0 (0.0%) | 0 (0.0%) |
| 5 to 17 Years | 2 (2.3%) | 0 (0.0%) |
| 18 to 34 Years | 6 (12.2%) | 0 (0.0%) |
| 35 to 64 Years | 9 (8.0%) | 8 (5.9%) |
| 65 to 74 Years | 2 (25.0%) | 2 (20.0%) |
| 75 Years and over | 0 (0.0%) | 2 (13.3%) |
Disability Class: Vision Difficulty
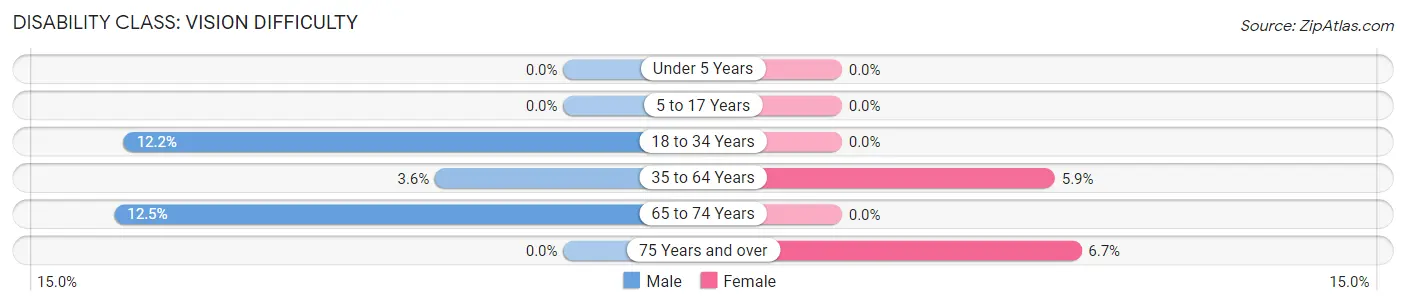
| Age Bracket | Male | Female |
| Under 5 Years | 0 (0.0%) | 0 (0.0%) |
| 5 to 17 Years | 0 (0.0%) | 0 (0.0%) |
| 18 to 34 Years | 6 (12.2%) | 0 (0.0%) |
| 35 to 64 Years | 4 (3.6%) | 8 (5.9%) |
| 65 to 74 Years | 1 (12.5%) | 0 (0.0%) |
| 75 Years and over | 0 (0.0%) | 1 (6.7%) |
Disability Class: Cognitive Difficulty
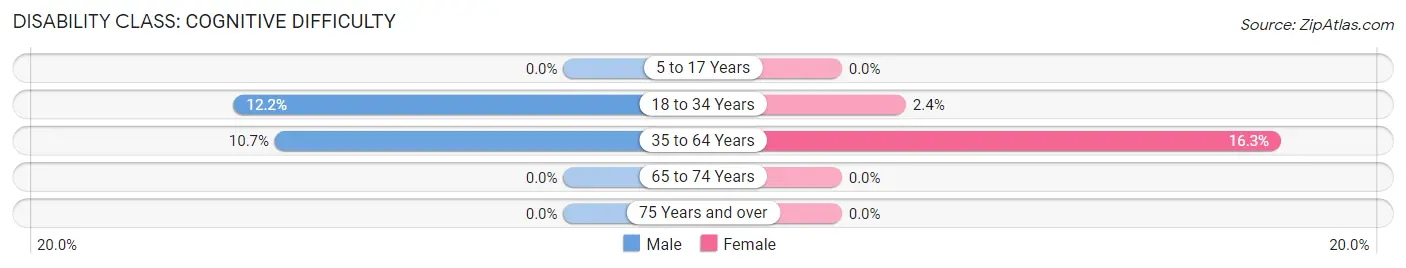
| Age Bracket | Male | Female |
| 5 to 17 Years | 0 (0.0%) | 0 (0.0%) |
| 18 to 34 Years | 6 (12.2%) | 1 (2.4%) |
| 35 to 64 Years | 12 (10.7%) | 22 (16.3%) |
| 65 to 74 Years | 0 (0.0%) | 0 (0.0%) |
| 75 Years and over | 0 (0.0%) | 0 (0.0%) |
Disability Class: Ambulatory Difficulty
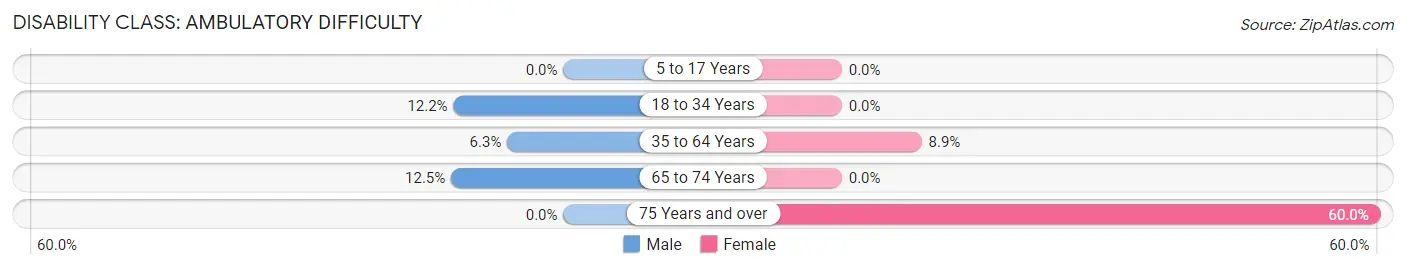
| Age Bracket | Male | Female |
| 5 to 17 Years | 0 (0.0%) | 0 (0.0%) |
| 18 to 34 Years | 6 (12.2%) | 0 (0.0%) |
| 35 to 64 Years | 7 (6.2%) | 12 (8.9%) |
| 65 to 74 Years | 1 (12.5%) | 0 (0.0%) |
| 75 Years and over | 0 (0.0%) | 9 (60.0%) |
Disability Class: Self-Care Difficulty
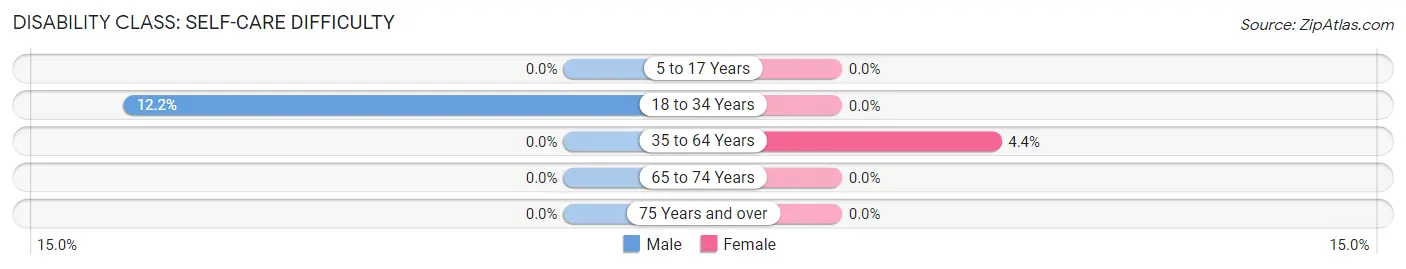
| Age Bracket | Male | Female |
| 5 to 17 Years | 0 (0.0%) | 0 (0.0%) |
| 18 to 34 Years | 6 (12.2%) | 0 (0.0%) |
| 35 to 64 Years | 0 (0.0%) | 6 (4.4%) |
| 65 to 74 Years | 0 (0.0%) | 0 (0.0%) |
| 75 Years and over | 0 (0.0%) | 0 (0.0%) |
Technology Access in University Park
Computing Device Access in University Park
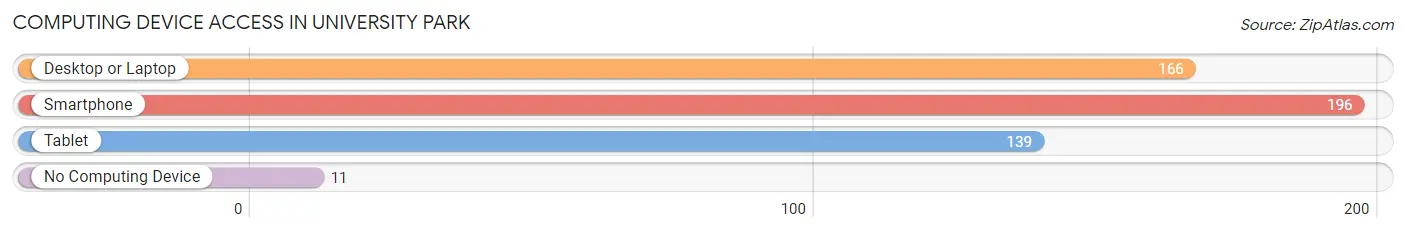
| Device Type | # Households | % Households |
| Desktop or Laptop | 166 | 73.1% |
| Smartphone | 196 | 86.3% |
| Tablet | 139 | 61.2% |
| No Computing Device | 11 | 4.9% |
| Total | 227 | 100.0% |
Internet Access in University Park
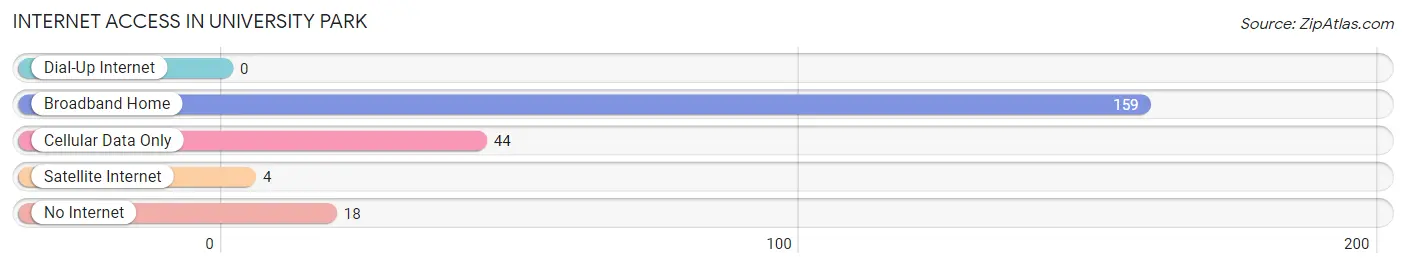
| Internet Type | # Households | % Households |
| Dial-Up Internet | 0 | 0.0% |
| Broadband Home | 159 | 70.0% |
| Cellular Data Only | 44 | 19.4% |
| Satellite Internet | 4 | 1.8% |
| No Internet | 18 | 7.9% |
| Total | 227 | 100.0% |
University Park Summary
University Park, Iowa is a small city located in the southeastern corner of the state, just north of the Missouri border. It is part of the Des Moines-West Des Moines Metropolitan Statistical Area and is home to approximately 1,500 people. The city is known for its small-town charm and its close proximity to the larger cities of Des Moines and West Des Moines.
History
University Park was founded in 1854 by a group of settlers from Ohio. The city was originally known as “University Place” and was named after the nearby University of Iowa. The city was incorporated in 1875 and was renamed University Park in 1876.
The city was originally a farming community, but in the early 1900s, the city began to grow and develop. The city was home to a number of businesses, including a flour mill, a brickyard, a creamery, and a canning factory. The city also had a number of churches, schools, and a library.
In the 1950s, the city began to experience a population decline as people moved to larger cities. However, in the late 1970s, the city began to experience a resurgence as people began to move back to the area. The city has since become a popular destination for those looking for a small-town atmosphere with easy access to the larger cities of Des Moines and West Des Moines.
Geography
University Park is located in the southeastern corner of Iowa, just north of the Missouri border. The city is situated on the banks of the Des Moines River and is surrounded by rolling hills and farmland. The city is located approximately 20 miles from Des Moines and 30 miles from West Des Moines.
The city has a total area of 1.2 square miles, all of which is land. The city has a humid continental climate, with hot, humid summers and cold, snowy winters.
Economy
University Park has a diverse economy, with a number of businesses and industries located in the city. The city is home to a number of manufacturing companies, including a plastics manufacturer, a metal fabrication company, and a printing company. The city is also home to a number of retail stores, restaurants, and other businesses.
The city is also home to a number of educational institutions, including the University of Iowa, Des Moines Area Community College, and Drake University. The city is also home to a number of healthcare facilities, including a hospital and a number of medical clinics.
Demographics
As of the 2010 census, University Park had a population of 1,500 people. The city has a median age of 37.7 years and a median household income of $45,000. The city is predominantly white, with a small percentage of African Americans, Hispanics, and Asians. The city also has a small percentage of Native Americans and Pacific Islanders.
The city is home to a number of religious institutions, including a number of churches, a synagogue, and a mosque. The city is also home to a number of cultural institutions, including a museum, a theater, and a library.
Conclusion
University Park, Iowa is a small city located in the southeastern corner of the state, just north of the Missouri border. The city is known for its small-town charm and its close proximity to the larger cities of Des Moines and West Des Moines. The city has a diverse economy, with a number of businesses and industries located in the city. The city is also home to a number of educational institutions, healthcare facilities, and cultural institutions. As of the 2010 census, University Park had a population of 1,500 people.
Common Questions
What is Per Capita Income in University Park?
Per Capita income in University Park is $24,268.
What is the Median Family Income in University Park?
Median Family Income in University Park is $69,750.
What is the Median Household income in University Park?
Median Household Income in University Park is $63,162.
What is Income or Wage Gap in University Park?
Income or Wage Gap in University Park is 30.0%.
Women in University Park earn 70.0 cents for every dollar earned by a man.
What is Inequality or Gini Index in University Park?
Inequality or Gini Index in University Park is 0.34.
What is the Total Population of University Park?
Total Population of University Park is 566.
What is the Total Male Population of University Park?
Total Male Population of University Park is 302.
What is the Total Female Population of University Park?
Total Female Population of University Park is 264.
What is the Ratio of Males per 100 Females in University Park?
There are 114.39 Males per 100 Females in University Park.
What is the Ratio of Females per 100 Males in University Park?
There are 87.42 Females per 100 Males in University Park.
What is the Median Population Age in University Park?
Median Population Age in University Park is 35.1 Years.
What is the Average Family Size in University Park
Average Family Size in University Park is 3.2 People.
What is the Average Household Size in University Park
Average Household Size in University Park is 2.5 People.
How Large is the Labor Force in University Park?
There are 290 People in the Labor Forcein in University Park.
What is the Percentage of People in the Labor Force in University Park?
73.8% of People are in the Labor Force in University Park.
What is the Unemployment Rate in University Park?
Unemployment Rate in University Park is 3.4%.