Newell, IA Map & Demographics
Newell Map
Newell Overview
$26,203
PER CAPITA INCOME
$83,472
AVG FAMILY INCOME
$64,167
AVG HOUSEHOLD INCOME
31.8%
WAGE / INCOME GAP [ % ]
68.2¢/ $1
WAGE / INCOME GAP [ $ ]
0.33
INEQUALITY / GINI INDEX
892
TOTAL POPULATION
496
MALE POPULATION
396
FEMALE POPULATION
125.25
MALES / 100 FEMALES
79.84
FEMALES / 100 MALES
35.0
MEDIAN AGE
3.7
AVG FAMILY SIZE
2.8
AVG HOUSEHOLD SIZE
433
LABOR FORCE [ PEOPLE ]
70.2%
PERCENT IN LABOR FORCE
5.1%
UNEMPLOYMENT RATE
Newell Zip Codes
Newell Area Codes
Income in Newell
Income Overview in Newell
Per Capita Income in Newell is $26,203, while median incomes of families and households are $83,472 and $64,167 respectively.
| Characteristic | Number | Measure |
| Per Capita Income | 892 | $26,203 |
| Median Family Income | 193 | $83,472 |
| Mean Family Income | 193 | $85,532 |
| Median Household Income | 310 | $64,167 |
| Mean Household Income | 310 | $72,075 |
| Income Deficit | 193 | $0 |
| Wage / Income Gap (%) | 892 | 31.85% |
| Wage / Income Gap ($) | 892 | 68.15¢ per $1 |
| Gini / Inequality Index | 892 | 0.33 |
Earnings by Sex in Newell
Average Earnings in Newell are $35,568, $42,019 for men and $28,636 for women, a difference of 31.9%.
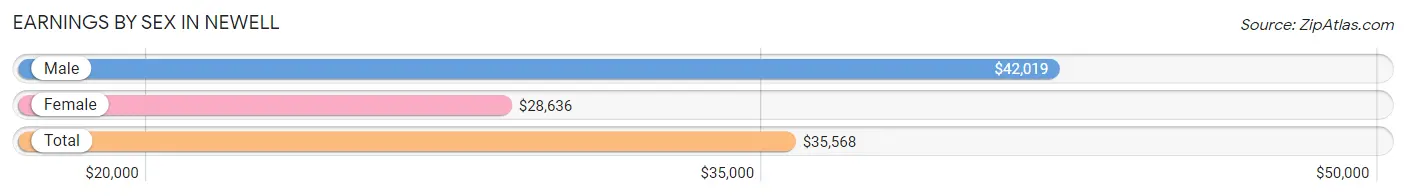
| Sex | Number | Average Earnings |
| Male | 257 (56.5%) | $42,019 |
| Female | 198 (43.5%) | $28,636 |
| Total | 455 (100.0%) | $35,568 |
Earnings by Sex by Income Bracket in Newell
The most common earnings brackets in Newell are $55,000 to $64,999 for men (30 | 11.7%) and $25,000 to $29,999 for women (19 | 9.6%).
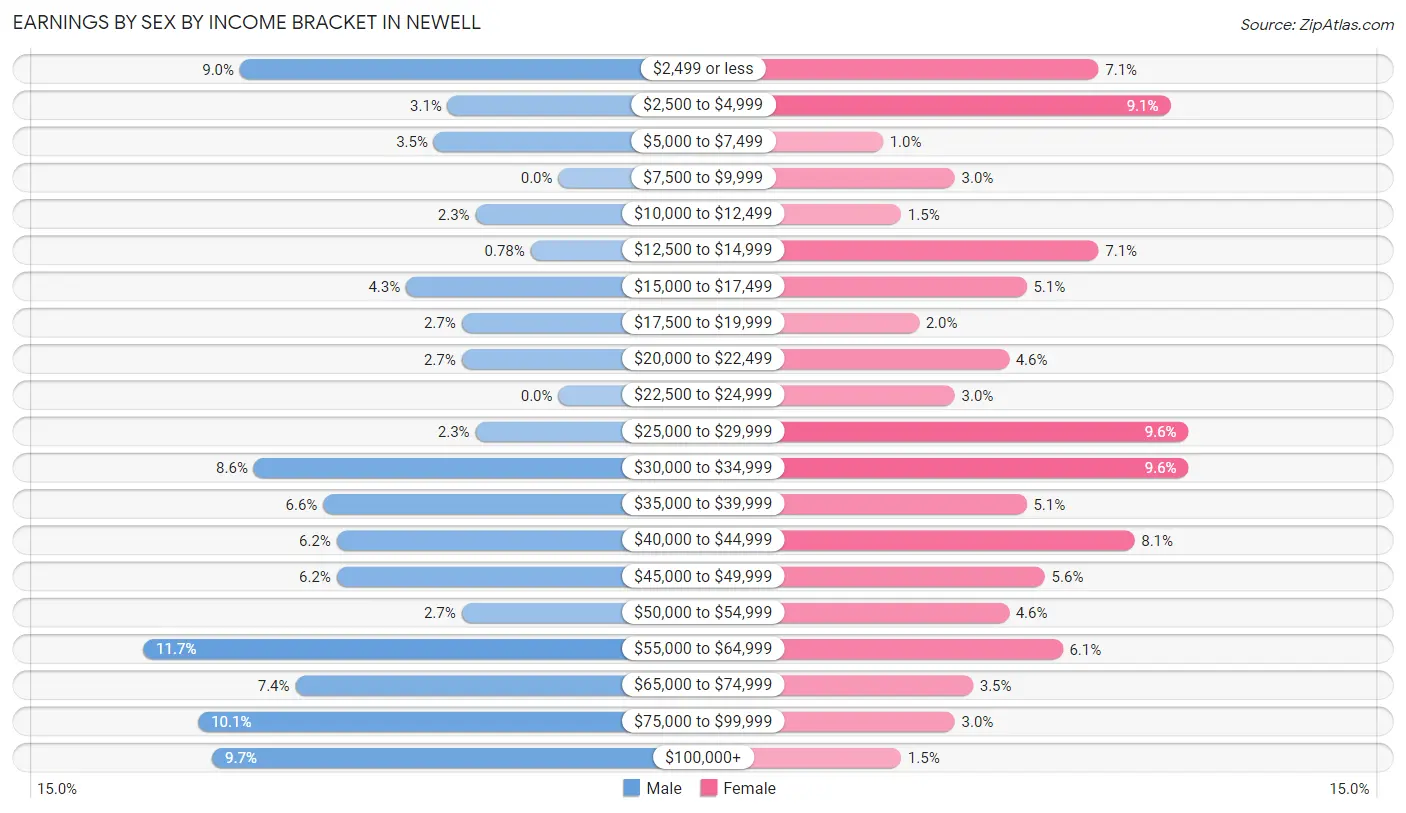
| Income | Male | Female |
| $2,499 or less | 23 (8.9%) | 14 (7.1%) |
| $2,500 to $4,999 | 8 (3.1%) | 18 (9.1%) |
| $5,000 to $7,499 | 9 (3.5%) | 2 (1.0%) |
| $7,500 to $9,999 | 0 (0.0%) | 6 (3.0%) |
| $10,000 to $12,499 | 6 (2.3%) | 3 (1.5%) |
| $12,500 to $14,999 | 2 (0.8%) | 14 (7.1%) |
| $15,000 to $17,499 | 11 (4.3%) | 10 (5.1%) |
| $17,500 to $19,999 | 7 (2.7%) | 4 (2.0%) |
| $20,000 to $22,499 | 7 (2.7%) | 9 (4.5%) |
| $22,500 to $24,999 | 0 (0.0%) | 6 (3.0%) |
| $25,000 to $29,999 | 6 (2.3%) | 19 (9.6%) |
| $30,000 to $34,999 | 22 (8.6%) | 19 (9.6%) |
| $35,000 to $39,999 | 17 (6.6%) | 10 (5.1%) |
| $40,000 to $44,999 | 16 (6.2%) | 16 (8.1%) |
| $45,000 to $49,999 | 16 (6.2%) | 11 (5.6%) |
| $50,000 to $54,999 | 7 (2.7%) | 9 (4.5%) |
| $55,000 to $64,999 | 30 (11.7%) | 12 (6.1%) |
| $65,000 to $74,999 | 19 (7.4%) | 7 (3.5%) |
| $75,000 to $99,999 | 26 (10.1%) | 6 (3.0%) |
| $100,000+ | 25 (9.7%) | 3 (1.5%) |
| Total | 257 (100.0%) | 198 (100.0%) |
Earnings by Sex by Educational Attainment in Newell
Average earnings in Newell are $46,042 for men and $30,625 for women, a difference of 33.5%. Men with an educational attainment of college or associate's degree enjoy the highest average annual earnings of $55,000, while those with bachelor's degree education earn the least with $39,167. Women with an educational attainment of bachelor's degree earn the most with the average annual earnings of $46,750, while those with college or associate's degree education have the smallest earnings of $30,250.
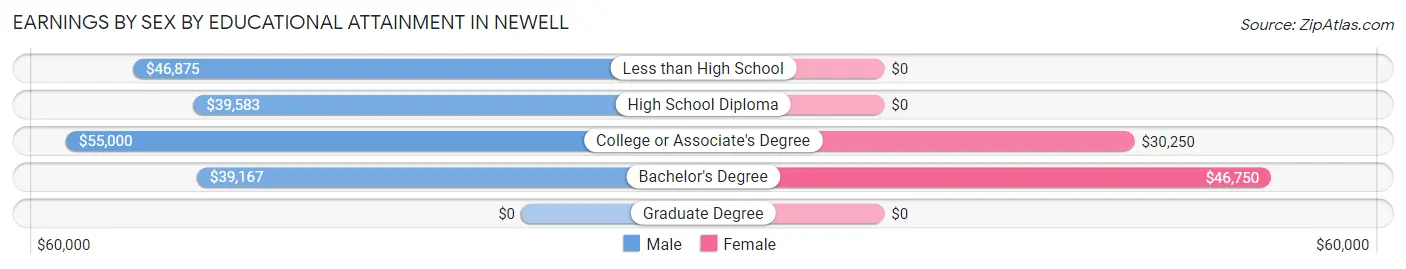
| Educational Attainment | Male Income | Female Income |
| Less than High School | $46,875 | $0 |
| High School Diploma | $39,583 | $0 |
| College or Associate's Degree | $55,000 | $30,250 |
| Bachelor's Degree | $39,167 | $46,750 |
| Graduate Degree | - | - |
| Total | $46,042 | $30,625 |
Family Income in Newell
Family Income Brackets in Newell
According to the Newell family income data, there are 61 families falling into the $100,000 to $149,999 income range, which is the most common income bracket and makes up 31.6% of all families.
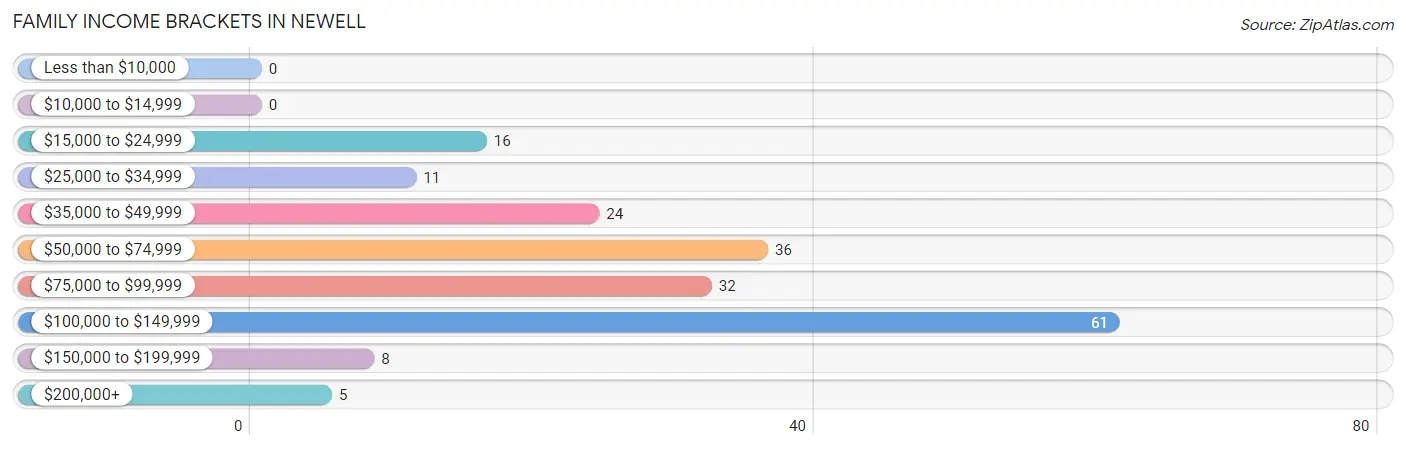
| Income Bracket | # Families | % Families |
| Less than $10,000 | 0 | 0.0% |
| $10,000 to $14,999 | 0 | 0.0% |
| $15,000 to $24,999 | 16 | 8.3% |
| $25,000 to $34,999 | 11 | 5.7% |
| $35,000 to $49,999 | 24 | 12.4% |
| $50,000 to $74,999 | 36 | 18.7% |
| $75,000 to $99,999 | 32 | 16.6% |
| $100,000 to $149,999 | 61 | 31.6% |
| $150,000 to $199,999 | 8 | 4.1% |
| $200,000+ | 5 | 2.6% |
Family Income by Famaliy Size in Newell
7+ person families (17 | 8.8%) account for the highest median family income in Newell with $122,875 per family, while 2-person families (94 | 48.7%) have the highest median income of $36,528 per family member.
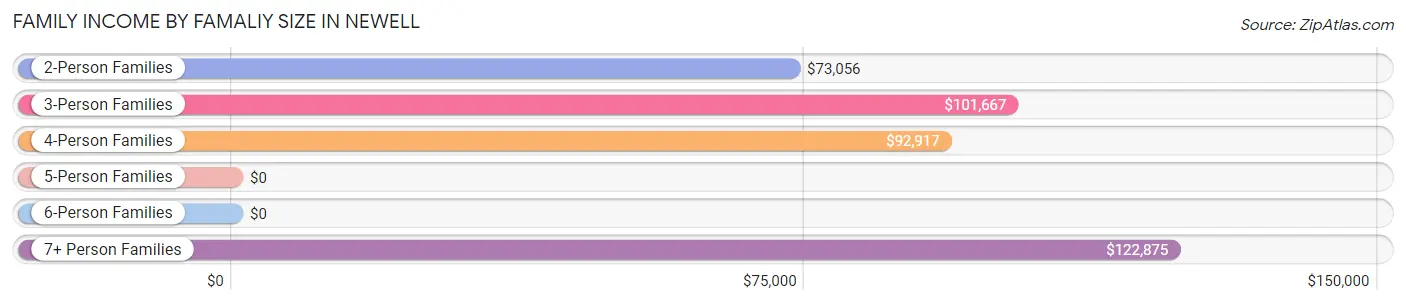
| Income Bracket | # Families | Median Income |
| 2-Person Families | 94 (48.7%) | $73,056 |
| 3-Person Families | 22 (11.4%) | $101,667 |
| 4-Person Families | 26 (13.5%) | $92,917 |
| 5-Person Families | 27 (14.0%) | $0 |
| 6-Person Families | 7 (3.6%) | $0 |
| 7+ Person Families | 17 (8.8%) | $122,875 |
| Total | 193 (100.0%) | $83,472 |
Family Income by Number of Earners in Newell
The median family income in Newell is $83,472, with families comprising 3+ earners (36) having the highest median family income of $108,571, while families with no earners (19) have the lowest median family income of $36,563, accounting for 18.6% and 9.8% of families, respectively.
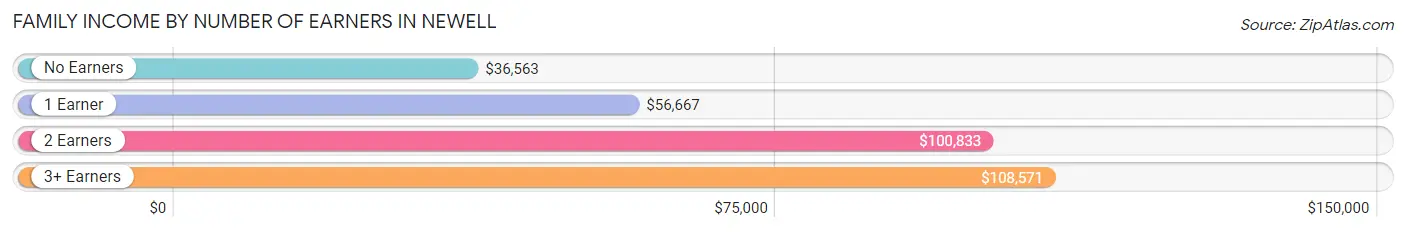
| Number of Earners | # Families | Median Income |
| No Earners | 19 (9.8%) | $36,563 |
| 1 Earner | 52 (26.9%) | $56,667 |
| 2 Earners | 86 (44.6%) | $100,833 |
| 3+ Earners | 36 (18.6%) | $108,571 |
| Total | 193 (100.0%) | $83,472 |
Household Income in Newell
Household Income Brackets in Newell
With 70 households falling in the category, the $100,000 to $149,999 income range is the most frequent in Newell, accounting for 22.6% of all households. In contrast, only 2 households (0.6%) fall into the less than $10,000 income bracket, making it the least populous group.
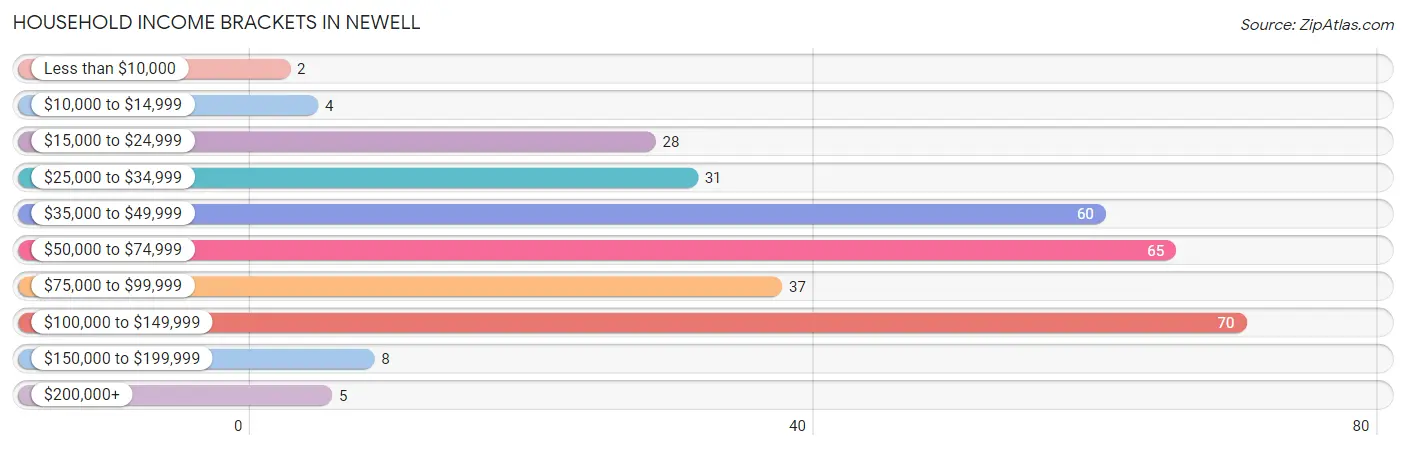
| Income Bracket | # Households | % Households |
| Less than $10,000 | 2 | 0.6% |
| $10,000 to $14,999 | 4 | 1.3% |
| $15,000 to $24,999 | 28 | 9.0% |
| $25,000 to $34,999 | 31 | 10.0% |
| $35,000 to $49,999 | 60 | 19.4% |
| $50,000 to $74,999 | 65 | 21.0% |
| $75,000 to $99,999 | 37 | 11.9% |
| $100,000 to $149,999 | 70 | 22.6% |
| $150,000 to $199,999 | 8 | 2.6% |
| $200,000+ | 5 | 1.6% |
Household Income by Householder Age in Newell
The median household income in Newell is $64,167, with the highest median household income of $95,313 found in the 25 to 44 years age bracket for the primary householder. A total of 93 households (30.0%) fall into this category. Meanwhile, the 15 to 24 years age bracket for the primary householder has the lowest median household income of $32,083, with 11 households (3.5%) in this group.
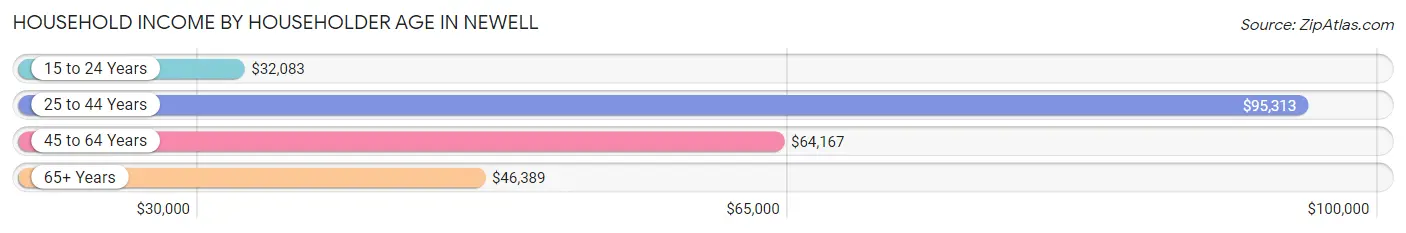
| Income Bracket | # Households | Median Income |
| 15 to 24 Years | 11 (3.5%) | $32,083 |
| 25 to 44 Years | 93 (30.0%) | $95,313 |
| 45 to 64 Years | 132 (42.6%) | $64,167 |
| 65+ Years | 74 (23.9%) | $46,389 |
| Total | 310 (100.0%) | $64,167 |
Poverty in Newell
Income Below Poverty by Sex and Age in Newell
With 6.6% poverty level for males and 10.6% for females among the residents of Newell, under 5 year old males and under 5 year old females are the most vulnerable to poverty, with 8 males (29.6%) and 14 females (30.4%) in their respective age groups living below the poverty level.
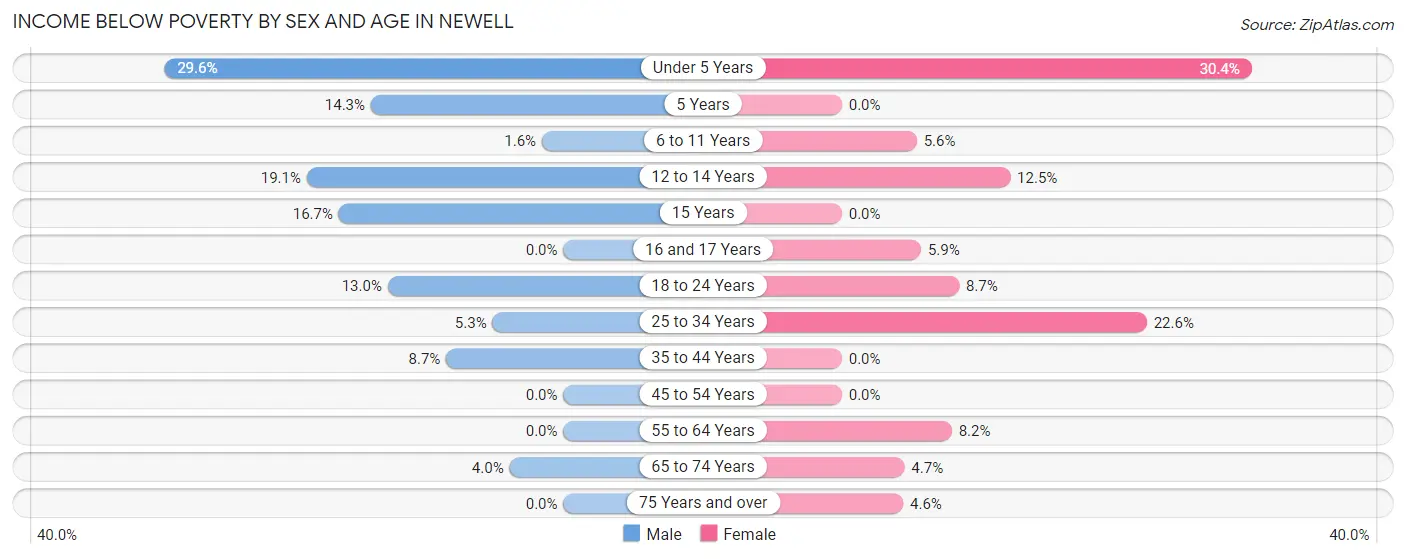
| Age Bracket | Male | Female |
| Under 5 Years | 8 (29.6%) | 14 (30.4%) |
| 5 Years | 6 (14.3%) | 0 (0.0%) |
| 6 to 11 Years | 1 (1.6%) | 2 (5.6%) |
| 12 to 14 Years | 4 (19.1%) | 2 (12.5%) |
| 15 Years | 3 (16.7%) | 0 (0.0%) |
| 16 and 17 Years | 0 (0.0%) | 1 (5.9%) |
| 18 to 24 Years | 3 (13.0%) | 2 (8.7%) |
| 25 to 34 Years | 2 (5.3%) | 12 (22.6%) |
| 35 to 44 Years | 4 (8.7%) | 0 (0.0%) |
| 45 to 54 Years | 0 (0.0%) | 0 (0.0%) |
| 55 to 64 Years | 0 (0.0%) | 4 (8.2%) |
| 65 to 74 Years | 1 (4.0%) | 2 (4.6%) |
| 75 Years and over | 0 (0.0%) | 1 (4.5%) |
| Total | 32 (6.6%) | 40 (10.6%) |
Income Above Poverty by Sex and Age in Newell
According to the poverty statistics in Newell, males aged 16 and 17 years and females aged 5 years are the age groups that are most secure financially, with 100.0% of males and 100.0% of females in these age groups living above the poverty line.
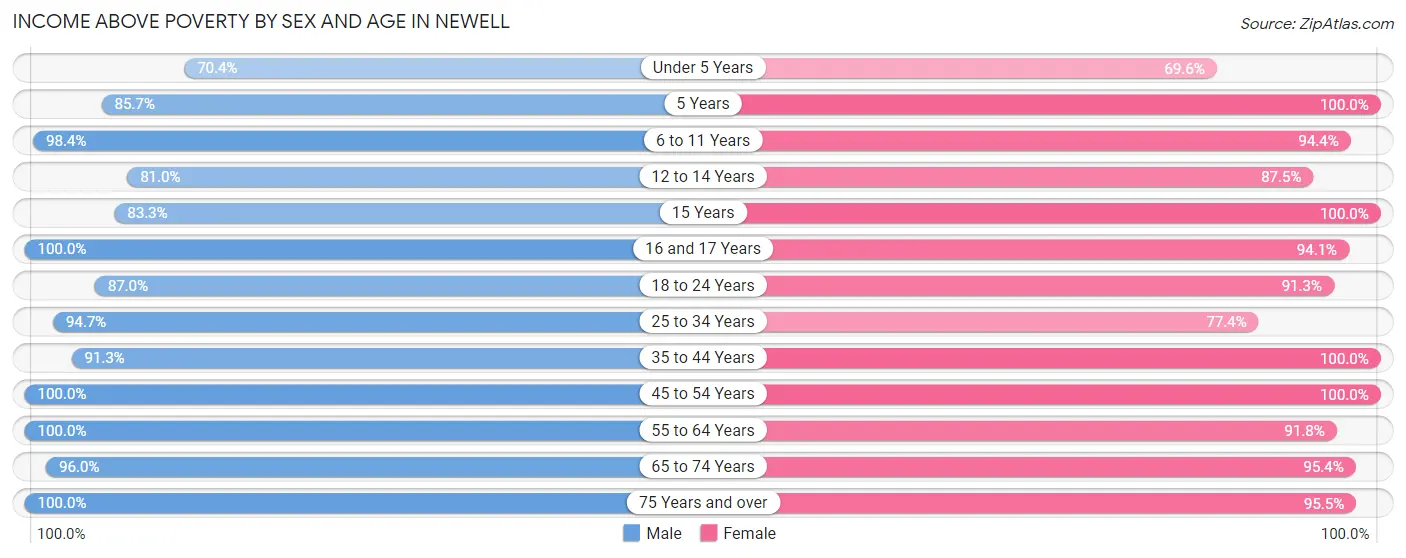
| Age Bracket | Male | Female |
| Under 5 Years | 19 (70.4%) | 32 (69.6%) |
| 5 Years | 36 (85.7%) | 2 (100.0%) |
| 6 to 11 Years | 62 (98.4%) | 34 (94.4%) |
| 12 to 14 Years | 17 (80.9%) | 14 (87.5%) |
| 15 Years | 15 (83.3%) | 3 (100.0%) |
| 16 and 17 Years | 17 (100.0%) | 16 (94.1%) |
| 18 to 24 Years | 20 (87.0%) | 21 (91.3%) |
| 25 to 34 Years | 36 (94.7%) | 41 (77.4%) |
| 35 to 44 Years | 42 (91.3%) | 32 (100.0%) |
| 45 to 54 Years | 91 (100.0%) | 36 (100.0%) |
| 55 to 64 Years | 46 (100.0%) | 45 (91.8%) |
| 65 to 74 Years | 24 (96.0%) | 41 (95.4%) |
| 75 Years and over | 26 (100.0%) | 21 (95.5%) |
| Total | 451 (93.4%) | 338 (89.4%) |
Income Below Poverty Among Married-Couple Families in Newell
The poverty statistics for married-couple families in Newell show that 1.3% or 2 of the total 151 families live below the poverty line. Families with 5 or more children have the highest poverty rate of 100.0%, comprising of 2 families. On the other hand, families with no children have the lowest poverty rate of 0.0%, which includes 0 families.
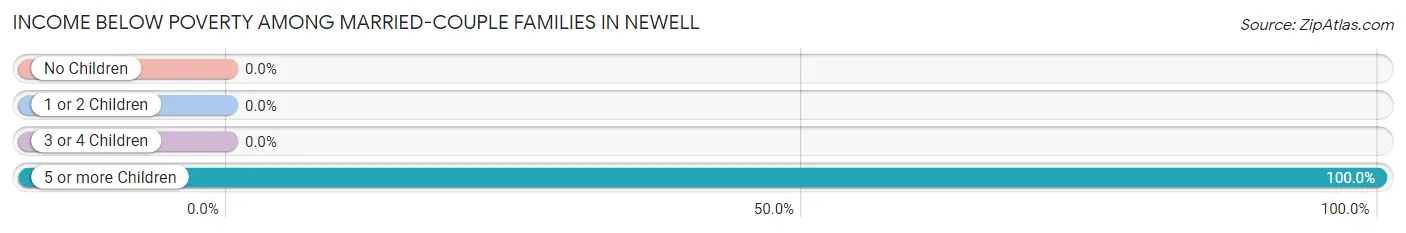
| Children | Above Poverty | Below Poverty |
| No Children | 85 (100.0%) | 0 (0.0%) |
| 1 or 2 Children | 35 (100.0%) | 0 (0.0%) |
| 3 or 4 Children | 29 (100.0%) | 0 (0.0%) |
| 5 or more Children | 0 (0.0%) | 2 (100.0%) |
| Total | 149 (98.7%) | 2 (1.3%) |
Income Below Poverty Among Single-Parent Households in Newell
According to the poverty data in Newell, 30.8% or 4 single-father households and 34.5% or 10 single-mother households are living below the poverty line. Among single-father households, those with 3 or 4 children have the highest poverty rate, with 4 households (100.0%) experiencing poverty. Likewise, among single-mother households, those with 5 or more children have the highest poverty rate, with 2 households (100.0%) falling below the poverty line.
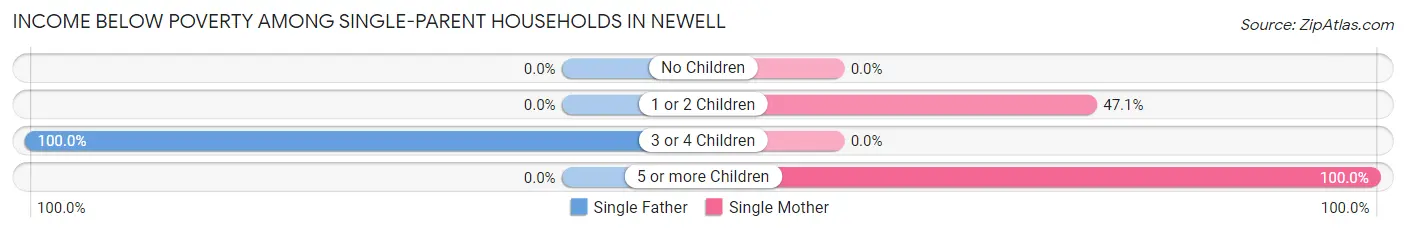
| Children | Single Father | Single Mother |
| No Children | 0 (0.0%) | 0 (0.0%) |
| 1 or 2 Children | 0 (0.0%) | 8 (47.1%) |
| 3 or 4 Children | 4 (100.0%) | 0 (0.0%) |
| 5 or more Children | 0 (0.0%) | 2 (100.0%) |
| Total | 4 (30.8%) | 10 (34.5%) |
Income Below Poverty Among Married-Couple vs Single-Parent Households in Newell
The poverty data for Newell shows that 2 of the married-couple family households (1.3%) and 14 of the single-parent households (33.3%) are living below the poverty level. Within the married-couple family households, those with 5 or more children have the highest poverty rate, with 2 households (100.0%) falling below the poverty line. Among the single-parent households, those with 3 or 4 children have the highest poverty rate, with 4 household (44.4%) living below poverty.
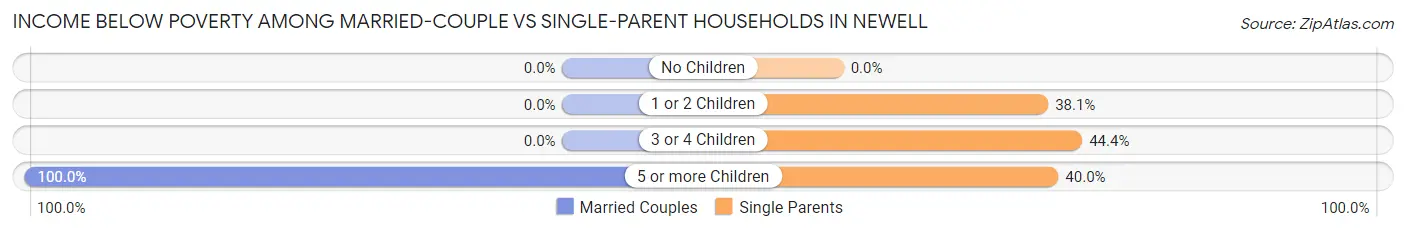
| Children | Married-Couple Families | Single-Parent Households |
| No Children | 0 (0.0%) | 0 (0.0%) |
| 1 or 2 Children | 0 (0.0%) | 8 (38.1%) |
| 3 or 4 Children | 0 (0.0%) | 4 (44.4%) |
| 5 or more Children | 2 (100.0%) | 2 (40.0%) |
| Total | 2 (1.3%) | 14 (33.3%) |
Race in Newell
The most populous races in Newell are White / Caucasian (840 | 94.2%), Hispanic or Latino (36 | 4.0%), and Two or more Races (36 | 4.0%).
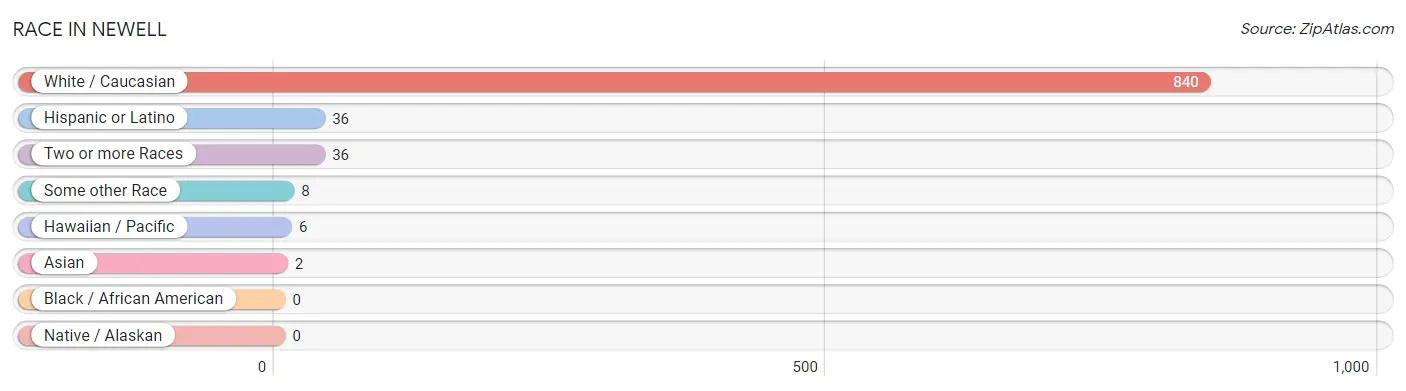
| Race | # Population | % Population |
| Asian | 2 | 0.2% |
| Black / African American | 0 | 0.0% |
| Hawaiian / Pacific | 6 | 0.7% |
| Hispanic or Latino | 36 | 4.0% |
| Native / Alaskan | 0 | 0.0% |
| White / Caucasian | 840 | 94.2% |
| Two or more Races | 36 | 4.0% |
| Some other Race | 8 | 0.9% |
| Total | 892 | 100.0% |
Ancestry in Newell
The most populous ancestries reported in Newell are German (444 | 49.8%), Irish (134 | 15.0%), Czech (108 | 12.1%), Danish (89 | 10.0%), and English (64 | 7.2%), together accounting for 94.1% of all Newell residents.
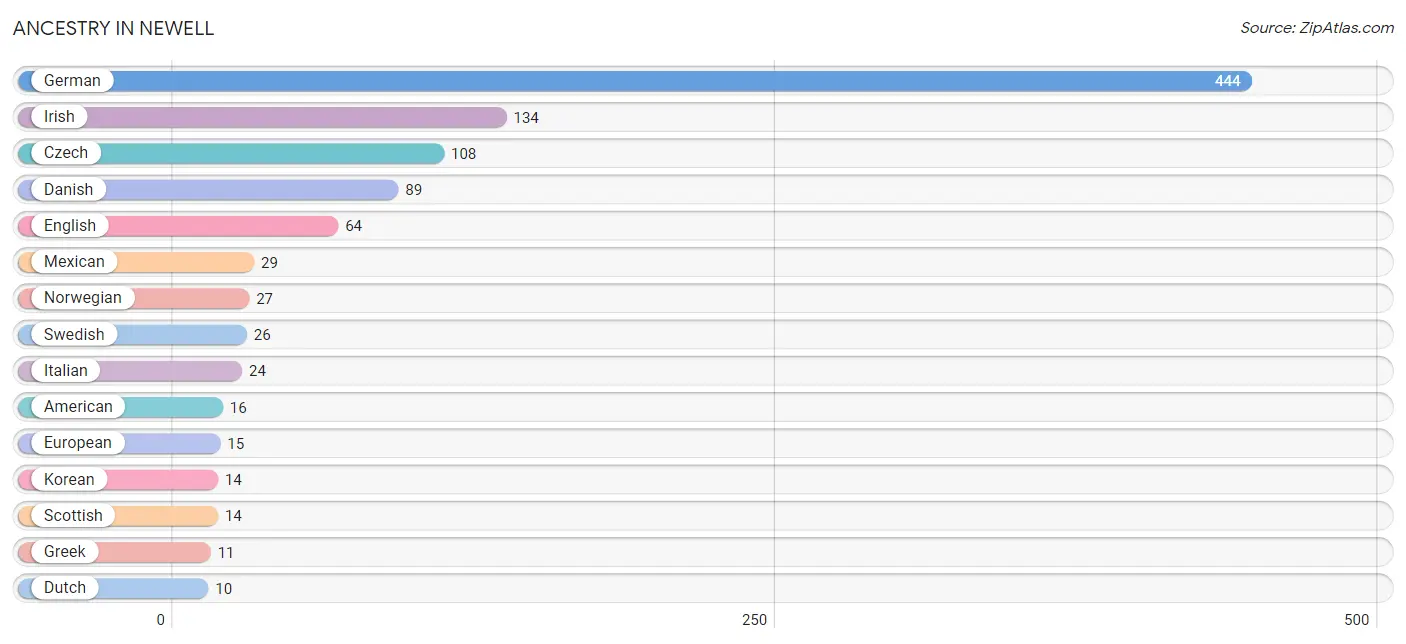
| Ancestry | # Population | % Population |
| American | 16 | 1.8% |
| Bangladeshi | 1 | 0.1% |
| British | 6 | 0.7% |
| Canadian | 3 | 0.3% |
| Central American | 7 | 0.8% |
| Cherokee | 5 | 0.6% |
| Czech | 108 | 12.1% |
| Czechoslovakian | 3 | 0.3% |
| Danish | 89 | 10.0% |
| Dutch | 10 | 1.1% |
| English | 64 | 7.2% |
| European | 15 | 1.7% |
| French Canadian | 4 | 0.4% |
| German | 444 | 49.8% |
| Greek | 11 | 1.2% |
| Guatemalan | 7 | 0.8% |
| Irish | 134 | 15.0% |
| Italian | 24 | 2.7% |
| Korean | 14 | 1.6% |
| Malaysian | 5 | 0.6% |
| Mexican | 29 | 3.3% |
| Native Hawaiian | 3 | 0.3% |
| Norwegian | 27 | 3.0% |
| Polish | 4 | 0.4% |
| Scandinavian | 3 | 0.3% |
| Scottish | 14 | 1.6% |
| Swedish | 26 | 2.9% |
| Swiss | 2 | 0.2% | View All 28 Rows |
Immigrants in Newell
The most numerous immigrant groups reported in Newell came from Asia (5 | 0.6%), South Eastern Asia (5 | 0.6%), Philippines (4 | 0.4%), Europe (3 | 0.3%), and Ireland (3 | 0.3%), together accounting for 2.2% of all Newell residents.
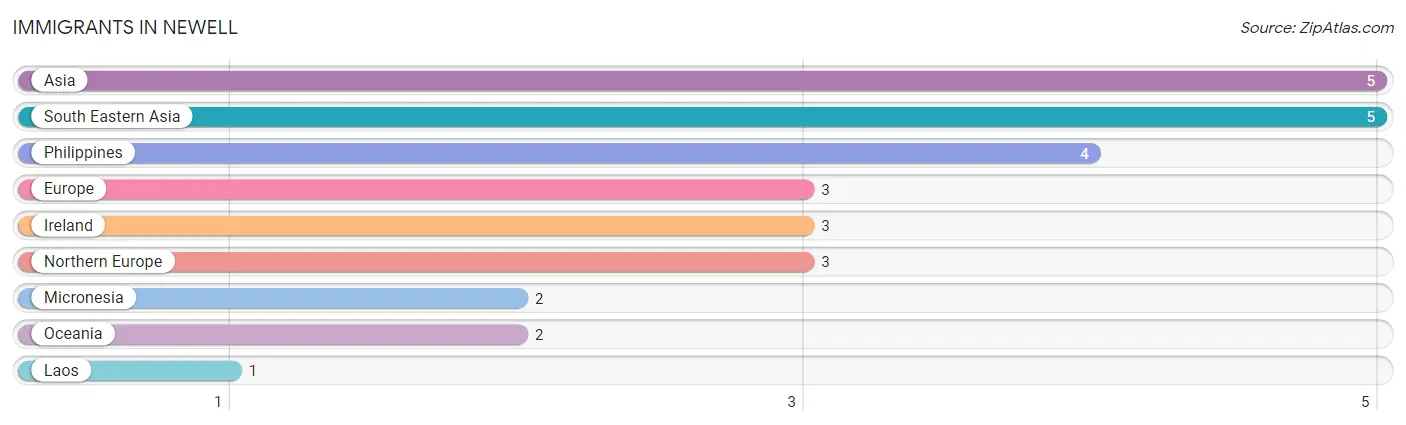
| Immigration Origin | # Population | % Population |
| Asia | 5 | 0.6% |
| Europe | 3 | 0.3% |
| Ireland | 3 | 0.3% |
| Laos | 1 | 0.1% |
| Micronesia | 2 | 0.2% |
| Northern Europe | 3 | 0.3% |
| Oceania | 2 | 0.2% |
| Philippines | 4 | 0.4% |
| South Eastern Asia | 5 | 0.6% | View All 9 Rows |
Sex and Age in Newell
Sex and Age in Newell
The most populous age groups in Newell are 5 to 9 Years (102 | 20.6%) for men and Under 5 Years (46 | 11.6%) for women.
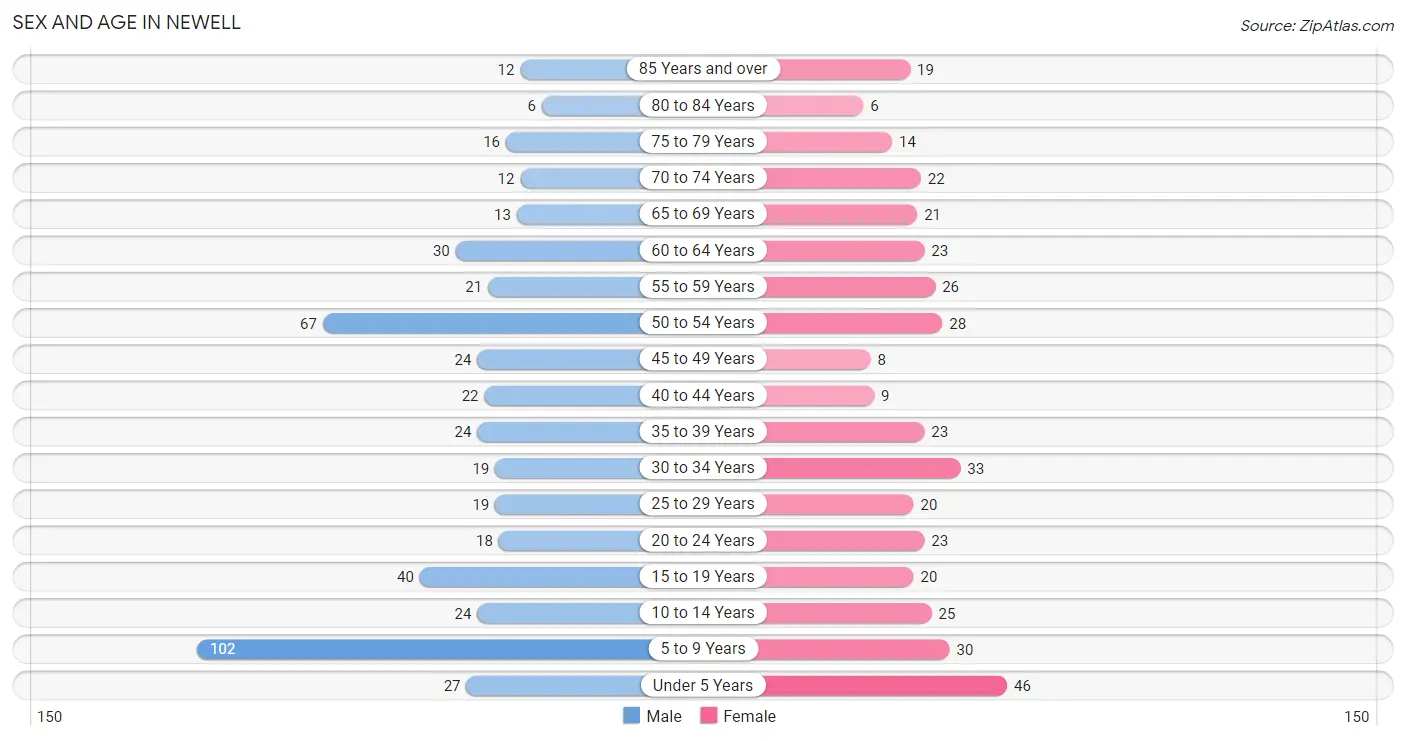
| Age Bracket | Male | Female |
| Under 5 Years | 27 (5.4%) | 46 (11.6%) |
| 5 to 9 Years | 102 (20.6%) | 30 (7.6%) |
| 10 to 14 Years | 24 (4.8%) | 25 (6.3%) |
| 15 to 19 Years | 40 (8.1%) | 20 (5.1%) |
| 20 to 24 Years | 18 (3.6%) | 23 (5.8%) |
| 25 to 29 Years | 19 (3.8%) | 20 (5.1%) |
| 30 to 34 Years | 19 (3.8%) | 33 (8.3%) |
| 35 to 39 Years | 24 (4.8%) | 23 (5.8%) |
| 40 to 44 Years | 22 (4.4%) | 9 (2.3%) |
| 45 to 49 Years | 24 (4.8%) | 8 (2.0%) |
| 50 to 54 Years | 67 (13.5%) | 28 (7.1%) |
| 55 to 59 Years | 21 (4.2%) | 26 (6.6%) |
| 60 to 64 Years | 30 (6.0%) | 23 (5.8%) |
| 65 to 69 Years | 13 (2.6%) | 21 (5.3%) |
| 70 to 74 Years | 12 (2.4%) | 22 (5.6%) |
| 75 to 79 Years | 16 (3.2%) | 14 (3.5%) |
| 80 to 84 Years | 6 (1.2%) | 6 (1.5%) |
| 85 Years and over | 12 (2.4%) | 19 (4.8%) |
| Total | 496 (100.0%) | 396 (100.0%) |
Families and Households in Newell
Median Family Size in Newell
The median family size in Newell is 3.69 persons per family, with married-couple families (151 | 78.2%) accounting for the largest median family size of 3.82 persons per family. On the other hand, single female/mother families (29 | 15.0%) represent the smallest median family size with 3.03 persons per family.
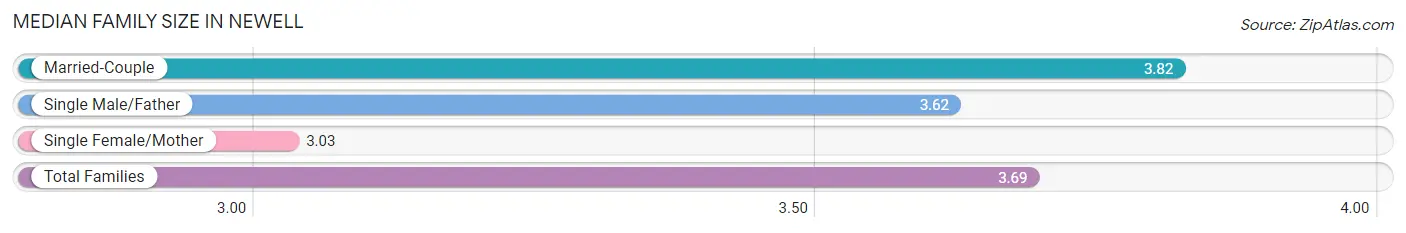
| Family Type | # Families | Family Size |
| Married-Couple | 151 (78.2%) | 3.82 |
| Single Male/Father | 13 (6.7%) | 3.62 |
| Single Female/Mother | 29 (15.0%) | 3.03 |
| Total Families | 193 (100.0%) | 3.69 |
Median Household Size in Newell
The median household size in Newell is 2.78 persons per household, with single male/father households (13 | 4.2%) accounting for the largest median household size of 4.08 persons per household. non-family households (117 | 37.7%) represent the smallest median household size with 1.12 persons per household.
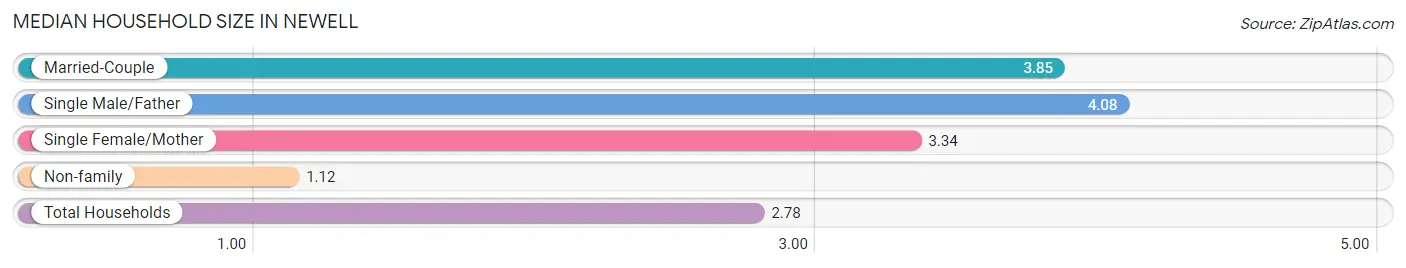
| Household Type | # Households | Household Size |
| Married-Couple | 151 (48.7%) | 3.85 |
| Single Male/Father | 13 (4.2%) | 4.08 |
| Single Female/Mother | 29 (9.3%) | 3.34 |
| Non-family | 117 (37.7%) | 1.12 |
| Total Households | 310 (100.0%) | 2.78 |
Household Size by Marriage Status in Newell
Out of a total of 310 households in Newell, 193 (62.3%) are family households, while 117 (37.7%) are nonfamily households. The most numerous type of family households are 2-person households, comprising 90, and the most common type of nonfamily households are 1-person households, comprising 99.
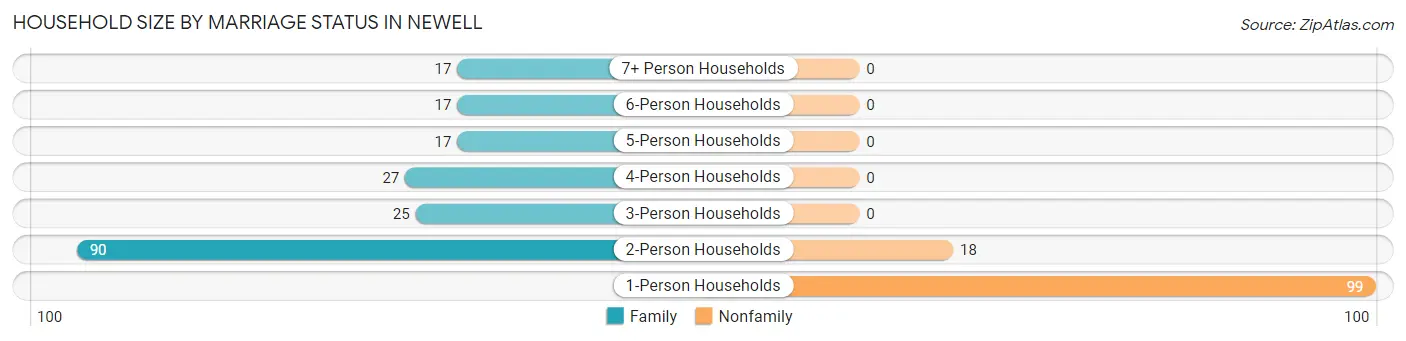
| Household Size | Family Households | Nonfamily Households |
| 1-Person Households | - | 99 (31.9%) |
| 2-Person Households | 90 (29.0%) | 18 (5.8%) |
| 3-Person Households | 25 (8.1%) | 0 (0.0%) |
| 4-Person Households | 27 (8.7%) | 0 (0.0%) |
| 5-Person Households | 17 (5.5%) | 0 (0.0%) |
| 6-Person Households | 17 (5.5%) | 0 (0.0%) |
| 7+ Person Households | 17 (5.5%) | 0 (0.0%) |
| Total | 193 (62.3%) | 117 (37.7%) |
Female Fertility in Newell
Fertility by Age in Newell
Average fertility rate in Newell is 142.0 births per 1,000 women. Women in the age bracket of 20 to 34 years have the highest fertility rate with 263.0 births per 1,000 women. Women in the age bracket of 20 to 34 years acount for 100.0% of all women with births.
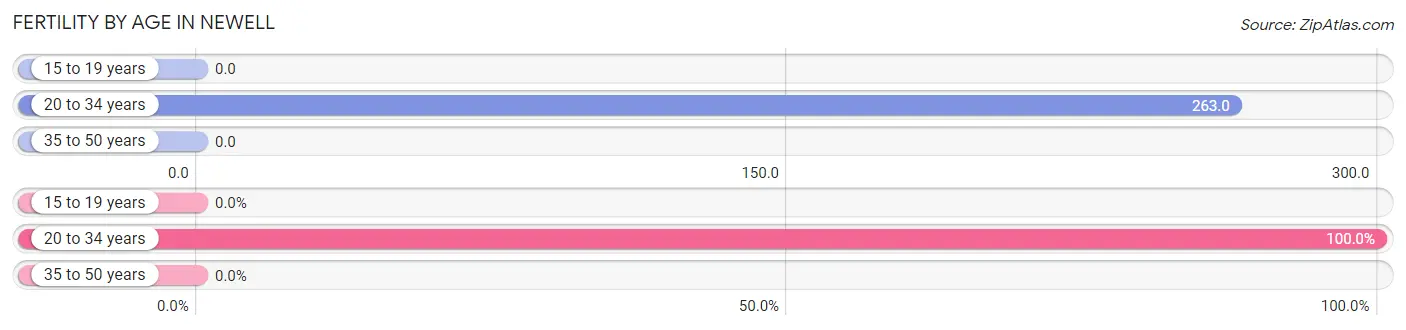
| Age Bracket | Women with Births | Births / 1,000 Women |
| 15 to 19 years | 0 (0.0%) | 0.0 |
| 20 to 34 years | 20 (100.0%) | 263.0 |
| 35 to 50 years | 0 (0.0%) | 0.0 |
| Total | 20 (100.0%) | 142.0 |
Fertility by Age by Marriage Status in Newell
85.0% of women with births (20) in Newell are married. The highest percentage of unmarried women with births falls into 20 to 34 years age bracket with 15.0% of them unmarried at the time of birth, while the lowest percentage of unmarried women with births belong to 20 to 34 years age bracket with 15.0% of them unmarried.
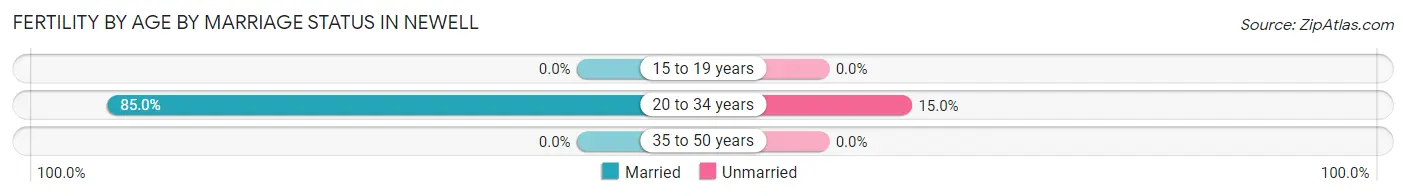
| Age Bracket | Married | Unmarried |
| 15 to 19 years | 0 (0.0%) | 0 (0.0%) |
| 20 to 34 years | 17 (85.0%) | 3 (15.0%) |
| 35 to 50 years | 0 (0.0%) | 0 (0.0%) |
| Total | 17 (85.0%) | 3 (15.0%) |
Fertility by Education in Newell
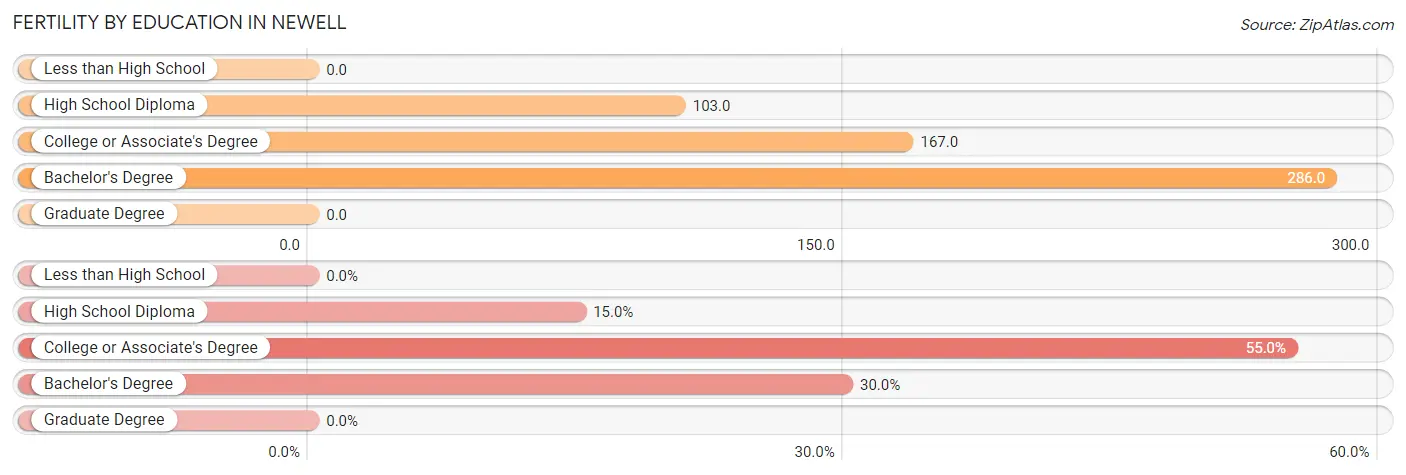
| Educational Attainment | Women with Births | Births / 1,000 Women |
| Less than High School | 0 (0.0%) | 0.0 |
| High School Diploma | 3 (15.0%) | 103.0 |
| College or Associate's Degree | 11 (55.0%) | 167.0 |
| Bachelor's Degree | 6 (30.0%) | 286.0 |
| Graduate Degree | 0 (0.0%) | 0.0 |
| Total | 20 (100.0%) | 142.0 |
Fertility by Education by Marriage Status in Newell
15.0% of women with births in Newell are unmarried. Women with the educational attainment of college or associate's degree are most likely to be married with 100.0% of them married at childbirth, while women with the educational attainment of high school diploma are least likely to be married with 100.0% of them unmarried at childbirth.
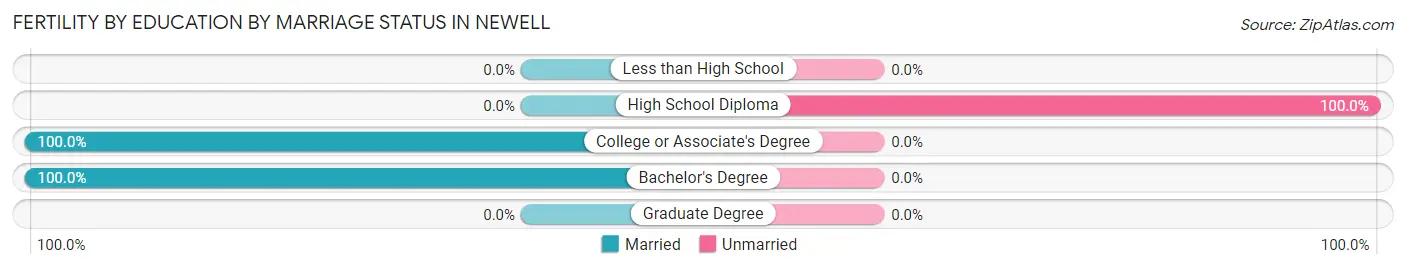
| Educational Attainment | Married | Unmarried |
| Less than High School | 0 (0.0%) | 0 (0.0%) |
| High School Diploma | 0 (0.0%) | 3 (100.0%) |
| College or Associate's Degree | 11 (100.0%) | 0 (0.0%) |
| Bachelor's Degree | 6 (100.0%) | 0 (0.0%) |
| Graduate Degree | 0 (0.0%) | 0 (0.0%) |
| Total | 17 (85.0%) | 3 (15.0%) |
Employment Characteristics in Newell
Employment by Class of Employer in Newell
Among the 402 employed individuals in Newell, private company employees (271 | 67.4%), self-employed (not incorporated) (44 | 11.0%), and local government employees (42 | 10.4%) make up the most common classes of employment.
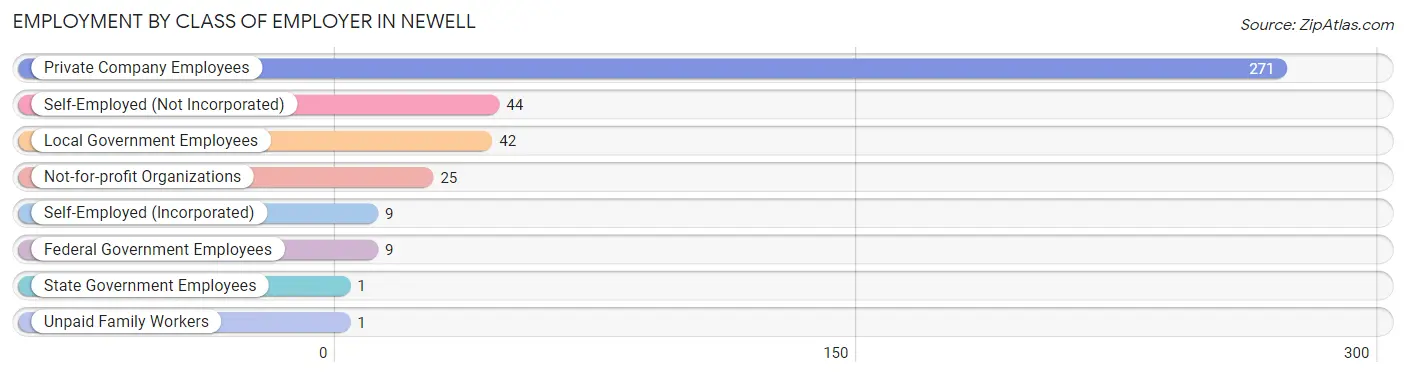
| Employer Class | # Employees | % Employees |
| Private Company Employees | 271 | 67.4% |
| Self-Employed (Incorporated) | 9 | 2.2% |
| Self-Employed (Not Incorporated) | 44 | 11.0% |
| Not-for-profit Organizations | 25 | 6.2% |
| Local Government Employees | 42 | 10.4% |
| State Government Employees | 1 | 0.3% |
| Federal Government Employees | 9 | 2.2% |
| Unpaid Family Workers | 1 | 0.3% |
| Total | 402 | 100.0% |
Employment Status by Age in Newell
According to the labor force statistics for Newell, out of the total population over 16 years of age (617), 70.2% or 433 individuals are in the labor force, with 5.1% or 22 of them unemployed. The age group with the highest labor force participation rate is 35 to 44 years, with 100.0% or 78 individuals in the labor force. Within the labor force, the 30 to 34 years age range has the highest percentage of unemployed individuals, with 14.6% or 7 of them being unemployed.
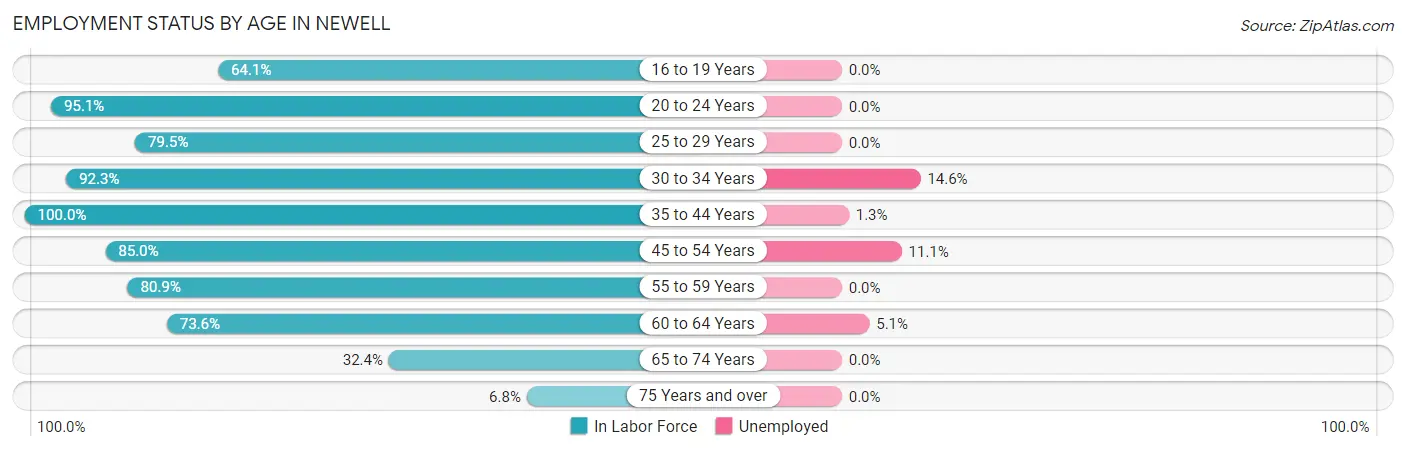
| Age Bracket | In Labor Force | Unemployed |
| 16 to 19 Years | 25 (64.1%) | 0 (0.0%) |
| 20 to 24 Years | 39 (95.1%) | 0 (0.0%) |
| 25 to 29 Years | 31 (79.5%) | 0 (0.0%) |
| 30 to 34 Years | 48 (92.3%) | 7 (14.6%) |
| 35 to 44 Years | 78 (100.0%) | 1 (1.3%) |
| 45 to 54 Years | 108 (85.0%) | 12 (11.1%) |
| 55 to 59 Years | 38 (80.9%) | 0 (0.0%) |
| 60 to 64 Years | 39 (73.6%) | 2 (5.1%) |
| 65 to 74 Years | 22 (32.4%) | 0 (0.0%) |
| 75 Years and over | 5 (6.8%) | 0 (0.0%) |
| Total | 433 (70.2%) | 22 (5.1%) |
Employment Status by Educational Attainment in Newell
According to labor force statistics for Newell, 86.4% of individuals (342) out of the total population between 25 and 64 years of age (396) are in the labor force, with 6.4% or 22 of them being unemployed. The group with the highest labor force participation rate are those with the educational attainment of bachelor's degree or higher, with 92.1% or 58 individuals in the labor force. Within the labor force, individuals with high school diploma education have the highest percentage of unemployment, with 11.5% or 13 of them being unemployed.
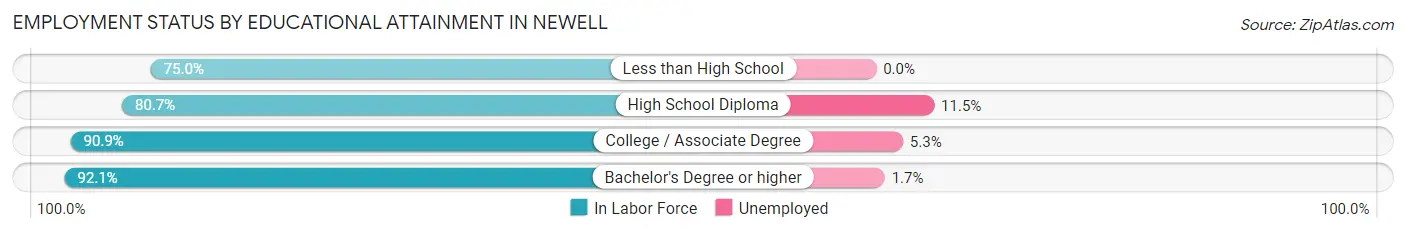
| Educational Attainment | In Labor Force | Unemployed |
| Less than High School | 21 (75.0%) | 0 (0.0%) |
| High School Diploma | 113 (80.7%) | 16 (11.5%) |
| College / Associate Degree | 150 (90.9%) | 9 (5.3%) |
| Bachelor's Degree or higher | 58 (92.1%) | 1 (1.7%) |
| Total | 342 (86.4%) | 25 (6.4%) |
Employment Occupations by Sex in Newell
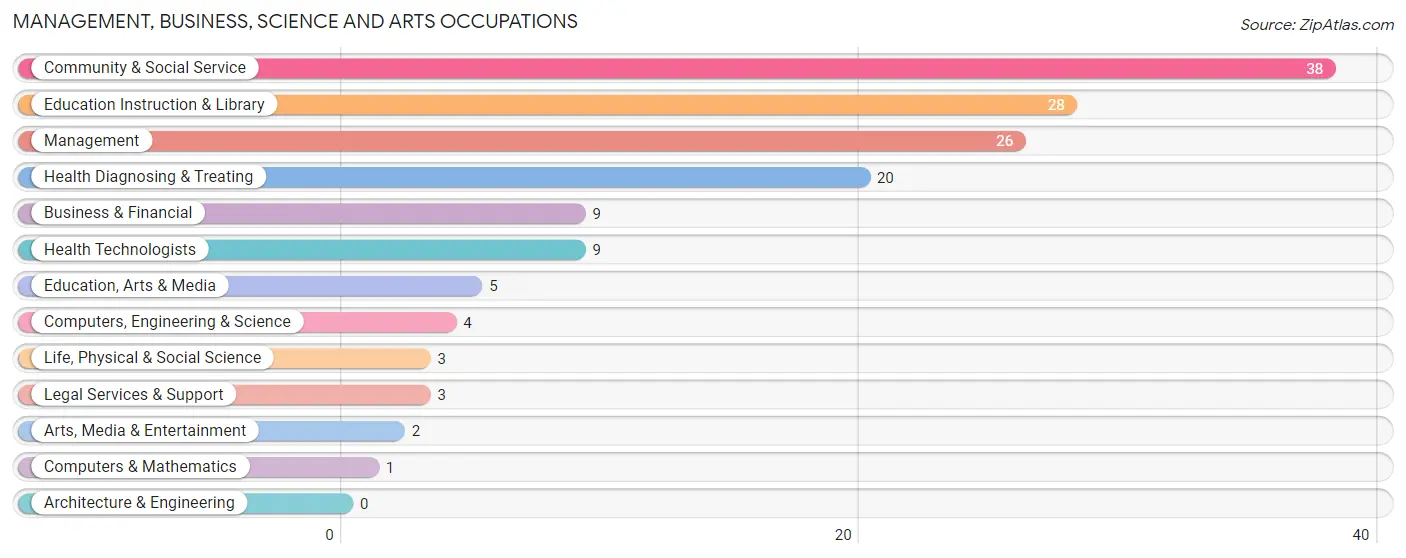
Management, Business, Science and Arts Occupations
The most common Management, Business, Science and Arts occupations in Newell are Community & Social Service (38 | 9.2%), Education Instruction & Library (28 | 6.8%), Management (26 | 6.3%), Health Diagnosing & Treating (20 | 4.9%), and Business & Financial (9 | 2.2%).
Management, Business, Science and Arts Occupations by Sex
Within the Management, Business, Science and Arts occupations in Newell, the most male-oriented occupations are Computers, Engineering & Science (100.0%), Computers & Mathematics (100.0%), and Life, Physical & Social Science (100.0%), while the most female-oriented occupations are Health Diagnosing & Treating (100.0%), Health Technologists (100.0%), and Education, Arts & Media (80.0%).
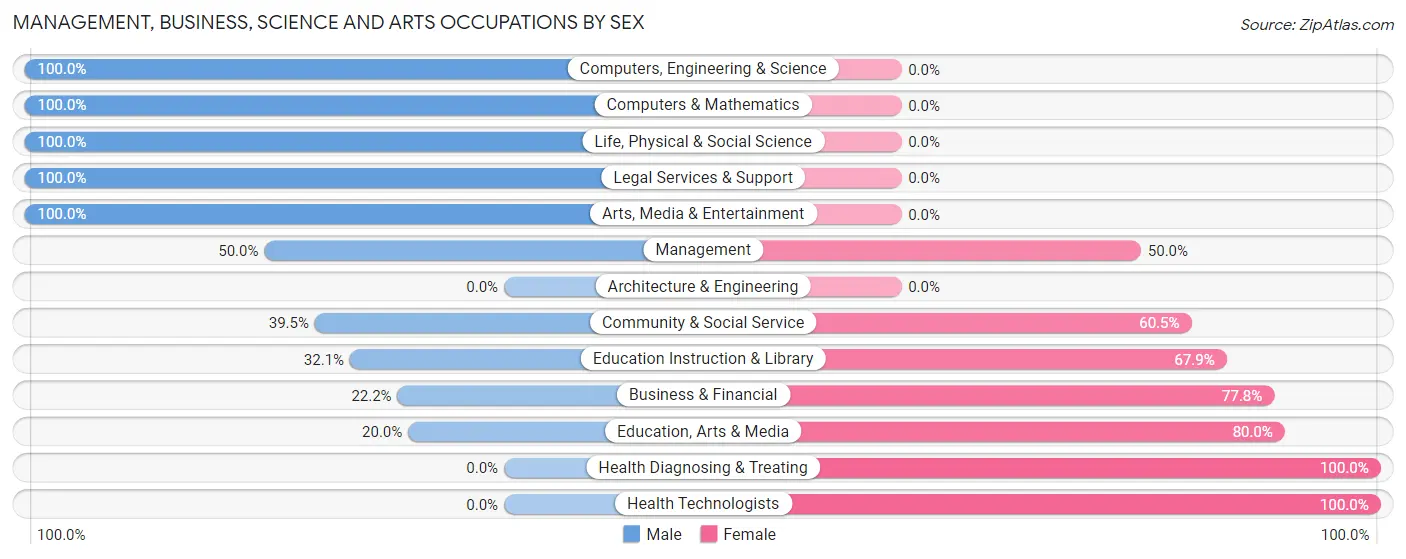
| Occupation | Male | Female |
| Management | 13 (50.0%) | 13 (50.0%) |
| Business & Financial | 2 (22.2%) | 7 (77.8%) |
| Computers, Engineering & Science | 4 (100.0%) | 0 (0.0%) |
| Computers & Mathematics | 1 (100.0%) | 0 (0.0%) |
| Architecture & Engineering | 0 (0.0%) | 0 (0.0%) |
| Life, Physical & Social Science | 3 (100.0%) | 0 (0.0%) |
| Community & Social Service | 15 (39.5%) | 23 (60.5%) |
| Education, Arts & Media | 1 (20.0%) | 4 (80.0%) |
| Legal Services & Support | 3 (100.0%) | 0 (0.0%) |
| Education Instruction & Library | 9 (32.1%) | 19 (67.9%) |
| Arts, Media & Entertainment | 2 (100.0%) | 0 (0.0%) |
| Health Diagnosing & Treating | 0 (0.0%) | 20 (100.0%) |
| Health Technologists | 0 (0.0%) | 9 (100.0%) |
| Total (Category) | 34 (35.0%) | 63 (64.9%) |
| Total (Overall) | 226 (55.0%) | 185 (45.0%) |
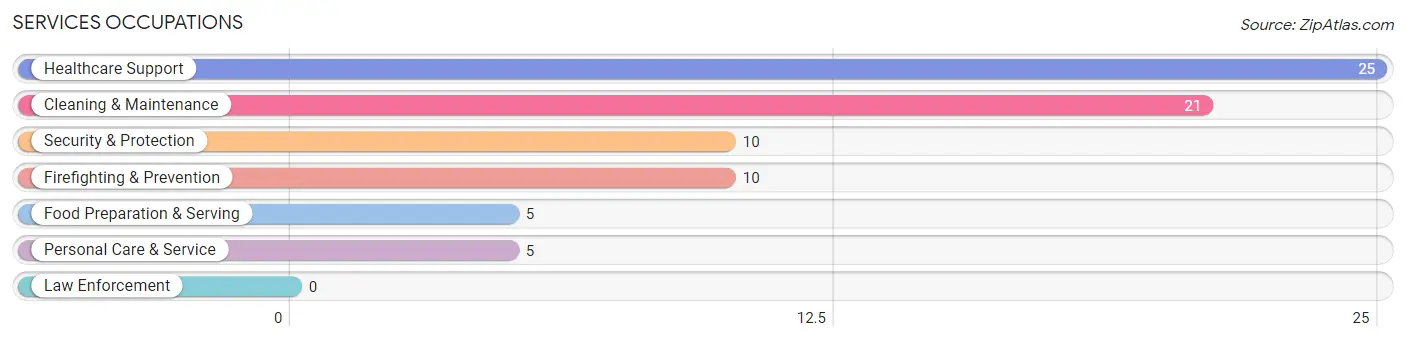
Services Occupations
The most common Services occupations in Newell are Healthcare Support (25 | 6.1%), Cleaning & Maintenance (21 | 5.1%), Security & Protection (10 | 2.4%), Firefighting & Prevention (10 | 2.4%), and Food Preparation & Serving (5 | 1.2%).
Services Occupations by Sex
Within the Services occupations in Newell, the most male-oriented occupations are Cleaning & Maintenance (66.7%), Security & Protection (30.0%), and Firefighting & Prevention (30.0%), while the most female-oriented occupations are Personal Care & Service (100.0%), Healthcare Support (96.0%), and Food Preparation & Serving (80.0%).
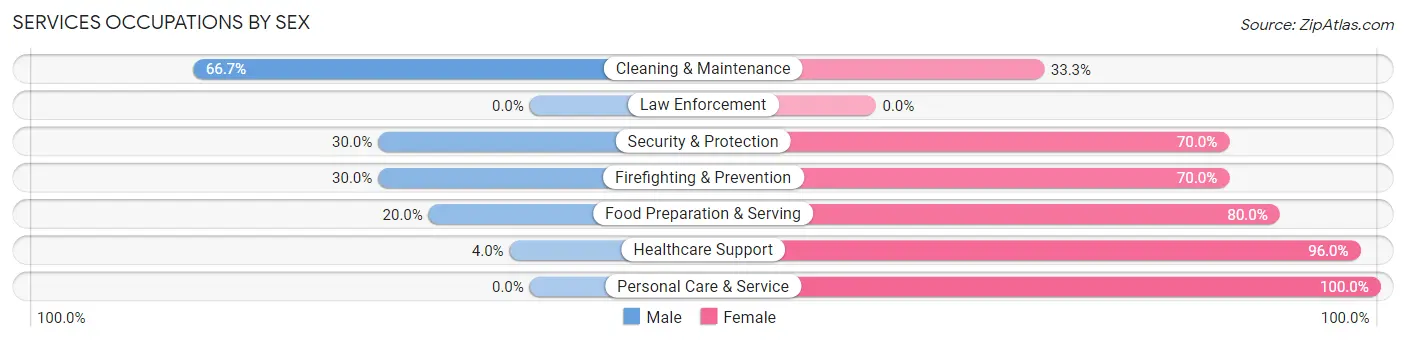
| Occupation | Male | Female |
| Healthcare Support | 1 (4.0%) | 24 (96.0%) |
| Security & Protection | 3 (30.0%) | 7 (70.0%) |
| Firefighting & Prevention | 3 (30.0%) | 7 (70.0%) |
| Law Enforcement | 0 (0.0%) | 0 (0.0%) |
| Food Preparation & Serving | 1 (20.0%) | 4 (80.0%) |
| Cleaning & Maintenance | 14 (66.7%) | 7 (33.3%) |
| Personal Care & Service | 0 (0.0%) | 5 (100.0%) |
| Total (Category) | 19 (28.8%) | 47 (71.2%) |
| Total (Overall) | 226 (55.0%) | 185 (45.0%) |
Sales and Office Occupations
The most common Sales and Office occupations in Newell are Sales & Related (45 | 11.0%), and Office & Administration (38 | 9.2%).
Sales and Office Occupations by Sex
| Occupation | Male | Female |
| Sales & Related | 13 (28.9%) | 32 (71.1%) |
| Office & Administration | 6 (15.8%) | 32 (84.2%) |
| Total (Category) | 19 (22.9%) | 64 (77.1%) |
| Total (Overall) | 226 (55.0%) | 185 (45.0%) |
Natural Resources, Construction and Maintenance Occupations
The most common Natural Resources, Construction and Maintenance occupations in Newell are Installation, Maintenance & Repair (42 | 10.2%), Construction & Extraction (32 | 7.8%), and Farming, Fishing & Forestry (13 | 3.2%).
Natural Resources, Construction and Maintenance Occupations by Sex
| Occupation | Male | Female |
| Farming, Fishing & Forestry | 10 (76.9%) | 3 (23.1%) |
| Construction & Extraction | 32 (100.0%) | 0 (0.0%) |
| Installation, Maintenance & Repair | 42 (100.0%) | 0 (0.0%) |
| Total (Category) | 84 (96.6%) | 3 (3.5%) |
| Total (Overall) | 226 (55.0%) | 185 (45.0%) |
Production, Transportation and Moving Occupations
The most common Production, Transportation and Moving occupations in Newell are Production (45 | 11.0%), Transportation (27 | 6.6%), and Material Moving (6 | 1.5%).
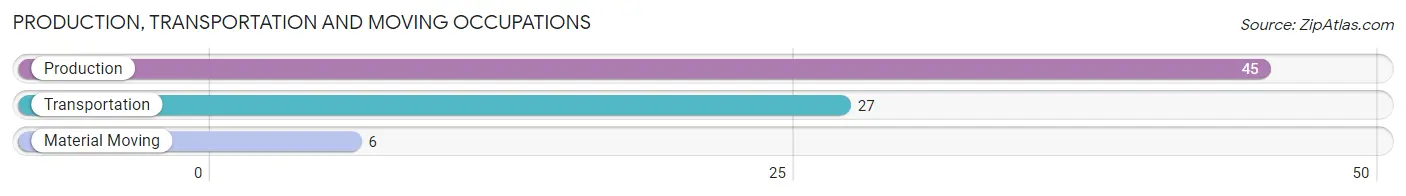
Production, Transportation and Moving Occupations by Sex
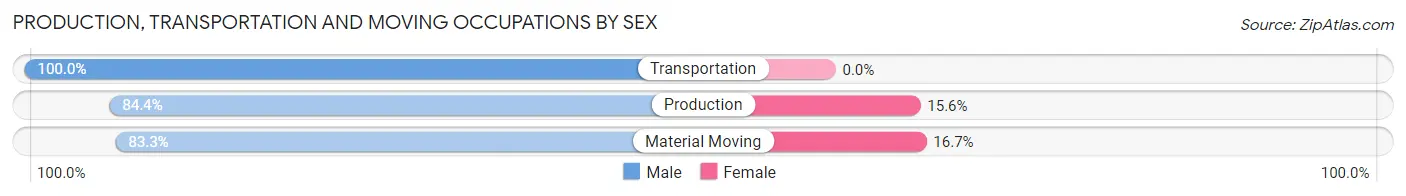
| Occupation | Male | Female |
| Production | 38 (84.4%) | 7 (15.6%) |
| Transportation | 27 (100.0%) | 0 (0.0%) |
| Material Moving | 5 (83.3%) | 1 (16.7%) |
| Total (Category) | 70 (89.7%) | 8 (10.3%) |
| Total (Overall) | 226 (55.0%) | 185 (45.0%) |
Employment Industries by Sex in Newell
Employment Industries in Newell
The major employment industries in Newell include Manufacturing (80 | 19.5%), Health Care & Social Assistance (48 | 11.7%), Construction (42 | 10.2%), Retail Trade (40 | 9.7%), and Educational Services (40 | 9.7%).
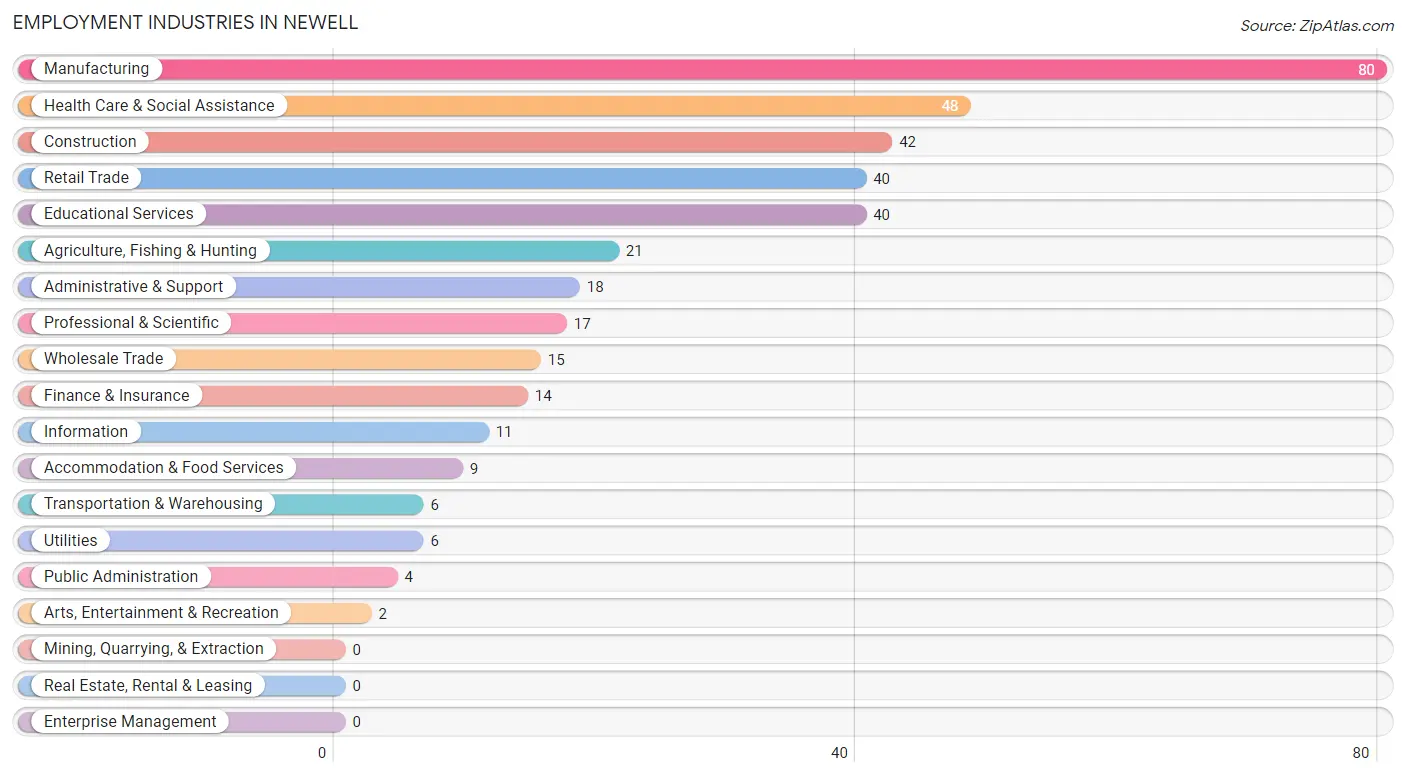
Employment Industries by Sex in Newell
The Newell industries that see more men than women are Construction (100.0%), Transportation & Warehousing (100.0%), and Utilities (100.0%), whereas the industries that tend to have a higher number of women are Information (100.0%), Public Administration (100.0%), and Health Care & Social Assistance (95.8%).
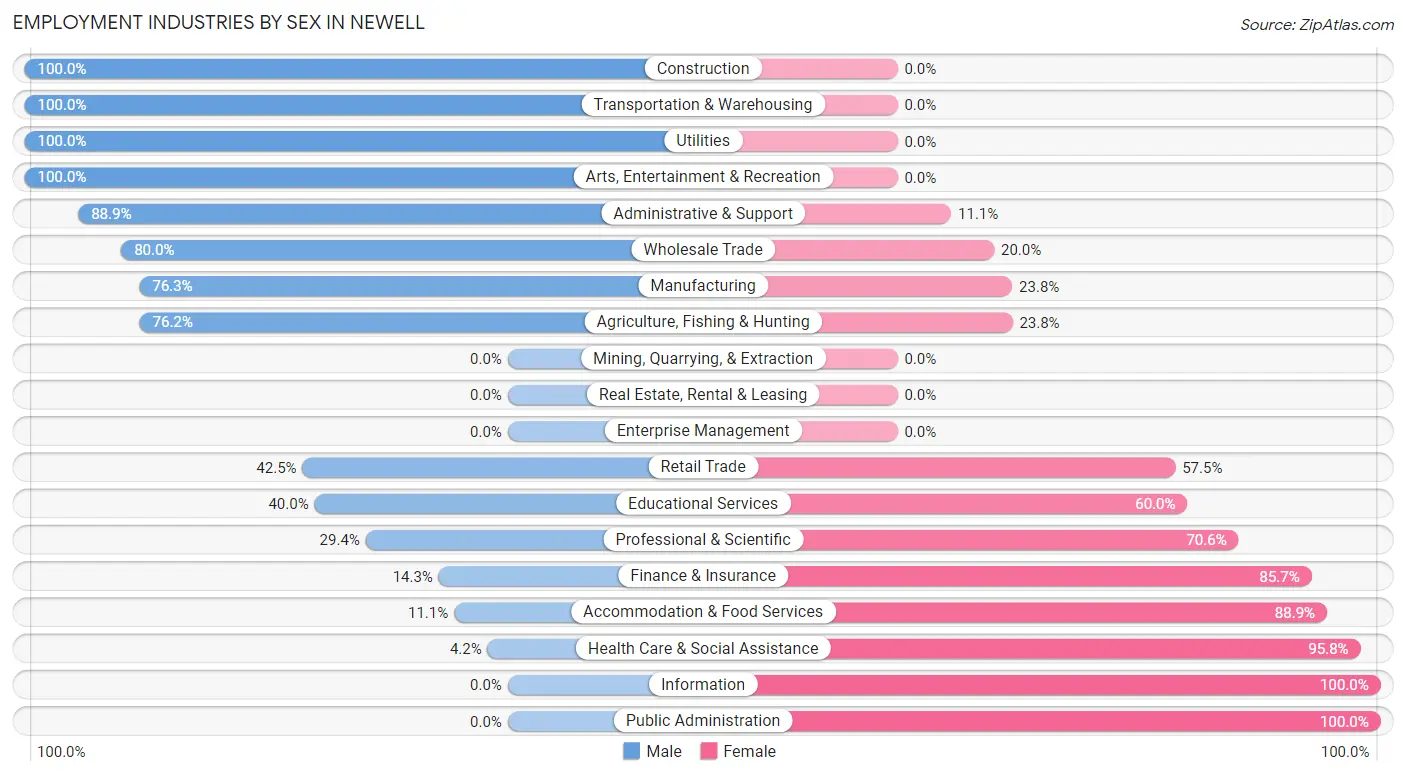
| Industry | Male | Female |
| Agriculture, Fishing & Hunting | 16 (76.2%) | 5 (23.8%) |
| Mining, Quarrying, & Extraction | 0 (0.0%) | 0 (0.0%) |
| Construction | 42 (100.0%) | 0 (0.0%) |
| Manufacturing | 61 (76.2%) | 19 (23.7%) |
| Wholesale Trade | 12 (80.0%) | 3 (20.0%) |
| Retail Trade | 17 (42.5%) | 23 (57.5%) |
| Transportation & Warehousing | 6 (100.0%) | 0 (0.0%) |
| Utilities | 6 (100.0%) | 0 (0.0%) |
| Information | 0 (0.0%) | 11 (100.0%) |
| Finance & Insurance | 2 (14.3%) | 12 (85.7%) |
| Real Estate, Rental & Leasing | 0 (0.0%) | 0 (0.0%) |
| Professional & Scientific | 5 (29.4%) | 12 (70.6%) |
| Enterprise Management | 0 (0.0%) | 0 (0.0%) |
| Administrative & Support | 16 (88.9%) | 2 (11.1%) |
| Educational Services | 16 (40.0%) | 24 (60.0%) |
| Health Care & Social Assistance | 2 (4.2%) | 46 (95.8%) |
| Arts, Entertainment & Recreation | 2 (100.0%) | 0 (0.0%) |
| Accommodation & Food Services | 1 (11.1%) | 8 (88.9%) |
| Public Administration | 0 (0.0%) | 4 (100.0%) |
| Total | 226 (55.0%) | 185 (45.0%) |
Education in Newell
School Enrollment in Newell
The most common levels of schooling among the 269 students in Newell are elementary school (72 | 26.8%), high school (58 | 21.6%), and kindergarten (53 | 19.7%).
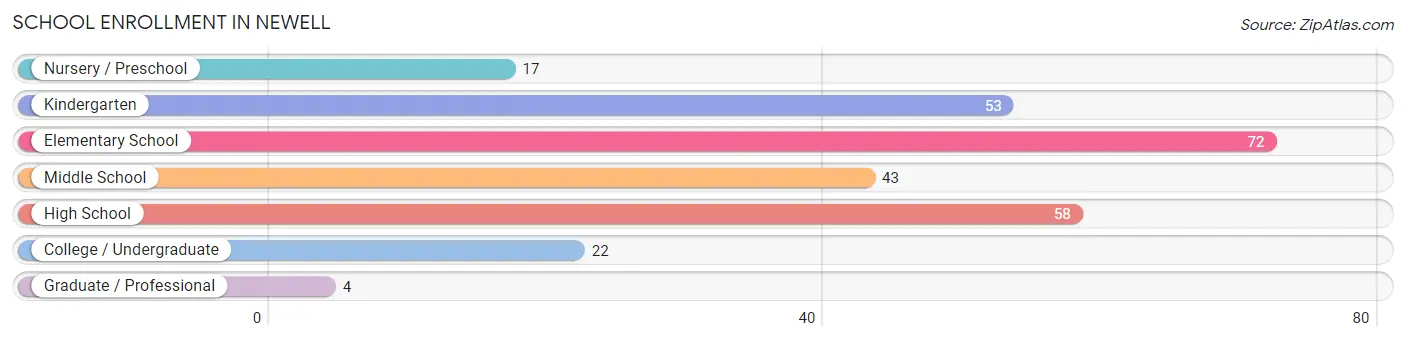
| School Level | # Students | % Students |
| Nursery / Preschool | 17 | 6.3% |
| Kindergarten | 53 | 19.7% |
| Elementary School | 72 | 26.8% |
| Middle School | 43 | 16.0% |
| High School | 58 | 21.6% |
| College / Undergraduate | 22 | 8.2% |
| Graduate / Professional | 4 | 1.5% |
| Total | 269 | 100.0% |
School Enrollment by Age by Funding Source in Newell
Out of a total of 269 students who are enrolled in schools in Newell, 16 (5.9%) attend a private institution, while the remaining 253 (94.1%) are enrolled in public schools. The age group of 20 to 24 year olds has the highest likelihood of being enrolled in private schools, with 6 (100.0% in the age bracket) enrolled. Conversely, the age group of 3 to 4 year olds has the lowest likelihood of being enrolled in a private school, with 10 (100.0% in the age bracket) attending a public institution.
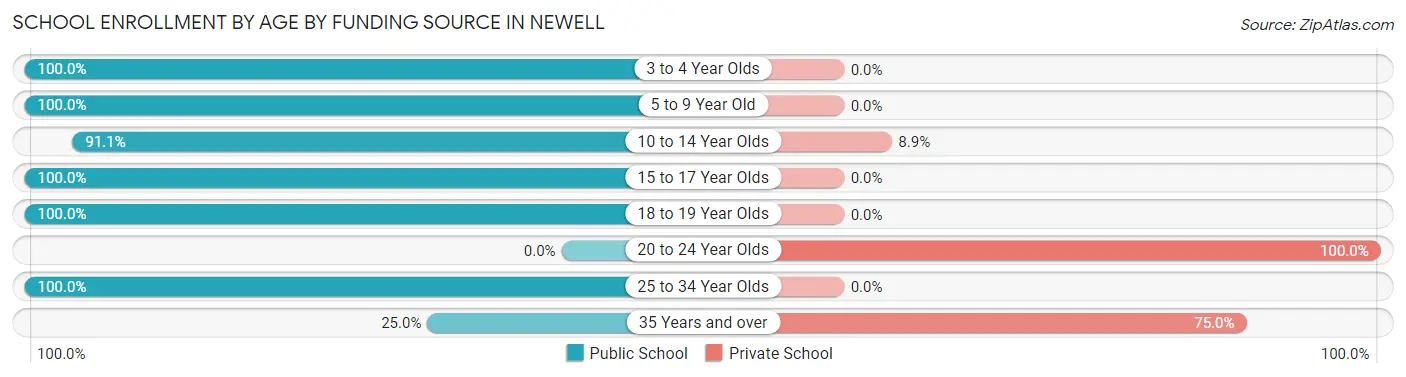
| Age Bracket | Public School | Private School |
| 3 to 4 Year Olds | 10 (100.0%) | 0 (0.0%) |
| 5 to 9 Year Old | 132 (100.0%) | 0 (0.0%) |
| 10 to 14 Year Olds | 41 (91.1%) | 4 (8.9%) |
| 15 to 17 Year Olds | 55 (100.0%) | 0 (0.0%) |
| 18 to 19 Year Olds | 1 (100.0%) | 0 (0.0%) |
| 20 to 24 Year Olds | 0 (0.0%) | 6 (100.0%) |
| 25 to 34 Year Olds | 12 (100.0%) | 0 (0.0%) |
| 35 Years and over | 2 (25.0%) | 6 (75.0%) |
| Total | 253 (94.1%) | 16 (5.9%) |
Educational Attainment by Field of Study in Newell
Education (50 | 46.3%), visual & performing arts (10 | 9.3%), bio, nature & agricultural (8 | 7.4%), business (8 | 7.4%), and science & technology (6 | 5.6%) are the most common fields of study among 108 individuals in Newell who have obtained a bachelor's degree or higher.
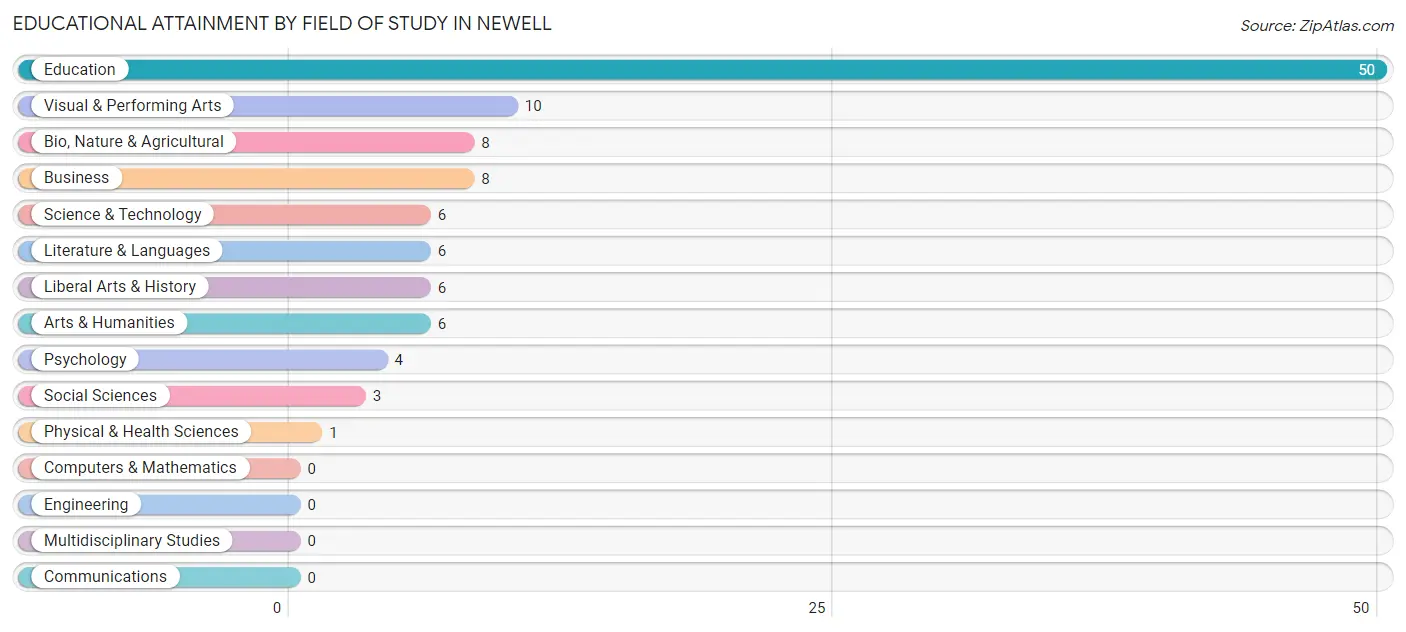
| Field of Study | # Graduates | % Graduates |
| Computers & Mathematics | 0 | 0.0% |
| Bio, Nature & Agricultural | 8 | 7.4% |
| Physical & Health Sciences | 1 | 0.9% |
| Psychology | 4 | 3.7% |
| Social Sciences | 3 | 2.8% |
| Engineering | 0 | 0.0% |
| Multidisciplinary Studies | 0 | 0.0% |
| Science & Technology | 6 | 5.6% |
| Business | 8 | 7.4% |
| Education | 50 | 46.3% |
| Literature & Languages | 6 | 5.6% |
| Liberal Arts & History | 6 | 5.6% |
| Visual & Performing Arts | 10 | 9.3% |
| Communications | 0 | 0.0% |
| Arts & Humanities | 6 | 5.6% |
| Total | 108 | 100.0% |
Transportation & Commute in Newell
Vehicle Availability by Sex in Newell
The most prevalent vehicle ownership categories in Newell are males with 2 vehicles (120, accounting for 53.1%) and females with 2 vehicles (57, making up 68.2%).
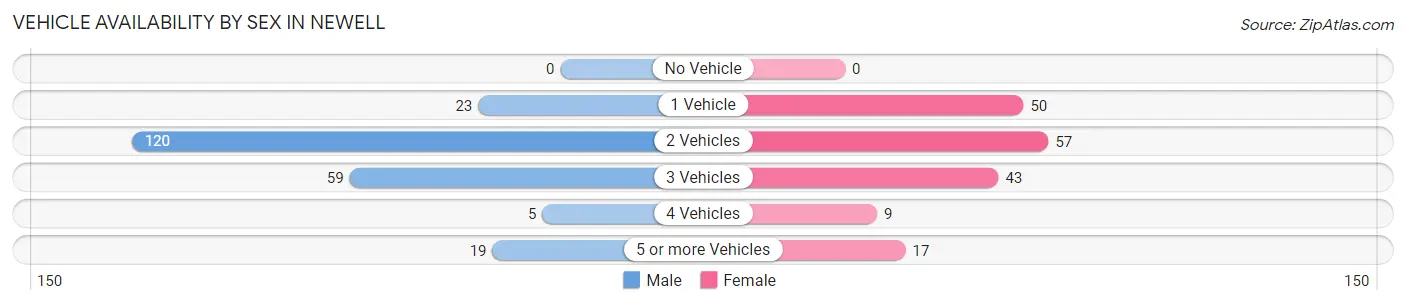
| Vehicles Available | Male | Female |
| No Vehicle | 0 (0.0%) | 0 (0.0%) |
| 1 Vehicle | 23 (10.2%) | 50 (28.4%) |
| 2 Vehicles | 120 (53.1%) | 57 (32.4%) |
| 3 Vehicles | 59 (26.1%) | 43 (24.4%) |
| 4 Vehicles | 5 (2.2%) | 9 (5.1%) |
| 5 or more Vehicles | 19 (8.4%) | 17 (9.7%) |
| Total | 226 (100.0%) | 176 (100.0%) |
Commute Time in Newell
The most frequently occuring commute durations in Newell are 20 to 24 minutes (104 commuters, 26.2%), less than 5 minutes (85 commuters, 21.4%), and 15 to 19 minutes (64 commuters, 16.1%).
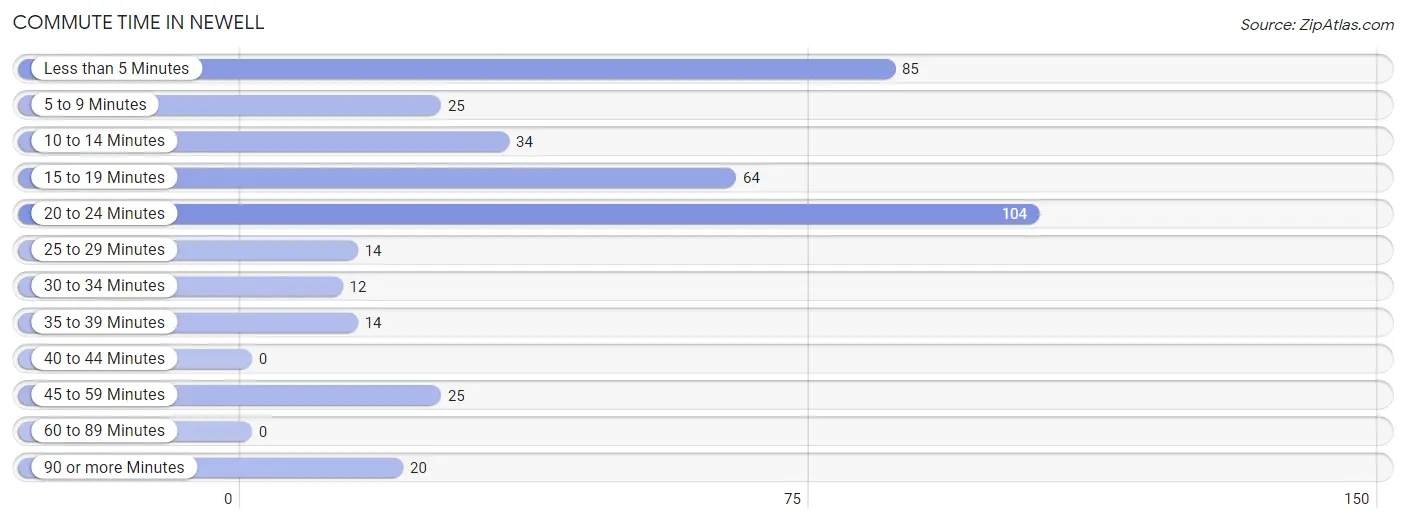
| Commute Time | # Commuters | % Commuters |
| Less than 5 Minutes | 85 | 21.4% |
| 5 to 9 Minutes | 25 | 6.3% |
| 10 to 14 Minutes | 34 | 8.6% |
| 15 to 19 Minutes | 64 | 16.1% |
| 20 to 24 Minutes | 104 | 26.2% |
| 25 to 29 Minutes | 14 | 3.5% |
| 30 to 34 Minutes | 12 | 3.0% |
| 35 to 39 Minutes | 14 | 3.5% |
| 40 to 44 Minutes | 0 | 0.0% |
| 45 to 59 Minutes | 25 | 6.3% |
| 60 to 89 Minutes | 0 | 0.0% |
| 90 or more Minutes | 20 | 5.0% |
Commute Time by Sex in Newell
The most common commute times in Newell are 20 to 24 minutes (54 commuters, 23.9%) for males and 20 to 24 minutes (50 commuters, 29.2%) for females.
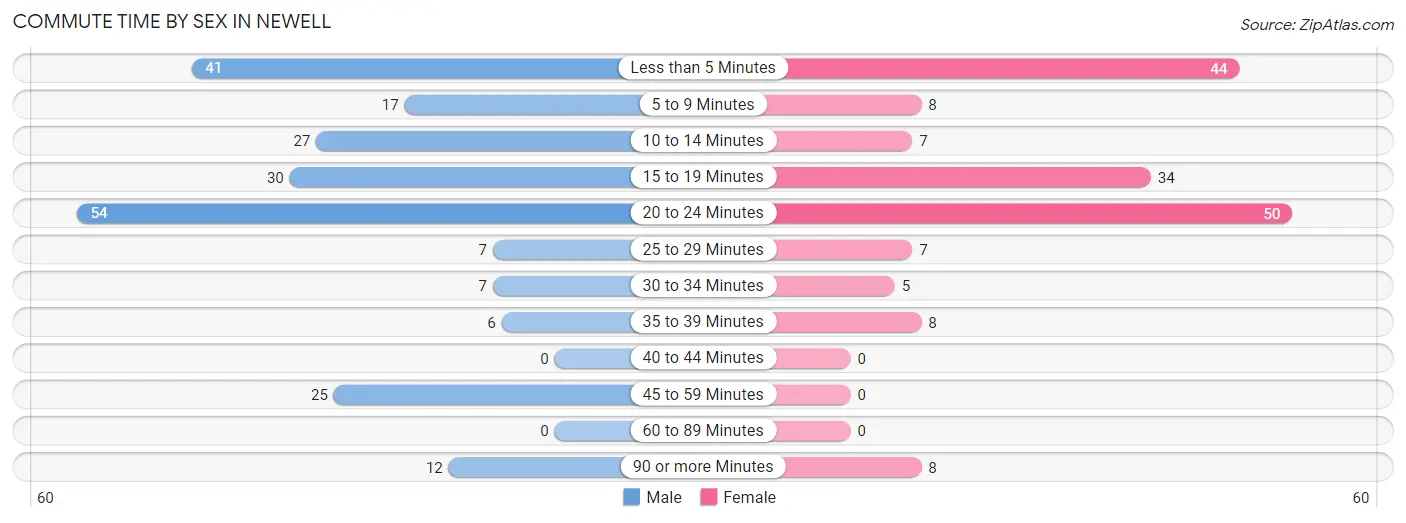
| Commute Time | Male | Female |
| Less than 5 Minutes | 41 (18.1%) | 44 (25.7%) |
| 5 to 9 Minutes | 17 (7.5%) | 8 (4.7%) |
| 10 to 14 Minutes | 27 (11.9%) | 7 (4.1%) |
| 15 to 19 Minutes | 30 (13.3%) | 34 (19.9%) |
| 20 to 24 Minutes | 54 (23.9%) | 50 (29.2%) |
| 25 to 29 Minutes | 7 (3.1%) | 7 (4.1%) |
| 30 to 34 Minutes | 7 (3.1%) | 5 (2.9%) |
| 35 to 39 Minutes | 6 (2.6%) | 8 (4.7%) |
| 40 to 44 Minutes | 0 (0.0%) | 0 (0.0%) |
| 45 to 59 Minutes | 25 (11.1%) | 0 (0.0%) |
| 60 to 89 Minutes | 0 (0.0%) | 0 (0.0%) |
| 90 or more Minutes | 12 (5.3%) | 8 (4.7%) |
Time of Departure to Work by Sex in Newell
The most frequent times of departure to work in Newell are 7:30 AM to 7:59 AM (38, 16.8%) for males and 12:00 PM to 3:59 PM (37, 21.6%) for females.
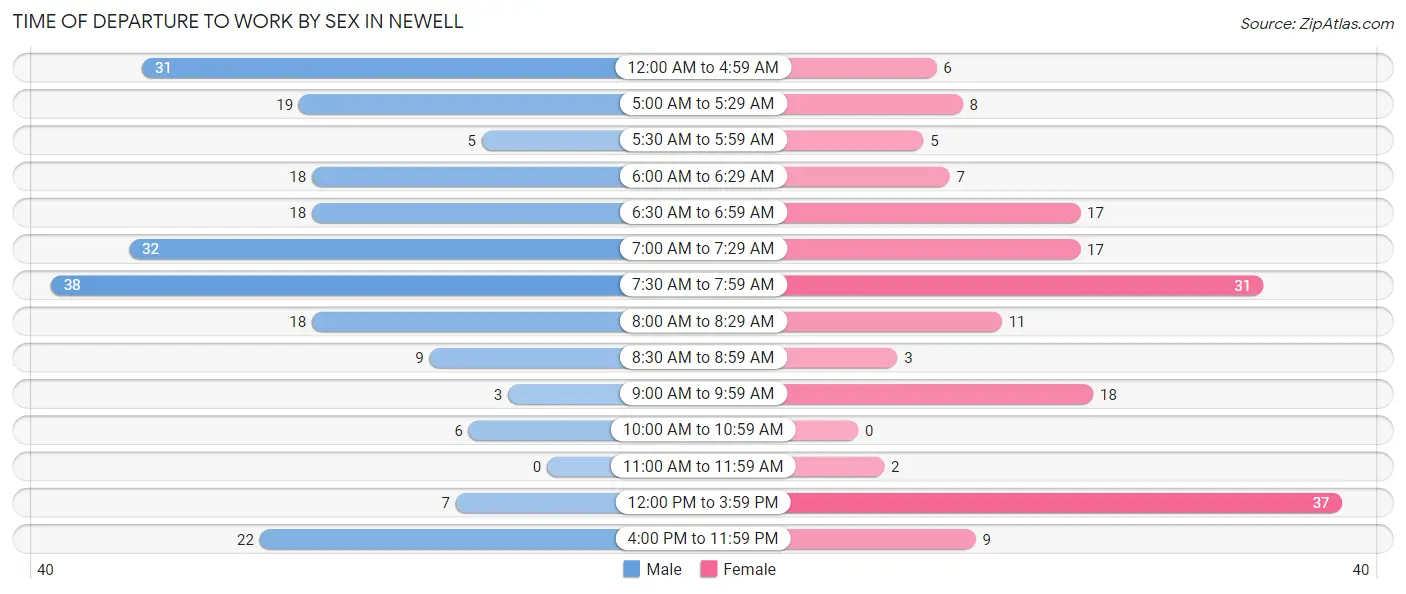
| Time of Departure | Male | Female |
| 12:00 AM to 4:59 AM | 31 (13.7%) | 6 (3.5%) |
| 5:00 AM to 5:29 AM | 19 (8.4%) | 8 (4.7%) |
| 5:30 AM to 5:59 AM | 5 (2.2%) | 5 (2.9%) |
| 6:00 AM to 6:29 AM | 18 (8.0%) | 7 (4.1%) |
| 6:30 AM to 6:59 AM | 18 (8.0%) | 17 (9.9%) |
| 7:00 AM to 7:29 AM | 32 (14.2%) | 17 (9.9%) |
| 7:30 AM to 7:59 AM | 38 (16.8%) | 31 (18.1%) |
| 8:00 AM to 8:29 AM | 18 (8.0%) | 11 (6.4%) |
| 8:30 AM to 8:59 AM | 9 (4.0%) | 3 (1.8%) |
| 9:00 AM to 9:59 AM | 3 (1.3%) | 18 (10.5%) |
| 10:00 AM to 10:59 AM | 6 (2.6%) | 0 (0.0%) |
| 11:00 AM to 11:59 AM | 0 (0.0%) | 2 (1.2%) |
| 12:00 PM to 3:59 PM | 7 (3.1%) | 37 (21.6%) |
| 4:00 PM to 11:59 PM | 22 (9.7%) | 9 (5.3%) |
| Total | 226 (100.0%) | 171 (100.0%) |
Housing Occupancy in Newell
Occupancy by Ownership in Newell
Of the total 310 dwellings in Newell, owner-occupied units account for 246 (79.3%), while renter-occupied units make up 64 (20.6%).
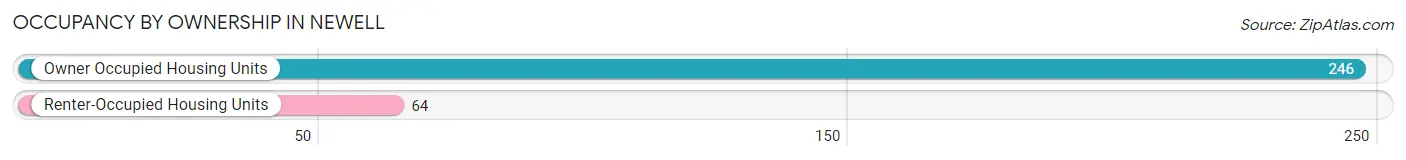
| Occupancy | # Housing Units | % Housing Units |
| Owner Occupied Housing Units | 246 | 79.3% |
| Renter-Occupied Housing Units | 64 | 20.6% |
| Total Occupied Housing Units | 310 | 100.0% |
Occupancy by Household Size in Newell
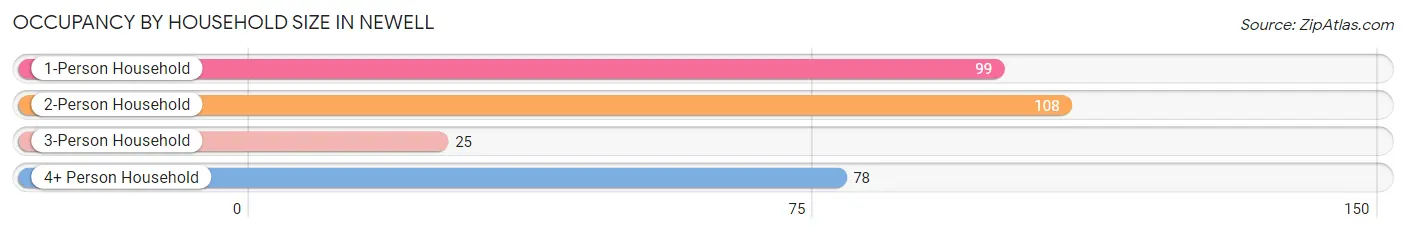
| Household Size | # Housing Units | % Housing Units |
| 1-Person Household | 99 | 31.9% |
| 2-Person Household | 108 | 34.8% |
| 3-Person Household | 25 | 8.1% |
| 4+ Person Household | 78 | 25.2% |
| Total Housing Units | 310 | 100.0% |
Occupancy by Ownership by Household Size in Newell
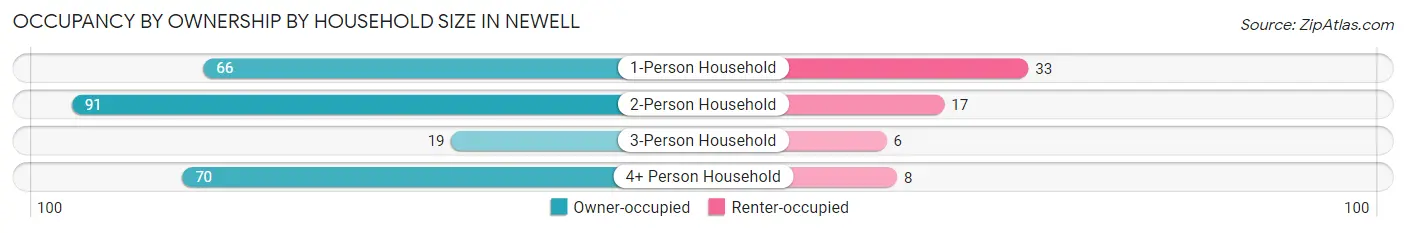
| Household Size | Owner-occupied | Renter-occupied |
| 1-Person Household | 66 (66.7%) | 33 (33.3%) |
| 2-Person Household | 91 (84.3%) | 17 (15.7%) |
| 3-Person Household | 19 (76.0%) | 6 (24.0%) |
| 4+ Person Household | 70 (89.7%) | 8 (10.3%) |
| Total Housing Units | 246 (79.3%) | 64 (20.6%) |
Occupancy by Educational Attainment in Newell
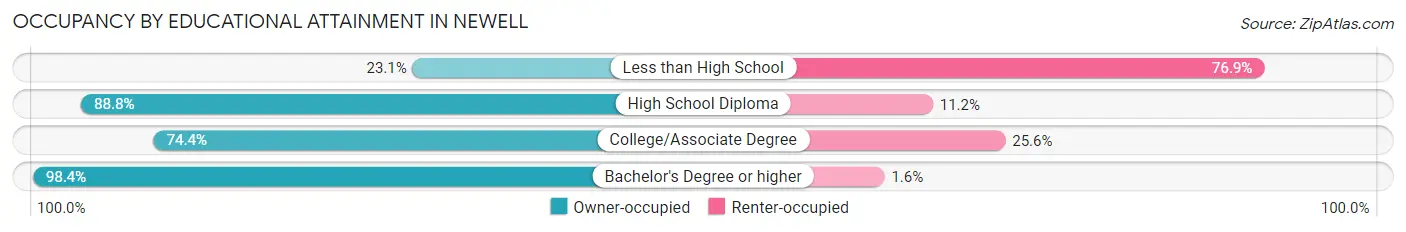
| Household Size | Owner-occupied | Renter-occupied |
| Less than High School | 6 (23.1%) | 20 (76.9%) |
| High School Diploma | 87 (88.8%) | 11 (11.2%) |
| College/Associate Degree | 93 (74.4%) | 32 (25.6%) |
| Bachelor's Degree or higher | 60 (98.4%) | 1 (1.6%) |
Occupancy by Age of Householder in Newell
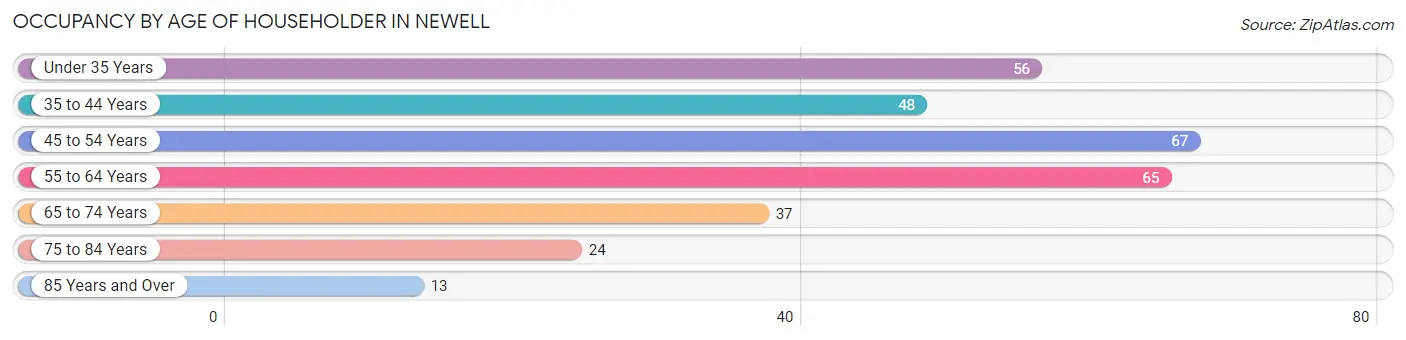
| Age Bracket | # Households | % Households |
| Under 35 Years | 56 | 18.1% |
| 35 to 44 Years | 48 | 15.5% |
| 45 to 54 Years | 67 | 21.6% |
| 55 to 64 Years | 65 | 21.0% |
| 65 to 74 Years | 37 | 11.9% |
| 75 to 84 Years | 24 | 7.7% |
| 85 Years and Over | 13 | 4.2% |
| Total | 310 | 100.0% |
Housing Finances in Newell
Median Income by Occupancy in Newell
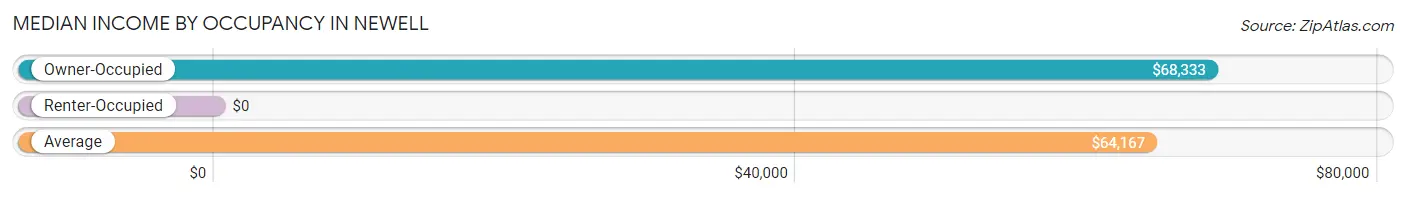
| Occupancy Type | # Households | Median Income |
| Owner-Occupied | 246 (79.3%) | $68,333 |
| Renter-Occupied | 64 (20.6%) | $0 |
| Average | 310 (100.0%) | $64,167 |
Occupancy by Householder Income Bracket in Newell
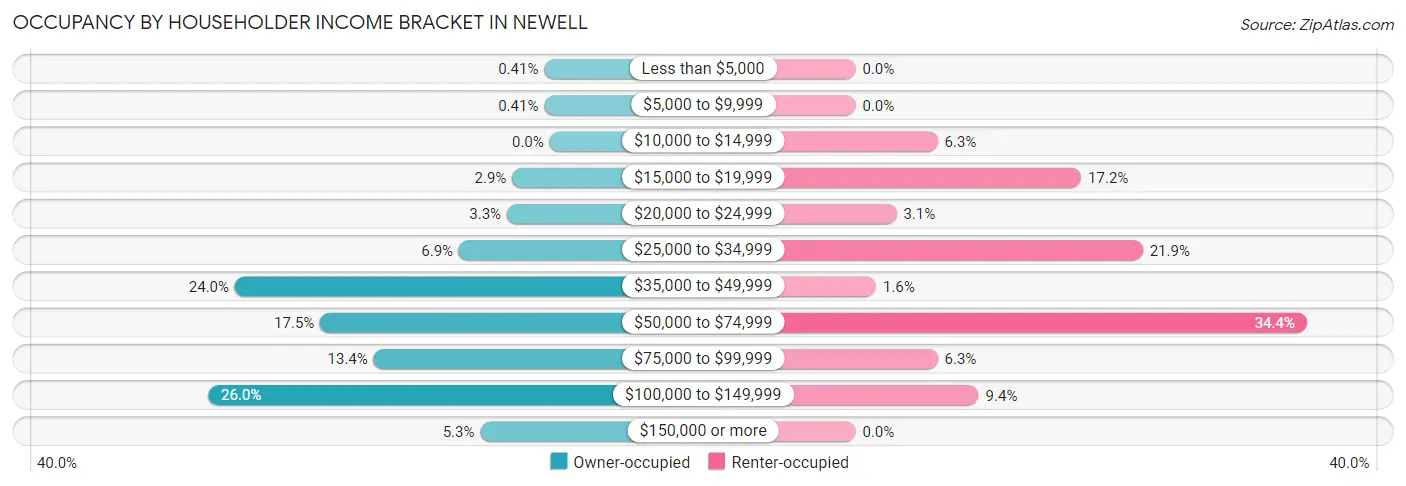
| Income Bracket | Owner-occupied | Renter-occupied |
| Less than $5,000 | 1 (0.4%) | 0 (0.0%) |
| $5,000 to $9,999 | 1 (0.4%) | 0 (0.0%) |
| $10,000 to $14,999 | 0 (0.0%) | 4 (6.2%) |
| $15,000 to $19,999 | 7 (2.9%) | 11 (17.2%) |
| $20,000 to $24,999 | 8 (3.3%) | 2 (3.1%) |
| $25,000 to $34,999 | 17 (6.9%) | 14 (21.9%) |
| $35,000 to $49,999 | 59 (24.0%) | 1 (1.6%) |
| $50,000 to $74,999 | 43 (17.5%) | 22 (34.4%) |
| $75,000 to $99,999 | 33 (13.4%) | 4 (6.2%) |
| $100,000 to $149,999 | 64 (26.0%) | 6 (9.4%) |
| $150,000 or more | 13 (5.3%) | 0 (0.0%) |
| Total | 246 (100.0%) | 64 (100.0%) |
Monthly Housing Cost Tiers in Newell
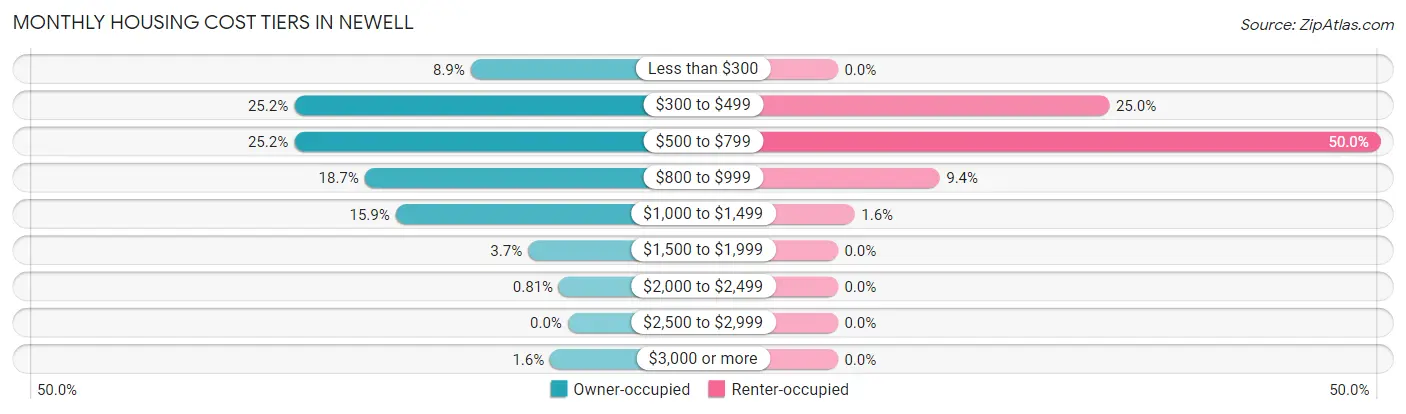
| Monthly Cost | Owner-occupied | Renter-occupied |
| Less than $300 | 22 (8.9%) | 0 (0.0%) |
| $300 to $499 | 62 (25.2%) | 16 (25.0%) |
| $500 to $799 | 62 (25.2%) | 32 (50.0%) |
| $800 to $999 | 46 (18.7%) | 6 (9.4%) |
| $1,000 to $1,499 | 39 (15.9%) | 1 (1.6%) |
| $1,500 to $1,999 | 9 (3.7%) | 0 (0.0%) |
| $2,000 to $2,499 | 2 (0.8%) | 0 (0.0%) |
| $2,500 to $2,999 | 0 (0.0%) | 0 (0.0%) |
| $3,000 or more | 4 (1.6%) | 0 (0.0%) |
| Total | 246 (100.0%) | 64 (100.0%) |
Physical Housing Characteristics in Newell
Housing Structures in Newell
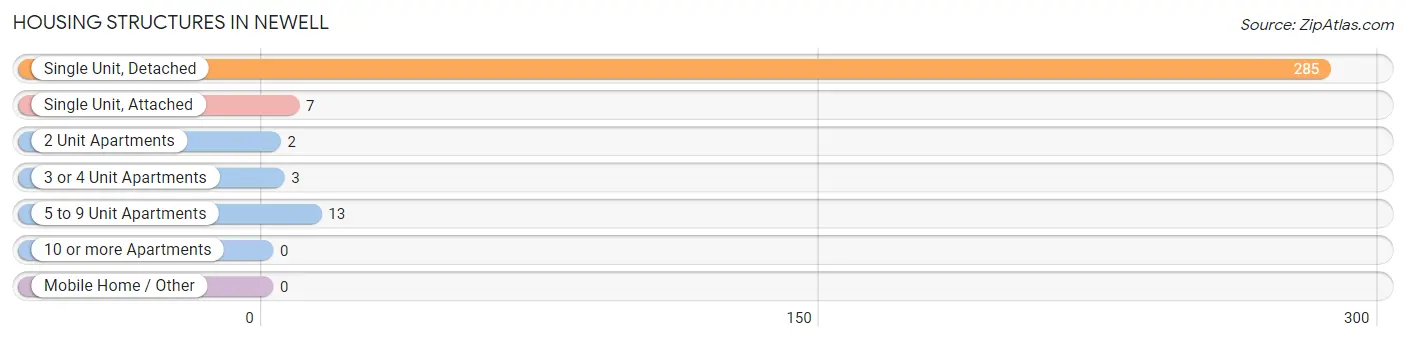
| Structure Type | # Housing Units | % Housing Units |
| Single Unit, Detached | 285 | 91.9% |
| Single Unit, Attached | 7 | 2.3% |
| 2 Unit Apartments | 2 | 0.6% |
| 3 or 4 Unit Apartments | 3 | 1.0% |
| 5 to 9 Unit Apartments | 13 | 4.2% |
| 10 or more Apartments | 0 | 0.0% |
| Mobile Home / Other | 0 | 0.0% |
| Total | 310 | 100.0% |
Housing Structures by Occupancy in Newell
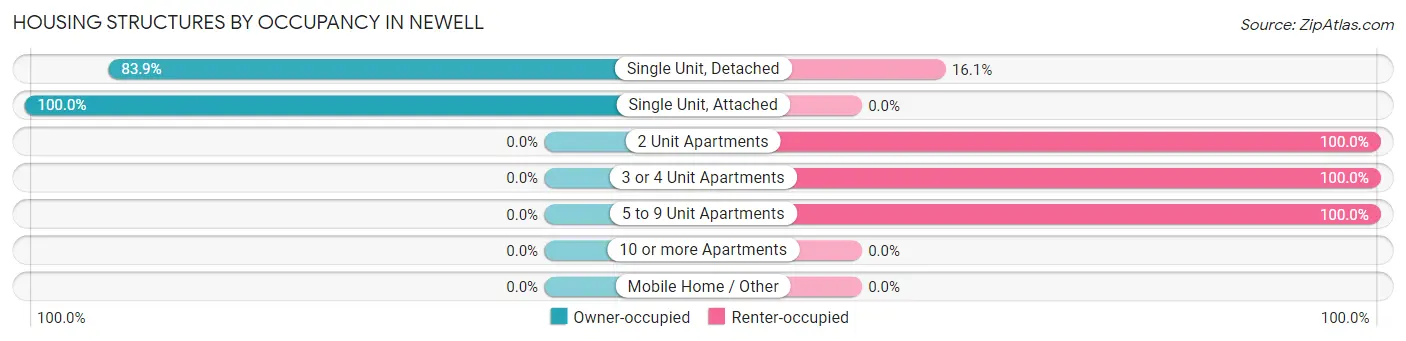
| Structure Type | Owner-occupied | Renter-occupied |
| Single Unit, Detached | 239 (83.9%) | 46 (16.1%) |
| Single Unit, Attached | 7 (100.0%) | 0 (0.0%) |
| 2 Unit Apartments | 0 (0.0%) | 2 (100.0%) |
| 3 or 4 Unit Apartments | 0 (0.0%) | 3 (100.0%) |
| 5 to 9 Unit Apartments | 0 (0.0%) | 13 (100.0%) |
| 10 or more Apartments | 0 (0.0%) | 0 (0.0%) |
| Mobile Home / Other | 0 (0.0%) | 0 (0.0%) |
| Total | 246 (79.3%) | 64 (20.6%) |
Housing Structures by Number of Rooms in Newell
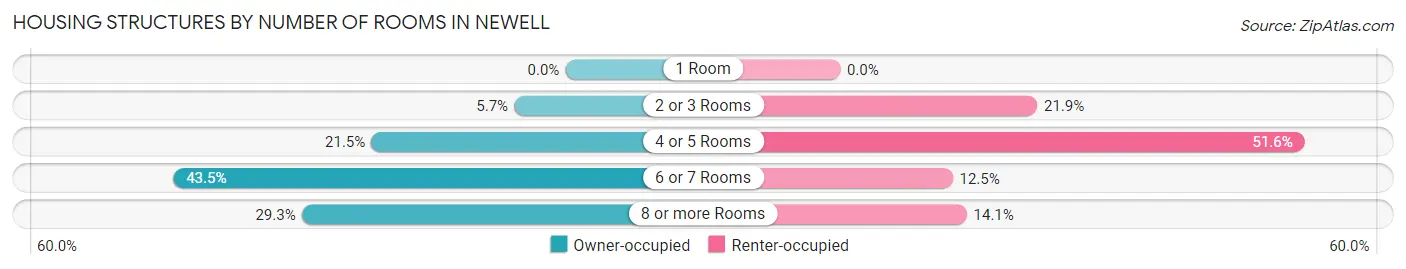
| Number of Rooms | Owner-occupied | Renter-occupied |
| 1 Room | 0 (0.0%) | 0 (0.0%) |
| 2 or 3 Rooms | 14 (5.7%) | 14 (21.9%) |
| 4 or 5 Rooms | 53 (21.5%) | 33 (51.6%) |
| 6 or 7 Rooms | 107 (43.5%) | 8 (12.5%) |
| 8 or more Rooms | 72 (29.3%) | 9 (14.1%) |
| Total | 246 (100.0%) | 64 (100.0%) |
Housing Structure by Heating Type in Newell
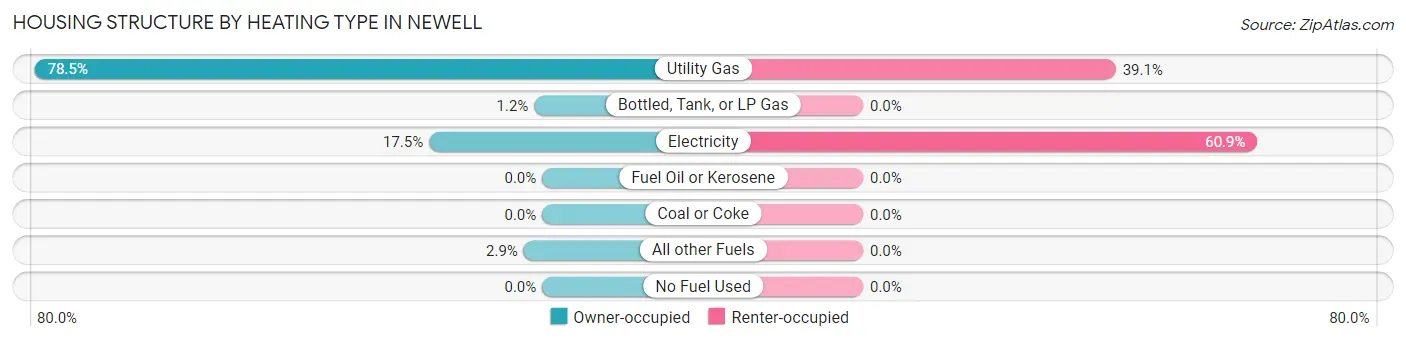
| Heating Type | Owner-occupied | Renter-occupied |
| Utility Gas | 193 (78.5%) | 25 (39.1%) |
| Bottled, Tank, or LP Gas | 3 (1.2%) | 0 (0.0%) |
| Electricity | 43 (17.5%) | 39 (60.9%) |
| Fuel Oil or Kerosene | 0 (0.0%) | 0 (0.0%) |
| Coal or Coke | 0 (0.0%) | 0 (0.0%) |
| All other Fuels | 7 (2.9%) | 0 (0.0%) |
| No Fuel Used | 0 (0.0%) | 0 (0.0%) |
| Total | 246 (100.0%) | 64 (100.0%) |
Household Vehicle Usage in Newell
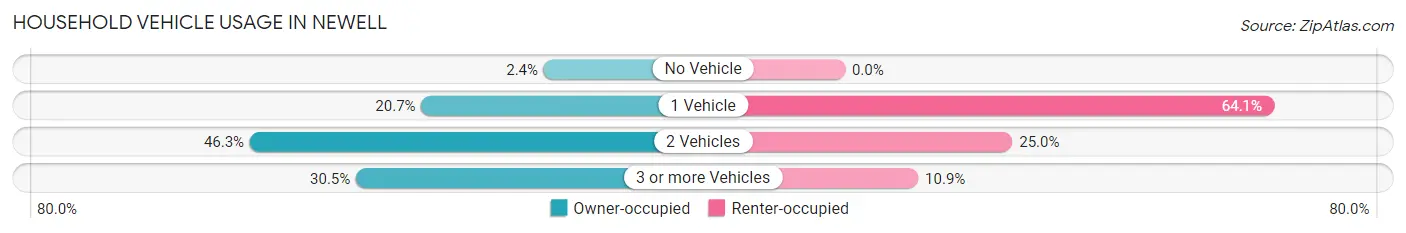
| Vehicles per Household | Owner-occupied | Renter-occupied |
| No Vehicle | 6 (2.4%) | 0 (0.0%) |
| 1 Vehicle | 51 (20.7%) | 41 (64.1%) |
| 2 Vehicles | 114 (46.3%) | 16 (25.0%) |
| 3 or more Vehicles | 75 (30.5%) | 7 (10.9%) |
| Total | 246 (100.0%) | 64 (100.0%) |
Real Estate & Mortgages in Newell
Real Estate and Mortgage Overview in Newell
| Characteristic | Without Mortgage | With Mortgage |
| Housing Units | 114 | 132 |
| Median Property Value | $104,800 | $98,600 |
| Median Household Income | $48,750 | $7 |
| Monthly Housing Costs | $413 | $2 |
| Real Estate Taxes | $1,330 | $1 |
Property Value by Mortgage Status in Newell
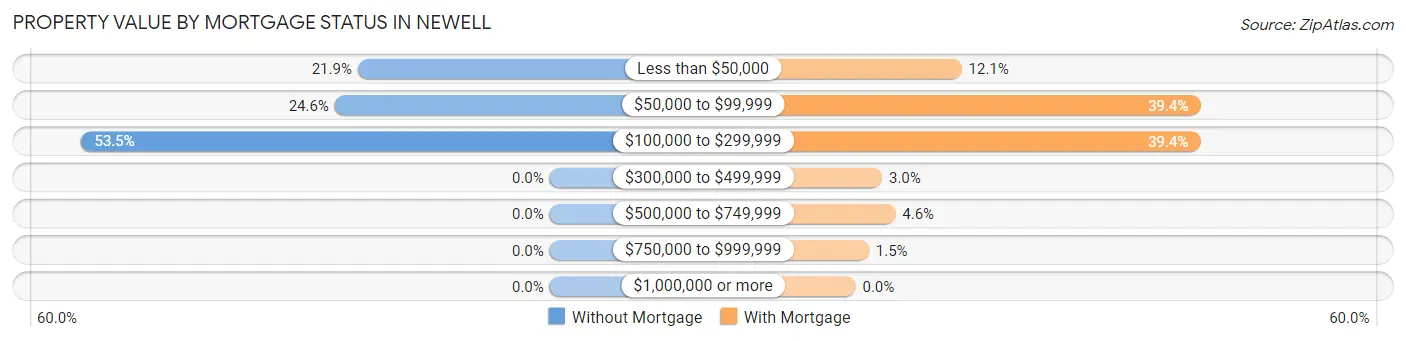
| Property Value | Without Mortgage | With Mortgage |
| Less than $50,000 | 25 (21.9%) | 16 (12.1%) |
| $50,000 to $99,999 | 28 (24.6%) | 52 (39.4%) |
| $100,000 to $299,999 | 61 (53.5%) | 52 (39.4%) |
| $300,000 to $499,999 | 0 (0.0%) | 4 (3.0%) |
| $500,000 to $749,999 | 0 (0.0%) | 6 (4.5%) |
| $750,000 to $999,999 | 0 (0.0%) | 2 (1.5%) |
| $1,000,000 or more | 0 (0.0%) | 0 (0.0%) |
| Total | 114 (100.0%) | 132 (100.0%) |
Household Income by Mortgage Status in Newell
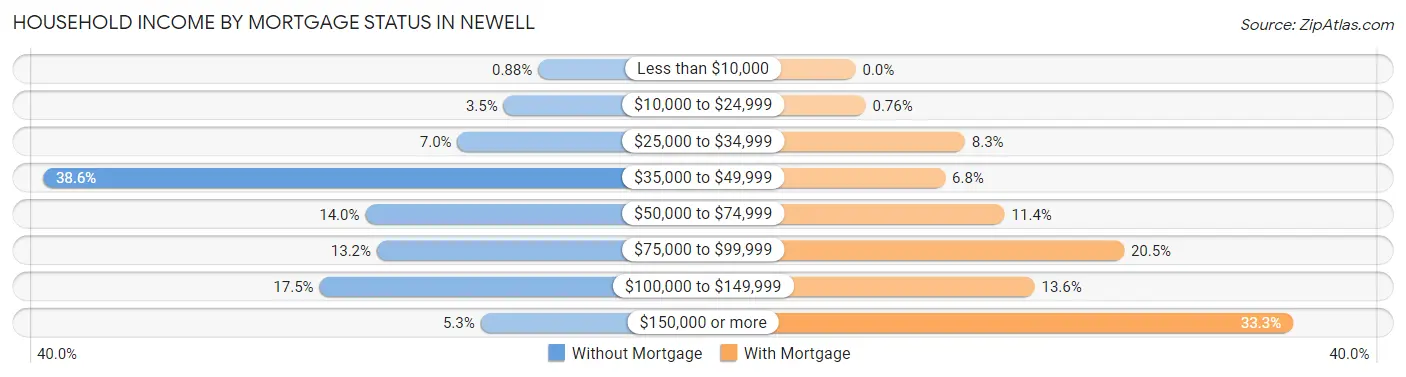
| Household Income | Without Mortgage | With Mortgage |
| Less than $10,000 | 1 (0.9%) | 0 (0.0%) |
| $10,000 to $24,999 | 4 (3.5%) | 1 (0.8%) |
| $25,000 to $34,999 | 8 (7.0%) | 11 (8.3%) |
| $35,000 to $49,999 | 44 (38.6%) | 9 (6.8%) |
| $50,000 to $74,999 | 16 (14.0%) | 15 (11.4%) |
| $75,000 to $99,999 | 15 (13.2%) | 27 (20.4%) |
| $100,000 to $149,999 | 20 (17.5%) | 18 (13.6%) |
| $150,000 or more | 6 (5.3%) | 44 (33.3%) |
| Total | 114 (100.0%) | 132 (100.0%) |
Property Value to Household Income Ratio in Newell

| Value-to-Income Ratio | Without Mortgage | With Mortgage |
| Less than 2.0x | 71 (62.3%) | 81,667 (61,868.9%) |
| 2.0x to 2.9x | 24 (21.0%) | 95 (72.0%) |
| 3.0x to 3.9x | 11 (9.7%) | 16 (12.1%) |
| 4.0x or more | 8 (7.0%) | 8 (6.1%) |
| Total | 114 (100.0%) | 132 (100.0%) |
Real Estate Taxes by Mortgage Status in Newell
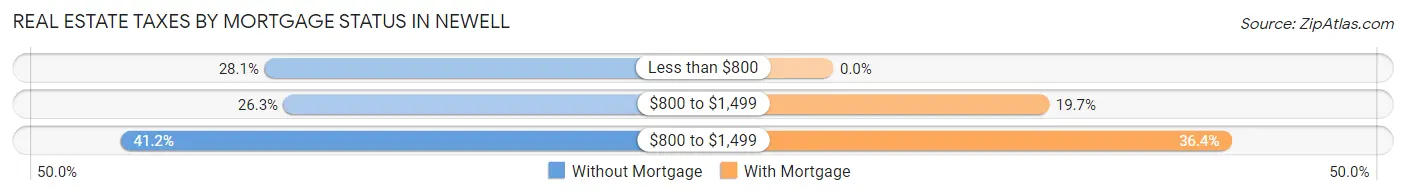
| Property Taxes | Without Mortgage | With Mortgage |
| Less than $800 | 32 (28.1%) | 0 (0.0%) |
| $800 to $1,499 | 30 (26.3%) | 26 (19.7%) |
| $800 to $1,499 | 47 (41.2%) | 48 (36.4%) |
| Total | 114 (100.0%) | 132 (100.0%) |
Health & Disability in Newell
Health Insurance Coverage by Age in Newell
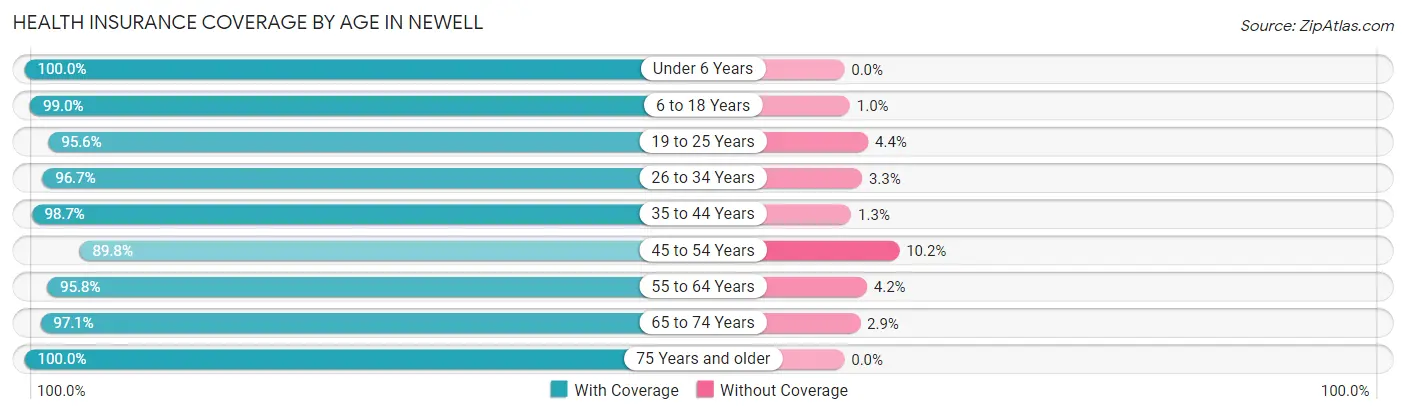
| Age Bracket | With Coverage | Without Coverage |
| Under 6 Years | 117 (100.0%) | 0 (0.0%) |
| 6 to 18 Years | 191 (99.0%) | 2 (1.0%) |
| 19 to 25 Years | 43 (95.6%) | 2 (4.4%) |
| 26 to 34 Years | 88 (96.7%) | 3 (3.3%) |
| 35 to 44 Years | 77 (98.7%) | 1 (1.3%) |
| 45 to 54 Years | 114 (89.8%) | 13 (10.2%) |
| 55 to 64 Years | 91 (95.8%) | 4 (4.2%) |
| 65 to 74 Years | 66 (97.1%) | 2 (2.9%) |
| 75 Years and older | 48 (100.0%) | 0 (0.0%) |
| Total | 835 (96.9%) | 27 (3.1%) |
Health Insurance Coverage by Citizenship Status in Newell
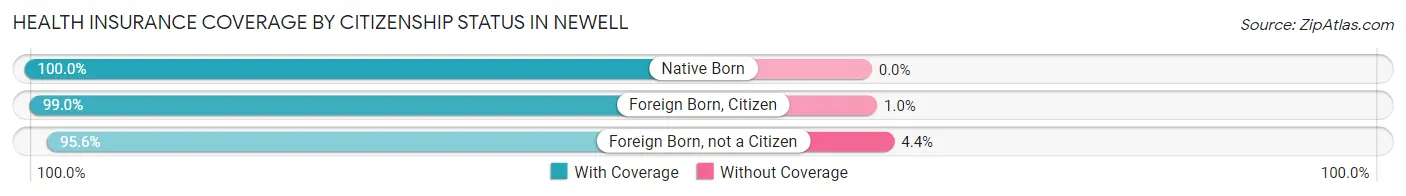
| Citizenship Status | With Coverage | Without Coverage |
| Native Born | 117 (100.0%) | 0 (0.0%) |
| Foreign Born, Citizen | 191 (99.0%) | 2 (1.0%) |
| Foreign Born, not a Citizen | 43 (95.6%) | 2 (4.4%) |
Health Insurance Coverage by Household Income in Newell
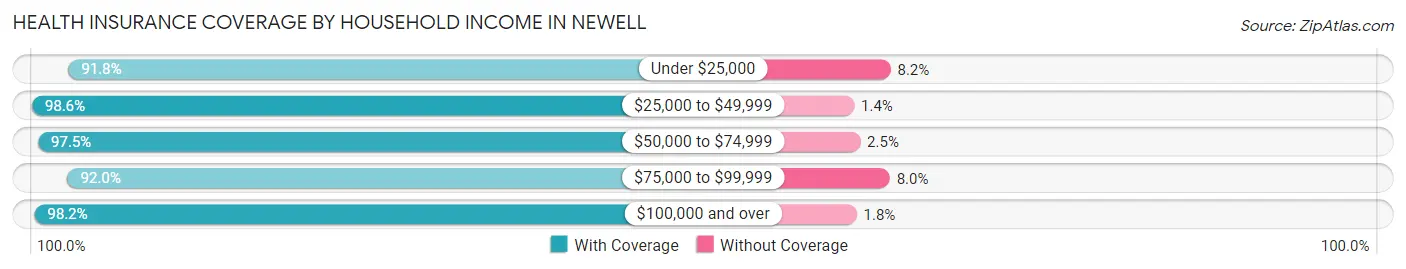
| Household Income | With Coverage | Without Coverage |
| Under $25,000 | 56 (91.8%) | 5 (8.2%) |
| $25,000 to $49,999 | 144 (98.6%) | 2 (1.4%) |
| $50,000 to $74,999 | 156 (97.5%) | 4 (2.5%) |
| $75,000 to $99,999 | 103 (92.0%) | 9 (8.0%) |
| $100,000 and over | 376 (98.2%) | 7 (1.8%) |
Public vs Private Health Insurance Coverage by Age in Newell
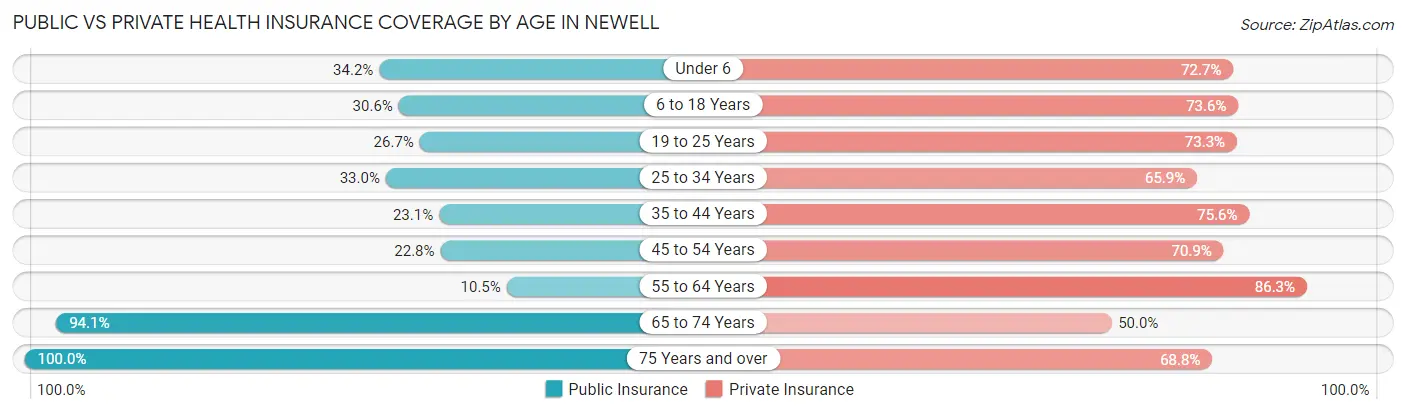
| Age Bracket | Public Insurance | Private Insurance |
| Under 6 | 40 (34.2%) | 85 (72.7%) |
| 6 to 18 Years | 59 (30.6%) | 142 (73.6%) |
| 19 to 25 Years | 12 (26.7%) | 33 (73.3%) |
| 25 to 34 Years | 30 (33.0%) | 60 (65.9%) |
| 35 to 44 Years | 18 (23.1%) | 59 (75.6%) |
| 45 to 54 Years | 29 (22.8%) | 90 (70.9%) |
| 55 to 64 Years | 10 (10.5%) | 82 (86.3%) |
| 65 to 74 Years | 64 (94.1%) | 34 (50.0%) |
| 75 Years and over | 48 (100.0%) | 33 (68.8%) |
| Total | 310 (36.0%) | 618 (71.7%) |
Disability Status by Sex by Age in Newell
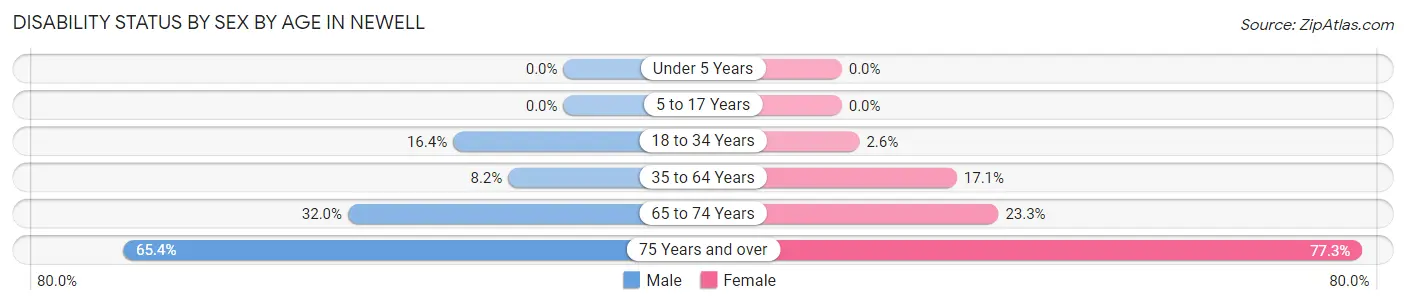
| Age Bracket | Male | Female |
| Under 5 Years | 0 (0.0%) | 0 (0.0%) |
| 5 to 17 Years | 0 (0.0%) | 0 (0.0%) |
| 18 to 34 Years | 10 (16.4%) | 2 (2.6%) |
| 35 to 64 Years | 15 (8.2%) | 20 (17.1%) |
| 65 to 74 Years | 8 (32.0%) | 10 (23.3%) |
| 75 Years and over | 17 (65.4%) | 17 (77.3%) |
Disability Class by Sex by Age in Newell
Disability Class: Hearing Difficulty
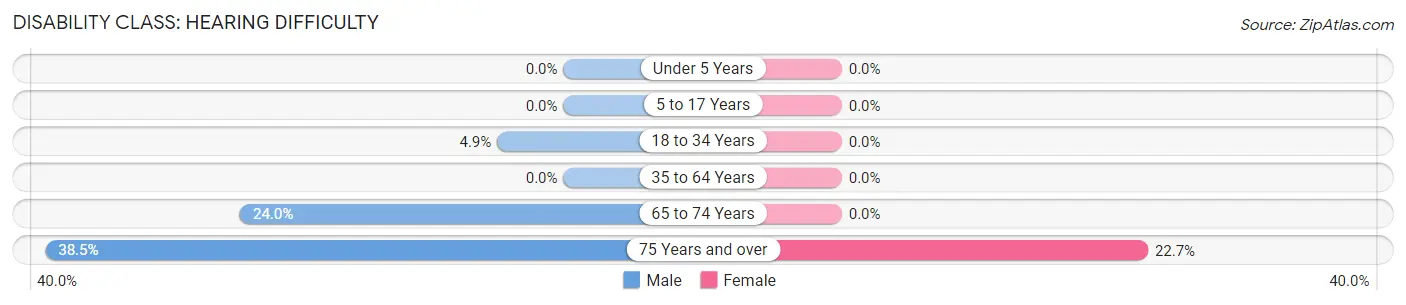
| Age Bracket | Male | Female |
| Under 5 Years | 0 (0.0%) | 0 (0.0%) |
| 5 to 17 Years | 0 (0.0%) | 0 (0.0%) |
| 18 to 34 Years | 3 (4.9%) | 0 (0.0%) |
| 35 to 64 Years | 0 (0.0%) | 0 (0.0%) |
| 65 to 74 Years | 6 (24.0%) | 0 (0.0%) |
| 75 Years and over | 10 (38.5%) | 5 (22.7%) |
Disability Class: Vision Difficulty
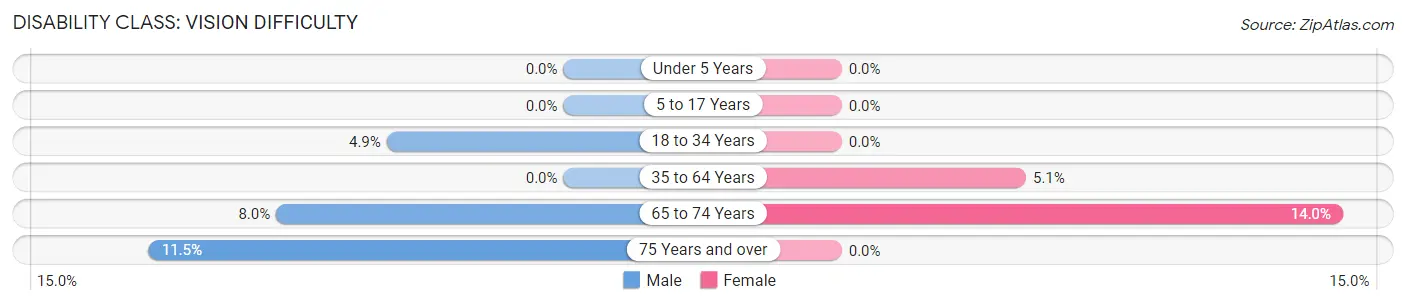
| Age Bracket | Male | Female |
| Under 5 Years | 0 (0.0%) | 0 (0.0%) |
| 5 to 17 Years | 0 (0.0%) | 0 (0.0%) |
| 18 to 34 Years | 3 (4.9%) | 0 (0.0%) |
| 35 to 64 Years | 0 (0.0%) | 6 (5.1%) |
| 65 to 74 Years | 2 (8.0%) | 6 (14.0%) |
| 75 Years and over | 3 (11.5%) | 0 (0.0%) |
Disability Class: Cognitive Difficulty
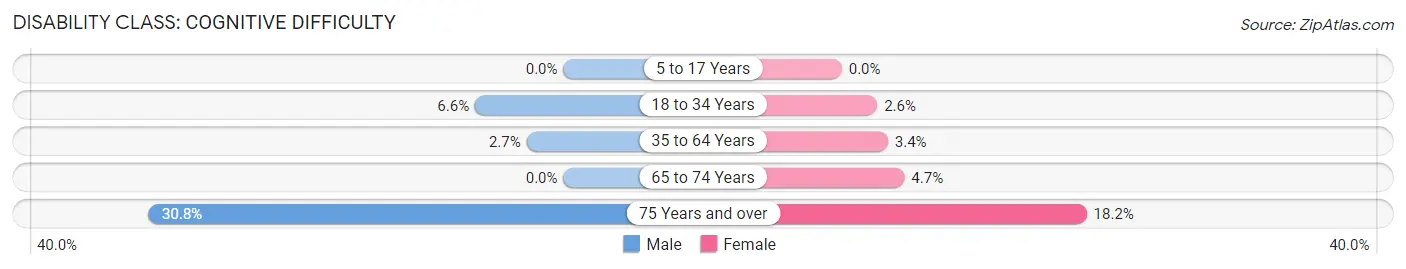
| Age Bracket | Male | Female |
| 5 to 17 Years | 0 (0.0%) | 0 (0.0%) |
| 18 to 34 Years | 4 (6.6%) | 2 (2.6%) |
| 35 to 64 Years | 5 (2.7%) | 4 (3.4%) |
| 65 to 74 Years | 0 (0.0%) | 2 (4.6%) |
| 75 Years and over | 8 (30.8%) | 4 (18.2%) |
Disability Class: Ambulatory Difficulty
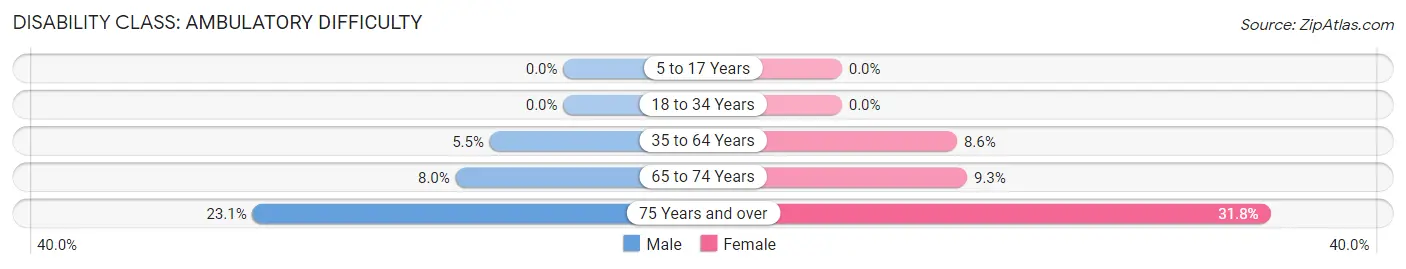
| Age Bracket | Male | Female |
| 5 to 17 Years | 0 (0.0%) | 0 (0.0%) |
| 18 to 34 Years | 0 (0.0%) | 0 (0.0%) |
| 35 to 64 Years | 10 (5.5%) | 10 (8.6%) |
| 65 to 74 Years | 2 (8.0%) | 4 (9.3%) |
| 75 Years and over | 6 (23.1%) | 7 (31.8%) |
Disability Class: Self-Care Difficulty
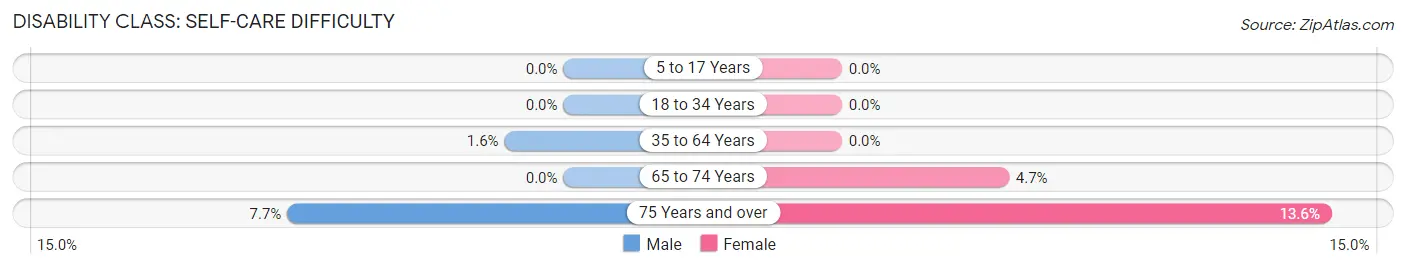
| Age Bracket | Male | Female |
| 5 to 17 Years | 0 (0.0%) | 0 (0.0%) |
| 18 to 34 Years | 0 (0.0%) | 0 (0.0%) |
| 35 to 64 Years | 3 (1.6%) | 0 (0.0%) |
| 65 to 74 Years | 0 (0.0%) | 2 (4.6%) |
| 75 Years and over | 2 (7.7%) | 3 (13.6%) |
Technology Access in Newell
Computing Device Access in Newell
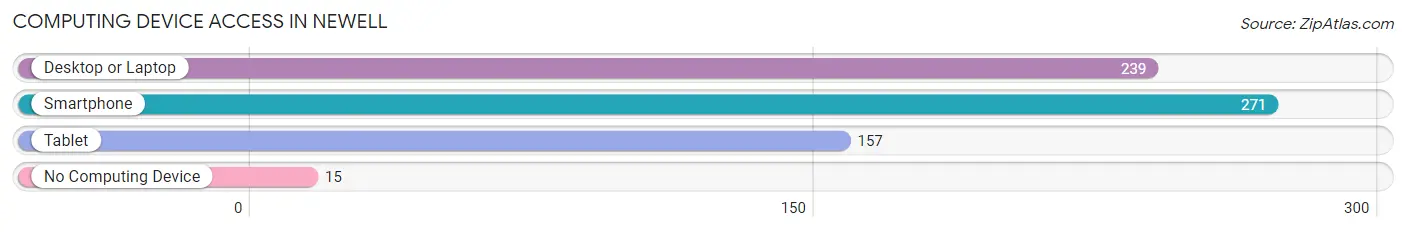
| Device Type | # Households | % Households |
| Desktop or Laptop | 239 | 77.1% |
| Smartphone | 271 | 87.4% |
| Tablet | 157 | 50.6% |
| No Computing Device | 15 | 4.8% |
| Total | 310 | 100.0% |
Internet Access in Newell
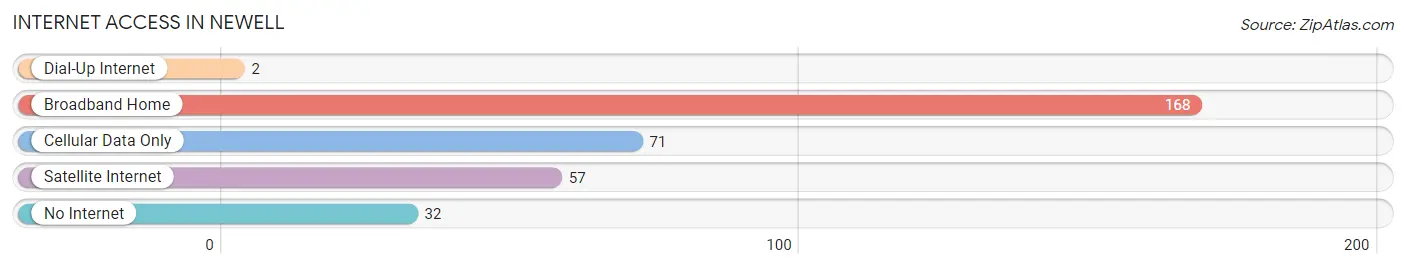
| Internet Type | # Households | % Households |
| Dial-Up Internet | 2 | 0.6% |
| Broadband Home | 168 | 54.2% |
| Cellular Data Only | 71 | 22.9% |
| Satellite Internet | 57 | 18.4% |
| No Internet | 32 | 10.3% |
| Total | 310 | 100.0% |
Newell Summary
Newell is a small city located in Buena Vista County, Iowa. It is situated on the banks of the Little Sioux River, and is part of the Storm Lake Metropolitan Statistical Area. The city has a population of 1,845 people, according to the 2010 census.
History
Newell was founded in 1881 by a group of settlers from Newell, Wisconsin. The city was named after the Wisconsin town, and was incorporated in 1883. The city was originally a farming community, and the main crops grown were corn, oats, and hay. In the early 1900s, the city began to grow and develop, and the first bank was established in 1906.
In the 1920s, the city experienced a period of growth and development, and the first school was built in 1923. The city also saw the construction of a new post office, a library, and a hospital. The city continued to grow throughout the 20th century, and in the 1950s, the city was connected to the rest of the state by the construction of a new highway.
Geography
Newell is located in Buena Vista County, Iowa, and is situated on the banks of the Little Sioux River. The city has a total area of 1.2 square miles, all of which is land. The city is located in the Central Plains region of the state, and is part of the Storm Lake Metropolitan Statistical Area.
The city has a humid continental climate, with hot summers and cold winters. The average temperature in the summer is around 75 degrees Fahrenheit, and the average temperature in the winter is around 25 degrees Fahrenheit. The city receives an average of 33 inches of precipitation per year.
Economy
The economy of Newell is largely based on agriculture and manufacturing. The city is home to several large agricultural companies, including Cargill, Inc., and Tyson Foods. The city also has several manufacturing companies, including a plastics manufacturer and a metal fabrication company.
The city also has a thriving retail sector, with several stores and restaurants located in the downtown area. The city is also home to several small businesses, including a bakery, a florist, and a furniture store.
Demographics
According to the 2010 census, the population of Newell was 1,845 people. The racial makeup of the city was 95.3% White, 0.7% African American, 0.3% Native American, 0.7% Asian, 0.1% Pacific Islander, and 2.1% from other races. The median household income in the city was $41,944, and the median family income was $50,938.
The city has a large Hispanic population, with 24.3% of the population being of Hispanic or Latino origin. The city also has a large foreign-born population, with 11.3% of the population being foreign-born. The city has a low unemployment rate, with only 4.2% of the population being unemployed.
Newell is a small city with a rich history and a diverse population. The city has a strong agricultural and manufacturing base, and is home to several small businesses. The city has a low unemployment rate, and a median household income that is higher than the state average. The city is a great place to live and work, and is a great place to raise a family.
Common Questions
What is Per Capita Income in Newell?
Per Capita income in Newell is $26,203.
What is the Median Family Income in Newell?
Median Family Income in Newell is $83,472.
What is the Median Household income in Newell?
Median Household Income in Newell is $64,167.
What is Income or Wage Gap in Newell?
Income or Wage Gap in Newell is 31.8%.
Women in Newell earn 68.2 cents for every dollar earned by a man.
What is Inequality or Gini Index in Newell?
Inequality or Gini Index in Newell is 0.33.
What is the Total Population of Newell?
Total Population of Newell is 892.
What is the Total Male Population of Newell?
Total Male Population of Newell is 496.
What is the Total Female Population of Newell?
Total Female Population of Newell is 396.
What is the Ratio of Males per 100 Females in Newell?
There are 125.25 Males per 100 Females in Newell.
What is the Ratio of Females per 100 Males in Newell?
There are 79.84 Females per 100 Males in Newell.
What is the Median Population Age in Newell?
Median Population Age in Newell is 35.0 Years.
What is the Average Family Size in Newell
Average Family Size in Newell is 3.7 People.
What is the Average Household Size in Newell
Average Household Size in Newell is 2.8 People.
How Large is the Labor Force in Newell?
There are 433 People in the Labor Forcein in Newell.
What is the Percentage of People in the Labor Force in Newell?
70.2% of People are in the Labor Force in Newell.
What is the Unemployment Rate in Newell?
Unemployment Rate in Newell is 5.1%.