Lake Mills, IA Map & Demographics
Lake Mills Map
Lake Mills Overview
$32,892
PER CAPITA INCOME
$77,768
AVG FAMILY INCOME
$63,750
AVG HOUSEHOLD INCOME
27.0%
WAGE / INCOME GAP [ % ]
73.0¢/ $1
WAGE / INCOME GAP [ $ ]
$13,578
FAMILY INCOME DEFICIT
0.39
INEQUALITY / GINI INDEX
1,965
TOTAL POPULATION
879
MALE POPULATION
1,086
FEMALE POPULATION
80.94
MALES / 100 FEMALES
123.55
FEMALES / 100 MALES
47.0
MEDIAN AGE
2.7
AVG FAMILY SIZE
2.2
AVG HOUSEHOLD SIZE
1,060
LABOR FORCE [ PEOPLE ]
63.0%
PERCENT IN LABOR FORCE
2.8%
UNEMPLOYMENT RATE
Lake Mills Zip Codes
Lake Mills Area Codes
Income in Lake Mills
Income Overview in Lake Mills
Per Capita Income in Lake Mills is $32,892, while median incomes of families and households are $77,768 and $63,750 respectively.
| Characteristic | Number | Measure |
| Per Capita Income | 1,965 | $32,892 |
| Median Family Income | 541 | $77,768 |
| Mean Family Income | 541 | $86,208 |
| Median Household Income | 882 | $63,750 |
| Mean Household Income | 882 | $71,572 |
| Income Deficit | 541 | $13,578 |
| Wage / Income Gap (%) | 1,965 | 27.04% |
| Wage / Income Gap ($) | 1,965 | 72.96¢ per $1 |
| Gini / Inequality Index | 1,965 | 0.39 |
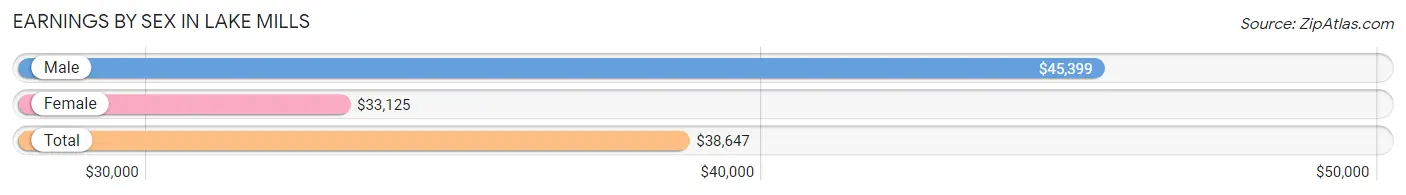
Earnings by Sex in Lake Mills
Average Earnings in Lake Mills are $38,647, $45,399 for men and $33,125 for women, a difference of 27.0%.
| Sex | Number | Average Earnings |
| Male | 501 (45.0%) | $45,399 |
| Female | 612 (55.0%) | $33,125 |
| Total | 1,113 (100.0%) | $38,647 |
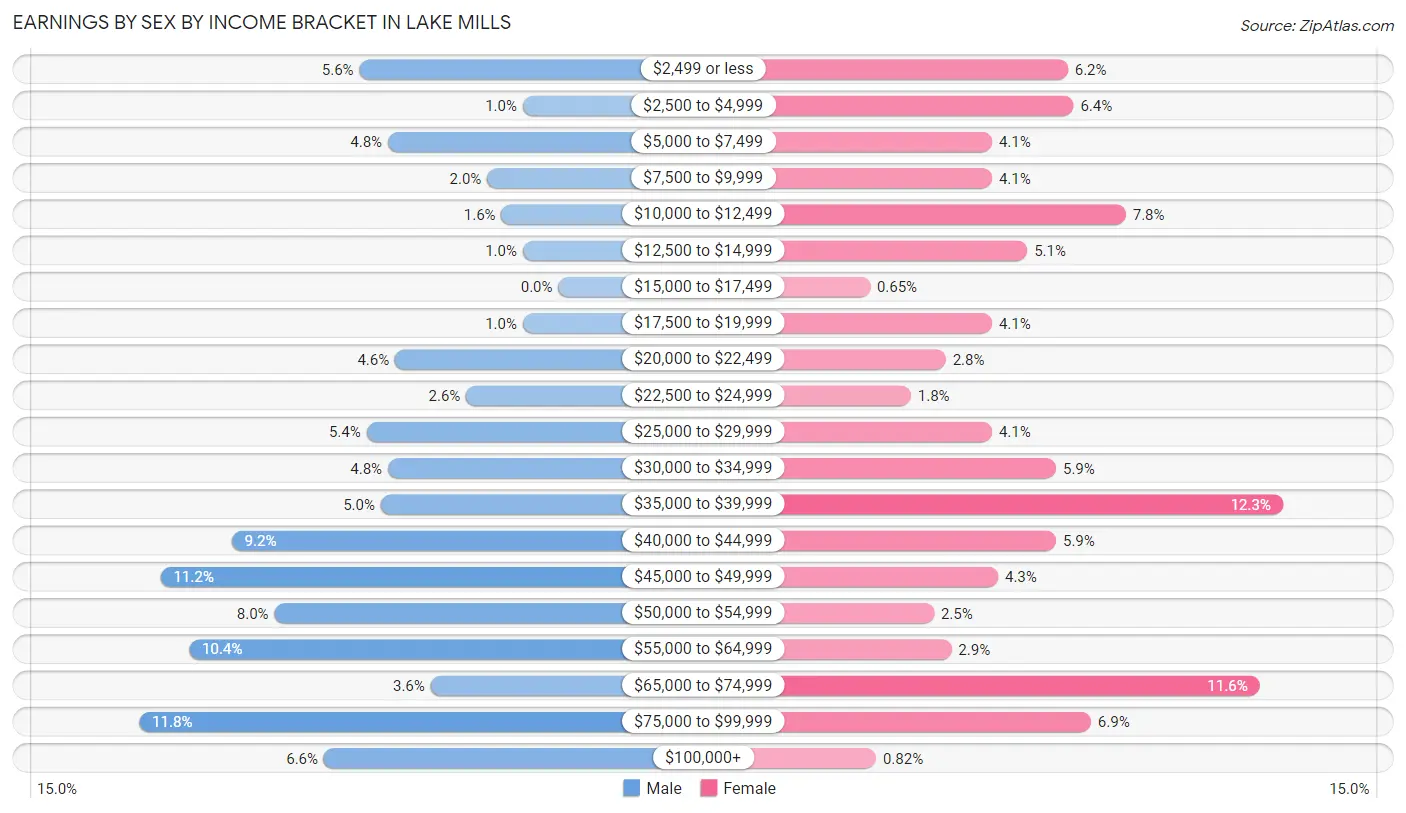
Earnings by Sex by Income Bracket in Lake Mills
The most common earnings brackets in Lake Mills are $75,000 to $99,999 for men (59 | 11.8%) and $35,000 to $39,999 for women (75 | 12.2%).
| Income | Male | Female |
| $2,499 or less | 28 (5.6%) | 38 (6.2%) |
| $2,500 to $4,999 | 5 (1.0%) | 39 (6.4%) |
| $5,000 to $7,499 | 24 (4.8%) | 25 (4.1%) |
| $7,500 to $9,999 | 10 (2.0%) | 25 (4.1%) |
| $10,000 to $12,499 | 8 (1.6%) | 48 (7.8%) |
| $12,500 to $14,999 | 5 (1.0%) | 31 (5.1%) |
| $15,000 to $17,499 | 0 (0.0%) | 4 (0.6%) |
| $17,500 to $19,999 | 5 (1.0%) | 25 (4.1%) |
| $20,000 to $22,499 | 23 (4.6%) | 17 (2.8%) |
| $22,500 to $24,999 | 13 (2.6%) | 11 (1.8%) |
| $25,000 to $29,999 | 27 (5.4%) | 25 (4.1%) |
| $30,000 to $34,999 | 24 (4.8%) | 36 (5.9%) |
| $35,000 to $39,999 | 25 (5.0%) | 75 (12.2%) |
| $40,000 to $44,999 | 46 (9.2%) | 36 (5.9%) |
| $45,000 to $49,999 | 56 (11.2%) | 26 (4.3%) |
| $50,000 to $54,999 | 40 (8.0%) | 15 (2.5%) |
| $55,000 to $64,999 | 52 (10.4%) | 18 (2.9%) |
| $65,000 to $74,999 | 18 (3.6%) | 71 (11.6%) |
| $75,000 to $99,999 | 59 (11.8%) | 42 (6.9%) |
| $100,000+ | 33 (6.6%) | 5 (0.8%) |
| Total | 501 (100.0%) | 612 (100.0%) |
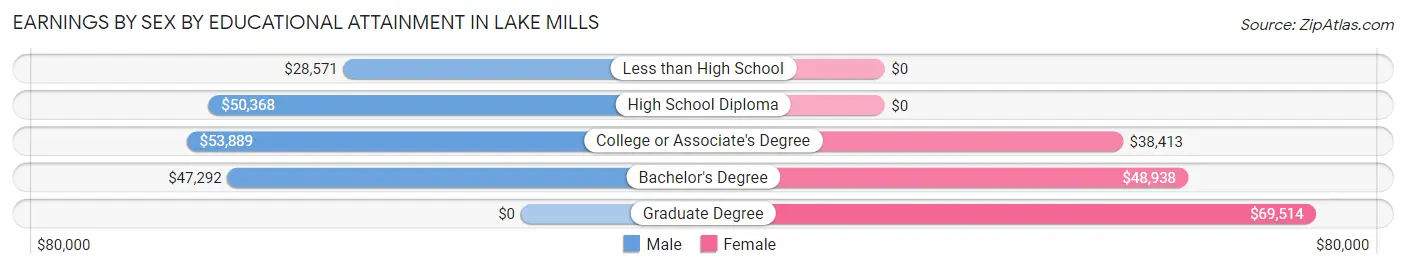
Earnings by Sex by Educational Attainment in Lake Mills
Average earnings in Lake Mills are $49,306 for men and $38,864 for women, a difference of 21.2%. Men with an educational attainment of college or associate's degree enjoy the highest average annual earnings of $53,889, while those with less than high school education earn the least with $28,571. Women with an educational attainment of graduate degree earn the most with the average annual earnings of $69,514, while those with college or associate's degree education have the smallest earnings of $38,413.
| Educational Attainment | Male Income | Female Income |
| Less than High School | $28,571 | $0 |
| High School Diploma | $50,368 | $0 |
| College or Associate's Degree | $53,889 | $38,413 |
| Bachelor's Degree | $47,292 | $48,938 |
| Graduate Degree | - | - |
| Total | $49,306 | $38,864 |
Family Income in Lake Mills
Family Income Brackets in Lake Mills
According to the Lake Mills family income data, there are 145 families falling into the $100,000 to $149,999 income range, which is the most common income bracket and makes up 26.8% of all families. Conversely, the $15,000 to $24,999 income bracket is the least frequent group with only 8 families (1.5%) belonging to this category.
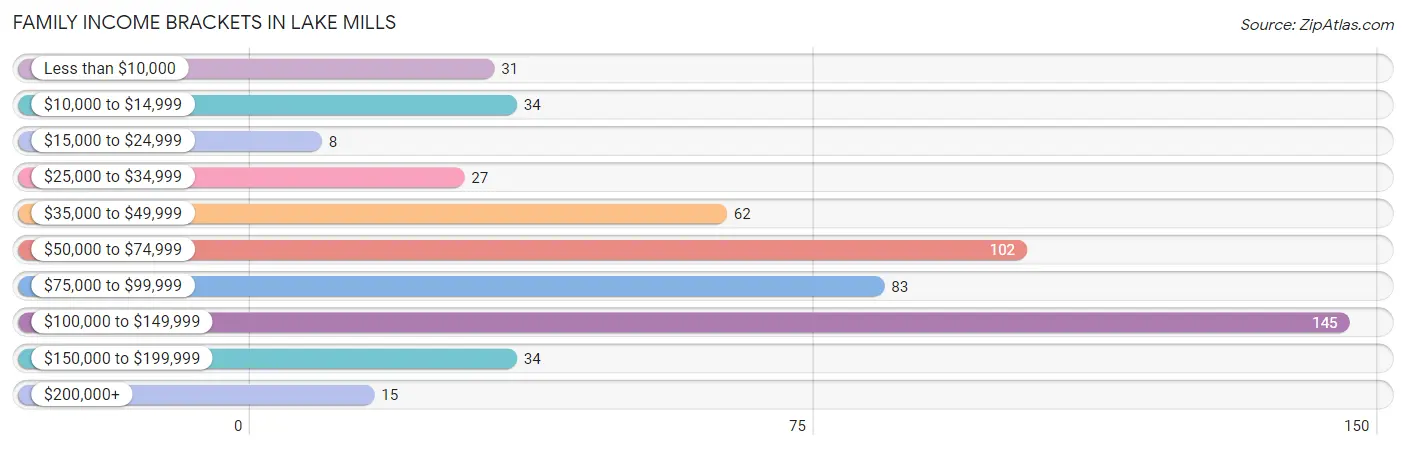
| Income Bracket | # Families | % Families |
| Less than $10,000 | 31 | 5.7% |
| $10,000 to $14,999 | 34 | 6.3% |
| $15,000 to $24,999 | 8 | 1.5% |
| $25,000 to $34,999 | 27 | 5.0% |
| $35,000 to $49,999 | 62 | 11.5% |
| $50,000 to $74,999 | 102 | 18.9% |
| $75,000 to $99,999 | 83 | 15.3% |
| $100,000 to $149,999 | 145 | 26.8% |
| $150,000 to $199,999 | 34 | 6.3% |
| $200,000+ | 15 | 2.8% |
Family Income by Famaliy Size in Lake Mills
2-person families (348 | 64.3%) account for the highest median family income in Lake Mills with $77,857 per family, while 2-person families (348 | 64.3%) have the highest median income of $38,928 per family member.
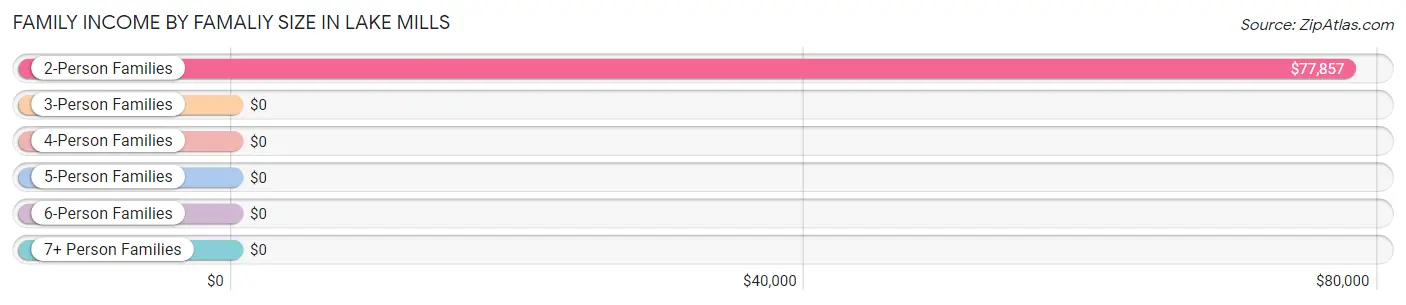
| Income Bracket | # Families | Median Income |
| 2-Person Families | 348 (64.3%) | $77,857 |
| 3-Person Families | 96 (17.7%) | $0 |
| 4-Person Families | 50 (9.2%) | $0 |
| 5-Person Families | 36 (6.7%) | $0 |
| 6-Person Families | 11 (2.0%) | $0 |
| 7+ Person Families | 0 (0.0%) | $0 |
| Total | 541 (100.0%) | $77,768 |
Family Income by Number of Earners in Lake Mills
The median family income in Lake Mills is $77,768, with families comprising 3+ earners (60) having the highest median family income of $130,227, while families with 1 earner (121) have the lowest median family income of $44,750, accounting for 11.1% and 22.4% of families, respectively.
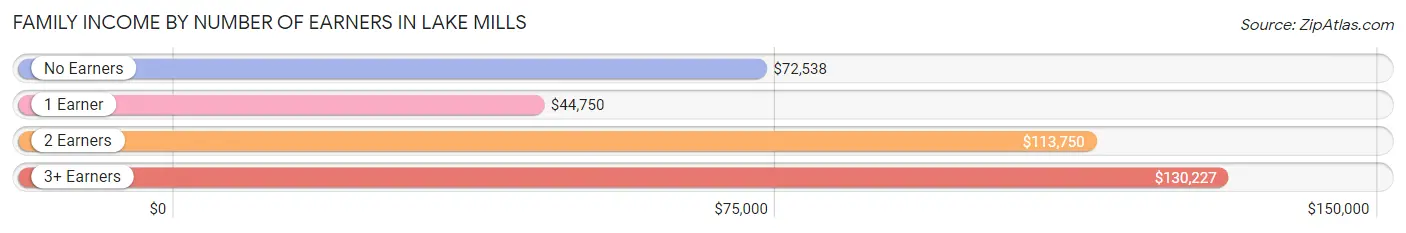
| Number of Earners | # Families | Median Income |
| No Earners | 115 (21.3%) | $72,538 |
| 1 Earner | 121 (22.4%) | $44,750 |
| 2 Earners | 245 (45.3%) | $113,750 |
| 3+ Earners | 60 (11.1%) | $130,227 |
| Total | 541 (100.0%) | $77,768 |
Household Income in Lake Mills
Household Income Brackets in Lake Mills
With 183 households falling in the category, the $50,000 to $74,999 income range is the most frequent in Lake Mills, accounting for 20.7% of all households. In contrast, only 15 households (1.7%) fall into the $200,000+ income bracket, making it the least populous group.
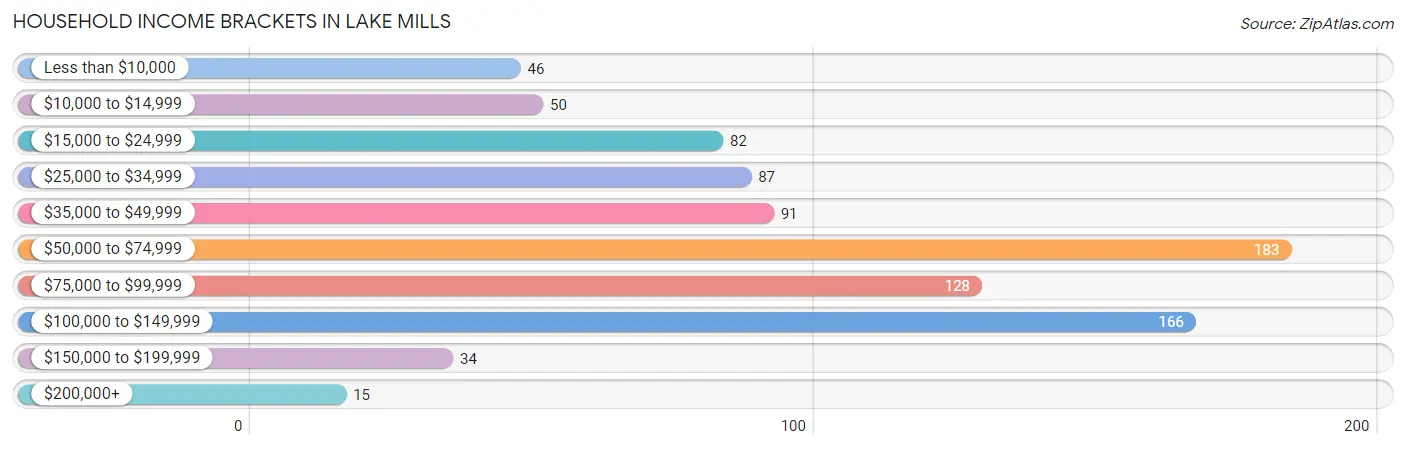
| Income Bracket | # Households | % Households |
| Less than $10,000 | 46 | 5.2% |
| $10,000 to $14,999 | 50 | 5.7% |
| $15,000 to $24,999 | 82 | 9.3% |
| $25,000 to $34,999 | 87 | 9.9% |
| $35,000 to $49,999 | 91 | 10.3% |
| $50,000 to $74,999 | 183 | 20.7% |
| $75,000 to $99,999 | 128 | 14.5% |
| $100,000 to $149,999 | 166 | 18.8% |
| $150,000 to $199,999 | 34 | 3.9% |
| $200,000+ | 15 | 1.7% |
Household Income by Householder Age in Lake Mills
The median household income in Lake Mills is $63,750, with the highest median household income of $84,583 found in the 45 to 64 years age bracket for the primary householder. A total of 307 households (34.8%) fall into this category. Meanwhile, the 65+ years age bracket for the primary householder has the lowest median household income of $42,656, with 325 households (36.8%) in this group.
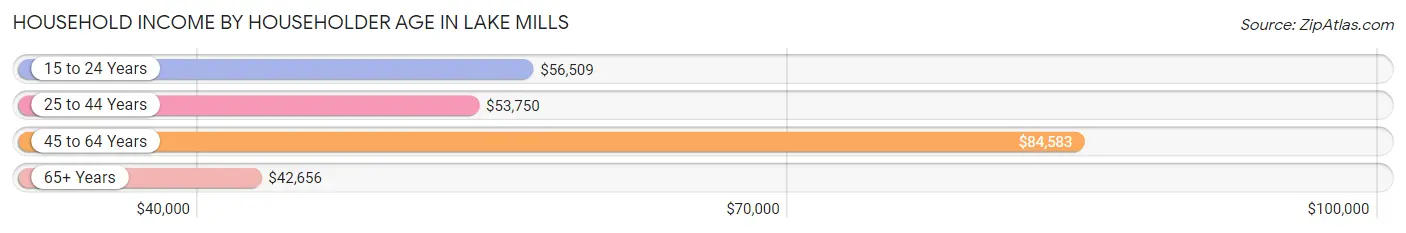
| Income Bracket | # Households | Median Income |
| 15 to 24 Years | 47 (5.3%) | $56,509 |
| 25 to 44 Years | 203 (23.0%) | $53,750 |
| 45 to 64 Years | 307 (34.8%) | $84,583 |
| 65+ Years | 325 (36.8%) | $42,656 |
| Total | 882 (100.0%) | $63,750 |
Poverty in Lake Mills
Income Below Poverty by Sex and Age in Lake Mills
With 10.8% poverty level for males and 14.4% for females among the residents of Lake Mills, under 5 year old males and 5 year old females are the most vulnerable to poverty, with 8 males (100.0%) and 6 females (100.0%) in their respective age groups living below the poverty level.
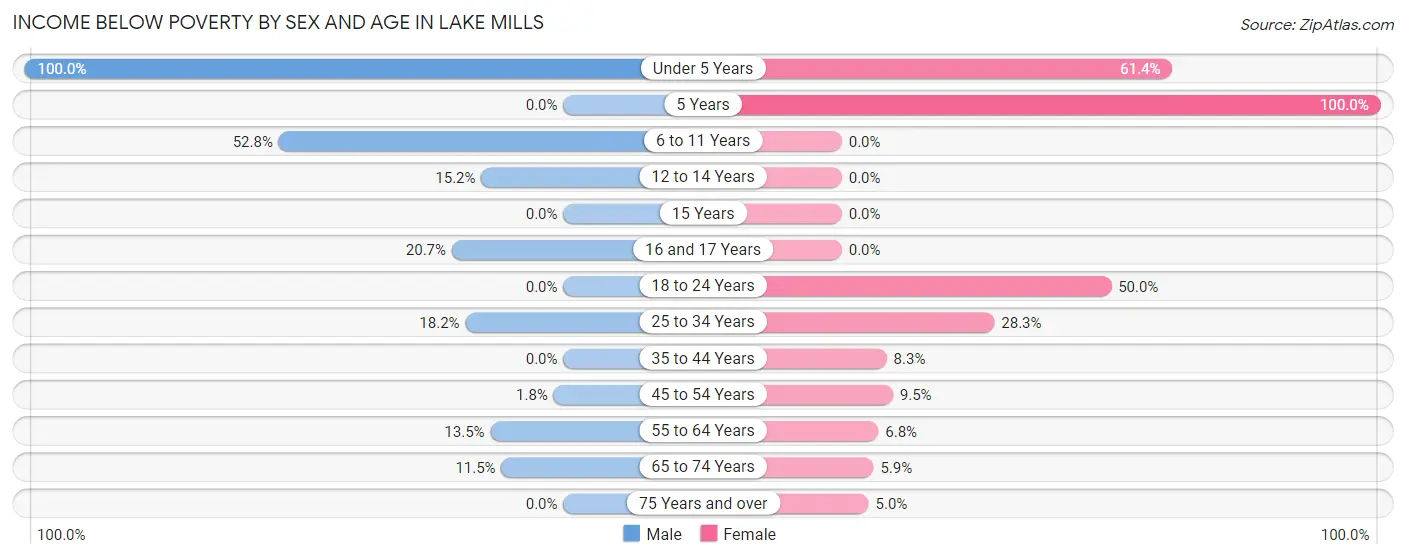
| Age Bracket | Male | Female |
| Under 5 Years | 8 (100.0%) | 27 (61.4%) |
| 5 Years | 0 (0.0%) | 6 (100.0%) |
| 6 to 11 Years | 28 (52.8%) | 0 (0.0%) |
| 12 to 14 Years | 7 (15.2%) | 0 (0.0%) |
| 15 Years | 0 (0.0%) | 0 (0.0%) |
| 16 and 17 Years | 6 (20.7%) | 0 (0.0%) |
| 18 to 24 Years | 0 (0.0%) | 42 (50.0%) |
| 25 to 34 Years | 18 (18.2%) | 32 (28.3%) |
| 35 to 44 Years | 0 (0.0%) | 9 (8.3%) |
| 45 to 54 Years | 2 (1.8%) | 9 (9.5%) |
| 55 to 64 Years | 13 (13.5%) | 12 (6.8%) |
| 65 to 74 Years | 10 (11.5%) | 5 (5.9%) |
| 75 Years and over | 0 (0.0%) | 11 (5.0%) |
| Total | 92 (10.8%) | 153 (14.4%) |
Income Above Poverty by Sex and Age in Lake Mills
According to the poverty statistics in Lake Mills, males aged 5 years and females aged 6 to 11 years are the age groups that are most secure financially, with 100.0% of males and 100.0% of females in these age groups living above the poverty line.
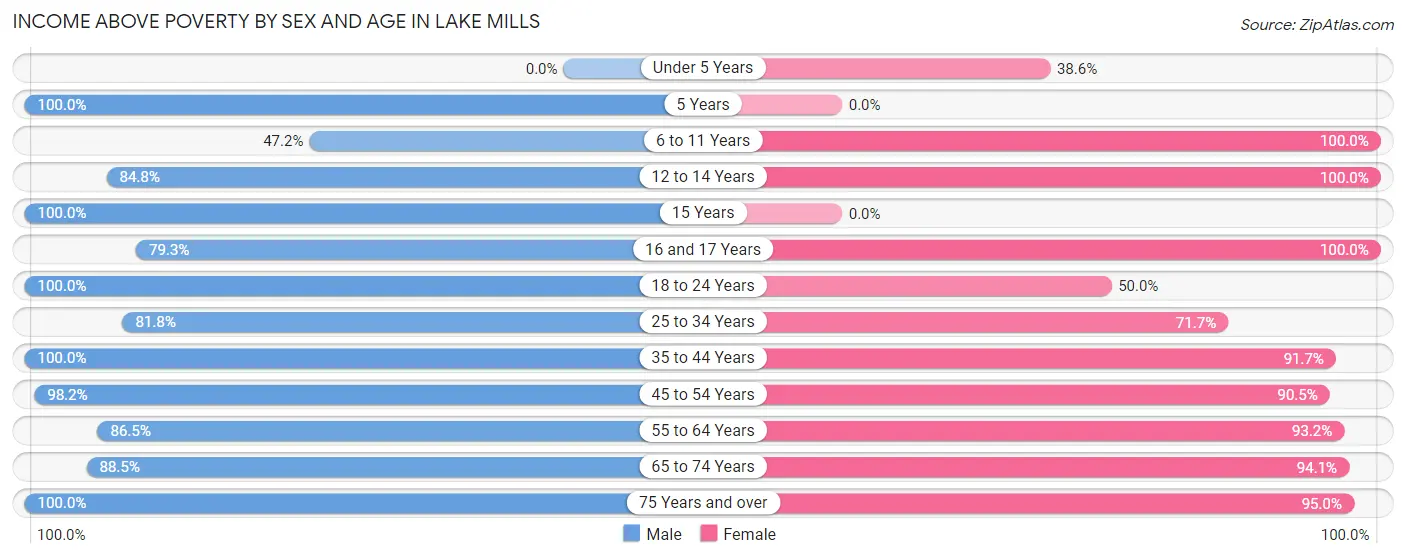
| Age Bracket | Male | Female |
| Under 5 Years | 0 (0.0%) | 17 (38.6%) |
| 5 Years | 20 (100.0%) | 0 (0.0%) |
| 6 to 11 Years | 25 (47.2%) | 49 (100.0%) |
| 12 to 14 Years | 39 (84.8%) | 31 (100.0%) |
| 15 Years | 25 (100.0%) | 0 (0.0%) |
| 16 and 17 Years | 23 (79.3%) | 50 (100.0%) |
| 18 to 24 Years | 89 (100.0%) | 42 (50.0%) |
| 25 to 34 Years | 81 (81.8%) | 81 (71.7%) |
| 35 to 44 Years | 94 (100.0%) | 99 (91.7%) |
| 45 to 54 Years | 109 (98.2%) | 86 (90.5%) |
| 55 to 64 Years | 83 (86.5%) | 165 (93.2%) |
| 65 to 74 Years | 77 (88.5%) | 80 (94.1%) |
| 75 Years and over | 94 (100.0%) | 210 (95.0%) |
| Total | 759 (89.2%) | 910 (85.6%) |
Income Below Poverty Among Married-Couple Families in Lake Mills
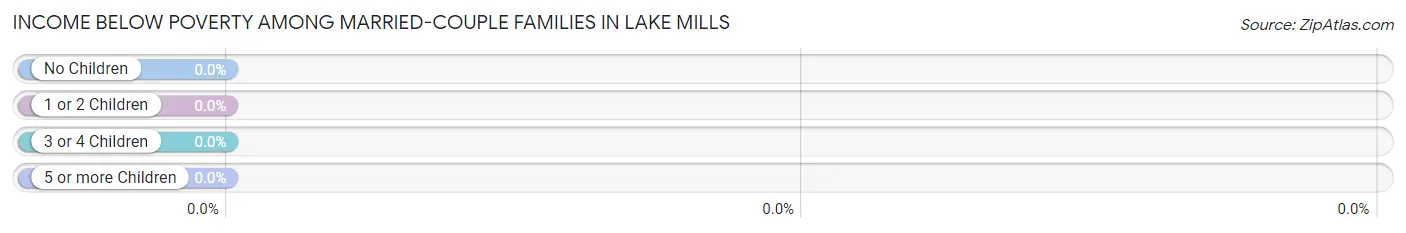
| Children | Above Poverty | Below Poverty |
| No Children | 289 (100.0%) | 0 (0.0%) |
| 1 or 2 Children | 75 (100.0%) | 0 (0.0%) |
| 3 or 4 Children | 26 (100.0%) | 0 (0.0%) |
| 5 or more Children | 0 (0.0%) | 0 (0.0%) |
| Total | 390 (100.0%) | 0 (0.0%) |
Income Below Poverty Among Single-Parent Households in Lake Mills
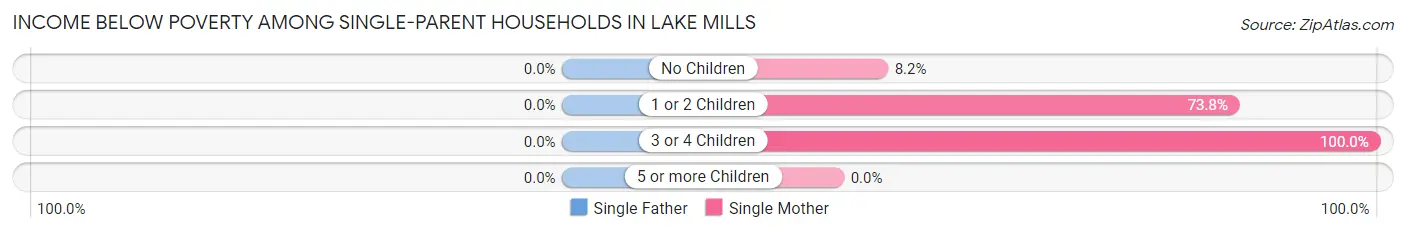
| Children | Single Father | Single Mother |
| No Children | 0 (0.0%) | 5 (8.2%) |
| 1 or 2 Children | 0 (0.0%) | 45 (73.8%) |
| 3 or 4 Children | 0 (0.0%) | 18 (100.0%) |
| 5 or more Children | 0 (0.0%) | 0 (0.0%) |
| Total | 0 (0.0%) | 68 (48.6%) |
Income Below Poverty Among Married-Couple vs Single-Parent Households in Lake Mills
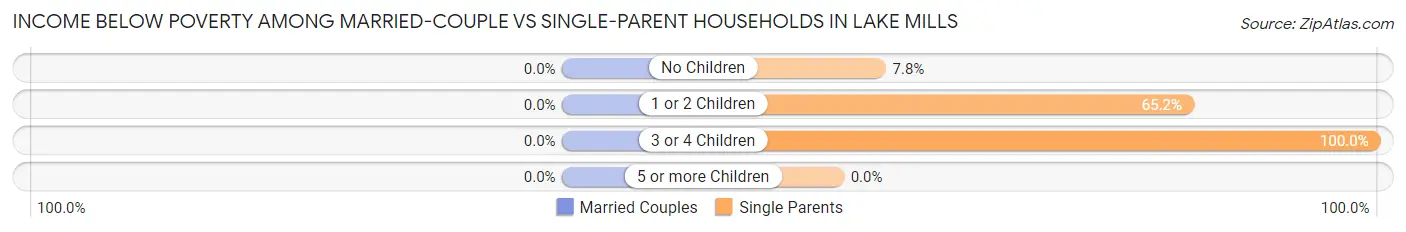
| Children | Married-Couple Families | Single-Parent Households |
| No Children | 0 (0.0%) | 5 (7.8%) |
| 1 or 2 Children | 0 (0.0%) | 45 (65.2%) |
| 3 or 4 Children | 0 (0.0%) | 18 (100.0%) |
| 5 or more Children | 0 (0.0%) | 0 (0.0%) |
| Total | 0 (0.0%) | 68 (45.0%) |
Race in Lake Mills
The most populous races in Lake Mills are White / Caucasian (1,838 | 93.5%), Hispanic or Latino (214 | 10.9%), and Two or more Races (115 | 5.9%).
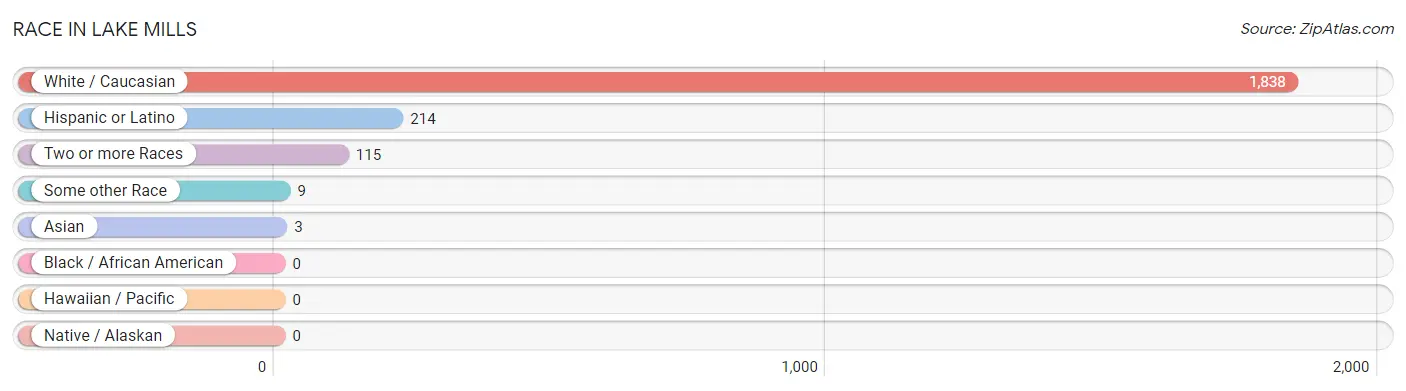
| Race | # Population | % Population |
| Asian | 3 | 0.2% |
| Black / African American | 0 | 0.0% |
| Hawaiian / Pacific | 0 | 0.0% |
| Hispanic or Latino | 214 | 10.9% |
| Native / Alaskan | 0 | 0.0% |
| White / Caucasian | 1,838 | 93.5% |
| Two or more Races | 115 | 5.9% |
| Some other Race | 9 | 0.5% |
| Total | 1,965 | 100.0% |
Ancestry in Lake Mills
The most populous ancestries reported in Lake Mills are Norwegian (796 | 40.5%), German (712 | 36.2%), English (158 | 8.0%), American (121 | 6.2%), and Mexican (110 | 5.6%), together accounting for 96.5% of all Lake Mills residents.
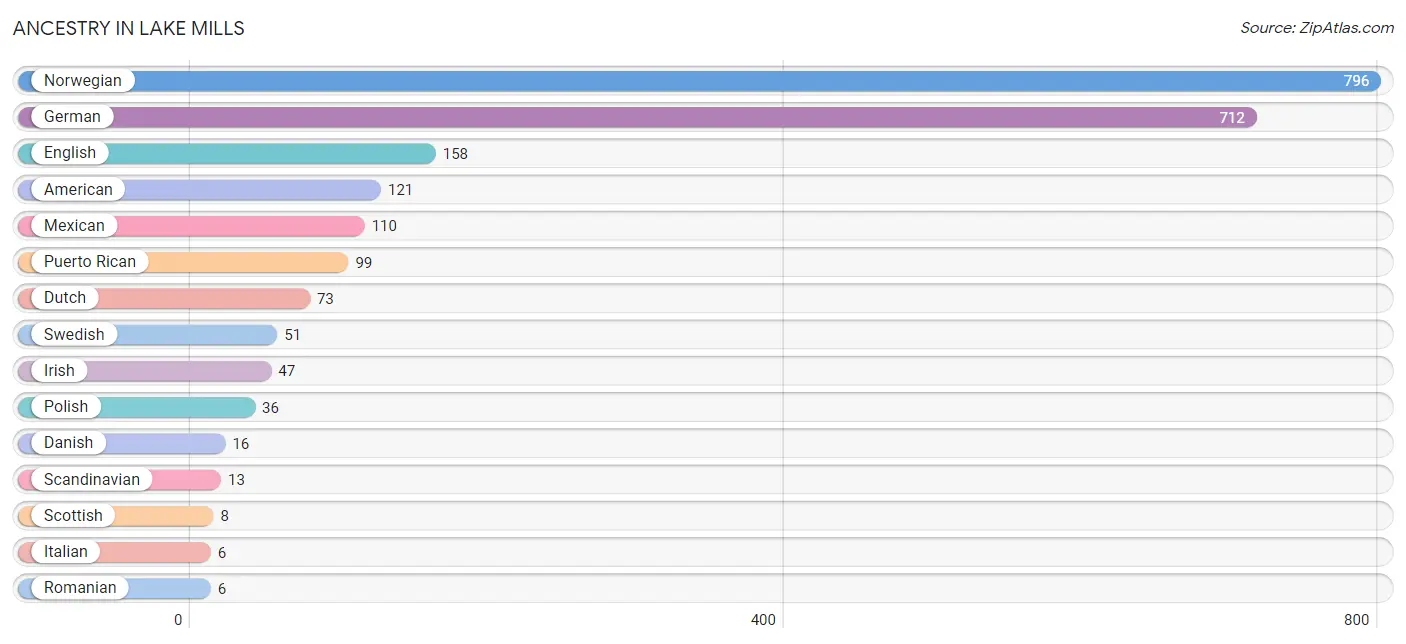
| Ancestry | # Population | % Population |
| American | 121 | 6.2% |
| British | 5 | 0.3% |
| Canadian | 5 | 0.3% |
| Czech | 4 | 0.2% |
| Danish | 16 | 0.8% |
| Dutch | 73 | 3.7% |
| Eastern European | 3 | 0.2% |
| English | 158 | 8.0% |
| French | 5 | 0.3% |
| German | 712 | 36.2% |
| Guyanese | 5 | 0.3% |
| Irish | 47 | 2.4% |
| Italian | 6 | 0.3% |
| Korean | 3 | 0.2% |
| Mexican | 110 | 5.6% |
| Norwegian | 796 | 40.5% |
| Polish | 36 | 1.8% |
| Puerto Rican | 99 | 5.0% |
| Romanian | 6 | 0.3% |
| Samoan | 6 | 0.3% |
| Scandinavian | 13 | 0.7% |
| Scottish | 8 | 0.4% |
| South American | 5 | 0.3% |
| Swedish | 51 | 2.6% |
| Welsh | 4 | 0.2% | View All 25 Rows |
Immigrants in Lake Mills
The most numerous immigrant groups reported in Lake Mills came from Europe (8 | 0.4%), Western Europe (8 | 0.4%), France (5 | 0.3%), Guyana (5 | 0.3%), and Latin America (5 | 0.3%), together accounting for 1.6% of all Lake Mills residents.
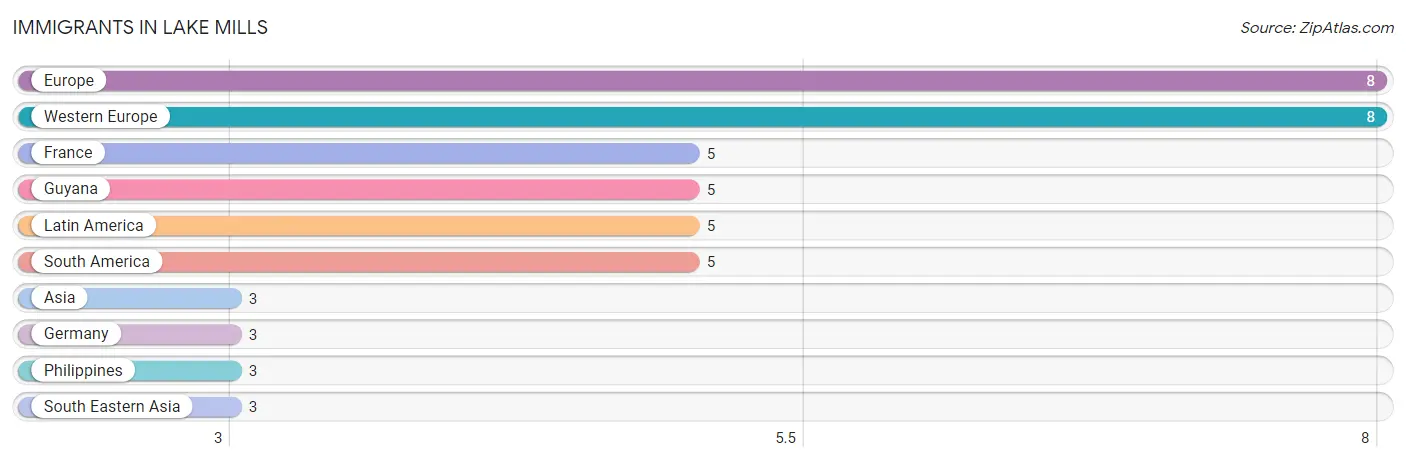
| Immigration Origin | # Population | % Population |
| Asia | 3 | 0.2% |
| Europe | 8 | 0.4% |
| France | 5 | 0.3% |
| Germany | 3 | 0.2% |
| Guyana | 5 | 0.3% |
| Latin America | 5 | 0.3% |
| Philippines | 3 | 0.2% |
| South America | 5 | 0.3% |
| South Eastern Asia | 3 | 0.2% |
| Western Europe | 8 | 0.4% | View All 10 Rows |
Sex and Age in Lake Mills
Sex and Age in Lake Mills
The most populous age groups in Lake Mills are 15 to 19 Years (84 | 9.6%) for men and 55 to 59 Years (135 | 12.4%) for women.
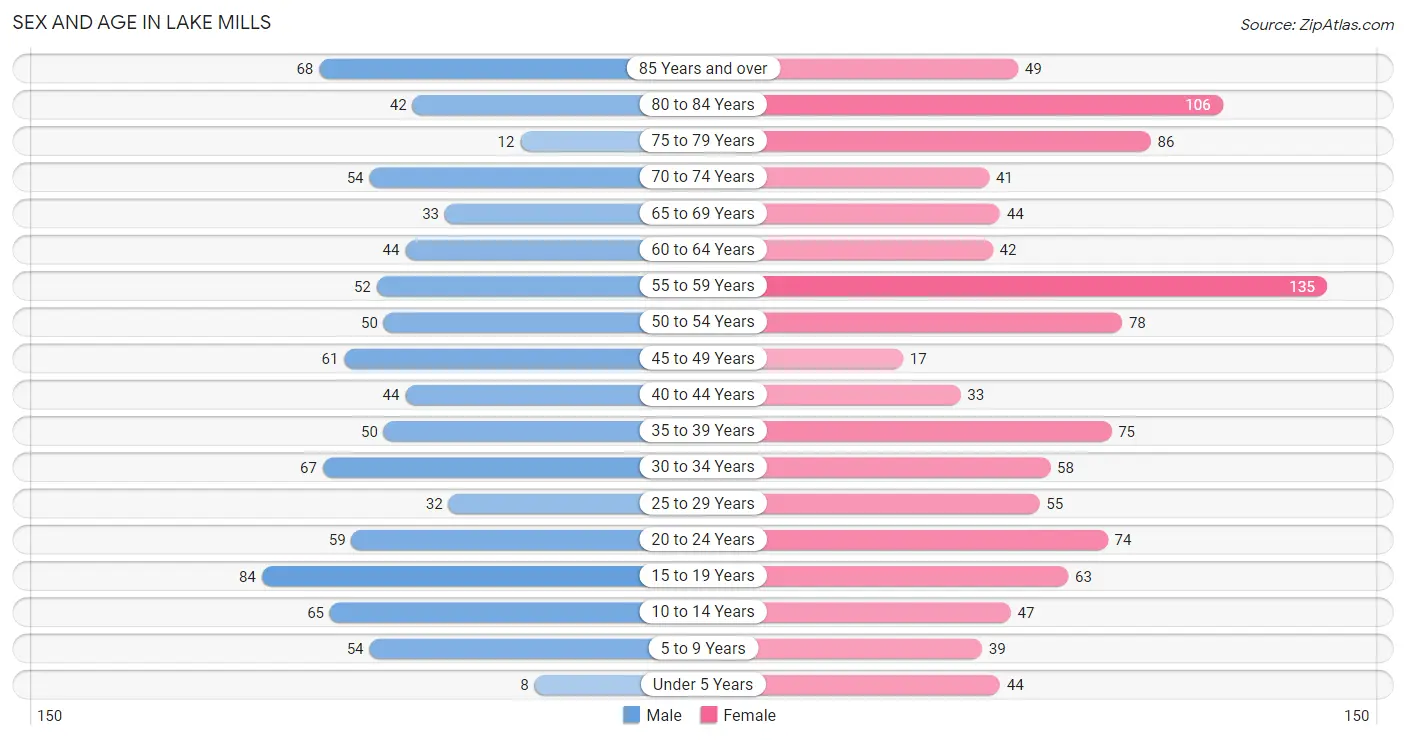
| Age Bracket | Male | Female |
| Under 5 Years | 8 (0.9%) | 44 (4.1%) |
| 5 to 9 Years | 54 (6.1%) | 39 (3.6%) |
| 10 to 14 Years | 65 (7.4%) | 47 (4.3%) |
| 15 to 19 Years | 84 (9.6%) | 63 (5.8%) |
| 20 to 24 Years | 59 (6.7%) | 74 (6.8%) |
| 25 to 29 Years | 32 (3.6%) | 55 (5.1%) |
| 30 to 34 Years | 67 (7.6%) | 58 (5.3%) |
| 35 to 39 Years | 50 (5.7%) | 75 (6.9%) |
| 40 to 44 Years | 44 (5.0%) | 33 (3.0%) |
| 45 to 49 Years | 61 (6.9%) | 17 (1.6%) |
| 50 to 54 Years | 50 (5.7%) | 78 (7.2%) |
| 55 to 59 Years | 52 (5.9%) | 135 (12.4%) |
| 60 to 64 Years | 44 (5.0%) | 42 (3.9%) |
| 65 to 69 Years | 33 (3.7%) | 44 (4.1%) |
| 70 to 74 Years | 54 (6.1%) | 41 (3.8%) |
| 75 to 79 Years | 12 (1.4%) | 86 (7.9%) |
| 80 to 84 Years | 42 (4.8%) | 106 (9.8%) |
| 85 Years and over | 68 (7.7%) | 49 (4.5%) |
| Total | 879 (100.0%) | 1,086 (100.0%) |
Families and Households in Lake Mills
Median Family Size in Lake Mills
The median family size in Lake Mills is 2.73 persons per family, with married-couple families (390 | 72.1%) accounting for the largest median family size of 2.78 persons per family. On the other hand, single male/father families (11 | 2.0%) represent the smallest median family size with 2.45 persons per family.
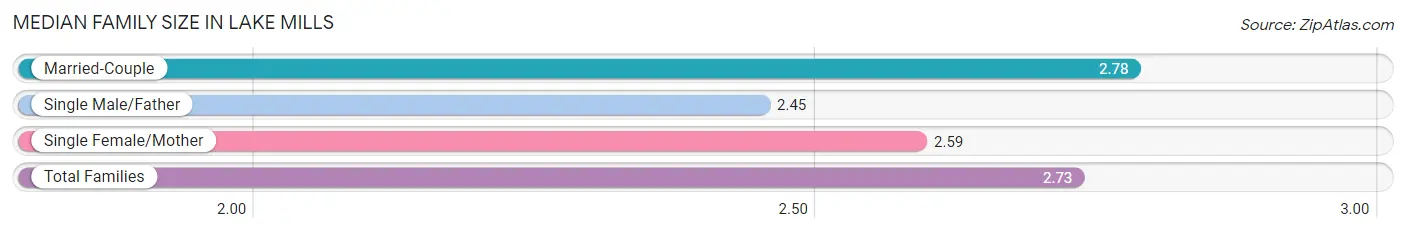
| Family Type | # Families | Family Size |
| Married-Couple | 390 (72.1%) | 2.78 |
| Single Male/Father | 11 (2.0%) | 2.45 |
| Single Female/Mother | 140 (25.9%) | 2.59 |
| Total Families | 541 (100.0%) | 2.73 |
Median Household Size in Lake Mills
The median household size in Lake Mills is 2.17 persons per household, with single male/father households (11 | 1.3%) accounting for the largest median household size of 2.91 persons per household. non-family households (341 | 38.7%) represent the smallest median household size with 1.16 persons per household.
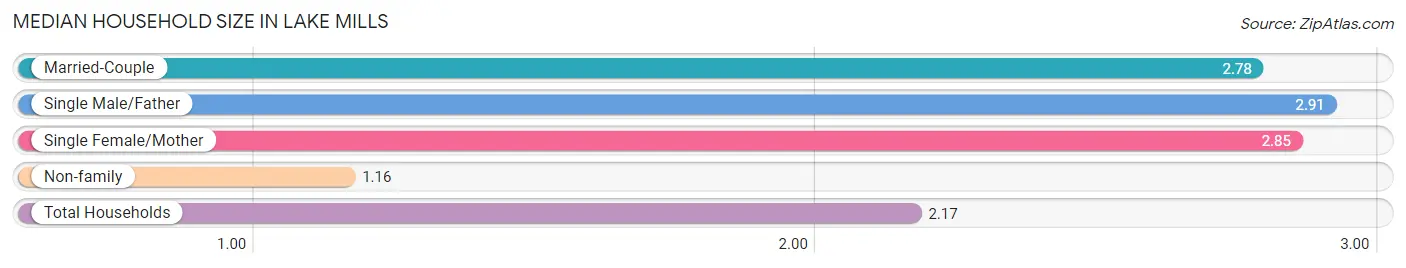
| Household Type | # Households | Household Size |
| Married-Couple | 390 (44.2%) | 2.78 |
| Single Male/Father | 11 (1.3%) | 2.91 |
| Single Female/Mother | 140 (15.9%) | 2.85 |
| Non-family | 341 (38.7%) | 1.16 |
| Total Households | 882 (100.0%) | 2.17 |
Household Size by Marriage Status in Lake Mills
Out of a total of 882 households in Lake Mills, 541 (61.3%) are family households, while 341 (38.7%) are nonfamily households. The most numerous type of family households are 2-person households, comprising 332, and the most common type of nonfamily households are 1-person households, comprising 313.
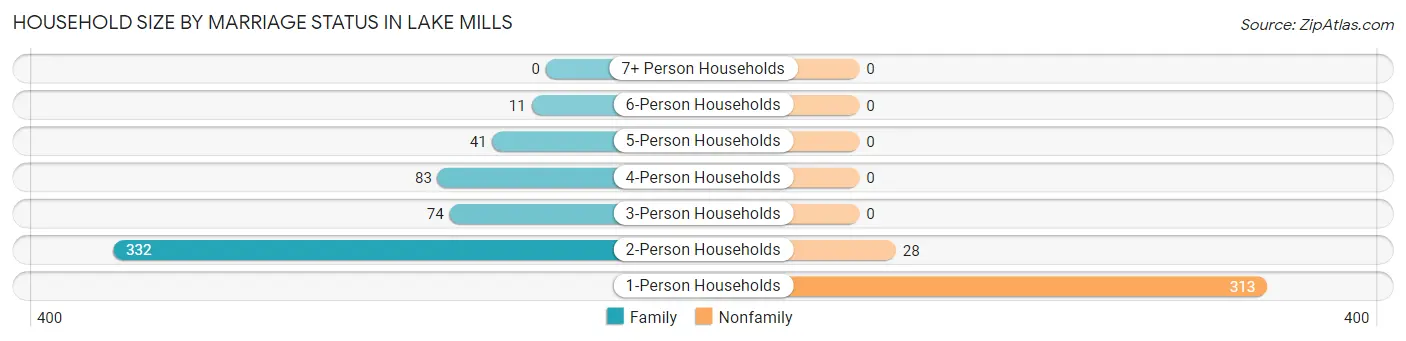
| Household Size | Family Households | Nonfamily Households |
| 1-Person Households | - | 313 (35.5%) |
| 2-Person Households | 332 (37.6%) | 28 (3.2%) |
| 3-Person Households | 74 (8.4%) | 0 (0.0%) |
| 4-Person Households | 83 (9.4%) | 0 (0.0%) |
| 5-Person Households | 41 (4.6%) | 0 (0.0%) |
| 6-Person Households | 11 (1.3%) | 0 (0.0%) |
| 7+ Person Households | 0 (0.0%) | 0 (0.0%) |
| Total | 541 (61.3%) | 341 (38.7%) |
Female Fertility in Lake Mills
Fertility by Age in Lake Mills
Average fertility rate in Lake Mills is 77.0 births per 1,000 women. Women in the age bracket of 20 to 34 years have the highest fertility rate with 155.0 births per 1,000 women. Women in the age bracket of 20 to 34 years acount for 100.0% of all women with births.
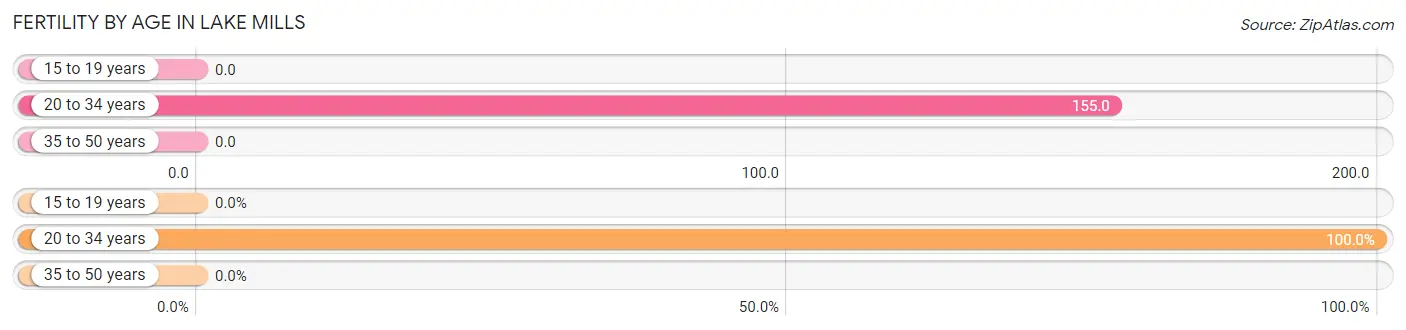
| Age Bracket | Women with Births | Births / 1,000 Women |
| 15 to 19 years | 0 (0.0%) | 0.0 |
| 20 to 34 years | 29 (100.0%) | 155.0 |
| 35 to 50 years | 0 (0.0%) | 0.0 |
| Total | 29 (100.0%) | 77.0 |
Fertility by Age by Marriage Status in Lake Mills
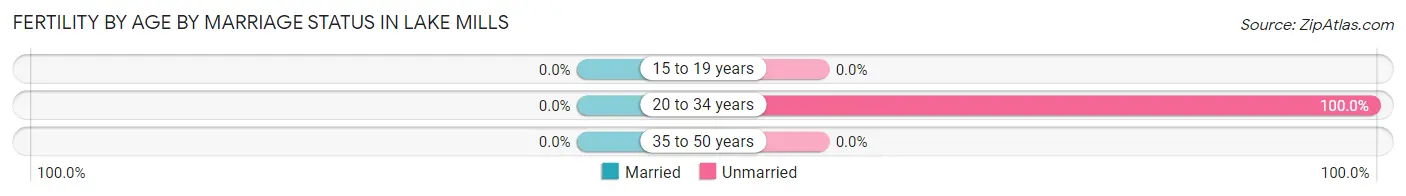
| Age Bracket | Married | Unmarried |
| 15 to 19 years | 0 (0.0%) | 0 (0.0%) |
| 20 to 34 years | 0 (0.0%) | 29 (100.0%) |
| 35 to 50 years | 0 (0.0%) | 0 (0.0%) |
| Total | 0 (0.0%) | 29 (100.0%) |
Fertility by Education in Lake Mills
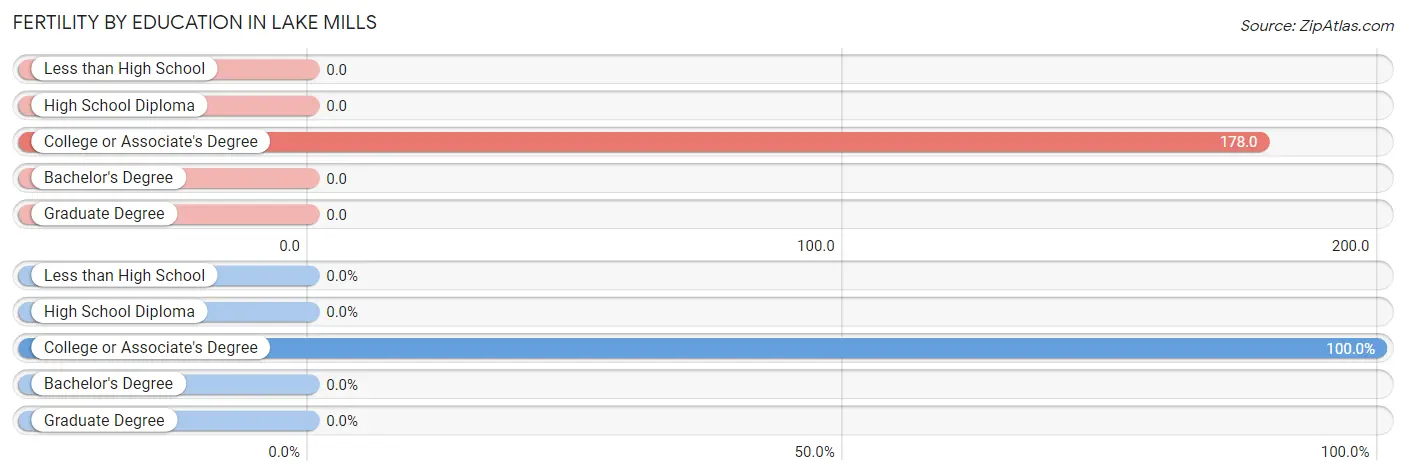
| Educational Attainment | Women with Births | Births / 1,000 Women |
| Less than High School | 0 (0.0%) | 0.0 |
| High School Diploma | 0 (0.0%) | 0.0 |
| College or Associate's Degree | 29 (100.0%) | 178.0 |
| Bachelor's Degree | 0 (0.0%) | 0.0 |
| Graduate Degree | 0 (0.0%) | 0.0 |
| Total | 29 (100.0%) | 77.0 |
Fertility by Education by Marriage Status in Lake Mills
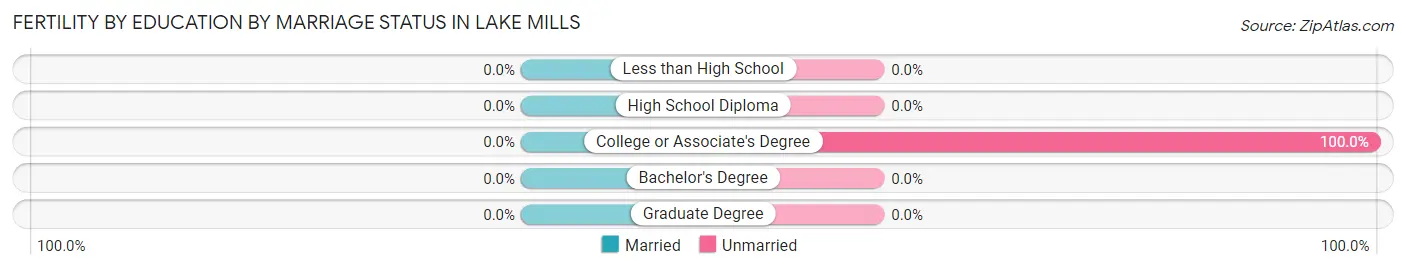
| Educational Attainment | Married | Unmarried |
| Less than High School | 0 (0.0%) | 0 (0.0%) |
| High School Diploma | 0 (0.0%) | 0 (0.0%) |
| College or Associate's Degree | 0 (0.0%) | 29 (100.0%) |
| Bachelor's Degree | 0 (0.0%) | 0 (0.0%) |
| Graduate Degree | 0 (0.0%) | 0 (0.0%) |
| Total | 0 (0.0%) | 29 (100.0%) |
Employment Characteristics in Lake Mills
Employment by Class of Employer in Lake Mills
Among the 962 employed individuals in Lake Mills, private company employees (633 | 65.8%), not-for-profit organizations (138 | 14.3%), and local government employees (102 | 10.6%) make up the most common classes of employment.
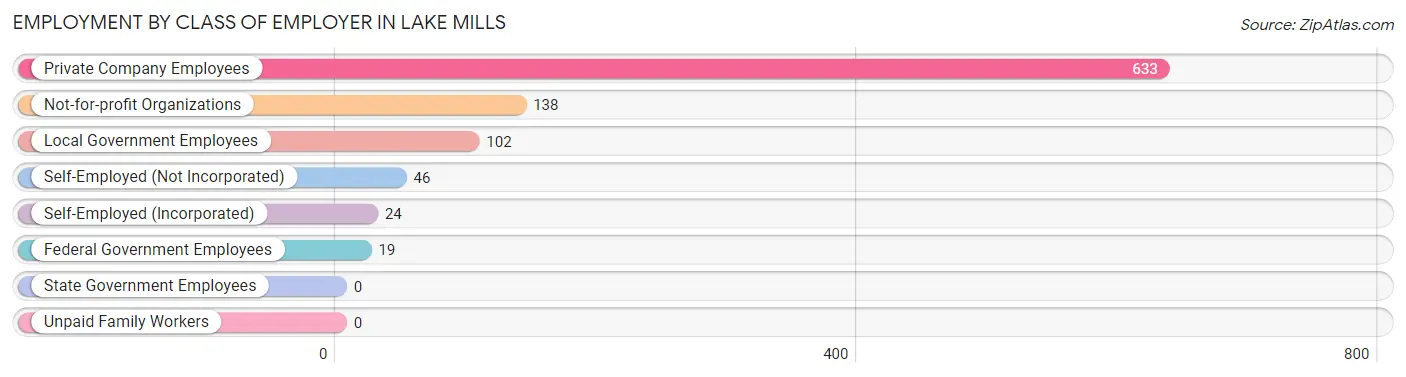
| Employer Class | # Employees | % Employees |
| Private Company Employees | 633 | 65.8% |
| Self-Employed (Incorporated) | 24 | 2.5% |
| Self-Employed (Not Incorporated) | 46 | 4.8% |
| Not-for-profit Organizations | 138 | 14.3% |
| Local Government Employees | 102 | 10.6% |
| State Government Employees | 0 | 0.0% |
| Federal Government Employees | 19 | 2.0% |
| Unpaid Family Workers | 0 | 0.0% |
| Total | 962 | 100.0% |
Employment Status by Age in Lake Mills
According to the labor force statistics for Lake Mills, out of the total population over 16 years of age (1,683), 63.0% or 1,060 individuals are in the labor force, with 2.8% or 30 of them unemployed. The age group with the highest labor force participation rate is 25 to 29 years, with 100.0% or 87 individuals in the labor force. Within the labor force, the 35 to 44 years age range has the highest percentage of unemployed individuals, with 8.1% or 14 of them being unemployed.
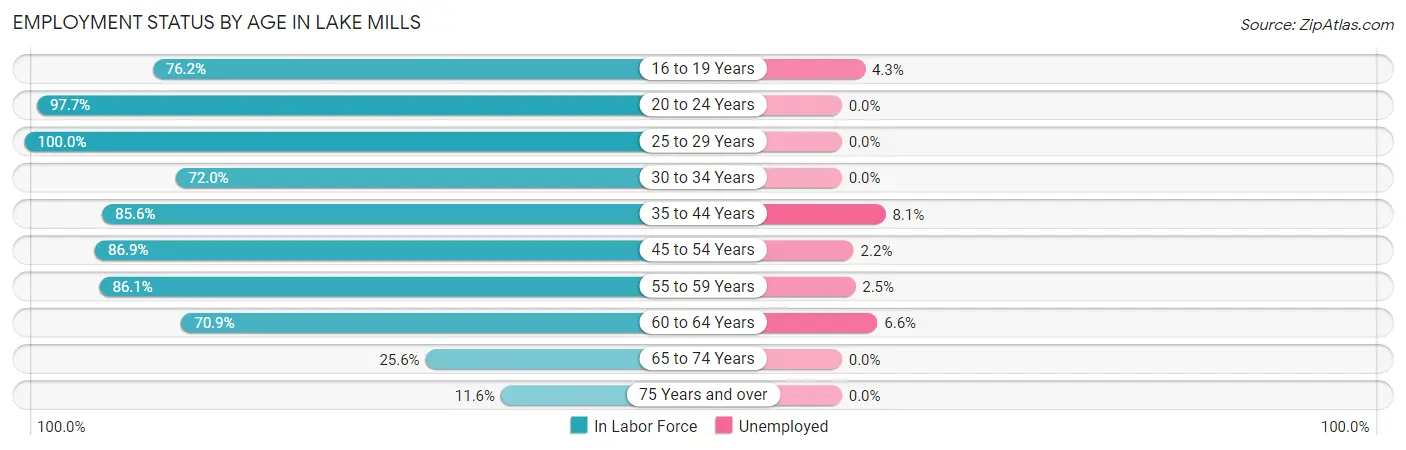
| Age Bracket | In Labor Force | Unemployed |
| 16 to 19 Years | 93 (76.2%) | 4 (4.3%) |
| 20 to 24 Years | 130 (97.7%) | 0 (0.0%) |
| 25 to 29 Years | 87 (100.0%) | 0 (0.0%) |
| 30 to 34 Years | 90 (72.0%) | 0 (0.0%) |
| 35 to 44 Years | 173 (85.6%) | 14 (8.1%) |
| 45 to 54 Years | 179 (86.9%) | 4 (2.2%) |
| 55 to 59 Years | 161 (86.1%) | 4 (2.5%) |
| 60 to 64 Years | 61 (70.9%) | 4 (6.6%) |
| 65 to 74 Years | 44 (25.6%) | 0 (0.0%) |
| 75 Years and over | 42 (11.6%) | 0 (0.0%) |
| Total | 1,060 (63.0%) | 30 (2.8%) |
Employment Status by Educational Attainment in Lake Mills
According to labor force statistics for Lake Mills, 84.1% of individuals (751) out of the total population between 25 and 64 years of age (893) are in the labor force, with 3.5% or 26 of them being unemployed. The group with the highest labor force participation rate are those with the educational attainment of bachelor's degree or higher, with 93.5% or 144 individuals in the labor force. Within the labor force, individuals with less than high school education have the highest percentage of unemployment, with 45.0% or 18 of them being unemployed.
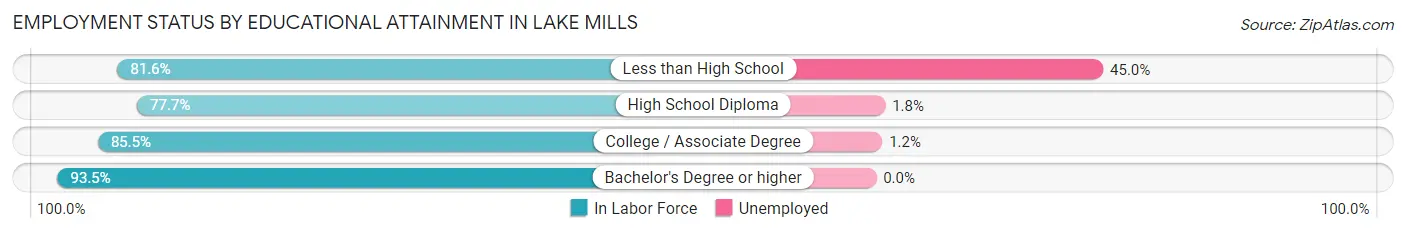
| Educational Attainment | In Labor Force | Unemployed |
| Less than High School | 40 (81.6%) | 22 (45.0%) |
| High School Diploma | 226 (77.7%) | 5 (1.8%) |
| College / Associate Degree | 341 (85.5%) | 5 (1.2%) |
| Bachelor's Degree or higher | 144 (93.5%) | 0 (0.0%) |
| Total | 751 (84.1%) | 31 (3.5%) |
Employment Occupations by Sex in Lake Mills
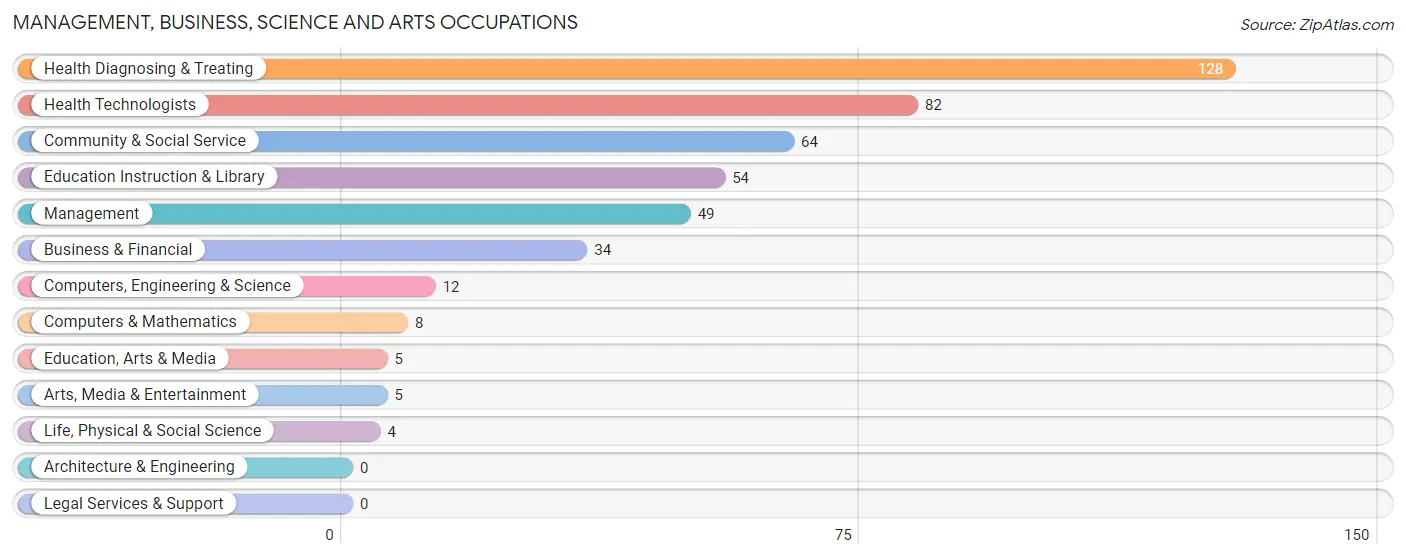
Management, Business, Science and Arts Occupations
The most common Management, Business, Science and Arts occupations in Lake Mills are Health Diagnosing & Treating (128 | 12.4%), Health Technologists (82 | 8.0%), Community & Social Service (64 | 6.2%), Education Instruction & Library (54 | 5.2%), and Management (49 | 4.8%).
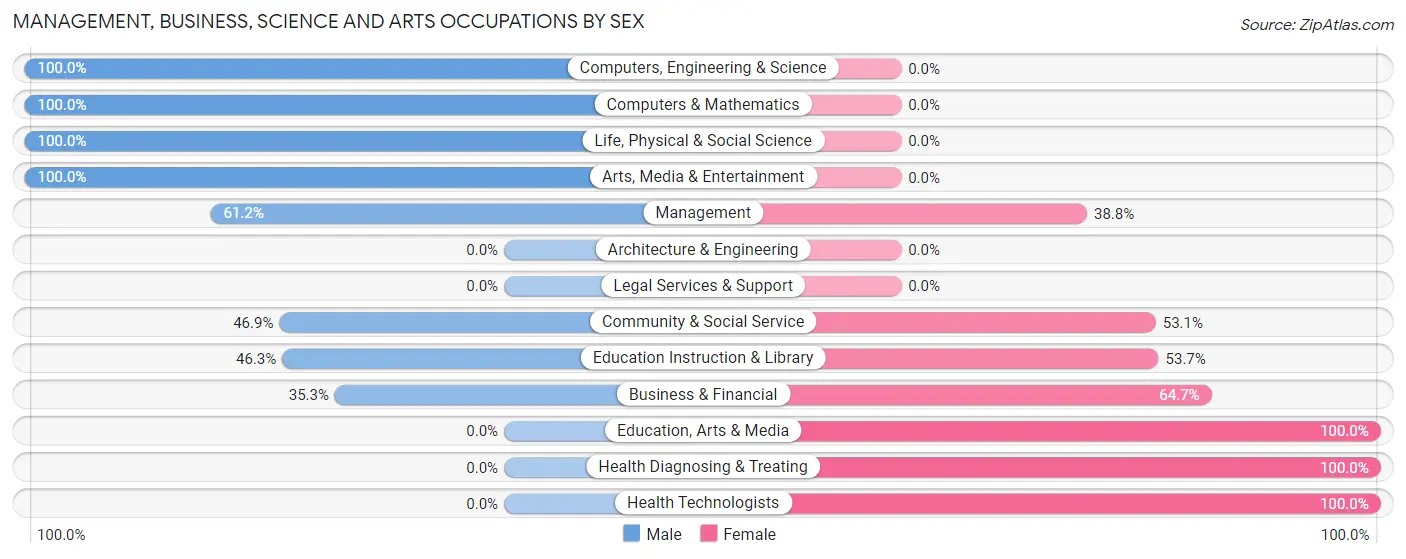
Management, Business, Science and Arts Occupations by Sex
Within the Management, Business, Science and Arts occupations in Lake Mills, the most male-oriented occupations are Computers, Engineering & Science (100.0%), Computers & Mathematics (100.0%), and Life, Physical & Social Science (100.0%), while the most female-oriented occupations are Education, Arts & Media (100.0%), Health Diagnosing & Treating (100.0%), and Health Technologists (100.0%).
| Occupation | Male | Female |
| Management | 30 (61.2%) | 19 (38.8%) |
| Business & Financial | 12 (35.3%) | 22 (64.7%) |
| Computers, Engineering & Science | 12 (100.0%) | 0 (0.0%) |
| Computers & Mathematics | 8 (100.0%) | 0 (0.0%) |
| Architecture & Engineering | 0 (0.0%) | 0 (0.0%) |
| Life, Physical & Social Science | 4 (100.0%) | 0 (0.0%) |
| Community & Social Service | 30 (46.9%) | 34 (53.1%) |
| Education, Arts & Media | 0 (0.0%) | 5 (100.0%) |
| Legal Services & Support | 0 (0.0%) | 0 (0.0%) |
| Education Instruction & Library | 25 (46.3%) | 29 (53.7%) |
| Arts, Media & Entertainment | 5 (100.0%) | 0 (0.0%) |
| Health Diagnosing & Treating | 0 (0.0%) | 128 (100.0%) |
| Health Technologists | 0 (0.0%) | 82 (100.0%) |
| Total (Category) | 84 (29.3%) | 203 (70.7%) |
| Total (Overall) | 436 (42.3%) | 594 (57.7%) |
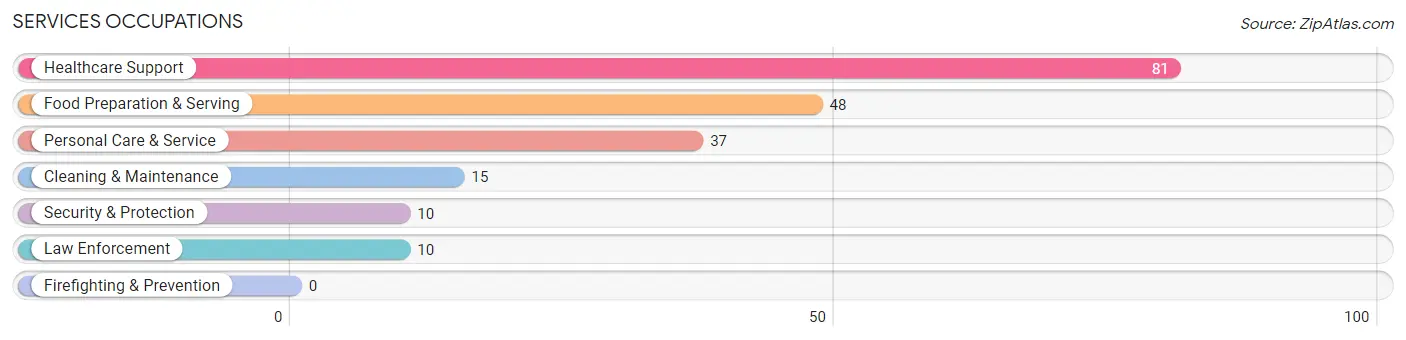
Services Occupations
The most common Services occupations in Lake Mills are Healthcare Support (81 | 7.9%), Food Preparation & Serving (48 | 4.7%), Personal Care & Service (37 | 3.6%), Cleaning & Maintenance (15 | 1.5%), and Security & Protection (10 | 1.0%).
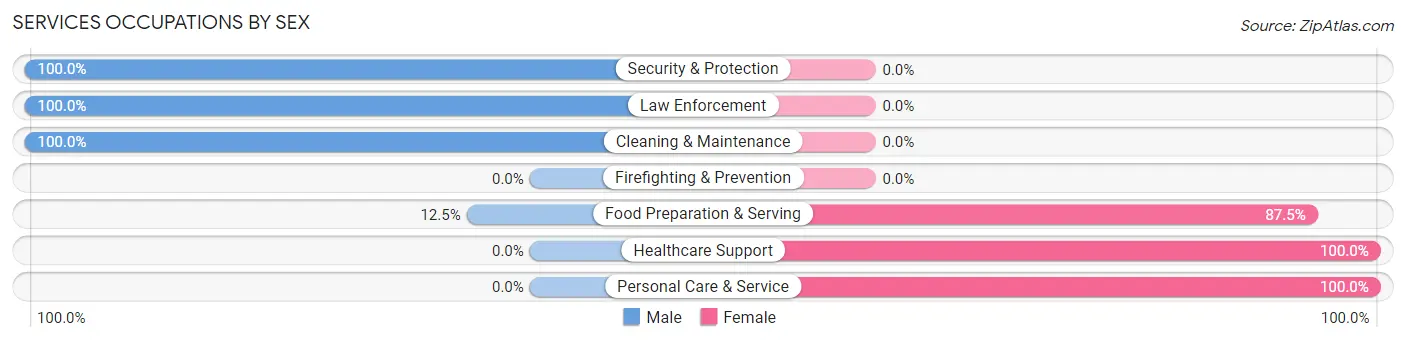
Services Occupations by Sex
Within the Services occupations in Lake Mills, the most male-oriented occupations are Security & Protection (100.0%), Law Enforcement (100.0%), and Cleaning & Maintenance (100.0%), while the most female-oriented occupations are Healthcare Support (100.0%), Personal Care & Service (100.0%), and Food Preparation & Serving (87.5%).
| Occupation | Male | Female |
| Healthcare Support | 0 (0.0%) | 81 (100.0%) |
| Security & Protection | 10 (100.0%) | 0 (0.0%) |
| Firefighting & Prevention | 0 (0.0%) | 0 (0.0%) |
| Law Enforcement | 10 (100.0%) | 0 (0.0%) |
| Food Preparation & Serving | 6 (12.5%) | 42 (87.5%) |
| Cleaning & Maintenance | 15 (100.0%) | 0 (0.0%) |
| Personal Care & Service | 0 (0.0%) | 37 (100.0%) |
| Total (Category) | 31 (16.2%) | 160 (83.8%) |
| Total (Overall) | 436 (42.3%) | 594 (57.7%) |
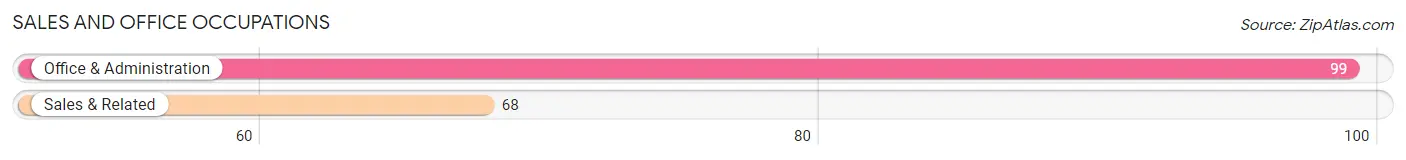
Sales and Office Occupations
The most common Sales and Office occupations in Lake Mills are Office & Administration (99 | 9.6%), and Sales & Related (68 | 6.6%).
Sales and Office Occupations by Sex
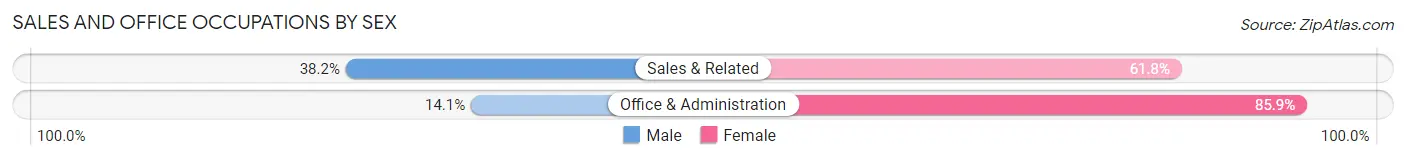
| Occupation | Male | Female |
| Sales & Related | 26 (38.2%) | 42 (61.8%) |
| Office & Administration | 14 (14.1%) | 85 (85.9%) |
| Total (Category) | 40 (23.9%) | 127 (76.0%) |
| Total (Overall) | 436 (42.3%) | 594 (57.7%) |
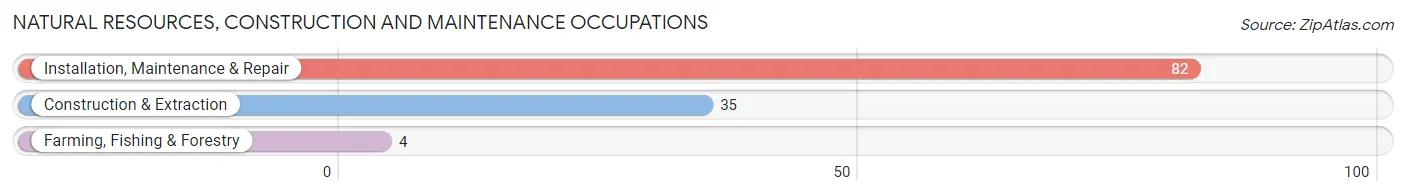
Natural Resources, Construction and Maintenance Occupations
The most common Natural Resources, Construction and Maintenance occupations in Lake Mills are Installation, Maintenance & Repair (82 | 8.0%), Construction & Extraction (35 | 3.4%), and Farming, Fishing & Forestry (4 | 0.4%).
Natural Resources, Construction and Maintenance Occupations by Sex
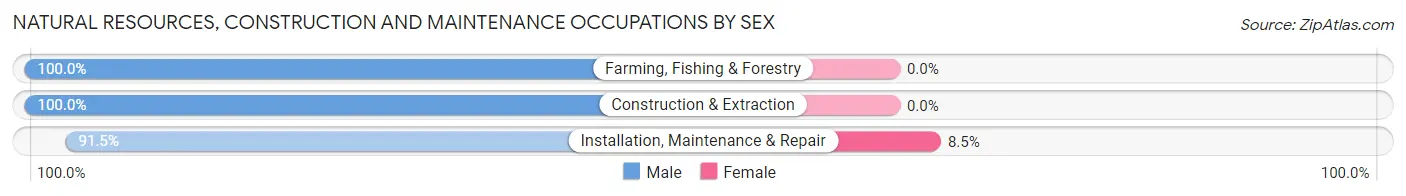
| Occupation | Male | Female |
| Farming, Fishing & Forestry | 4 (100.0%) | 0 (0.0%) |
| Construction & Extraction | 35 (100.0%) | 0 (0.0%) |
| Installation, Maintenance & Repair | 75 (91.5%) | 7 (8.5%) |
| Total (Category) | 114 (94.2%) | 7 (5.8%) |
| Total (Overall) | 436 (42.3%) | 594 (57.7%) |
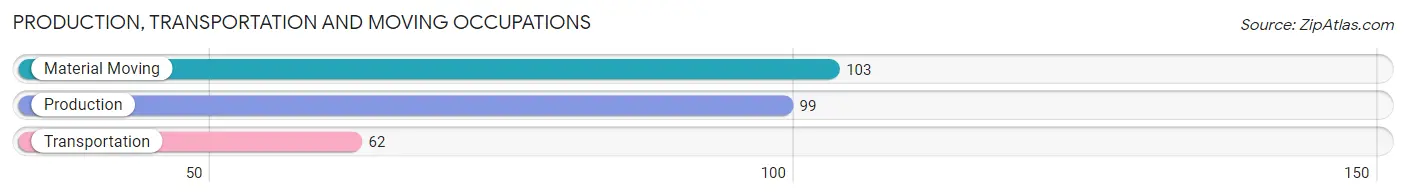
Production, Transportation and Moving Occupations
The most common Production, Transportation and Moving occupations in Lake Mills are Material Moving (103 | 10.0%), Production (99 | 9.6%), and Transportation (62 | 6.0%).
Production, Transportation and Moving Occupations by Sex
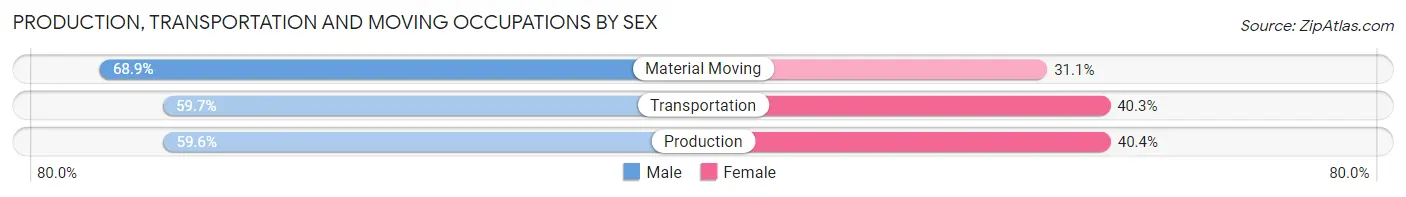
| Occupation | Male | Female |
| Production | 59 (59.6%) | 40 (40.4%) |
| Transportation | 37 (59.7%) | 25 (40.3%) |
| Material Moving | 71 (68.9%) | 32 (31.1%) |
| Total (Category) | 167 (63.3%) | 97 (36.7%) |
| Total (Overall) | 436 (42.3%) | 594 (57.7%) |
Employment Industries by Sex in Lake Mills
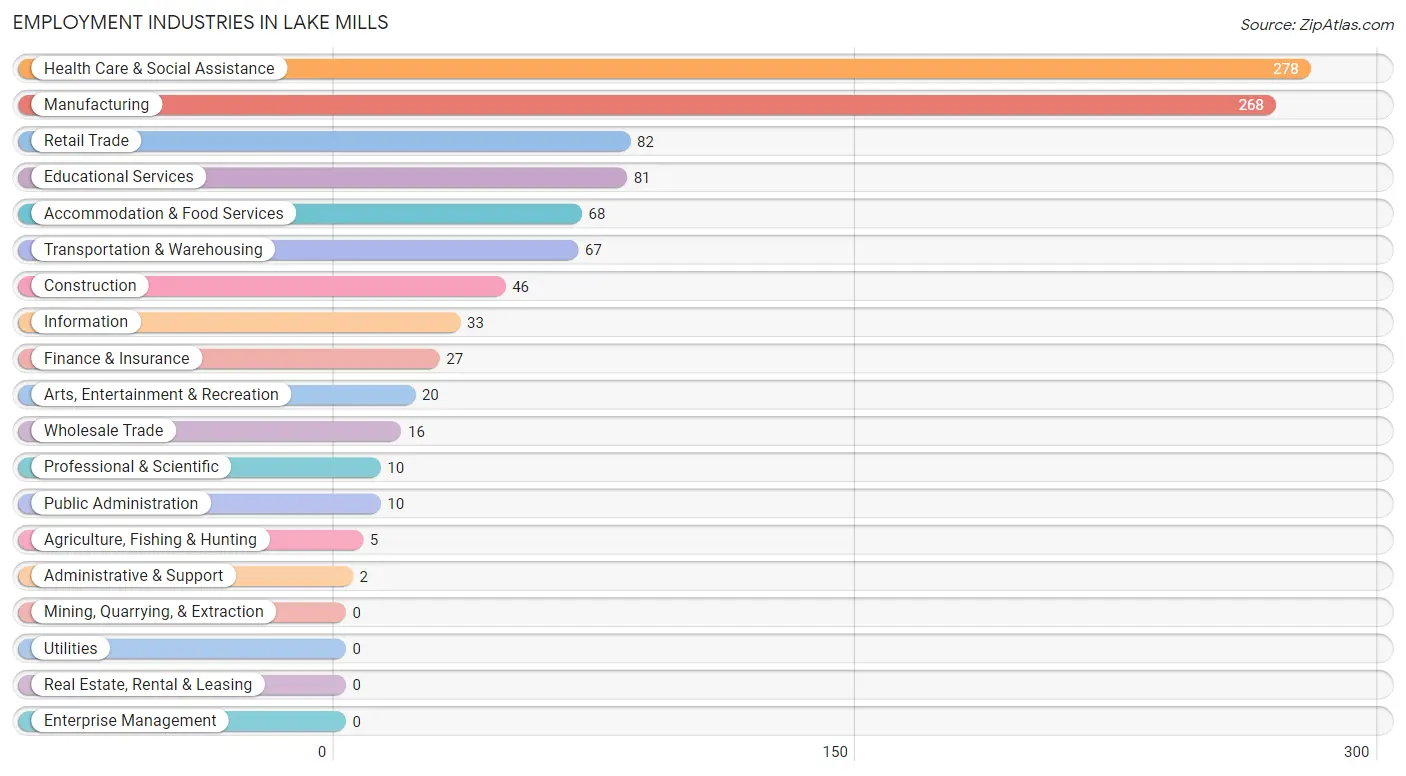
Employment Industries in Lake Mills
The major employment industries in Lake Mills include Health Care & Social Assistance (278 | 27.0%), Manufacturing (268 | 26.0%), Retail Trade (82 | 8.0%), Educational Services (81 | 7.9%), and Accommodation & Food Services (68 | 6.6%).
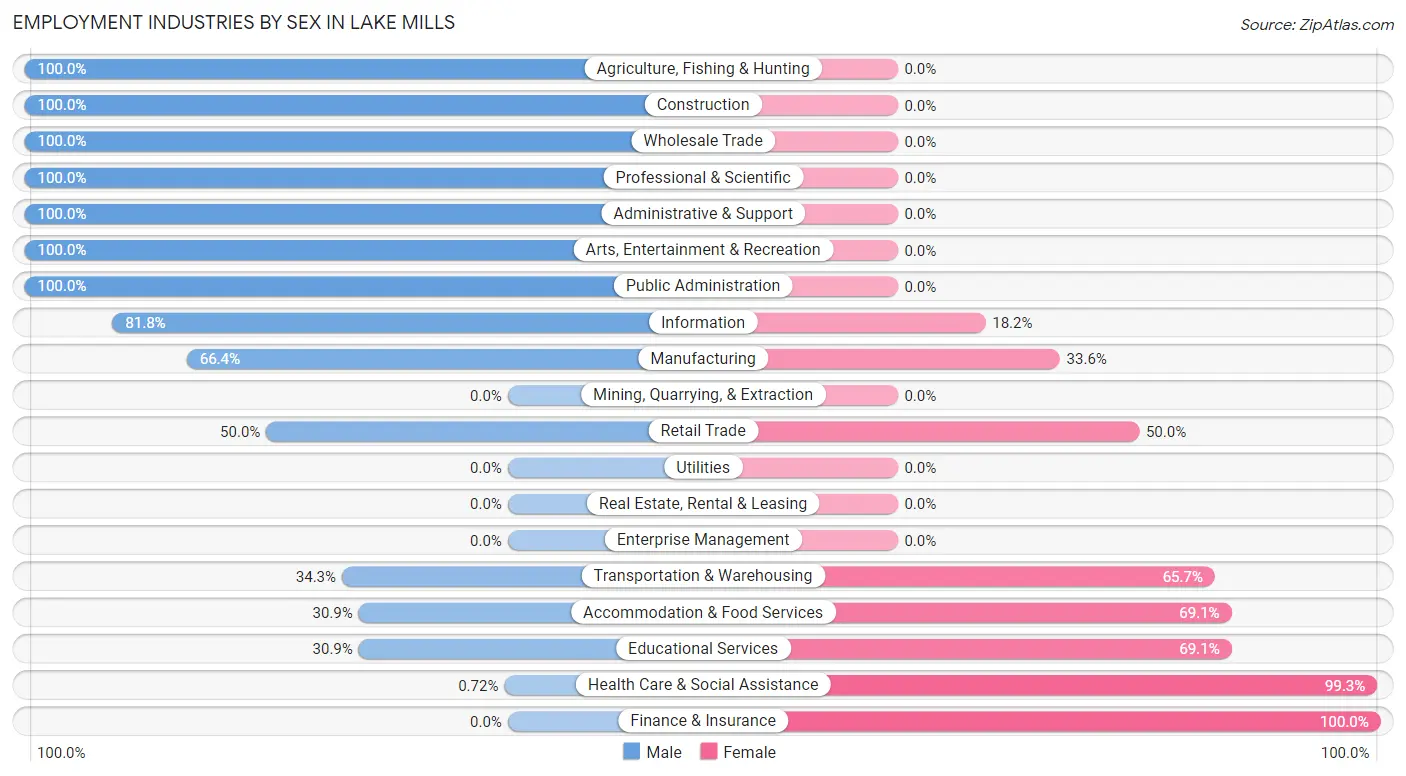
Employment Industries by Sex in Lake Mills
The Lake Mills industries that see more men than women are Agriculture, Fishing & Hunting (100.0%), Construction (100.0%), and Wholesale Trade (100.0%), whereas the industries that tend to have a higher number of women are Finance & Insurance (100.0%), Health Care & Social Assistance (99.3%), and Educational Services (69.1%).
| Industry | Male | Female |
| Agriculture, Fishing & Hunting | 5 (100.0%) | 0 (0.0%) |
| Mining, Quarrying, & Extraction | 0 (0.0%) | 0 (0.0%) |
| Construction | 46 (100.0%) | 0 (0.0%) |
| Manufacturing | 178 (66.4%) | 90 (33.6%) |
| Wholesale Trade | 16 (100.0%) | 0 (0.0%) |
| Retail Trade | 41 (50.0%) | 41 (50.0%) |
| Transportation & Warehousing | 23 (34.3%) | 44 (65.7%) |
| Utilities | 0 (0.0%) | 0 (0.0%) |
| Information | 27 (81.8%) | 6 (18.2%) |
| Finance & Insurance | 0 (0.0%) | 27 (100.0%) |
| Real Estate, Rental & Leasing | 0 (0.0%) | 0 (0.0%) |
| Professional & Scientific | 10 (100.0%) | 0 (0.0%) |
| Enterprise Management | 0 (0.0%) | 0 (0.0%) |
| Administrative & Support | 2 (100.0%) | 0 (0.0%) |
| Educational Services | 25 (30.9%) | 56 (69.1%) |
| Health Care & Social Assistance | 2 (0.7%) | 276 (99.3%) |
| Arts, Entertainment & Recreation | 20 (100.0%) | 0 (0.0%) |
| Accommodation & Food Services | 21 (30.9%) | 47 (69.1%) |
| Public Administration | 10 (100.0%) | 0 (0.0%) |
| Total | 436 (42.3%) | 594 (57.7%) |
Education in Lake Mills
School Enrollment in Lake Mills
The most common levels of schooling among the 379 students in Lake Mills are high school (124 | 32.7%), middle school (91 | 24.0%), and elementary school (69 | 18.2%).
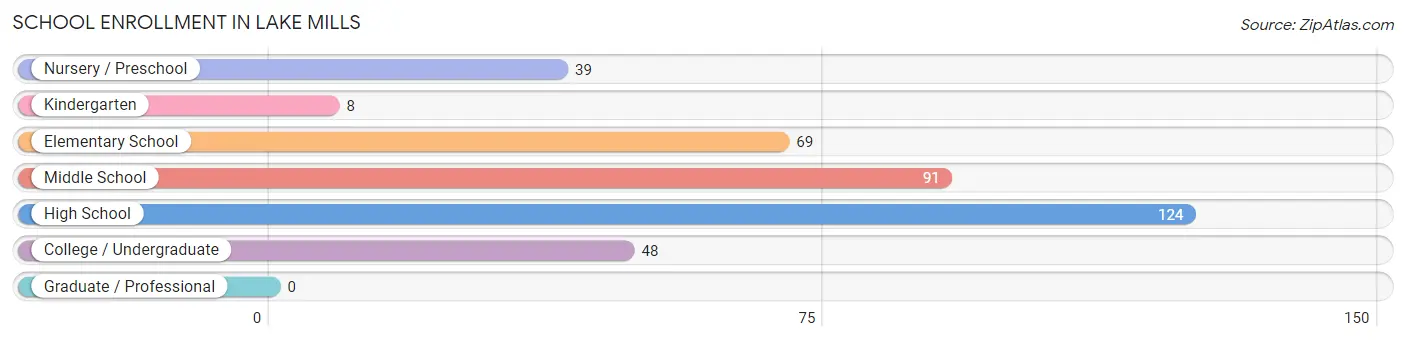
| School Level | # Students | % Students |
| Nursery / Preschool | 39 | 10.3% |
| Kindergarten | 8 | 2.1% |
| Elementary School | 69 | 18.2% |
| Middle School | 91 | 24.0% |
| High School | 124 | 32.7% |
| College / Undergraduate | 48 | 12.7% |
| Graduate / Professional | 0 | 0.0% |
| Total | 379 | 100.0% |
School Enrollment by Age by Funding Source in Lake Mills
Out of a total of 379 students who are enrolled in schools in Lake Mills, 6 (1.6%) attend a private institution, while the remaining 373 (98.4%) are enrolled in public schools. The age group of 18 to 19 year olds has the highest likelihood of being enrolled in private schools, with 6 (35.3% in the age bracket) enrolled. Conversely, the age group of 3 to 4 year olds has the lowest likelihood of being enrolled in a private school, with 18 (100.0% in the age bracket) attending a public institution.
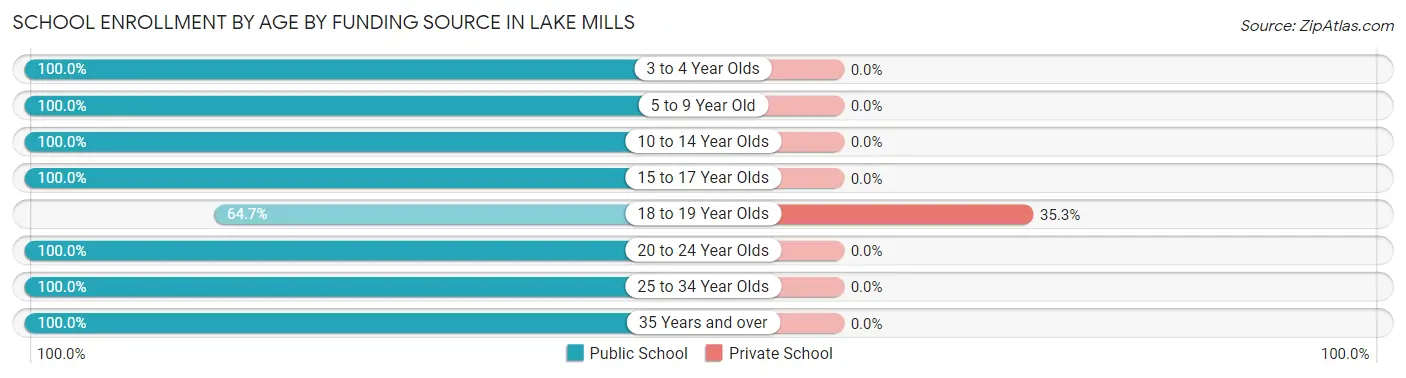
| Age Bracket | Public School | Private School |
| 3 to 4 Year Olds | 18 (100.0%) | 0 (0.0%) |
| 5 to 9 Year Old | 93 (100.0%) | 0 (0.0%) |
| 10 to 14 Year Olds | 112 (100.0%) | 0 (0.0%) |
| 15 to 17 Year Olds | 104 (100.0%) | 0 (0.0%) |
| 18 to 19 Year Olds | 11 (64.7%) | 6 (35.3%) |
| 20 to 24 Year Olds | 22 (100.0%) | 0 (0.0%) |
| 25 to 34 Year Olds | 7 (100.0%) | 0 (0.0%) |
| 35 Years and over | 6 (100.0%) | 0 (0.0%) |
| Total | 373 (98.4%) | 6 (1.6%) |
Educational Attainment by Field of Study in Lake Mills
Education (57 | 29.8%), science & technology (44 | 23.0%), communications (23 | 12.0%), arts & humanities (18 | 9.4%), and computers & mathematics (10 | 5.2%) are the most common fields of study among 191 individuals in Lake Mills who have obtained a bachelor's degree or higher.
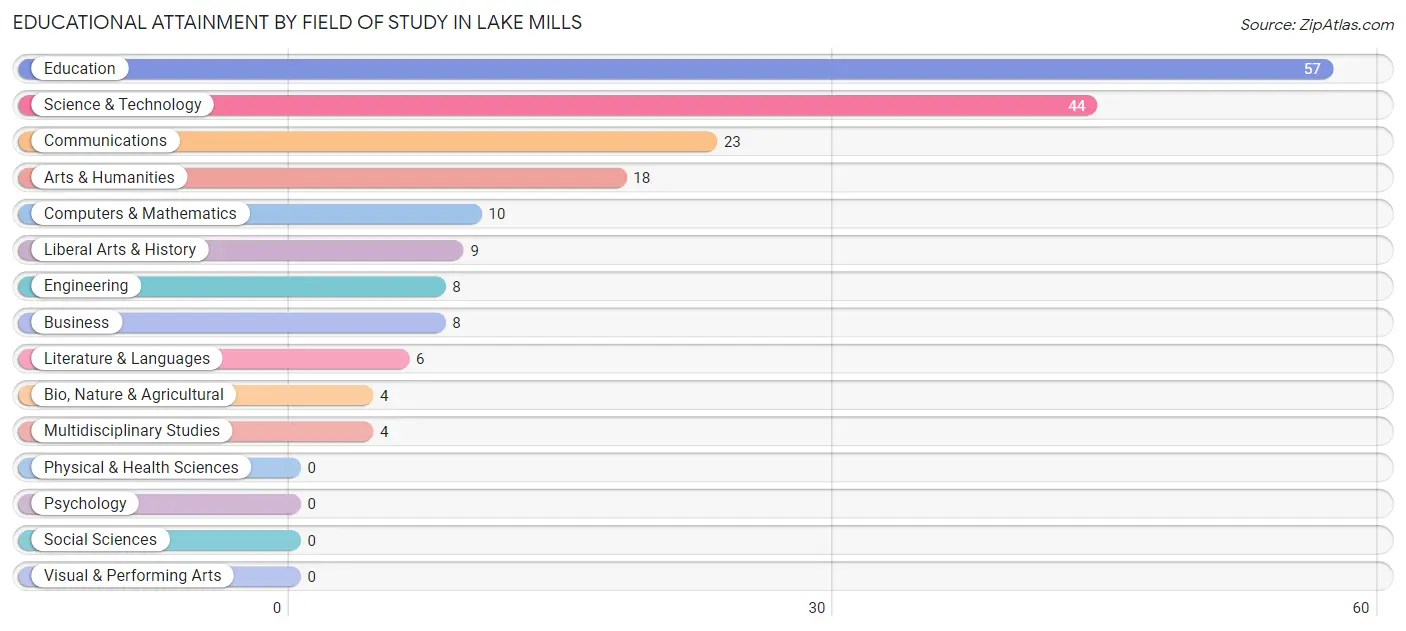
| Field of Study | # Graduates | % Graduates |
| Computers & Mathematics | 10 | 5.2% |
| Bio, Nature & Agricultural | 4 | 2.1% |
| Physical & Health Sciences | 0 | 0.0% |
| Psychology | 0 | 0.0% |
| Social Sciences | 0 | 0.0% |
| Engineering | 8 | 4.2% |
| Multidisciplinary Studies | 4 | 2.1% |
| Science & Technology | 44 | 23.0% |
| Business | 8 | 4.2% |
| Education | 57 | 29.8% |
| Literature & Languages | 6 | 3.1% |
| Liberal Arts & History | 9 | 4.7% |
| Visual & Performing Arts | 0 | 0.0% |
| Communications | 23 | 12.0% |
| Arts & Humanities | 18 | 9.4% |
| Total | 191 | 100.0% |
Transportation & Commute in Lake Mills
Vehicle Availability by Sex in Lake Mills
The most prevalent vehicle ownership categories in Lake Mills are males with 2 vehicles (230, accounting for 53.0%) and females with 2 vehicles (185, making up 43.6%).
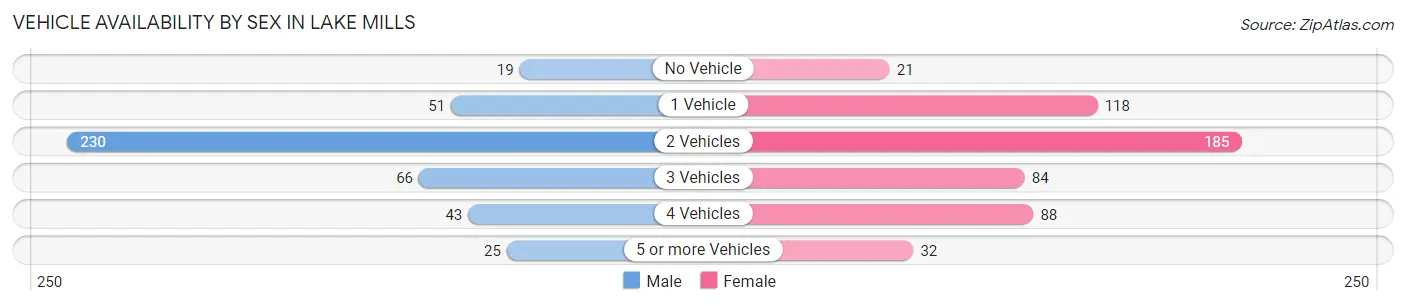
| Vehicles Available | Male | Female |
| No Vehicle | 19 (4.4%) | 21 (4.0%) |
| 1 Vehicle | 51 (11.7%) | 118 (22.4%) |
| 2 Vehicles | 230 (53.0%) | 185 (35.0%) |
| 3 Vehicles | 66 (15.2%) | 84 (15.9%) |
| 4 Vehicles | 43 (9.9%) | 88 (16.7%) |
| 5 or more Vehicles | 25 (5.8%) | 32 (6.1%) |
| Total | 434 (100.0%) | 528 (100.0%) |
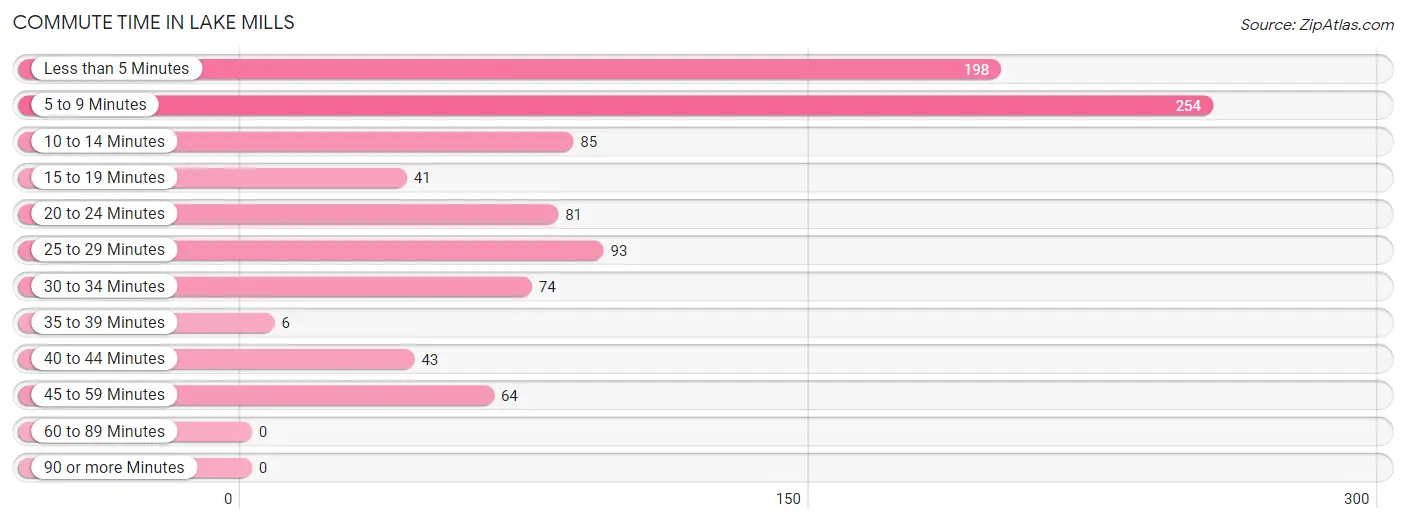
Commute Time in Lake Mills
The most frequently occuring commute durations in Lake Mills are 5 to 9 minutes (254 commuters, 27.1%), less than 5 minutes (198 commuters, 21.1%), and 25 to 29 minutes (93 commuters, 9.9%).
| Commute Time | # Commuters | % Commuters |
| Less than 5 Minutes | 198 | 21.1% |
| 5 to 9 Minutes | 254 | 27.1% |
| 10 to 14 Minutes | 85 | 9.0% |
| 15 to 19 Minutes | 41 | 4.4% |
| 20 to 24 Minutes | 81 | 8.6% |
| 25 to 29 Minutes | 93 | 9.9% |
| 30 to 34 Minutes | 74 | 7.9% |
| 35 to 39 Minutes | 6 | 0.6% |
| 40 to 44 Minutes | 43 | 4.6% |
| 45 to 59 Minutes | 64 | 6.8% |
| 60 to 89 Minutes | 0 | 0.0% |
| 90 or more Minutes | 0 | 0.0% |
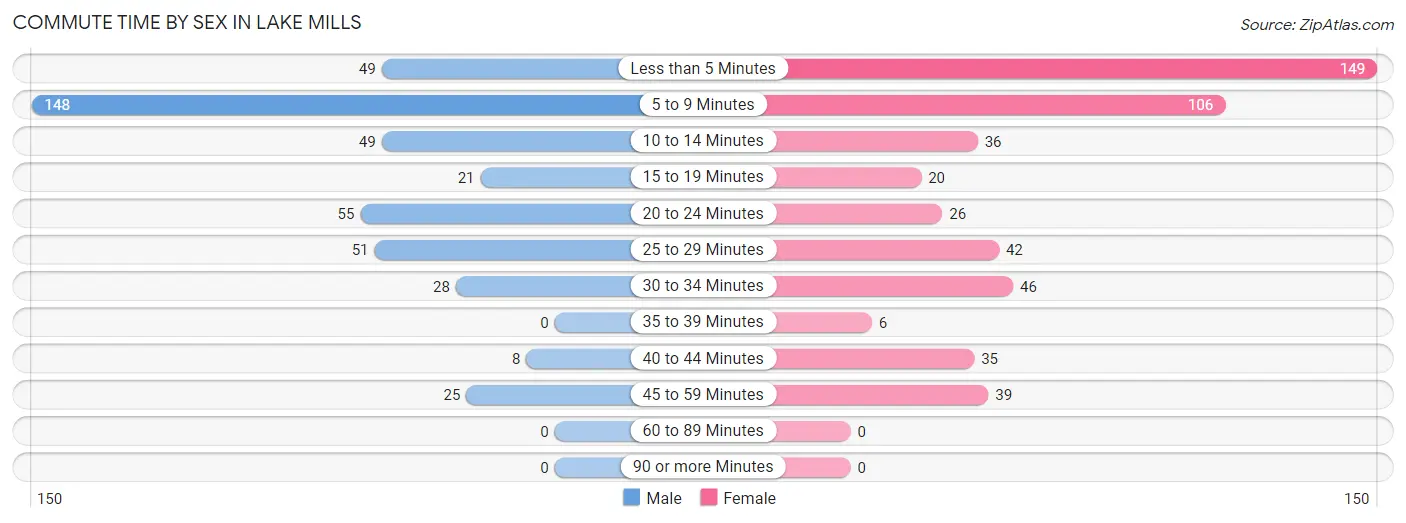
Commute Time by Sex in Lake Mills
The most common commute times in Lake Mills are 5 to 9 minutes (148 commuters, 34.1%) for males and less than 5 minutes (149 commuters, 29.5%) for females.
| Commute Time | Male | Female |
| Less than 5 Minutes | 49 (11.3%) | 149 (29.5%) |
| 5 to 9 Minutes | 148 (34.1%) | 106 (21.0%) |
| 10 to 14 Minutes | 49 (11.3%) | 36 (7.1%) |
| 15 to 19 Minutes | 21 (4.8%) | 20 (4.0%) |
| 20 to 24 Minutes | 55 (12.7%) | 26 (5.1%) |
| 25 to 29 Minutes | 51 (11.7%) | 42 (8.3%) |
| 30 to 34 Minutes | 28 (6.5%) | 46 (9.1%) |
| 35 to 39 Minutes | 0 (0.0%) | 6 (1.2%) |
| 40 to 44 Minutes | 8 (1.8%) | 35 (6.9%) |
| 45 to 59 Minutes | 25 (5.8%) | 39 (7.7%) |
| 60 to 89 Minutes | 0 (0.0%) | 0 (0.0%) |
| 90 or more Minutes | 0 (0.0%) | 0 (0.0%) |
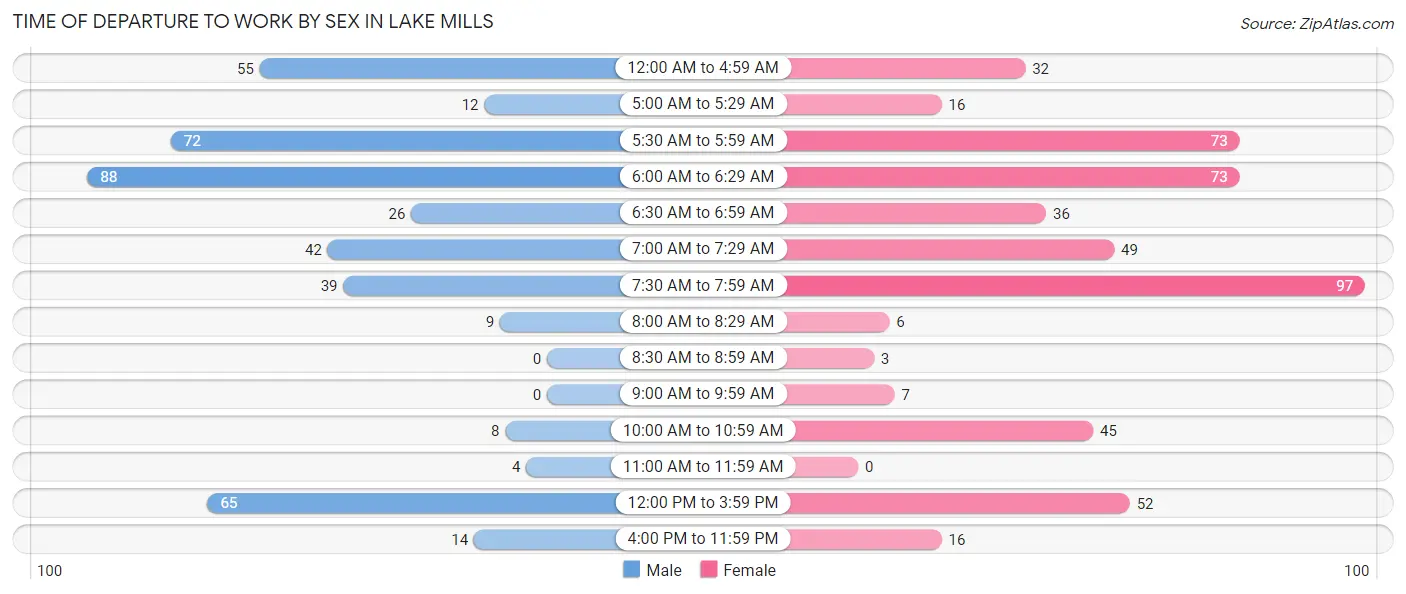
Time of Departure to Work by Sex in Lake Mills
The most frequent times of departure to work in Lake Mills are 6:00 AM to 6:29 AM (88, 20.3%) for males and 7:30 AM to 7:59 AM (97, 19.2%) for females.
| Time of Departure | Male | Female |
| 12:00 AM to 4:59 AM | 55 (12.7%) | 32 (6.3%) |
| 5:00 AM to 5:29 AM | 12 (2.8%) | 16 (3.2%) |
| 5:30 AM to 5:59 AM | 72 (16.6%) | 73 (14.5%) |
| 6:00 AM to 6:29 AM | 88 (20.3%) | 73 (14.5%) |
| 6:30 AM to 6:59 AM | 26 (6.0%) | 36 (7.1%) |
| 7:00 AM to 7:29 AM | 42 (9.7%) | 49 (9.7%) |
| 7:30 AM to 7:59 AM | 39 (9.0%) | 97 (19.2%) |
| 8:00 AM to 8:29 AM | 9 (2.1%) | 6 (1.2%) |
| 8:30 AM to 8:59 AM | 0 (0.0%) | 3 (0.6%) |
| 9:00 AM to 9:59 AM | 0 (0.0%) | 7 (1.4%) |
| 10:00 AM to 10:59 AM | 8 (1.8%) | 45 (8.9%) |
| 11:00 AM to 11:59 AM | 4 (0.9%) | 0 (0.0%) |
| 12:00 PM to 3:59 PM | 65 (15.0%) | 52 (10.3%) |
| 4:00 PM to 11:59 PM | 14 (3.2%) | 16 (3.2%) |
| Total | 434 (100.0%) | 505 (100.0%) |
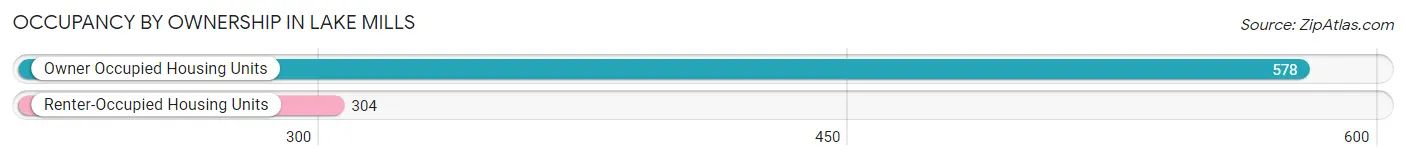
Housing Occupancy in Lake Mills
Occupancy by Ownership in Lake Mills
Of the total 882 dwellings in Lake Mills, owner-occupied units account for 578 (65.5%), while renter-occupied units make up 304 (34.5%).
| Occupancy | # Housing Units | % Housing Units |
| Owner Occupied Housing Units | 578 | 65.5% |
| Renter-Occupied Housing Units | 304 | 34.5% |
| Total Occupied Housing Units | 882 | 100.0% |
Occupancy by Household Size in Lake Mills
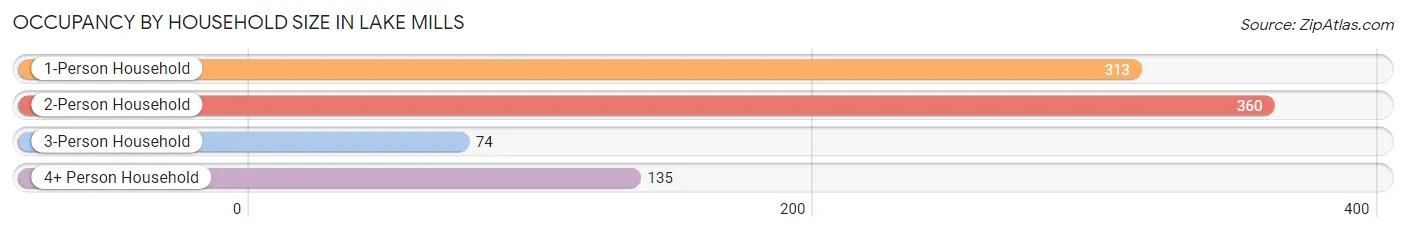
| Household Size | # Housing Units | % Housing Units |
| 1-Person Household | 313 | 35.5% |
| 2-Person Household | 360 | 40.8% |
| 3-Person Household | 74 | 8.4% |
| 4+ Person Household | 135 | 15.3% |
| Total Housing Units | 882 | 100.0% |
Occupancy by Ownership by Household Size in Lake Mills
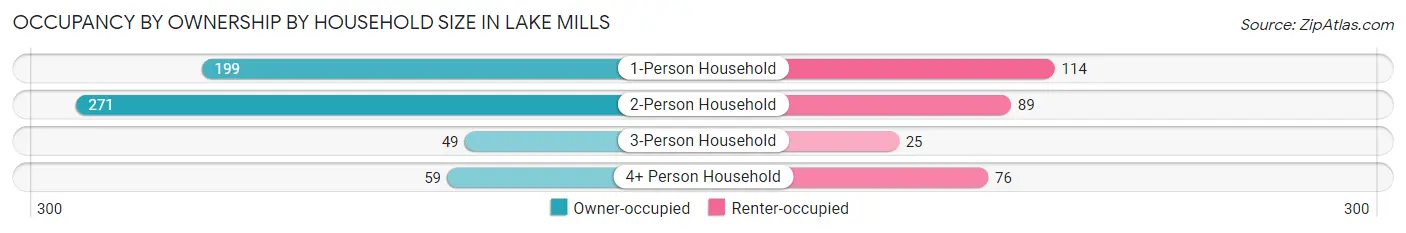
| Household Size | Owner-occupied | Renter-occupied |
| 1-Person Household | 199 (63.6%) | 114 (36.4%) |
| 2-Person Household | 271 (75.3%) | 89 (24.7%) |
| 3-Person Household | 49 (66.2%) | 25 (33.8%) |
| 4+ Person Household | 59 (43.7%) | 76 (56.3%) |
| Total Housing Units | 578 (65.5%) | 304 (34.5%) |
Occupancy by Educational Attainment in Lake Mills
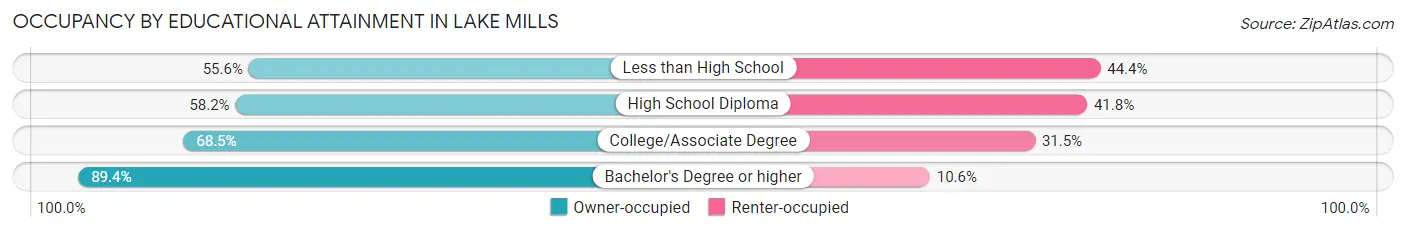
| Household Size | Owner-occupied | Renter-occupied |
| Less than High School | 35 (55.6%) | 28 (44.4%) |
| High School Diploma | 213 (58.2%) | 153 (41.8%) |
| College/Associate Degree | 246 (68.5%) | 113 (31.5%) |
| Bachelor's Degree or higher | 84 (89.4%) | 10 (10.6%) |
Occupancy by Age of Householder in Lake Mills
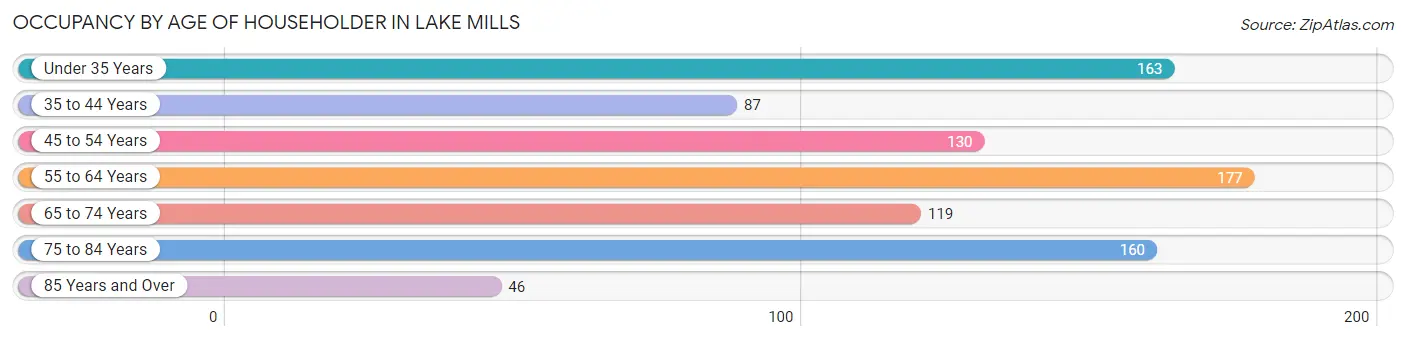
| Age Bracket | # Households | % Households |
| Under 35 Years | 163 | 18.5% |
| 35 to 44 Years | 87 | 9.9% |
| 45 to 54 Years | 130 | 14.7% |
| 55 to 64 Years | 177 | 20.1% |
| 65 to 74 Years | 119 | 13.5% |
| 75 to 84 Years | 160 | 18.1% |
| 85 Years and Over | 46 | 5.2% |
| Total | 882 | 100.0% |
Housing Finances in Lake Mills
Median Income by Occupancy in Lake Mills
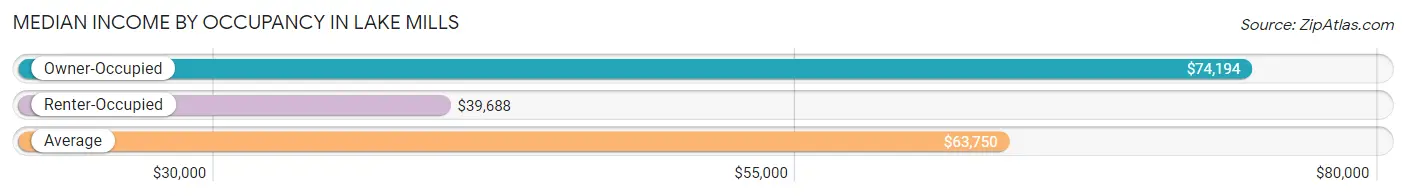
| Occupancy Type | # Households | Median Income |
| Owner-Occupied | 578 (65.5%) | $74,194 |
| Renter-Occupied | 304 (34.5%) | $39,688 |
| Average | 882 (100.0%) | $63,750 |
Occupancy by Householder Income Bracket in Lake Mills
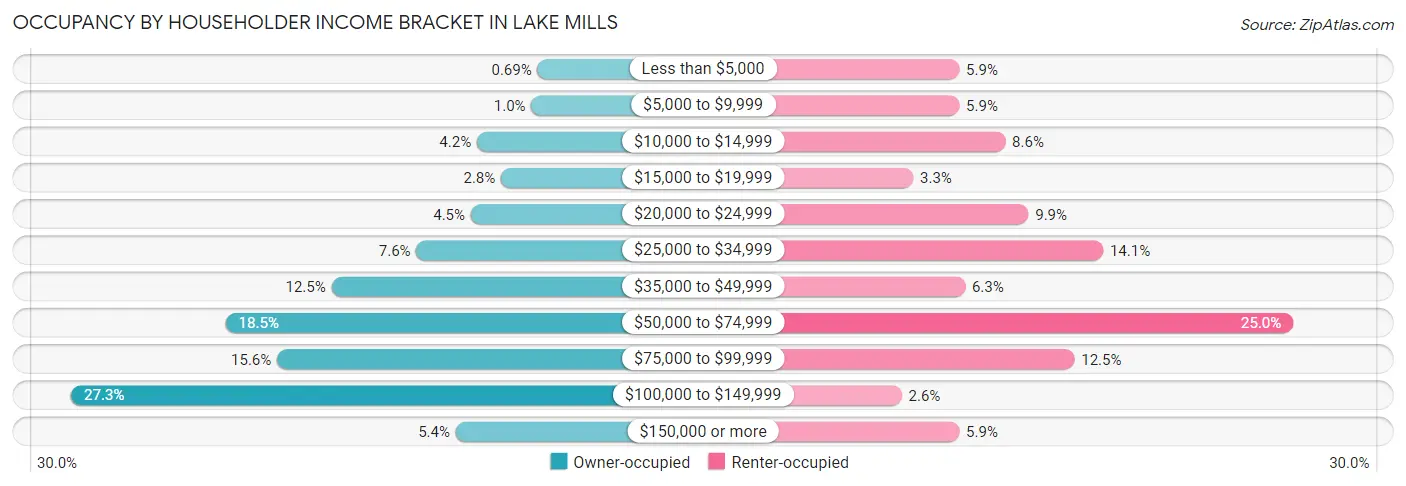
| Income Bracket | Owner-occupied | Renter-occupied |
| Less than $5,000 | 4 (0.7%) | 18 (5.9%) |
| $5,000 to $9,999 | 6 (1.0%) | 18 (5.9%) |
| $10,000 to $14,999 | 24 (4.2%) | 26 (8.6%) |
| $15,000 to $19,999 | 16 (2.8%) | 10 (3.3%) |
| $20,000 to $24,999 | 26 (4.5%) | 30 (9.9%) |
| $25,000 to $34,999 | 44 (7.6%) | 43 (14.1%) |
| $35,000 to $49,999 | 72 (12.5%) | 19 (6.2%) |
| $50,000 to $74,999 | 107 (18.5%) | 76 (25.0%) |
| $75,000 to $99,999 | 90 (15.6%) | 38 (12.5%) |
| $100,000 to $149,999 | 158 (27.3%) | 8 (2.6%) |
| $150,000 or more | 31 (5.4%) | 18 (5.9%) |
| Total | 578 (100.0%) | 304 (100.0%) |
Monthly Housing Cost Tiers in Lake Mills
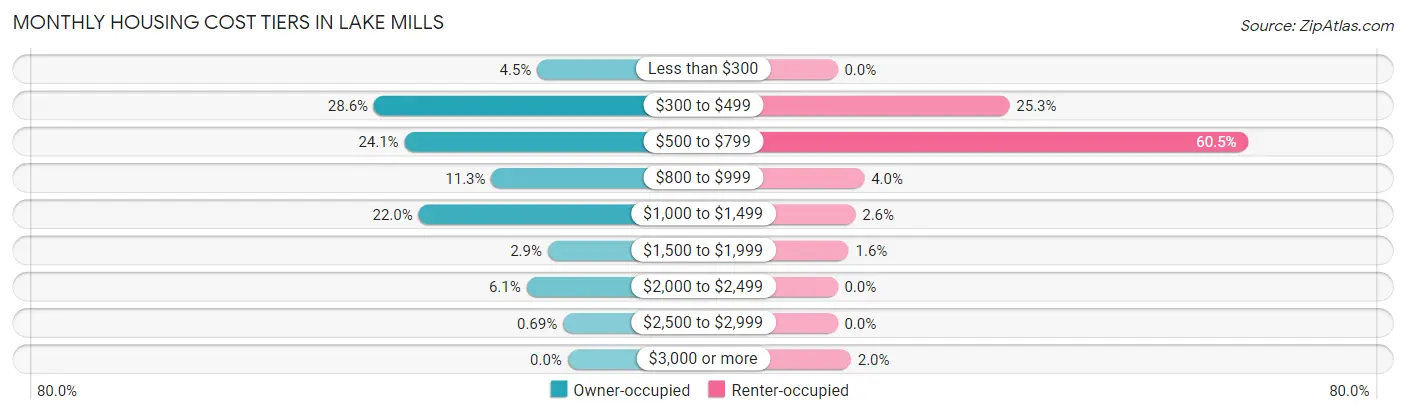
| Monthly Cost | Owner-occupied | Renter-occupied |
| Less than $300 | 26 (4.5%) | 0 (0.0%) |
| $300 to $499 | 165 (28.5%) | 77 (25.3%) |
| $500 to $799 | 139 (24.0%) | 184 (60.5%) |
| $800 to $999 | 65 (11.3%) | 12 (4.0%) |
| $1,000 to $1,499 | 127 (22.0%) | 8 (2.6%) |
| $1,500 to $1,999 | 17 (2.9%) | 5 (1.6%) |
| $2,000 to $2,499 | 35 (6.1%) | 0 (0.0%) |
| $2,500 to $2,999 | 4 (0.7%) | 0 (0.0%) |
| $3,000 or more | 0 (0.0%) | 6 (2.0%) |
| Total | 578 (100.0%) | 304 (100.0%) |
Physical Housing Characteristics in Lake Mills
Housing Structures in Lake Mills
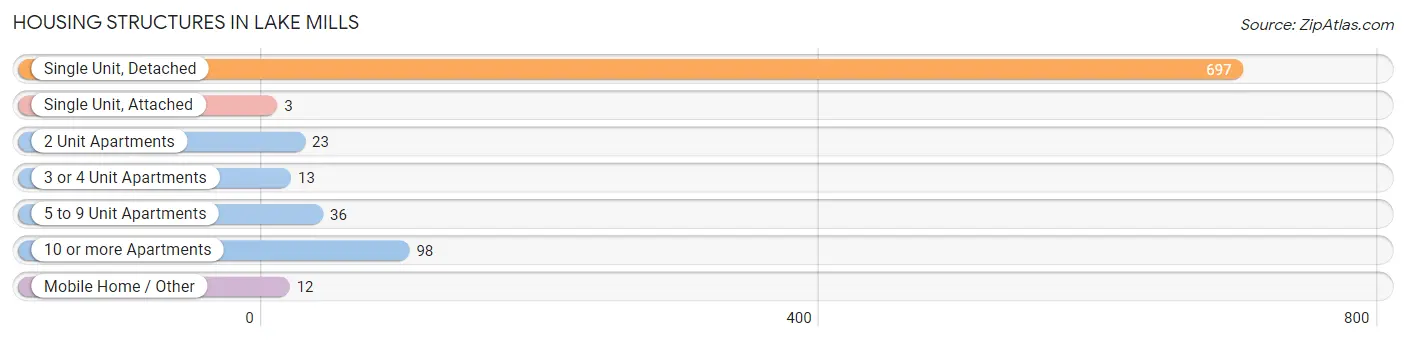
| Structure Type | # Housing Units | % Housing Units |
| Single Unit, Detached | 697 | 79.0% |
| Single Unit, Attached | 3 | 0.3% |
| 2 Unit Apartments | 23 | 2.6% |
| 3 or 4 Unit Apartments | 13 | 1.5% |
| 5 to 9 Unit Apartments | 36 | 4.1% |
| 10 or more Apartments | 98 | 11.1% |
| Mobile Home / Other | 12 | 1.4% |
| Total | 882 | 100.0% |
Housing Structures by Occupancy in Lake Mills
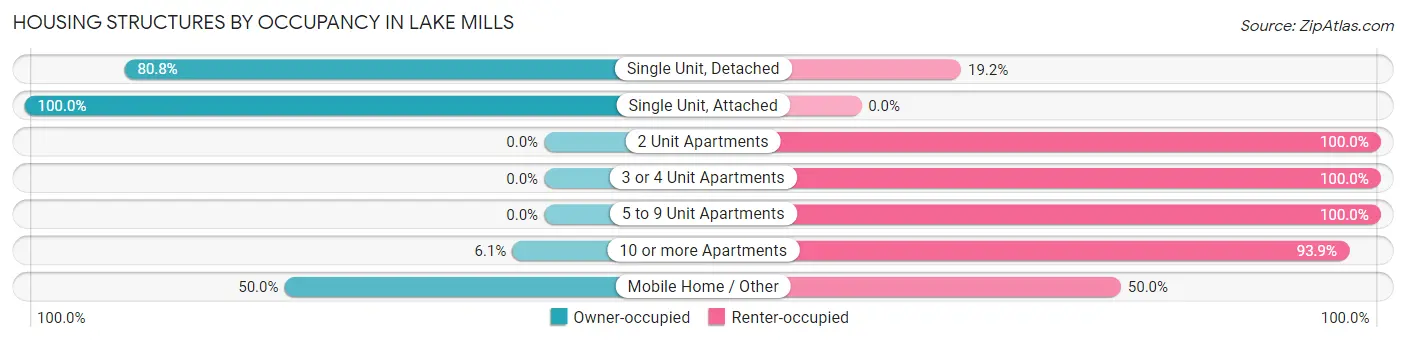
| Structure Type | Owner-occupied | Renter-occupied |
| Single Unit, Detached | 563 (80.8%) | 134 (19.2%) |
| Single Unit, Attached | 3 (100.0%) | 0 (0.0%) |
| 2 Unit Apartments | 0 (0.0%) | 23 (100.0%) |
| 3 or 4 Unit Apartments | 0 (0.0%) | 13 (100.0%) |
| 5 to 9 Unit Apartments | 0 (0.0%) | 36 (100.0%) |
| 10 or more Apartments | 6 (6.1%) | 92 (93.9%) |
| Mobile Home / Other | 6 (50.0%) | 6 (50.0%) |
| Total | 578 (65.5%) | 304 (34.5%) |
Housing Structures by Number of Rooms in Lake Mills
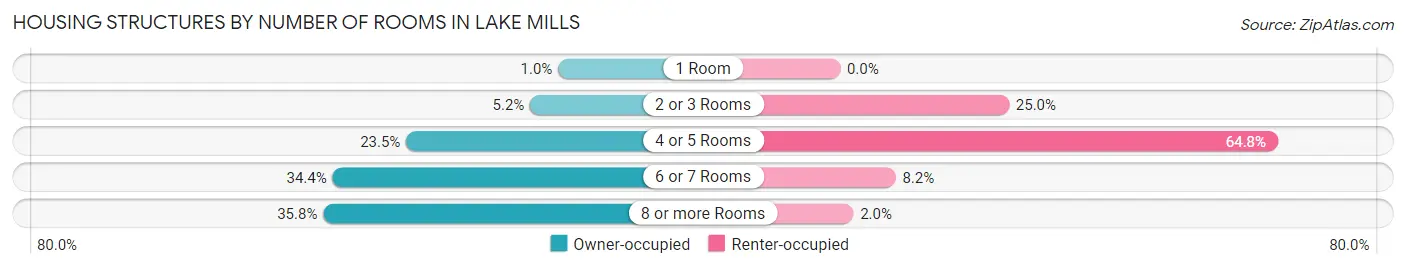
| Number of Rooms | Owner-occupied | Renter-occupied |
| 1 Room | 6 (1.0%) | 0 (0.0%) |
| 2 or 3 Rooms | 30 (5.2%) | 76 (25.0%) |
| 4 or 5 Rooms | 136 (23.5%) | 197 (64.8%) |
| 6 or 7 Rooms | 199 (34.4%) | 25 (8.2%) |
| 8 or more Rooms | 207 (35.8%) | 6 (2.0%) |
| Total | 578 (100.0%) | 304 (100.0%) |
Housing Structure by Heating Type in Lake Mills
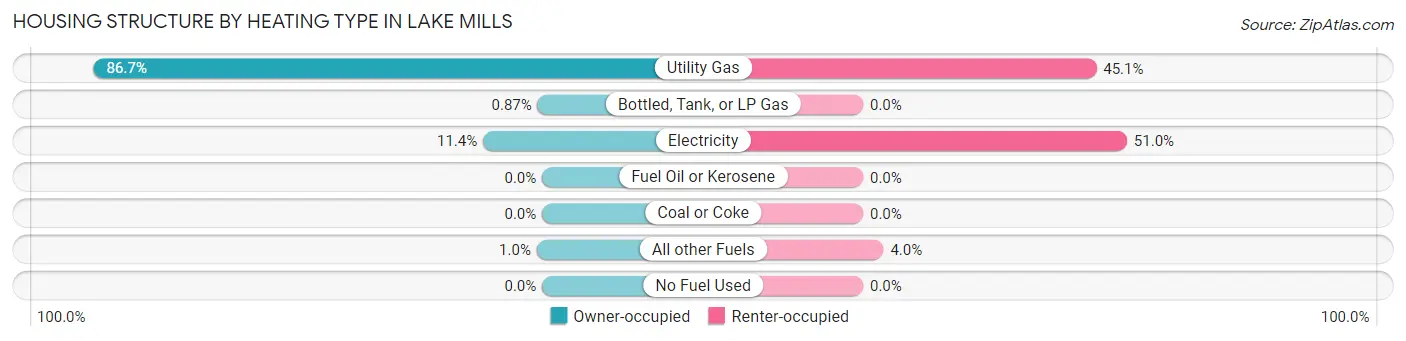
| Heating Type | Owner-occupied | Renter-occupied |
| Utility Gas | 501 (86.7%) | 137 (45.1%) |
| Bottled, Tank, or LP Gas | 5 (0.9%) | 0 (0.0%) |
| Electricity | 66 (11.4%) | 155 (51.0%) |
| Fuel Oil or Kerosene | 0 (0.0%) | 0 (0.0%) |
| Coal or Coke | 0 (0.0%) | 0 (0.0%) |
| All other Fuels | 6 (1.0%) | 12 (4.0%) |
| No Fuel Used | 0 (0.0%) | 0 (0.0%) |
| Total | 578 (100.0%) | 304 (100.0%) |
Household Vehicle Usage in Lake Mills
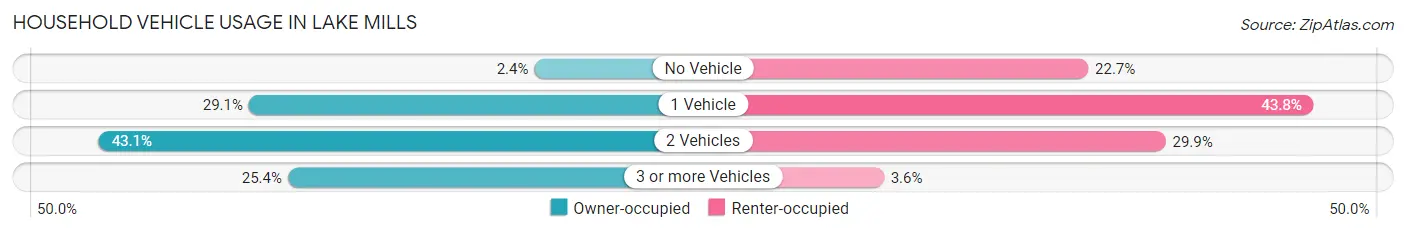
| Vehicles per Household | Owner-occupied | Renter-occupied |
| No Vehicle | 14 (2.4%) | 69 (22.7%) |
| 1 Vehicle | 168 (29.1%) | 133 (43.8%) |
| 2 Vehicles | 249 (43.1%) | 91 (29.9%) |
| 3 or more Vehicles | 147 (25.4%) | 11 (3.6%) |
| Total | 578 (100.0%) | 304 (100.0%) |
Real Estate & Mortgages in Lake Mills
Real Estate and Mortgage Overview in Lake Mills
| Characteristic | Without Mortgage | With Mortgage |
| Housing Units | 298 | 280 |
| Median Property Value | $98,700 | $141,000 |
| Median Household Income | $49,500 | $24 |
| Monthly Housing Costs | $434 | $0 |
| Real Estate Taxes | $1,580 | $4 |
Property Value by Mortgage Status in Lake Mills
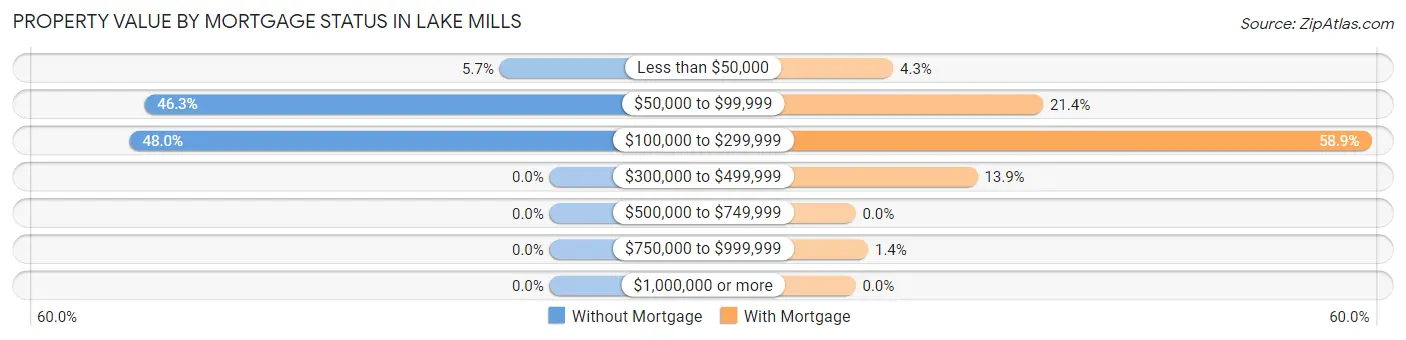
| Property Value | Without Mortgage | With Mortgage |
| Less than $50,000 | 17 (5.7%) | 12 (4.3%) |
| $50,000 to $99,999 | 138 (46.3%) | 60 (21.4%) |
| $100,000 to $299,999 | 143 (48.0%) | 165 (58.9%) |
| $300,000 to $499,999 | 0 (0.0%) | 39 (13.9%) |
| $500,000 to $749,999 | 0 (0.0%) | 0 (0.0%) |
| $750,000 to $999,999 | 0 (0.0%) | 4 (1.4%) |
| $1,000,000 or more | 0 (0.0%) | 0 (0.0%) |
| Total | 298 (100.0%) | 280 (100.0%) |
Household Income by Mortgage Status in Lake Mills
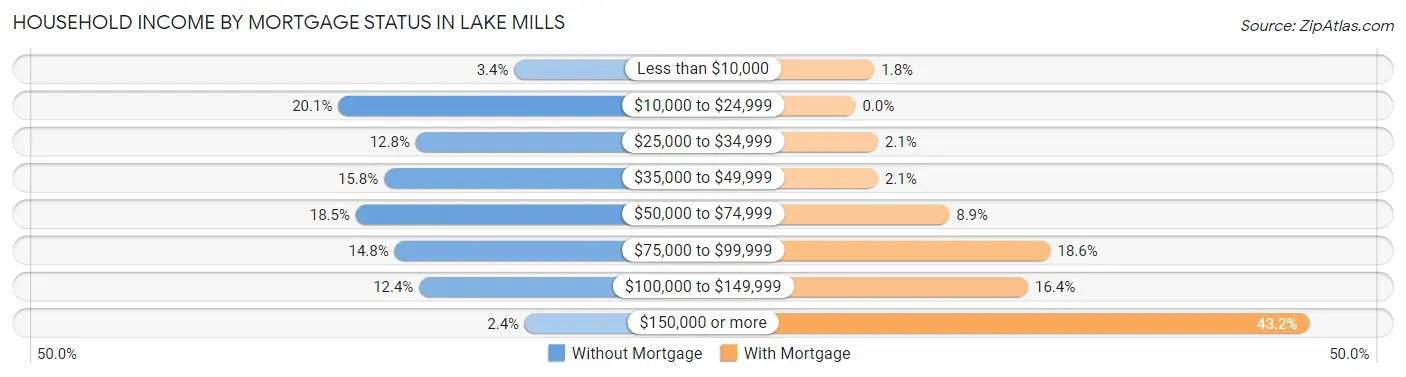
| Household Income | Without Mortgage | With Mortgage |
| Less than $10,000 | 10 (3.4%) | 5 (1.8%) |
| $10,000 to $24,999 | 60 (20.1%) | 0 (0.0%) |
| $25,000 to $34,999 | 38 (12.8%) | 6 (2.1%) |
| $35,000 to $49,999 | 47 (15.8%) | 6 (2.1%) |
| $50,000 to $74,999 | 55 (18.5%) | 25 (8.9%) |
| $75,000 to $99,999 | 44 (14.8%) | 52 (18.6%) |
| $100,000 to $149,999 | 37 (12.4%) | 46 (16.4%) |
| $150,000 or more | 7 (2.4%) | 121 (43.2%) |
| Total | 298 (100.0%) | 280 (100.0%) |
Property Value to Household Income Ratio in Lake Mills
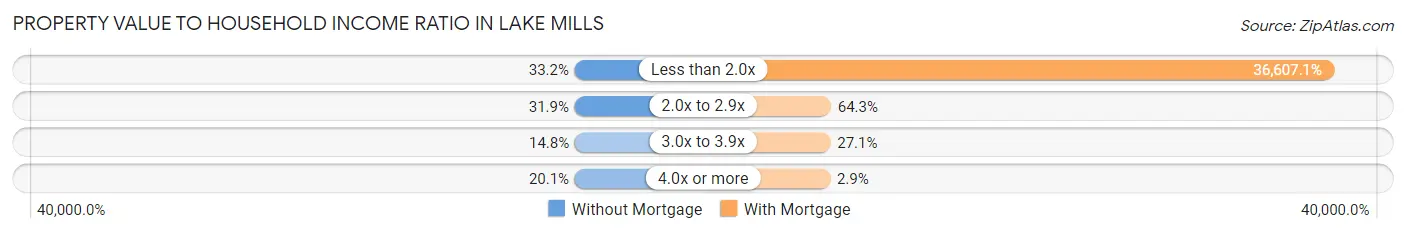
| Value-to-Income Ratio | Without Mortgage | With Mortgage |
| Less than 2.0x | 99 (33.2%) | 102,500 (36,607.1%) |
| 2.0x to 2.9x | 95 (31.9%) | 180 (64.3%) |
| 3.0x to 3.9x | 44 (14.8%) | 76 (27.1%) |
| 4.0x or more | 60 (20.1%) | 8 (2.9%) |
| Total | 298 (100.0%) | 280 (100.0%) |
Real Estate Taxes by Mortgage Status in Lake Mills
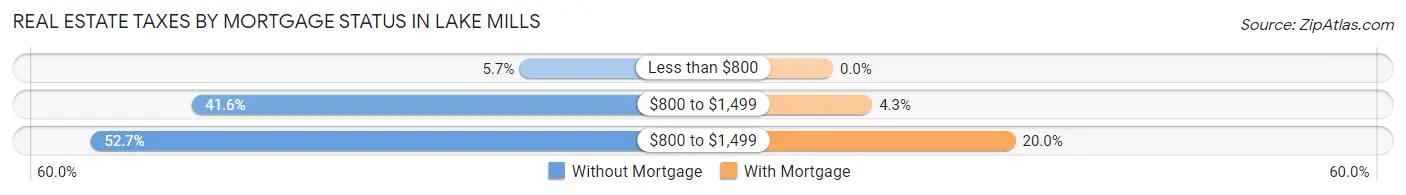
| Property Taxes | Without Mortgage | With Mortgage |
| Less than $800 | 17 (5.7%) | 0 (0.0%) |
| $800 to $1,499 | 124 (41.6%) | 12 (4.3%) |
| $800 to $1,499 | 157 (52.7%) | 56 (20.0%) |
| Total | 298 (100.0%) | 280 (100.0%) |
Health & Disability in Lake Mills
Health Insurance Coverage by Age in Lake Mills
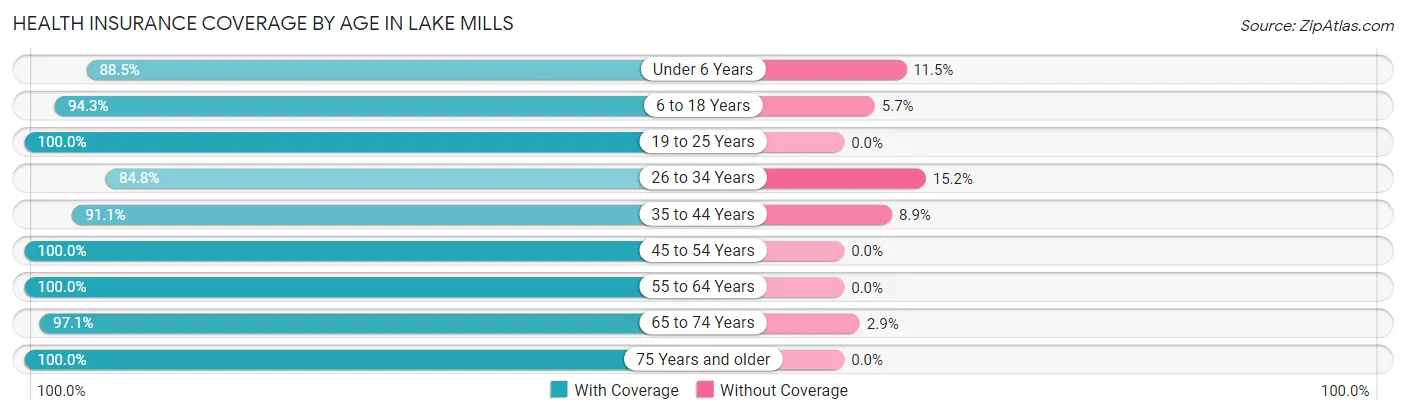
| Age Bracket | With Coverage | Without Coverage |
| Under 6 Years | 69 (88.5%) | 9 (11.5%) |
| 6 to 18 Years | 298 (94.3%) | 18 (5.7%) |
| 19 to 25 Years | 148 (100.0%) | 0 (0.0%) |
| 26 to 34 Years | 173 (84.8%) | 31 (15.2%) |
| 35 to 44 Years | 184 (91.1%) | 18 (8.9%) |
| 45 to 54 Years | 206 (100.0%) | 0 (0.0%) |
| 55 to 64 Years | 273 (100.0%) | 0 (0.0%) |
| 65 to 74 Years | 167 (97.1%) | 5 (2.9%) |
| 75 Years and older | 315 (100.0%) | 0 (0.0%) |
| Total | 1,833 (95.8%) | 81 (4.2%) |
Health Insurance Coverage by Citizenship Status in Lake Mills
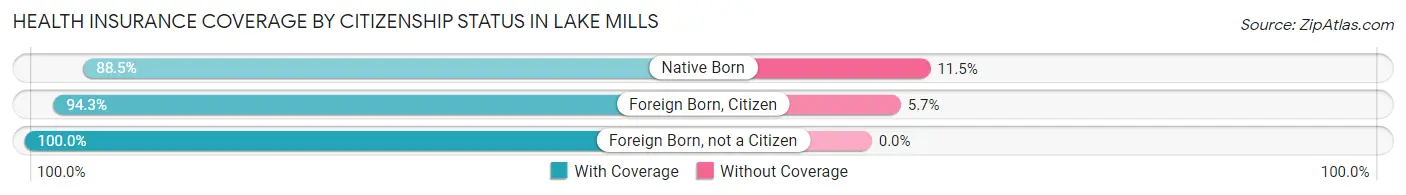
| Citizenship Status | With Coverage | Without Coverage |
| Native Born | 69 (88.5%) | 9 (11.5%) |
| Foreign Born, Citizen | 298 (94.3%) | 18 (5.7%) |
| Foreign Born, not a Citizen | 148 (100.0%) | 0 (0.0%) |
Health Insurance Coverage by Household Income in Lake Mills
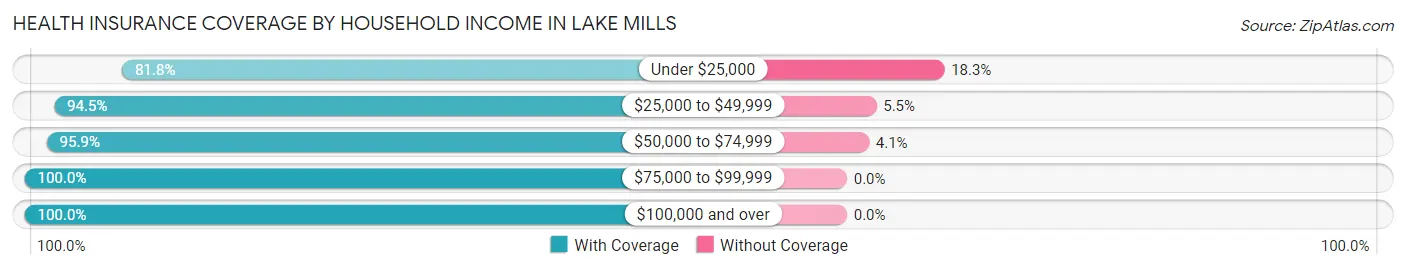
| Household Income | With Coverage | Without Coverage |
| Under $25,000 | 206 (81.8%) | 46 (18.2%) |
| $25,000 to $49,999 | 308 (94.5%) | 18 (5.5%) |
| $50,000 to $74,999 | 395 (95.9%) | 17 (4.1%) |
| $75,000 to $99,999 | 257 (100.0%) | 0 (0.0%) |
| $100,000 and over | 667 (100.0%) | 0 (0.0%) |
Public vs Private Health Insurance Coverage by Age in Lake Mills
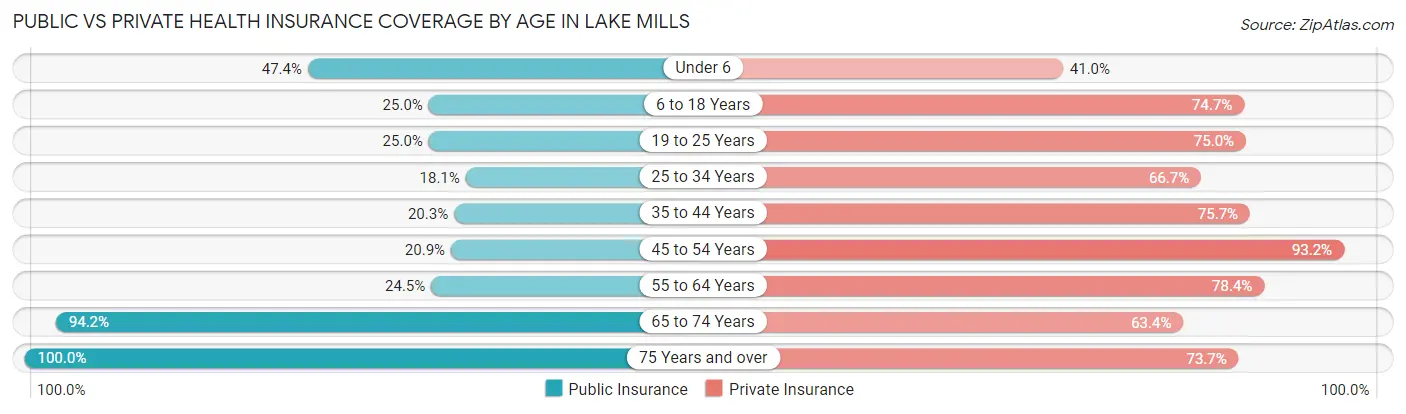
| Age Bracket | Public Insurance | Private Insurance |
| Under 6 | 37 (47.4%) | 32 (41.0%) |
| 6 to 18 Years | 79 (25.0%) | 236 (74.7%) |
| 19 to 25 Years | 37 (25.0%) | 111 (75.0%) |
| 25 to 34 Years | 37 (18.1%) | 136 (66.7%) |
| 35 to 44 Years | 41 (20.3%) | 153 (75.7%) |
| 45 to 54 Years | 43 (20.9%) | 192 (93.2%) |
| 55 to 64 Years | 67 (24.5%) | 214 (78.4%) |
| 65 to 74 Years | 162 (94.2%) | 109 (63.4%) |
| 75 Years and over | 315 (100.0%) | 232 (73.7%) |
| Total | 818 (42.7%) | 1,415 (73.9%) |
Disability Status by Sex by Age in Lake Mills
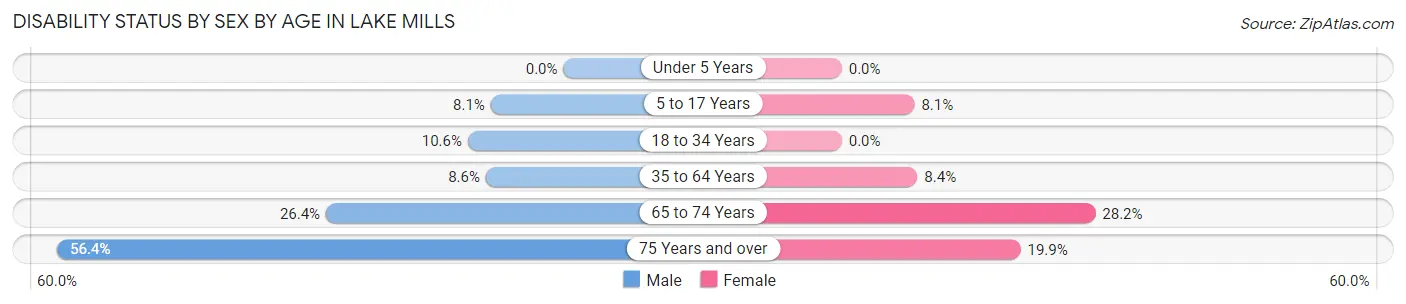
| Age Bracket | Male | Female |
| Under 5 Years | 0 (0.0%) | 0 (0.0%) |
| 5 to 17 Years | 14 (8.1%) | 11 (8.1%) |
| 18 to 34 Years | 20 (10.6%) | 0 (0.0%) |
| 35 to 64 Years | 26 (8.6%) | 32 (8.4%) |
| 65 to 74 Years | 23 (26.4%) | 24 (28.2%) |
| 75 Years and over | 53 (56.4%) | 44 (19.9%) |
Disability Class by Sex by Age in Lake Mills
Disability Class: Hearing Difficulty
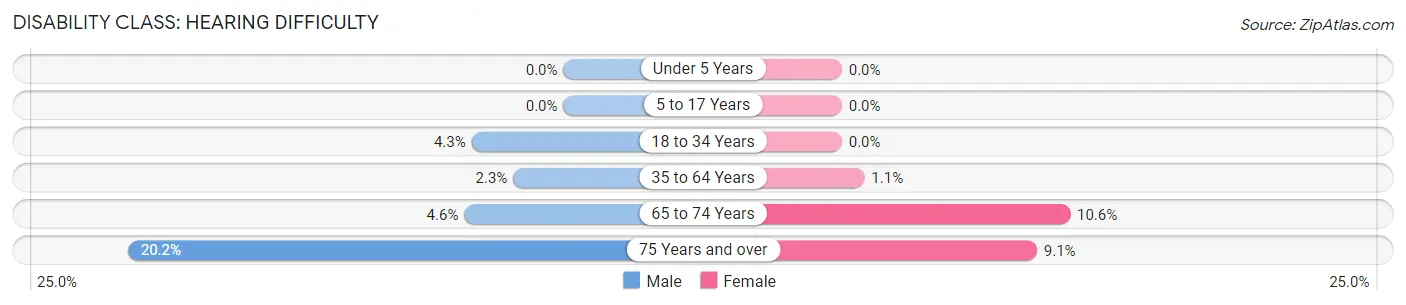
| Age Bracket | Male | Female |
| Under 5 Years | 0 (0.0%) | 0 (0.0%) |
| 5 to 17 Years | 0 (0.0%) | 0 (0.0%) |
| 18 to 34 Years | 8 (4.3%) | 0 (0.0%) |
| 35 to 64 Years | 7 (2.3%) | 4 (1.1%) |
| 65 to 74 Years | 4 (4.6%) | 9 (10.6%) |
| 75 Years and over | 19 (20.2%) | 20 (9.0%) |
Disability Class: Vision Difficulty
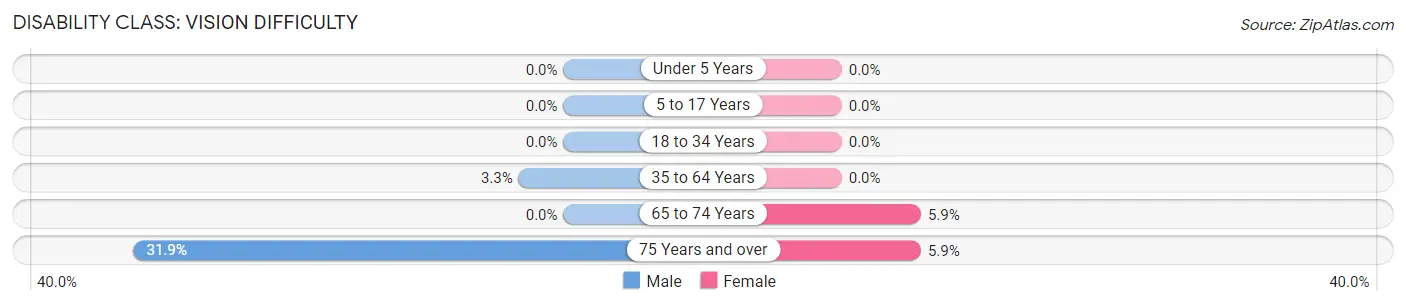
| Age Bracket | Male | Female |
| Under 5 Years | 0 (0.0%) | 0 (0.0%) |
| 5 to 17 Years | 0 (0.0%) | 0 (0.0%) |
| 18 to 34 Years | 0 (0.0%) | 0 (0.0%) |
| 35 to 64 Years | 10 (3.3%) | 0 (0.0%) |
| 65 to 74 Years | 0 (0.0%) | 5 (5.9%) |
| 75 Years and over | 30 (31.9%) | 13 (5.9%) |
Disability Class: Cognitive Difficulty
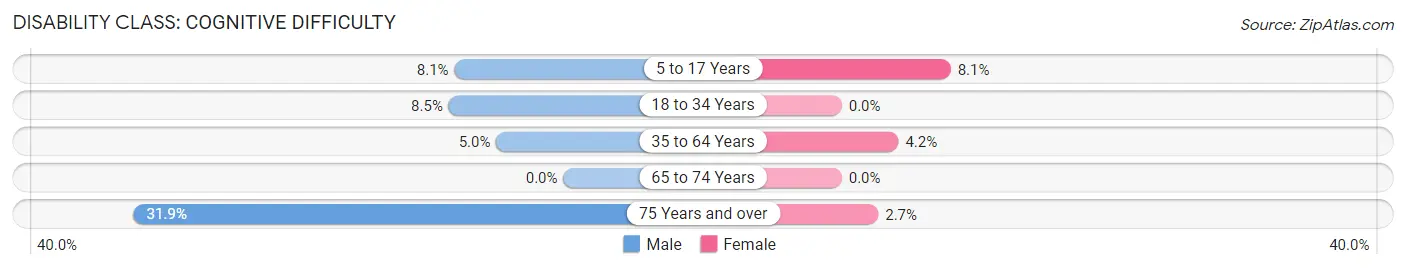
| Age Bracket | Male | Female |
| 5 to 17 Years | 14 (8.1%) | 11 (8.1%) |
| 18 to 34 Years | 16 (8.5%) | 0 (0.0%) |
| 35 to 64 Years | 15 (5.0%) | 16 (4.2%) |
| 65 to 74 Years | 0 (0.0%) | 0 (0.0%) |
| 75 Years and over | 30 (31.9%) | 6 (2.7%) |
Disability Class: Ambulatory Difficulty
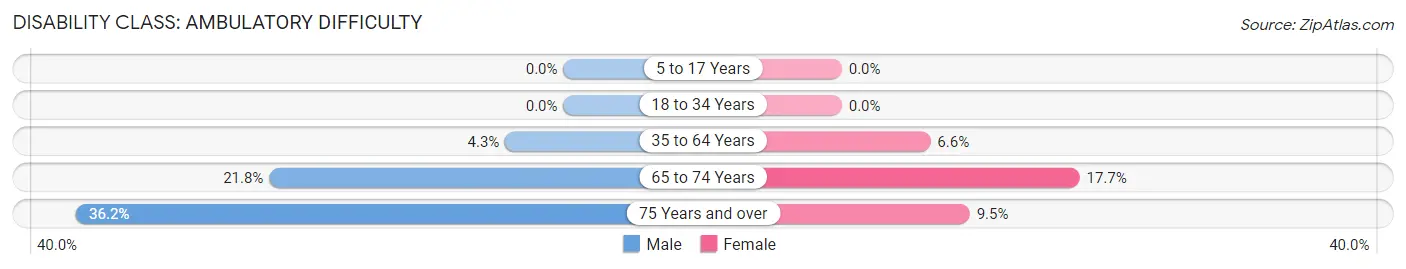
| Age Bracket | Male | Female |
| 5 to 17 Years | 0 (0.0%) | 0 (0.0%) |
| 18 to 34 Years | 0 (0.0%) | 0 (0.0%) |
| 35 to 64 Years | 13 (4.3%) | 25 (6.6%) |
| 65 to 74 Years | 19 (21.8%) | 15 (17.6%) |
| 75 Years and over | 34 (36.2%) | 21 (9.5%) |
Disability Class: Self-Care Difficulty
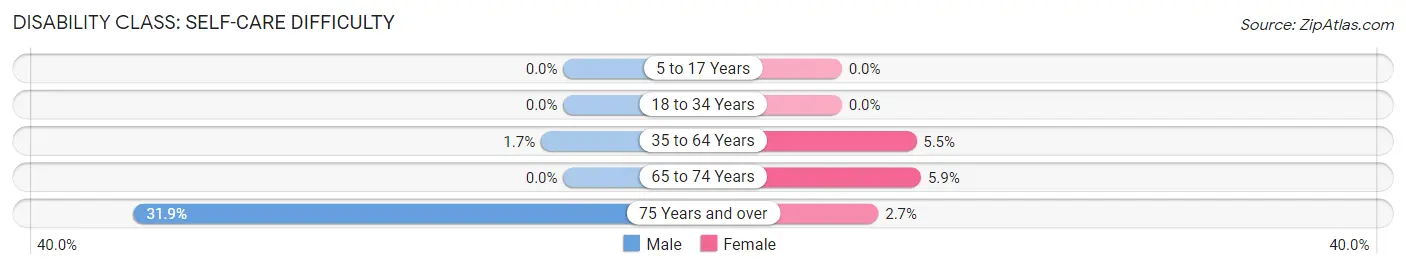
| Age Bracket | Male | Female |
| 5 to 17 Years | 0 (0.0%) | 0 (0.0%) |
| 18 to 34 Years | 0 (0.0%) | 0 (0.0%) |
| 35 to 64 Years | 5 (1.7%) | 21 (5.5%) |
| 65 to 74 Years | 0 (0.0%) | 5 (5.9%) |
| 75 Years and over | 30 (31.9%) | 6 (2.7%) |
Technology Access in Lake Mills
Computing Device Access in Lake Mills
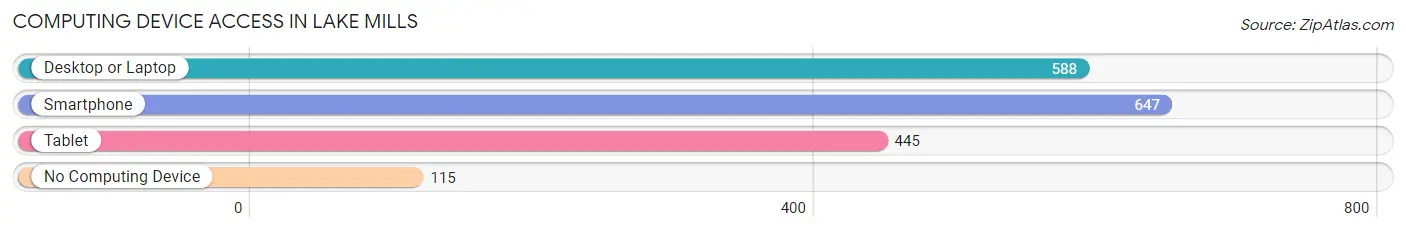
| Device Type | # Households | % Households |
| Desktop or Laptop | 588 | 66.7% |
| Smartphone | 647 | 73.4% |
| Tablet | 445 | 50.4% |
| No Computing Device | 115 | 13.0% |
| Total | 882 | 100.0% |
Internet Access in Lake Mills
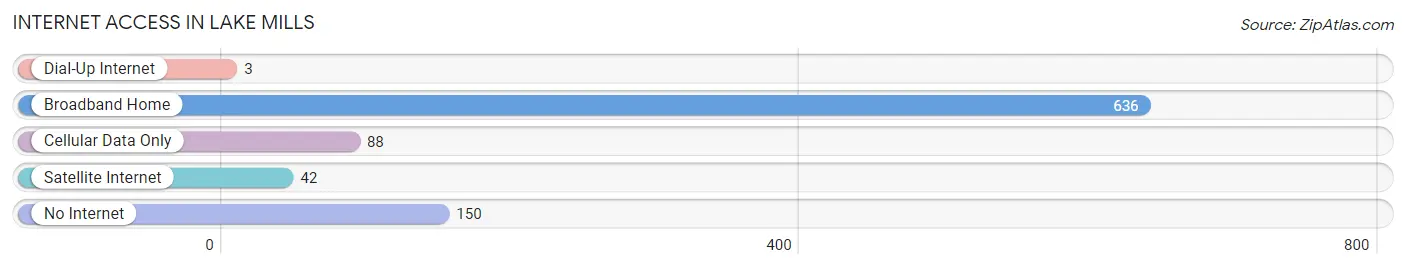
| Internet Type | # Households | % Households |
| Dial-Up Internet | 3 | 0.3% |
| Broadband Home | 636 | 72.1% |
| Cellular Data Only | 88 | 10.0% |
| Satellite Internet | 42 | 4.8% |
| No Internet | 150 | 17.0% |
| Total | 882 | 100.0% |
Lake Mills Summary
History
Lake Mills is a city located in Winnebago County, Iowa, United States. It is located on the eastern shore of East Okoboji Lake, and is part of the Iowa Great Lakes region. The city was founded in 1856 by a group of settlers from New York, and was originally known as “East Okoboji”. The name was changed to Lake Mills in 1868, after the nearby lake.
The city was originally a farming community, but in the late 19th century, it became a popular tourist destination. The city was home to several resorts, including the Lake Mills Hotel, which was built in 1891. The hotel was a popular destination for wealthy tourists from the Midwest, and was known for its luxurious accommodations and amenities.
In the early 20th century, the city began to experience a decline in tourism, and the resorts began to close. The city was also affected by the Great Depression, and many of the businesses in the city closed. However, the city was able to recover, and in the 1950s, it began to experience a resurgence in tourism.
Geography
Lake Mills is located in the Iowa Great Lakes region, on the eastern shore of East Okoboji Lake. The city is situated in a rural area, and is surrounded by rolling hills and farmland. The city is located approximately 30 miles north of Mason City, and is about an hour and a half drive from Des Moines.
The city has a total area of 2.2 square miles, all of which is land. The city is located at an elevation of 1,068 feet above sea level. The climate in Lake Mills is humid continental, with hot summers and cold winters.
Economy
The economy of Lake Mills is largely based on tourism and agriculture. The city is home to several resorts, including the Lake Mills Hotel, which is a popular destination for tourists from the Midwest. The city is also home to several wineries, and is a popular destination for wine tasting.
The city is also home to several agricultural businesses, including dairy farms, grain elevators, and livestock operations. The city is also home to several manufacturing businesses, including a furniture factory and a plastics factory.
Demographics
As of the 2010 census, the population of Lake Mills was 1,845. The population is predominantly white, with a small percentage of African Americans, Hispanics, and Asians. The median household income in the city is $45,000, and the median home value is $150,000. The city has a low unemployment rate, and the majority of the population is employed in the tourism and agricultural industries.
Common Questions
What is Per Capita Income in Lake Mills?
Per Capita income in Lake Mills is $32,892.
What is the Median Family Income in Lake Mills?
Median Family Income in Lake Mills is $77,768.
What is the Median Household income in Lake Mills?
Median Household Income in Lake Mills is $63,750.
What is Income or Wage Gap in Lake Mills?
Income or Wage Gap in Lake Mills is 27.0%.
Women in Lake Mills earn 73.0 cents for every dollar earned by a man.
What is Family Income Deficit in Lake Mills?
Family Income Deficit in Lake Mills is $13,578.
Families that are below poverty line in Lake Mills earn $13,578 less on average than the poverty threshold level.
What is Inequality or Gini Index in Lake Mills?
Inequality or Gini Index in Lake Mills is 0.39.
What is the Total Population of Lake Mills?
Total Population of Lake Mills is 1,965.
What is the Total Male Population of Lake Mills?
Total Male Population of Lake Mills is 879.
What is the Total Female Population of Lake Mills?
Total Female Population of Lake Mills is 1,086.
What is the Ratio of Males per 100 Females in Lake Mills?
There are 80.94 Males per 100 Females in Lake Mills.
What is the Ratio of Females per 100 Males in Lake Mills?
There are 123.55 Females per 100 Males in Lake Mills.
What is the Median Population Age in Lake Mills?
Median Population Age in Lake Mills is 47.0 Years.
What is the Average Family Size in Lake Mills
Average Family Size in Lake Mills is 2.7 People.
What is the Average Household Size in Lake Mills
Average Household Size in Lake Mills is 2.2 People.
How Large is the Labor Force in Lake Mills?
There are 1,060 People in the Labor Forcein in Lake Mills.
What is the Percentage of People in the Labor Force in Lake Mills?
63.0% of People are in the Labor Force in Lake Mills.
What is the Unemployment Rate in Lake Mills?
Unemployment Rate in Lake Mills is 2.8%.