Estherville, IA Map & Demographics
Estherville Map
Estherville Overview
$29,523
PER CAPITA INCOME
$67,236
AVG FAMILY INCOME
$55,699
AVG HOUSEHOLD INCOME
27.3%
WAGE / INCOME GAP [ % ]
72.7¢/ $1
WAGE / INCOME GAP [ $ ]
0.42
INEQUALITY / GINI INDEX
5,881
TOTAL POPULATION
2,950
MALE POPULATION
2,931
FEMALE POPULATION
100.65
MALES / 100 FEMALES
99.36
FEMALES / 100 MALES
40.2
MEDIAN AGE
2.9
AVG FAMILY SIZE
2.2
AVG HOUSEHOLD SIZE
3,063
LABOR FORCE [ PEOPLE ]
62.7%
PERCENT IN LABOR FORCE
2.3%
UNEMPLOYMENT RATE
Estherville Zip Codes
Estherville Area Codes
Income in Estherville
Income Overview in Estherville
Per Capita Income in Estherville is $29,523, while median incomes of families and households are $67,236 and $55,699 respectively.
| Characteristic | Number | Measure |
| Per Capita Income | 5,881 | $29,523 |
| Median Family Income | 1,272 | $67,236 |
| Mean Family Income | 1,272 | $86,593 |
| Median Household Income | 2,383 | $55,699 |
| Mean Household Income | 2,383 | $68,293 |
| Income Deficit | 1,272 | $0 |
| Wage / Income Gap (%) | 5,881 | 27.32% |
| Wage / Income Gap ($) | 5,881 | 72.68¢ per $1 |
| Gini / Inequality Index | 5,881 | 0.42 |
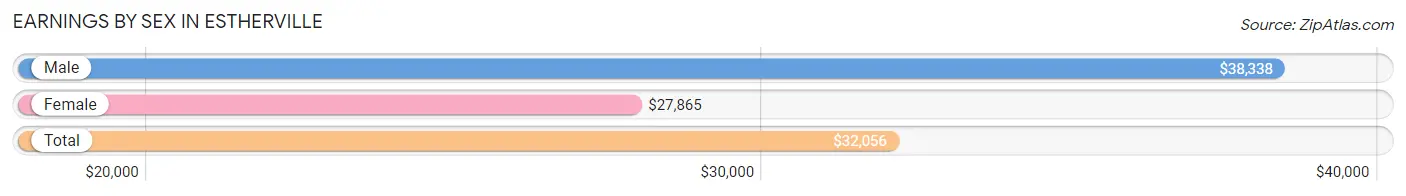
Earnings by Sex in Estherville
Average Earnings in Estherville are $32,056, $38,338 for men and $27,865 for women, a difference of 27.3%.
| Sex | Number | Average Earnings |
| Male | 1,915 (56.7%) | $38,338 |
| Female | 1,462 (43.3%) | $27,865 |
| Total | 3,377 (100.0%) | $32,056 |
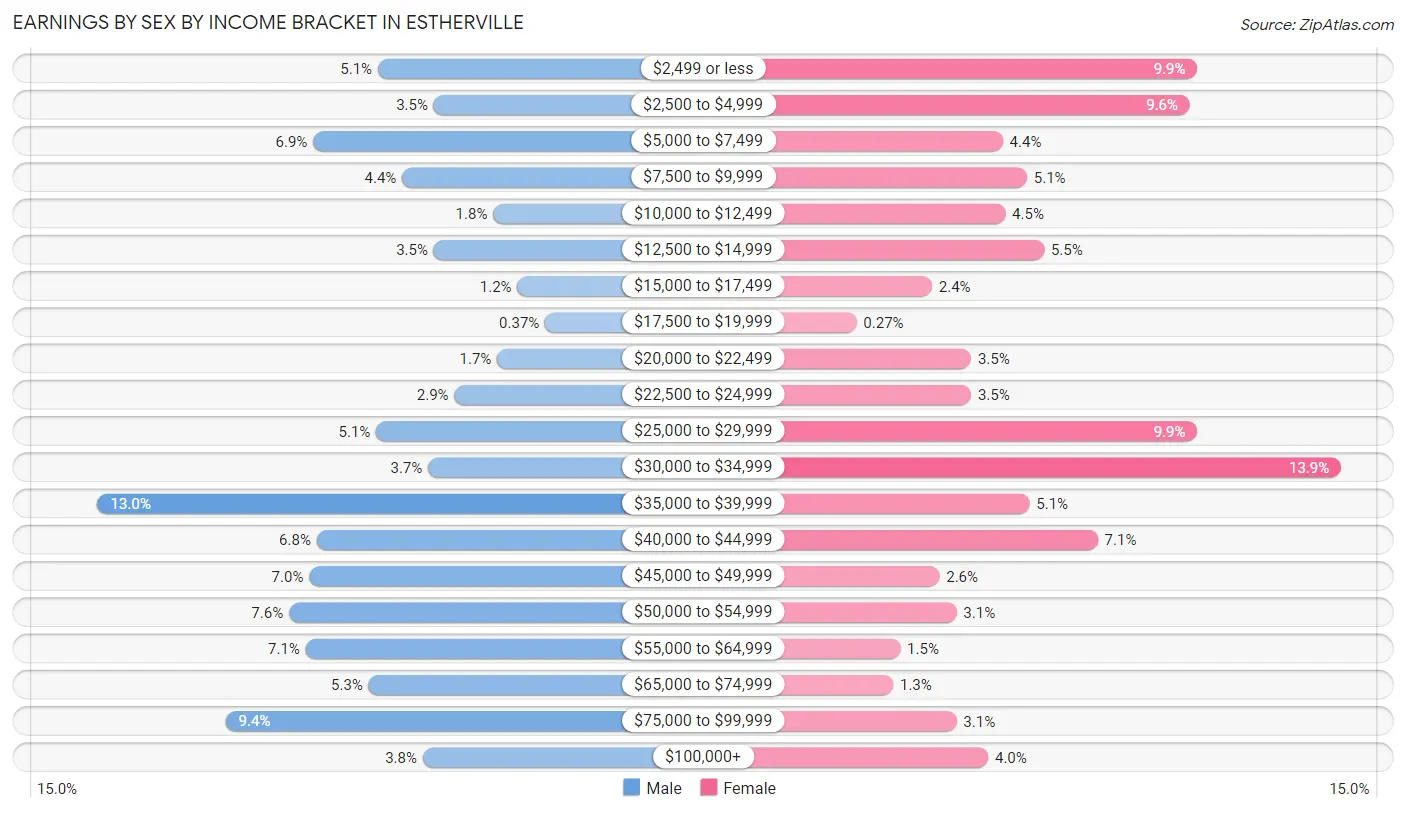
Earnings by Sex by Income Bracket in Estherville
The most common earnings brackets in Estherville are $35,000 to $39,999 for men (248 | 13.0%) and $30,000 to $34,999 for women (203 | 13.9%).
| Income | Male | Female |
| $2,499 or less | 97 (5.1%) | 144 (9.9%) |
| $2,500 to $4,999 | 67 (3.5%) | 141 (9.6%) |
| $5,000 to $7,499 | 132 (6.9%) | 64 (4.4%) |
| $7,500 to $9,999 | 84 (4.4%) | 74 (5.1%) |
| $10,000 to $12,499 | 35 (1.8%) | 65 (4.4%) |
| $12,500 to $14,999 | 67 (3.5%) | 81 (5.5%) |
| $15,000 to $17,499 | 22 (1.1%) | 35 (2.4%) |
| $17,500 to $19,999 | 7 (0.4%) | 4 (0.3%) |
| $20,000 to $22,499 | 33 (1.7%) | 51 (3.5%) |
| $22,500 to $24,999 | 56 (2.9%) | 51 (3.5%) |
| $25,000 to $29,999 | 98 (5.1%) | 144 (9.9%) |
| $30,000 to $34,999 | 70 (3.7%) | 203 (13.9%) |
| $35,000 to $39,999 | 248 (13.0%) | 75 (5.1%) |
| $40,000 to $44,999 | 130 (6.8%) | 103 (7.0%) |
| $45,000 to $49,999 | 134 (7.0%) | 38 (2.6%) |
| $50,000 to $54,999 | 145 (7.6%) | 45 (3.1%) |
| $55,000 to $64,999 | 136 (7.1%) | 22 (1.5%) |
| $65,000 to $74,999 | 102 (5.3%) | 19 (1.3%) |
| $75,000 to $99,999 | 179 (9.3%) | 45 (3.1%) |
| $100,000+ | 73 (3.8%) | 58 (4.0%) |
| Total | 1,915 (100.0%) | 1,462 (100.0%) |
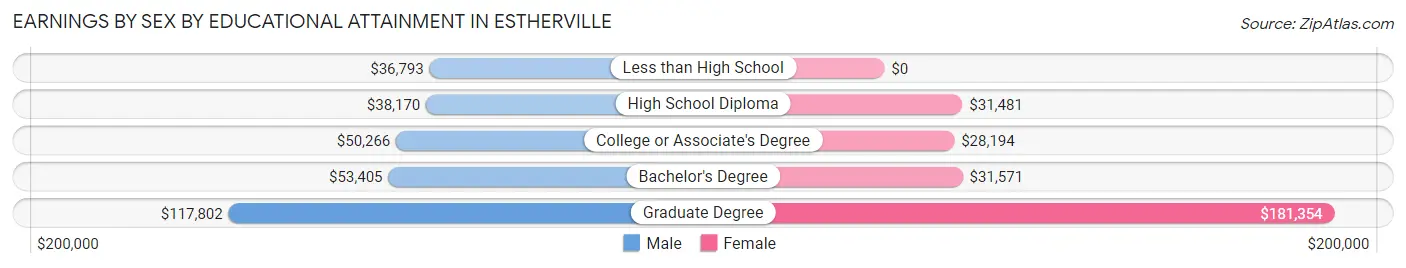
Earnings by Sex by Educational Attainment in Estherville
Average earnings in Estherville are $41,657 for men and $29,883 for women, a difference of 28.3%. Men with an educational attainment of graduate degree enjoy the highest average annual earnings of $117,802, while those with less than high school education earn the least with $36,793. Women with an educational attainment of graduate degree earn the most with the average annual earnings of $181,354, while those with college or associate's degree education have the smallest earnings of $28,194.
| Educational Attainment | Male Income | Female Income |
| Less than High School | $36,793 | $0 |
| High School Diploma | $38,170 | $31,481 |
| College or Associate's Degree | $50,266 | $28,194 |
| Bachelor's Degree | $53,405 | $31,571 |
| Graduate Degree | $117,802 | $181,354 |
| Total | $41,657 | $29,883 |
Family Income in Estherville
Family Income Brackets in Estherville
According to the Estherville family income data, there are 301 families falling into the $50,000 to $74,999 income range, which is the most common income bracket and makes up 23.7% of all families. Conversely, the less than $10,000 income bracket is the least frequent group with only 27 families (2.1%) belonging to this category.
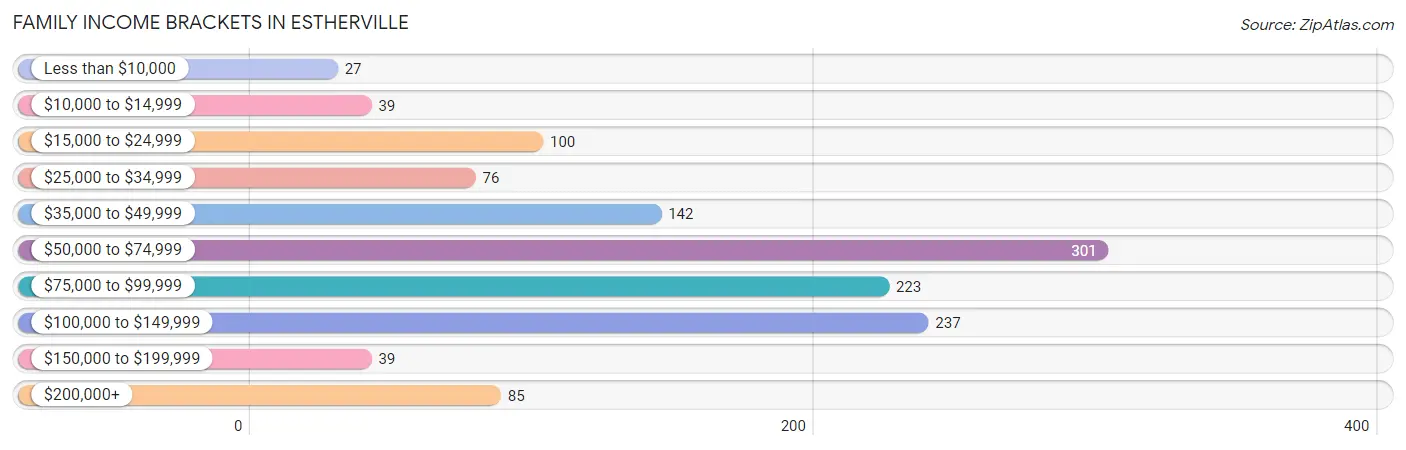
| Income Bracket | # Families | % Families |
| Less than $10,000 | 27 | 2.1% |
| $10,000 to $14,999 | 39 | 3.1% |
| $15,000 to $24,999 | 100 | 7.9% |
| $25,000 to $34,999 | 76 | 6.0% |
| $35,000 to $49,999 | 142 | 11.2% |
| $50,000 to $74,999 | 301 | 23.7% |
| $75,000 to $99,999 | 223 | 17.5% |
| $100,000 to $149,999 | 237 | 18.6% |
| $150,000 to $199,999 | 39 | 3.1% |
| $200,000+ | 85 | 6.7% |
Family Income by Famaliy Size in Estherville
3-person families (189 | 14.9%) account for the highest median family income in Estherville with $75,525 per family, while 2-person families (753 | 59.2%) have the highest median income of $33,324 per family member.
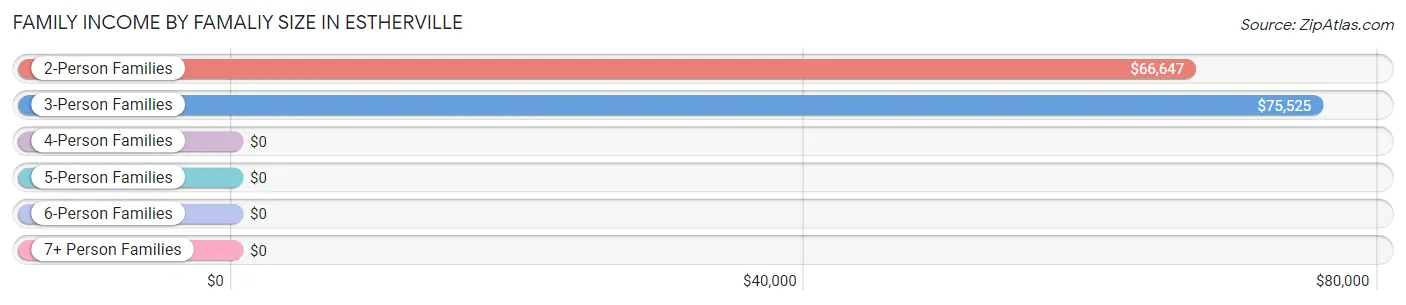
| Income Bracket | # Families | Median Income |
| 2-Person Families | 753 (59.2%) | $66,647 |
| 3-Person Families | 189 (14.9%) | $75,525 |
| 4-Person Families | 106 (8.3%) | $0 |
| 5-Person Families | 160 (12.6%) | $0 |
| 6-Person Families | 28 (2.2%) | $0 |
| 7+ Person Families | 36 (2.8%) | $0 |
| Total | 1,272 (100.0%) | $67,236 |
Family Income by Number of Earners in Estherville
The median family income in Estherville is $67,236, with families comprising 3+ earners (94) having the highest median family income of $121,250, while families with no earners (228) have the lowest median family income of $43,375, accounting for 7.4% and 17.9% of families, respectively.
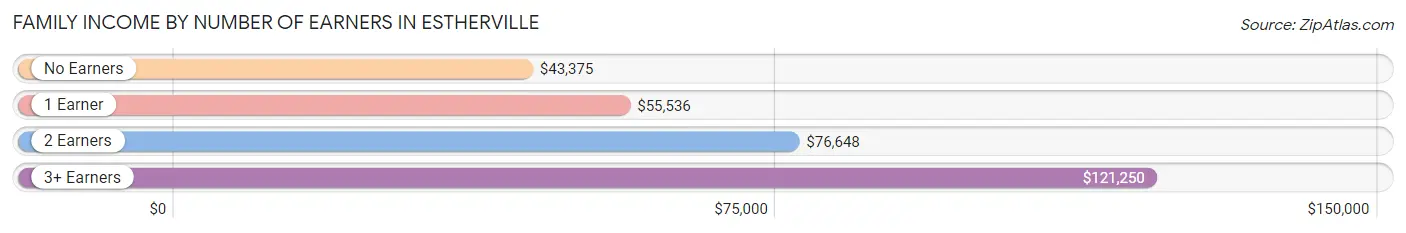
| Number of Earners | # Families | Median Income |
| No Earners | 228 (17.9%) | $43,375 |
| 1 Earner | 294 (23.1%) | $55,536 |
| 2 Earners | 656 (51.6%) | $76,648 |
| 3+ Earners | 94 (7.4%) | $121,250 |
| Total | 1,272 (100.0%) | $67,236 |
Household Income in Estherville
Household Income Brackets in Estherville
With 553 households falling in the category, the $50,000 to $74,999 income range is the most frequent in Estherville, accounting for 23.2% of all households. In contrast, only 41 households (1.7%) fall into the $150,000 to $199,999 income bracket, making it the least populous group.
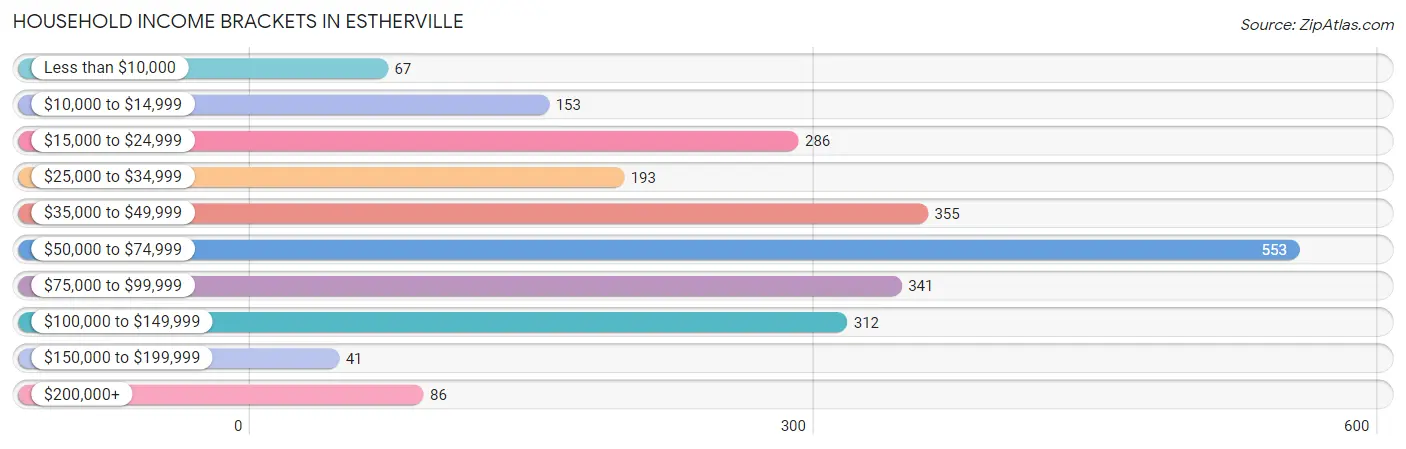
| Income Bracket | # Households | % Households |
| Less than $10,000 | 67 | 2.8% |
| $10,000 to $14,999 | 153 | 6.4% |
| $15,000 to $24,999 | 286 | 12.0% |
| $25,000 to $34,999 | 193 | 8.1% |
| $35,000 to $49,999 | 355 | 14.9% |
| $50,000 to $74,999 | 553 | 23.2% |
| $75,000 to $99,999 | 341 | 14.3% |
| $100,000 to $149,999 | 312 | 13.1% |
| $150,000 to $199,999 | 41 | 1.7% |
| $200,000+ | 86 | 3.6% |
Household Income by Householder Age in Estherville
The median household income in Estherville is $55,699, with the highest median household income of $72,898 found in the 15 to 24 years age bracket for the primary householder. A total of 91 households (3.8%) fall into this category. Meanwhile, the 65+ years age bracket for the primary householder has the lowest median household income of $30,000, with 714 households (30.0%) in this group.
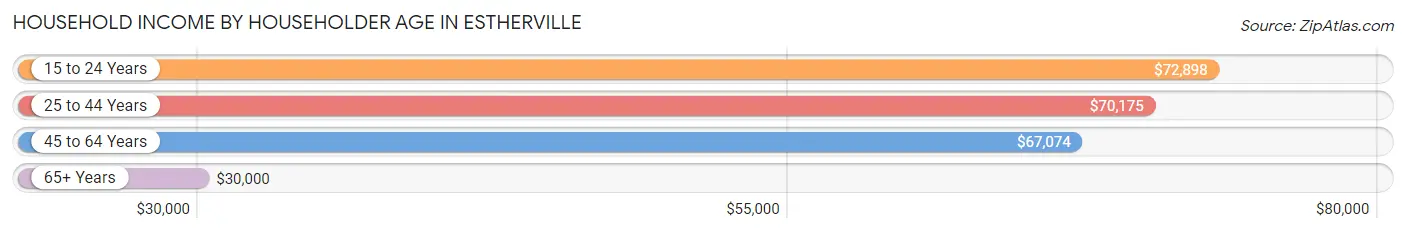
| Income Bracket | # Households | Median Income |
| 15 to 24 Years | 91 (3.8%) | $72,898 |
| 25 to 44 Years | 688 (28.9%) | $70,175 |
| 45 to 64 Years | 890 (37.3%) | $67,074 |
| 65+ Years | 714 (30.0%) | $30,000 |
| Total | 2,383 (100.0%) | $55,699 |
Poverty in Estherville
Income Below Poverty by Sex and Age in Estherville
With 12.2% poverty level for males and 17.3% for females among the residents of Estherville, 6 to 11 year old males and 15 year old females are the most vulnerable to poverty, with 88 males (72.1%) and 17 females (70.8%) in their respective age groups living below the poverty level.
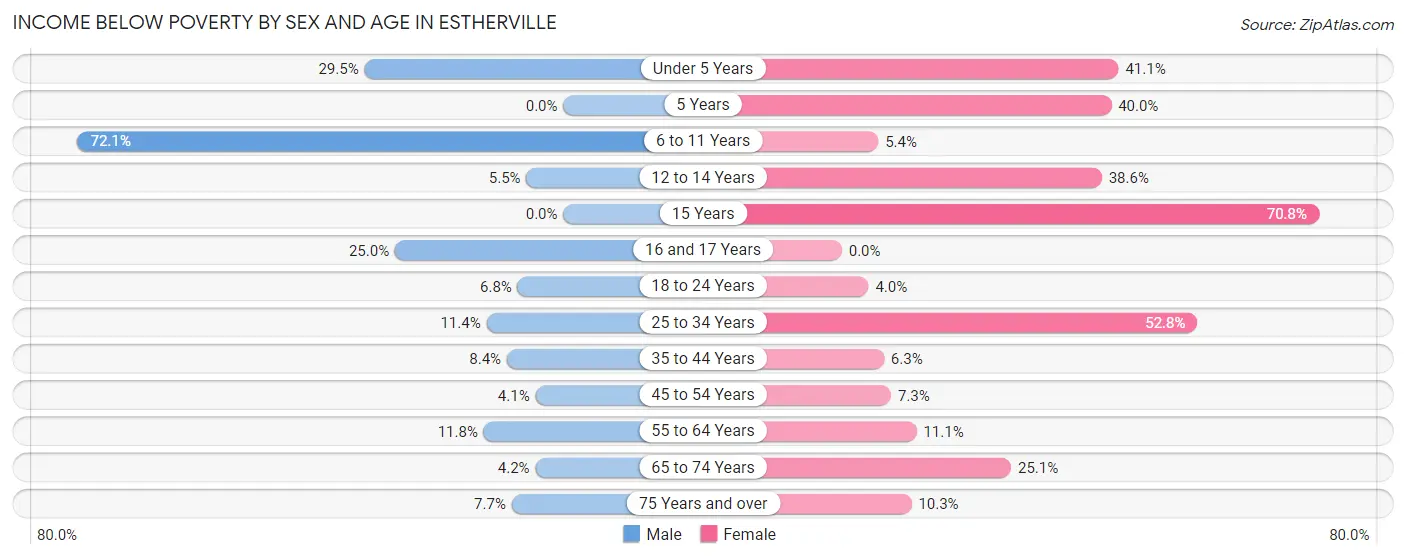
| Age Bracket | Male | Female |
| Under 5 Years | 44 (29.5%) | 53 (41.1%) |
| 5 Years | 0 (0.0%) | 8 (40.0%) |
| 6 to 11 Years | 88 (72.1%) | 17 (5.4%) |
| 12 to 14 Years | 8 (5.5%) | 22 (38.6%) |
| 15 Years | 0 (0.0%) | 17 (70.8%) |
| 16 and 17 Years | 12 (25.0%) | 0 (0.0%) |
| 18 to 24 Years | 8 (6.8%) | 4 (4.0%) |
| 25 to 34 Years | 42 (11.4%) | 123 (52.8%) |
| 35 to 44 Years | 31 (8.4%) | 22 (6.2%) |
| 45 to 54 Years | 17 (4.1%) | 20 (7.3%) |
| 55 to 64 Years | 50 (11.8%) | 51 (11.1%) |
| 65 to 74 Years | 11 (4.2%) | 94 (25.1%) |
| 75 Years and over | 17 (7.7%) | 21 (10.3%) |
| Total | 328 (12.2%) | 452 (17.3%) |
Income Above Poverty by Sex and Age in Estherville
According to the poverty statistics in Estherville, males aged 15 years and females aged 16 and 17 years are the age groups that are most secure financially, with 100.0% of males and 100.0% of females in these age groups living above the poverty line.
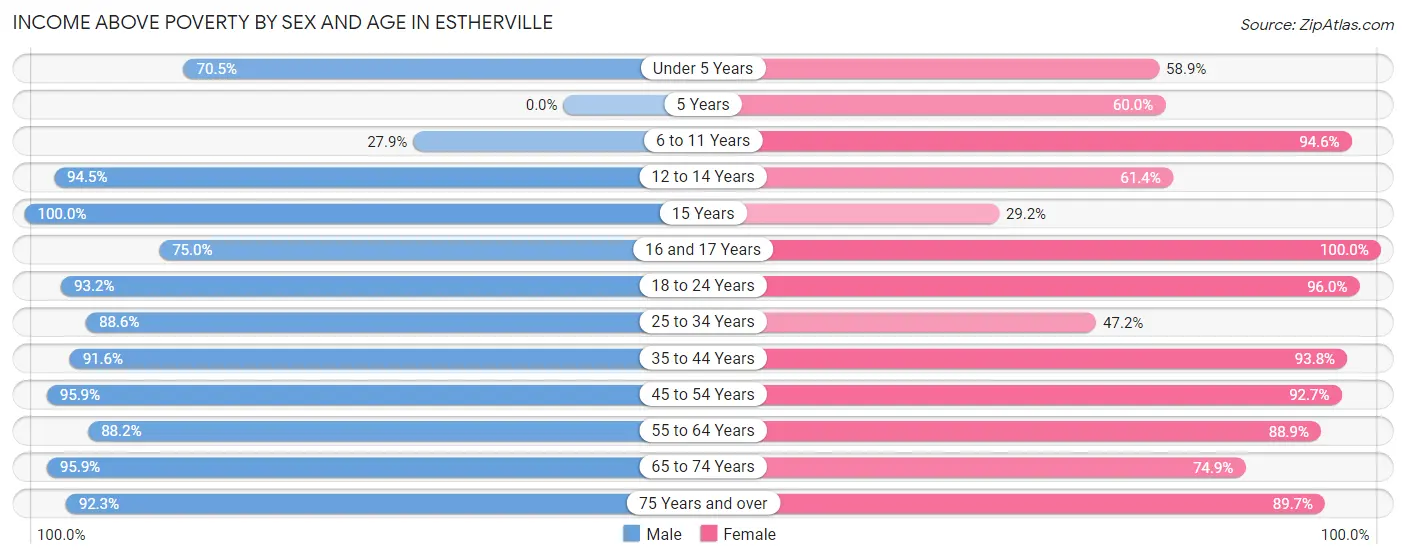
| Age Bracket | Male | Female |
| Under 5 Years | 105 (70.5%) | 76 (58.9%) |
| 5 Years | 0 (0.0%) | 12 (60.0%) |
| 6 to 11 Years | 34 (27.9%) | 297 (94.6%) |
| 12 to 14 Years | 138 (94.5%) | 35 (61.4%) |
| 15 Years | 35 (100.0%) | 7 (29.2%) |
| 16 and 17 Years | 36 (75.0%) | 76 (100.0%) |
| 18 to 24 Years | 110 (93.2%) | 97 (96.0%) |
| 25 to 34 Years | 326 (88.6%) | 110 (47.2%) |
| 35 to 44 Years | 339 (91.6%) | 330 (93.8%) |
| 45 to 54 Years | 394 (95.9%) | 254 (92.7%) |
| 55 to 64 Years | 373 (88.2%) | 409 (88.9%) |
| 65 to 74 Years | 254 (95.9%) | 280 (74.9%) |
| 75 Years and over | 205 (92.3%) | 182 (89.7%) |
| Total | 2,349 (87.7%) | 2,165 (82.7%) |
Income Below Poverty Among Married-Couple Families in Estherville
The poverty statistics for married-couple families in Estherville show that 8.6% or 79 of the total 917 families live below the poverty line. Families with 3 or 4 children have the highest poverty rate of 22.7%, comprising of 41 families. On the other hand, families with 5 or more children have the lowest poverty rate of 0.0%, which includes 0 families.
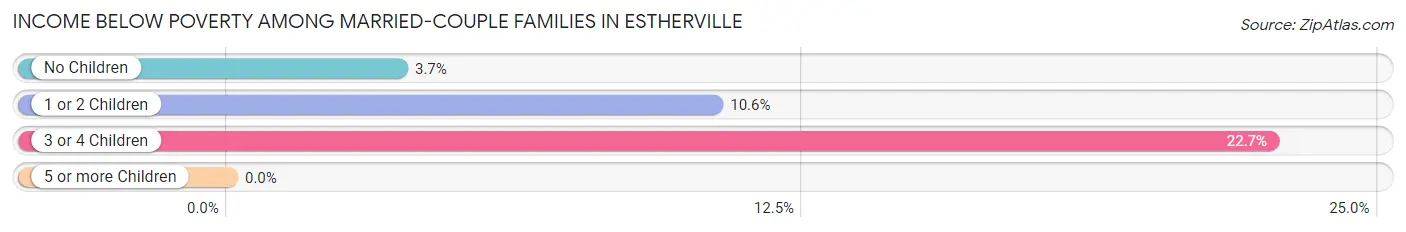
| Children | Above Poverty | Below Poverty |
| No Children | 547 (96.3%) | 21 (3.7%) |
| 1 or 2 Children | 144 (89.4%) | 17 (10.6%) |
| 3 or 4 Children | 140 (77.3%) | 41 (22.7%) |
| 5 or more Children | 7 (100.0%) | 0 (0.0%) |
| Total | 838 (91.4%) | 79 (8.6%) |
Income Below Poverty Among Single-Parent Households in Estherville
According to the poverty data in Estherville, 15.9% or 10 single-father households and 21.9% or 64 single-mother households are living below the poverty line. Among single-father households, those with 1 or 2 children have the highest poverty rate, with 10 households (21.3%) experiencing poverty. Likewise, among single-mother households, those with 3 or 4 children have the highest poverty rate, with 8 households (100.0%) falling below the poverty line.
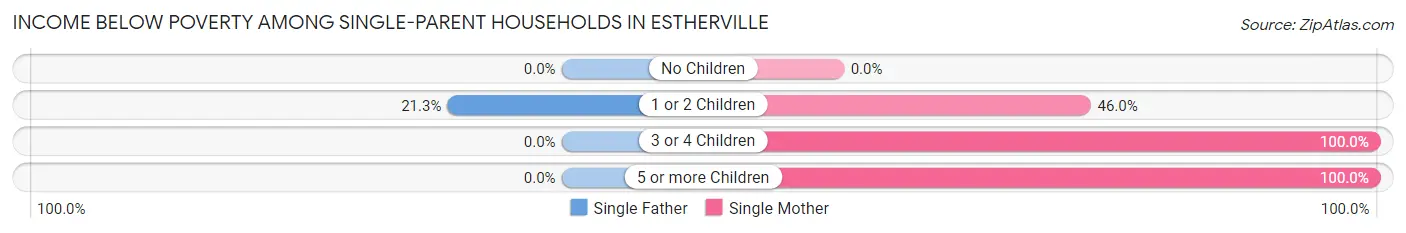
| Children | Single Father | Single Mother |
| No Children | 0 (0.0%) | 0 (0.0%) |
| 1 or 2 Children | 10 (21.3%) | 40 (46.0%) |
| 3 or 4 Children | 0 (0.0%) | 8 (100.0%) |
| 5 or more Children | 0 (0.0%) | 16 (100.0%) |
| Total | 10 (15.9%) | 64 (21.9%) |
Income Below Poverty Among Married-Couple vs Single-Parent Households in Estherville
The poverty data for Estherville shows that 79 of the married-couple family households (8.6%) and 74 of the single-parent households (20.8%) are living below the poverty level. Within the married-couple family households, those with 3 or 4 children have the highest poverty rate, with 41 households (22.7%) falling below the poverty line. Among the single-parent households, those with 3 or 4 children have the highest poverty rate, with 8 household (100.0%) living below poverty.
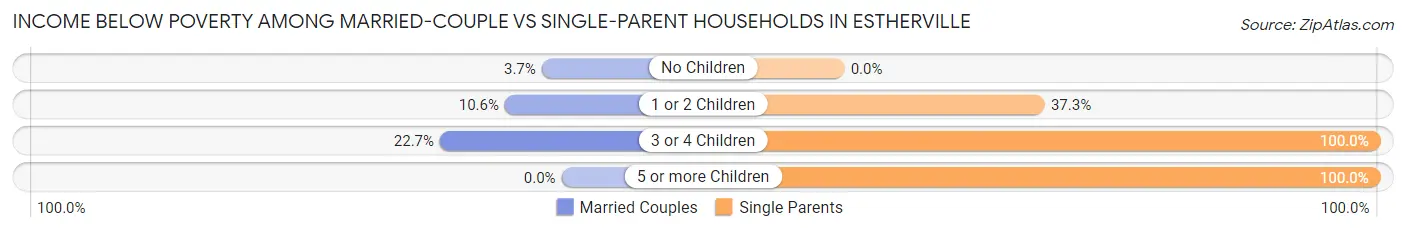
| Children | Married-Couple Families | Single-Parent Households |
| No Children | 21 (3.7%) | 0 (0.0%) |
| 1 or 2 Children | 17 (10.6%) | 50 (37.3%) |
| 3 or 4 Children | 41 (22.7%) | 8 (100.0%) |
| 5 or more Children | 0 (0.0%) | 16 (100.0%) |
| Total | 79 (8.6%) | 74 (20.8%) |
Race in Estherville
The most populous races in Estherville are White / Caucasian (4,858 | 82.6%), Hispanic or Latino (806 | 13.7%), and Two or more Races (612 | 10.4%).
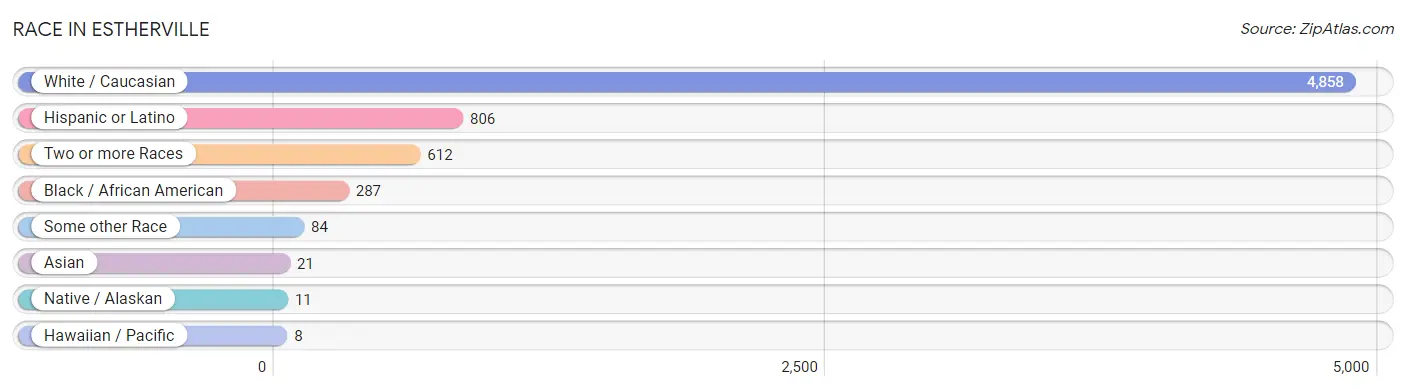
| Race | # Population | % Population |
| Asian | 21 | 0.4% |
| Black / African American | 287 | 4.9% |
| Hawaiian / Pacific | 8 | 0.1% |
| Hispanic or Latino | 806 | 13.7% |
| Native / Alaskan | 11 | 0.2% |
| White / Caucasian | 4,858 | 82.6% |
| Two or more Races | 612 | 10.4% |
| Some other Race | 84 | 1.4% |
| Total | 5,881 | 100.0% |
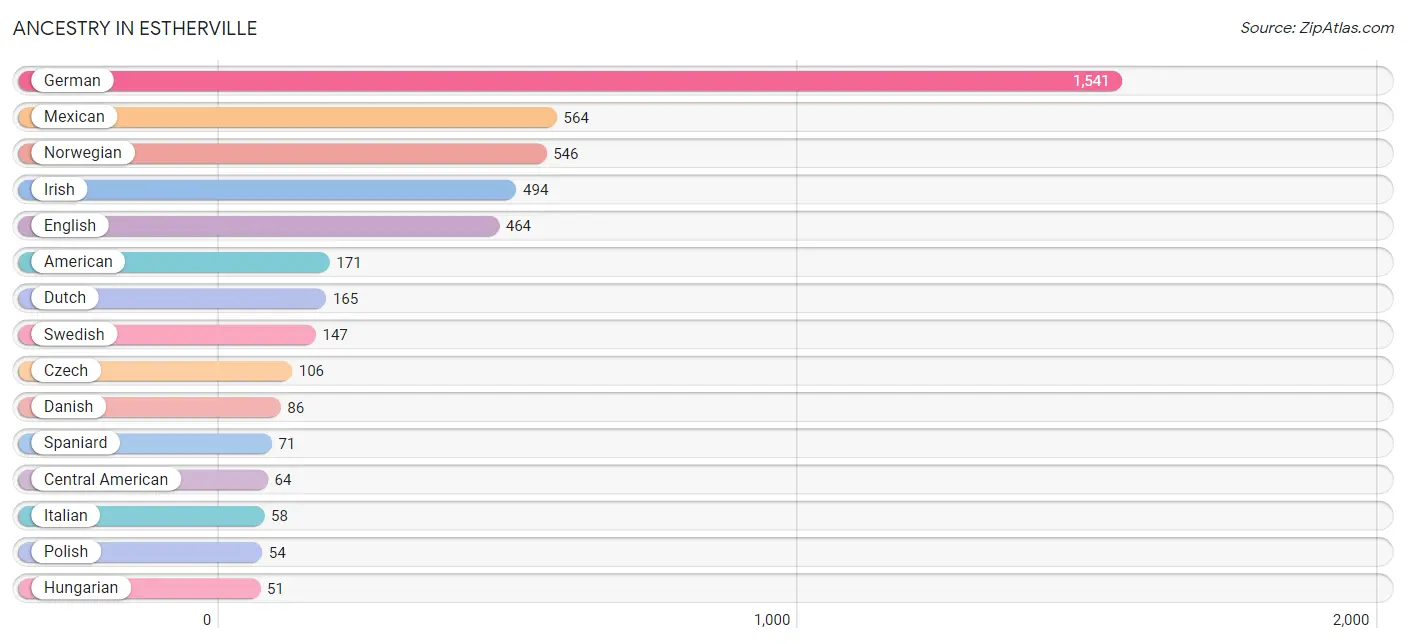
Ancestry in Estherville
The most populous ancestries reported in Estherville are German (1,541 | 26.2%), Mexican (564 | 9.6%), Norwegian (546 | 9.3%), Irish (494 | 8.4%), and English (464 | 7.9%), together accounting for 61.4% of all Estherville residents.
| Ancestry | # Population | % Population |
| African | 14 | 0.2% |
| American | 171 | 2.9% |
| Arab | 2 | 0.0% |
| Austrian | 5 | 0.1% |
| Bolivian | 12 | 0.2% |
| Brazilian | 11 | 0.2% |
| British | 42 | 0.7% |
| Canadian | 12 | 0.2% |
| Central American | 64 | 1.1% |
| Cherokee | 5 | 0.1% |
| Choctaw | 5 | 0.1% |
| Comanche | 7 | 0.1% |
| Czech | 106 | 1.8% |
| Czechoslovakian | 44 | 0.7% |
| Danish | 86 | 1.5% |
| Dutch | 165 | 2.8% |
| Eastern European | 19 | 0.3% |
| Egyptian | 2 | 0.0% |
| English | 464 | 7.9% |
| European | 10 | 0.2% |
| Fijian | 20 | 0.3% |
| French | 13 | 0.2% |
| French Canadian | 6 | 0.1% |
| German | 1,541 | 26.2% |
| Greek | 11 | 0.2% |
| Haitian | 7 | 0.1% |
| Honduran | 33 | 0.6% |
| Hungarian | 51 | 0.9% |
| Indian (Asian) | 11 | 0.2% |
| Irish | 494 | 8.4% |
| Italian | 58 | 1.0% |
| Korean | 5 | 0.1% |
| Liberian | 29 | 0.5% |
| Mexican | 564 | 9.6% |
| Navajo | 11 | 0.2% |
| Norwegian | 546 | 9.3% |
| Polish | 54 | 0.9% |
| Russian | 6 | 0.1% |
| Salvadoran | 31 | 0.5% |
| Scotch-Irish | 37 | 0.6% |
| Scottish | 50 | 0.9% |
| Sierra Leonean | 29 | 0.5% |
| Slovak | 9 | 0.2% |
| South American | 12 | 0.2% |
| Spaniard | 71 | 1.2% |
| Sri Lankan | 5 | 0.1% |
| Subsaharan African | 44 | 0.7% |
| Sudanese | 1 | 0.0% |
| Swedish | 147 | 2.5% |
| Ute | 5 | 0.1% |
| Welsh | 23 | 0.4% | View All 51 Rows |
Immigrants in Estherville
The most numerous immigrant groups reported in Estherville came from Central America (330 | 5.6%), Latin America (330 | 5.6%), Mexico (267 | 4.5%), Honduras (32 | 0.5%), and El Salvador (31 | 0.5%), together accounting for 16.8% of all Estherville residents.
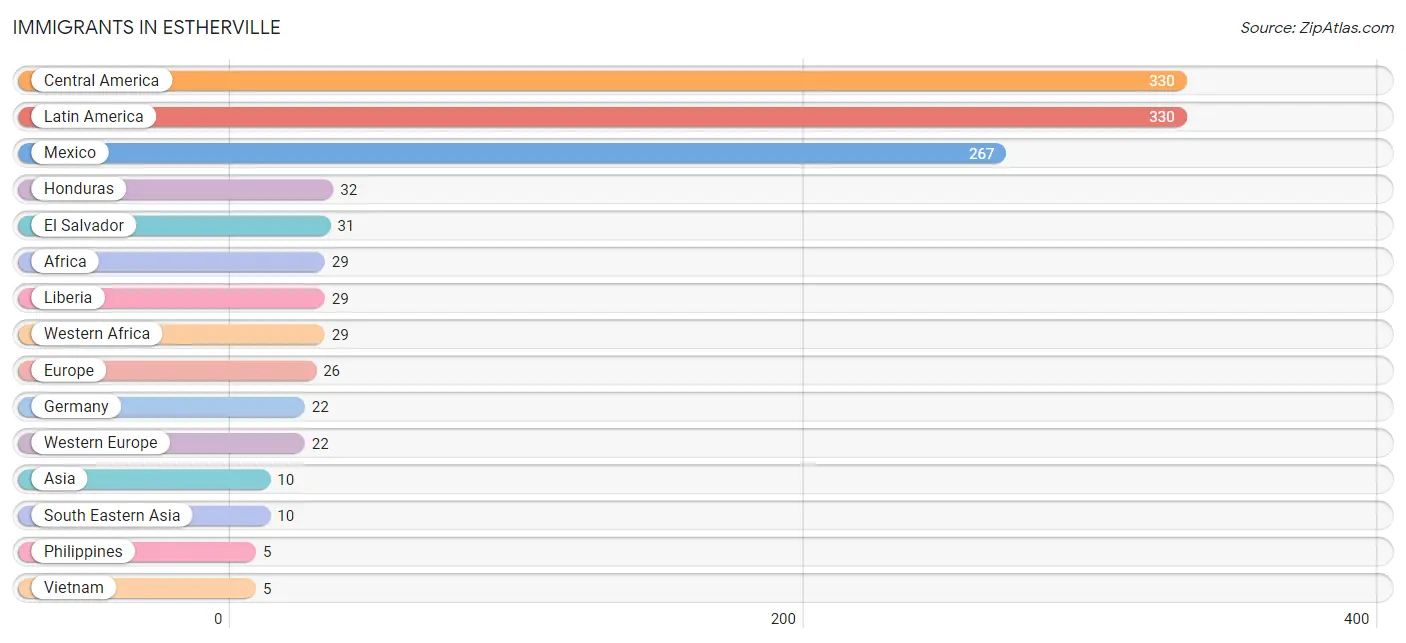
| Immigration Origin | # Population | % Population |
| Africa | 29 | 0.5% |
| Asia | 10 | 0.2% |
| Central America | 330 | 5.6% |
| Eastern Europe | 4 | 0.1% |
| El Salvador | 31 | 0.5% |
| Europe | 26 | 0.4% |
| Germany | 22 | 0.4% |
| Honduras | 32 | 0.5% |
| Latin America | 330 | 5.6% |
| Liberia | 29 | 0.5% |
| Mexico | 267 | 4.5% |
| Philippines | 5 | 0.1% |
| South Eastern Asia | 10 | 0.2% |
| Ukraine | 4 | 0.1% |
| Vietnam | 5 | 0.1% |
| Western Africa | 29 | 0.5% |
| Western Europe | 22 | 0.4% | View All 17 Rows |
Sex and Age in Estherville
Sex and Age in Estherville
The most populous age groups in Estherville are 15 to 19 Years (309 | 10.5%) for men and 5 to 9 Years (300 | 10.2%) for women.
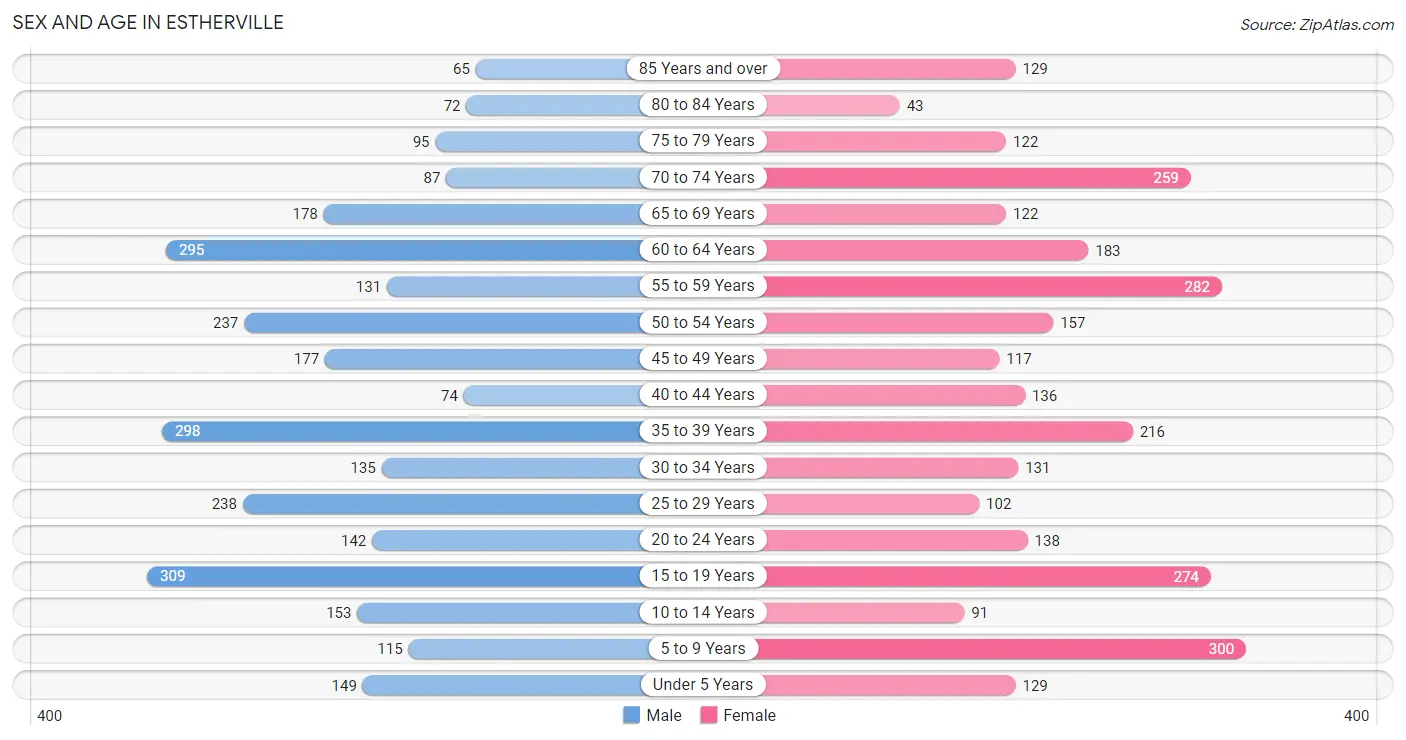
| Age Bracket | Male | Female |
| Under 5 Years | 149 (5.1%) | 129 (4.4%) |
| 5 to 9 Years | 115 (3.9%) | 300 (10.2%) |
| 10 to 14 Years | 153 (5.2%) | 91 (3.1%) |
| 15 to 19 Years | 309 (10.5%) | 274 (9.3%) |
| 20 to 24 Years | 142 (4.8%) | 138 (4.7%) |
| 25 to 29 Years | 238 (8.1%) | 102 (3.5%) |
| 30 to 34 Years | 135 (4.6%) | 131 (4.5%) |
| 35 to 39 Years | 298 (10.1%) | 216 (7.4%) |
| 40 to 44 Years | 74 (2.5%) | 136 (4.6%) |
| 45 to 49 Years | 177 (6.0%) | 117 (4.0%) |
| 50 to 54 Years | 237 (8.0%) | 157 (5.4%) |
| 55 to 59 Years | 131 (4.4%) | 282 (9.6%) |
| 60 to 64 Years | 295 (10.0%) | 183 (6.2%) |
| 65 to 69 Years | 178 (6.0%) | 122 (4.2%) |
| 70 to 74 Years | 87 (2.9%) | 259 (8.8%) |
| 75 to 79 Years | 95 (3.2%) | 122 (4.2%) |
| 80 to 84 Years | 72 (2.4%) | 43 (1.5%) |
| 85 Years and over | 65 (2.2%) | 129 (4.4%) |
| Total | 2,950 (100.0%) | 2,931 (100.0%) |
Families and Households in Estherville
Median Family Size in Estherville
The median family size in Estherville is 2.93 persons per family, with single female/mother families (292 | 23.0%) accounting for the largest median family size of 3.11 persons per family. On the other hand, single male/father families (63 | 5.0%) represent the smallest median family size with 2.30 persons per family.
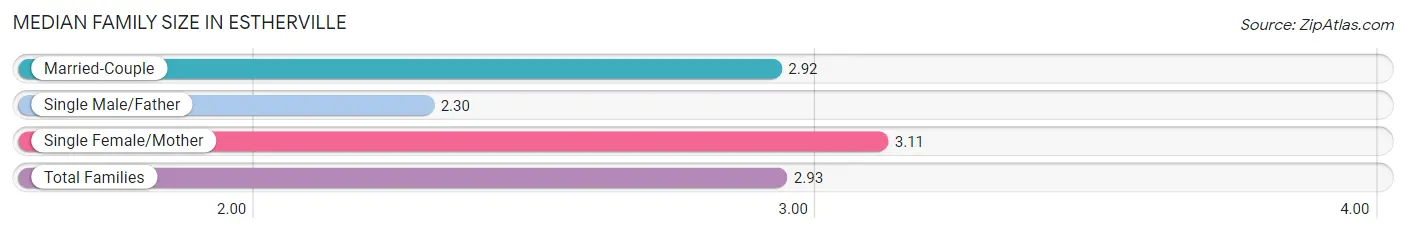
| Family Type | # Families | Family Size |
| Married-Couple | 917 (72.1%) | 2.92 |
| Single Male/Father | 63 (5.0%) | 2.30 |
| Single Female/Mother | 292 (23.0%) | 3.11 |
| Total Families | 1,272 (100.0%) | 2.93 |
Median Household Size in Estherville
The median household size in Estherville is 2.22 persons per household, with single female/mother households (292 | 12.2%) accounting for the largest median household size of 3.42 persons per household. non-family households (1,111 | 46.6%) represent the smallest median household size with 1.27 persons per household.
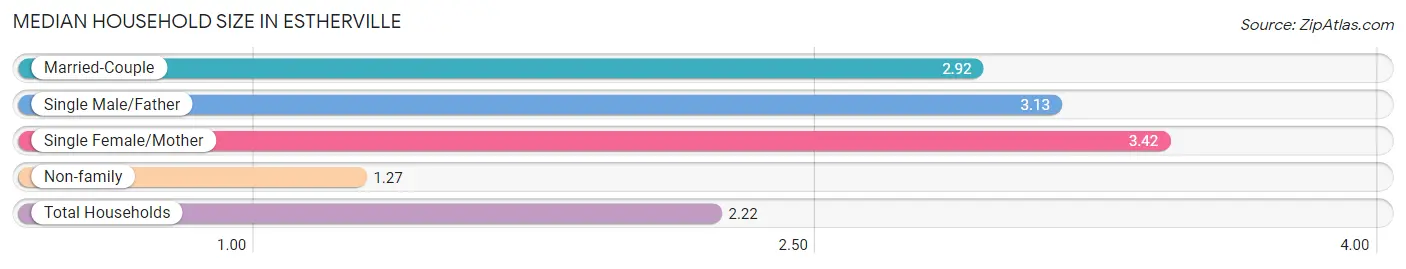
| Household Type | # Households | Household Size |
| Married-Couple | 917 (38.5%) | 2.92 |
| Single Male/Father | 63 (2.6%) | 3.13 |
| Single Female/Mother | 292 (12.2%) | 3.42 |
| Non-family | 1,111 (46.6%) | 1.27 |
| Total Households | 2,383 (100.0%) | 2.22 |
Household Size by Marriage Status in Estherville
Out of a total of 2,383 households in Estherville, 1,272 (53.4%) are family households, while 1,111 (46.6%) are nonfamily households. The most numerous type of family households are 2-person households, comprising 672, and the most common type of nonfamily households are 1-person households, comprising 896.
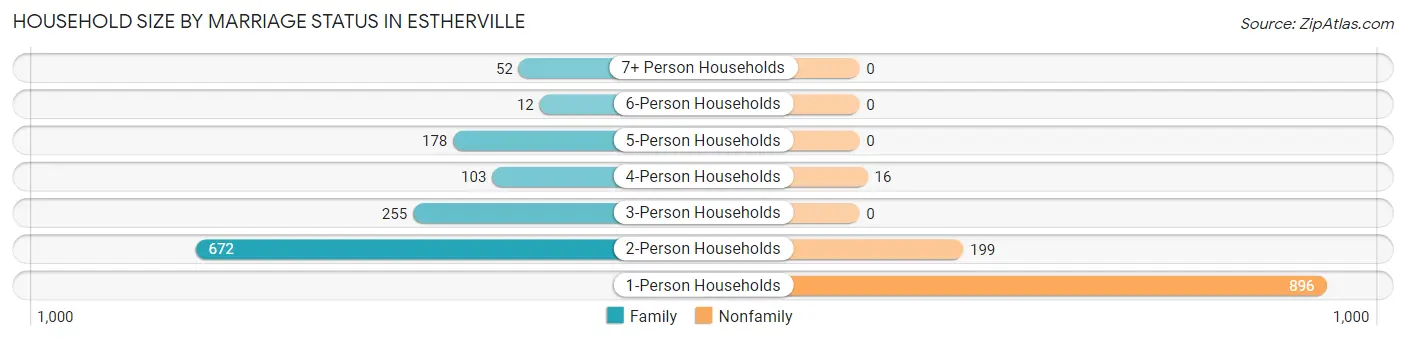
| Household Size | Family Households | Nonfamily Households |
| 1-Person Households | - | 896 (37.6%) |
| 2-Person Households | 672 (28.2%) | 199 (8.4%) |
| 3-Person Households | 255 (10.7%) | 0 (0.0%) |
| 4-Person Households | 103 (4.3%) | 16 (0.7%) |
| 5-Person Households | 178 (7.5%) | 0 (0.0%) |
| 6-Person Households | 12 (0.5%) | 0 (0.0%) |
| 7+ Person Households | 52 (2.2%) | 0 (0.0%) |
| Total | 1,272 (53.4%) | 1,111 (46.6%) |
Female Fertility in Estherville
Fertility by Age in Estherville
Average fertility rate in Estherville is 96.0 births per 1,000 women. Women in the age bracket of 20 to 34 years have the highest fertility rate with 218.0 births per 1,000 women. Women in the age bracket of 20 to 34 years acount for 75.7% of all women with births.
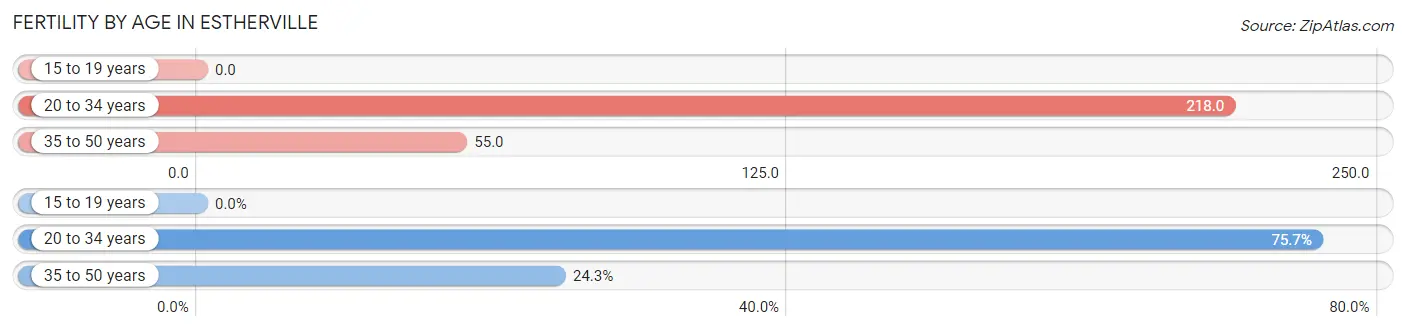
| Age Bracket | Women with Births | Births / 1,000 Women |
| 15 to 19 years | 0 (0.0%) | 0.0 |
| 20 to 34 years | 81 (75.7%) | 218.0 |
| 35 to 50 years | 26 (24.3%) | 55.0 |
| Total | 107 (100.0%) | 96.0 |
Fertility by Age by Marriage Status in Estherville
31.8% of women with births (107) in Estherville are married. The highest percentage of unmarried women with births falls into 20 to 34 years age bracket with 90.1% of them unmarried at the time of birth, while the lowest percentage of unmarried women with births belong to 35 to 50 years age bracket with 0.0% of them unmarried.
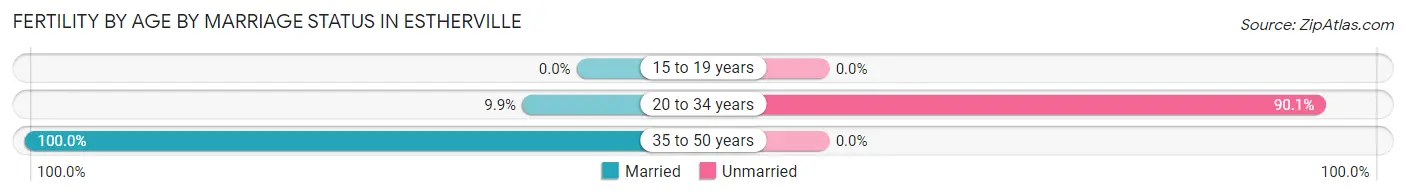
| Age Bracket | Married | Unmarried |
| 15 to 19 years | 0 (0.0%) | 0 (0.0%) |
| 20 to 34 years | 8 (9.9%) | 73 (90.1%) |
| 35 to 50 years | 26 (100.0%) | 0 (0.0%) |
| Total | 34 (31.8%) | 73 (68.2%) |
Fertility by Education in Estherville
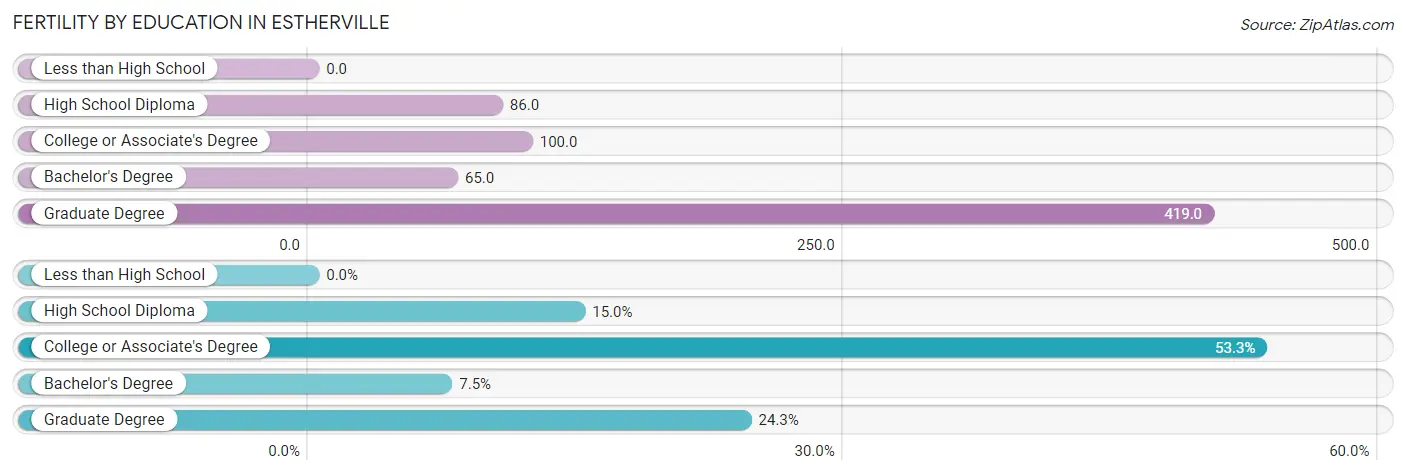
| Educational Attainment | Women with Births | Births / 1,000 Women |
| Less than High School | 0 (0.0%) | 0.0 |
| High School Diploma | 16 (14.9%) | 86.0 |
| College or Associate's Degree | 57 (53.3%) | 100.0 |
| Bachelor's Degree | 8 (7.5%) | 65.0 |
| Graduate Degree | 26 (24.3%) | 419.0 |
| Total | 107 (100.0%) | 96.0 |
Fertility by Education by Marriage Status in Estherville
68.2% of women with births in Estherville are unmarried. Women with the educational attainment of bachelor's degree are most likely to be married with 100.0% of them married at childbirth, while women with the educational attainment of high school diploma are least likely to be married with 100.0% of them unmarried at childbirth.
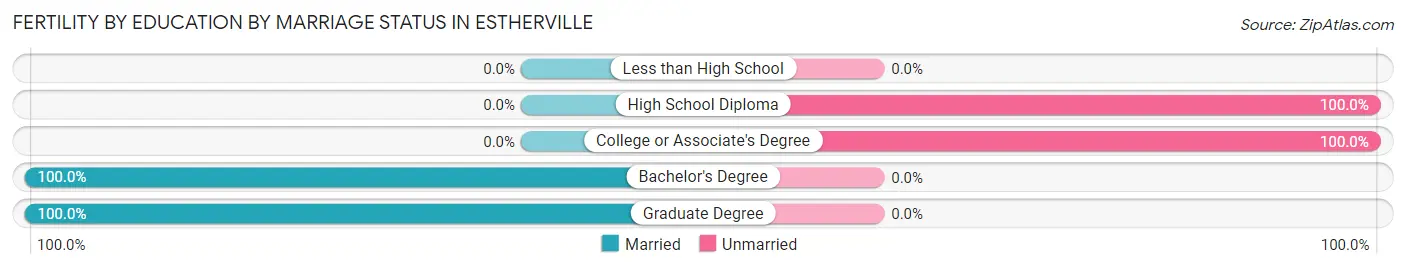
| Educational Attainment | Married | Unmarried |
| Less than High School | 0 (0.0%) | 0 (0.0%) |
| High School Diploma | 0 (0.0%) | 16 (100.0%) |
| College or Associate's Degree | 0 (0.0%) | 57 (100.0%) |
| Bachelor's Degree | 8 (100.0%) | 0 (0.0%) |
| Graduate Degree | 26 (100.0%) | 0 (0.0%) |
| Total | 34 (31.8%) | 73 (68.2%) |
Employment Characteristics in Estherville
Employment by Class of Employer in Estherville
Among the 2,972 employed individuals in Estherville, private company employees (2,240 | 75.4%), not-for-profit organizations (226 | 7.6%), and local government employees (173 | 5.8%) make up the most common classes of employment.
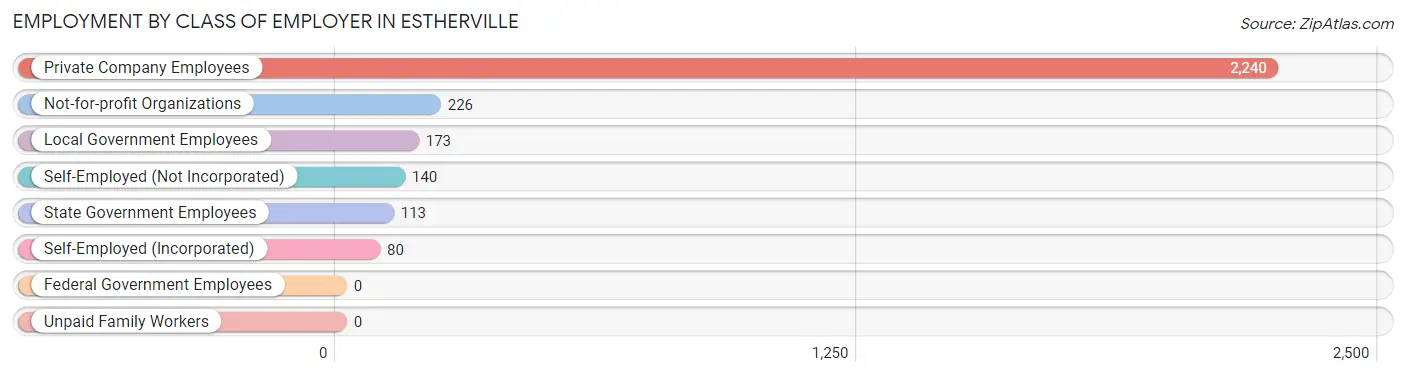
| Employer Class | # Employees | % Employees |
| Private Company Employees | 2,240 | 75.4% |
| Self-Employed (Incorporated) | 80 | 2.7% |
| Self-Employed (Not Incorporated) | 140 | 4.7% |
| Not-for-profit Organizations | 226 | 7.6% |
| Local Government Employees | 173 | 5.8% |
| State Government Employees | 113 | 3.8% |
| Federal Government Employees | 0 | 0.0% |
| Unpaid Family Workers | 0 | 0.0% |
| Total | 2,972 | 100.0% |
Employment Status by Age in Estherville
According to the labor force statistics for Estherville, out of the total population over 16 years of age (4,885), 62.7% or 3,063 individuals are in the labor force, with 2.3% or 70 of them unemployed. The age group with the highest labor force participation rate is 35 to 44 years, with 94.5% or 684 individuals in the labor force. Within the labor force, the 16 to 19 years age range has the highest percentage of unemployed individuals, with 9.6% or 26 of them being unemployed.
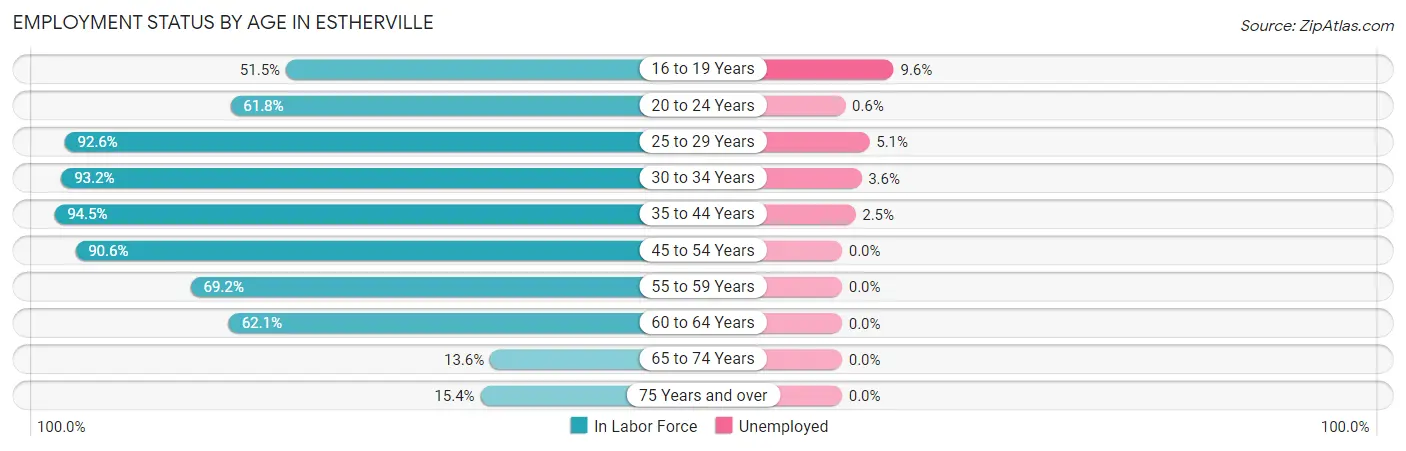
| Age Bracket | In Labor Force | Unemployed |
| 16 to 19 Years | 270 (51.5%) | 26 (9.6%) |
| 20 to 24 Years | 173 (61.8%) | 1 (0.6%) |
| 25 to 29 Years | 315 (92.6%) | 16 (5.1%) |
| 30 to 34 Years | 248 (93.2%) | 9 (3.6%) |
| 35 to 44 Years | 684 (94.5%) | 17 (2.5%) |
| 45 to 54 Years | 623 (90.6%) | 0 (0.0%) |
| 55 to 59 Years | 286 (69.2%) | 0 (0.0%) |
| 60 to 64 Years | 297 (62.1%) | 0 (0.0%) |
| 65 to 74 Years | 88 (13.6%) | 0 (0.0%) |
| 75 Years and over | 81 (15.4%) | 0 (0.0%) |
| Total | 3,063 (62.7%) | 70 (2.3%) |
Employment Status by Educational Attainment in Estherville
According to labor force statistics for Estherville, 84.3% of individuals (2,452) out of the total population between 25 and 64 years of age (2,909) are in the labor force, with 1.7% or 42 of them being unemployed. The group with the highest labor force participation rate are those with the educational attainment of bachelor's degree or higher, with 92.1% or 328 individuals in the labor force. Within the labor force, individuals with high school diploma education have the highest percentage of unemployment, with 4.6% or 33 of them being unemployed.
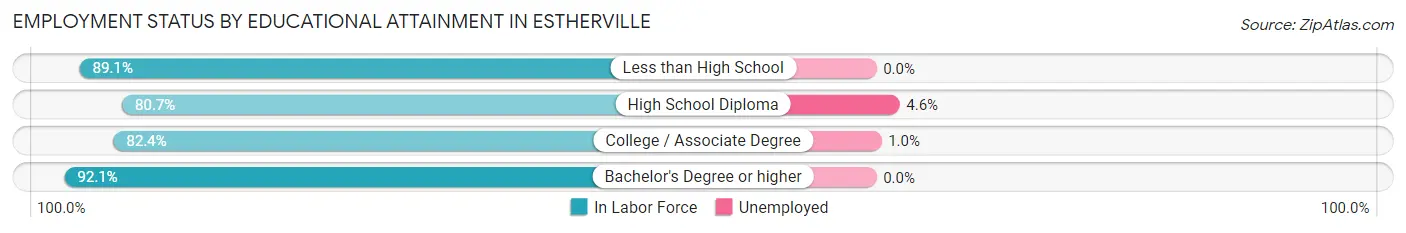
| Educational Attainment | In Labor Force | Unemployed |
| Less than High School | 484 (89.1%) | 0 (0.0%) |
| High School Diploma | 717 (80.7%) | 41 (4.6%) |
| College / Associate Degree | 925 (82.4%) | 11 (1.0%) |
| Bachelor's Degree or higher | 328 (92.1%) | 0 (0.0%) |
| Total | 2,452 (84.3%) | 49 (1.7%) |
Employment Occupations by Sex in Estherville
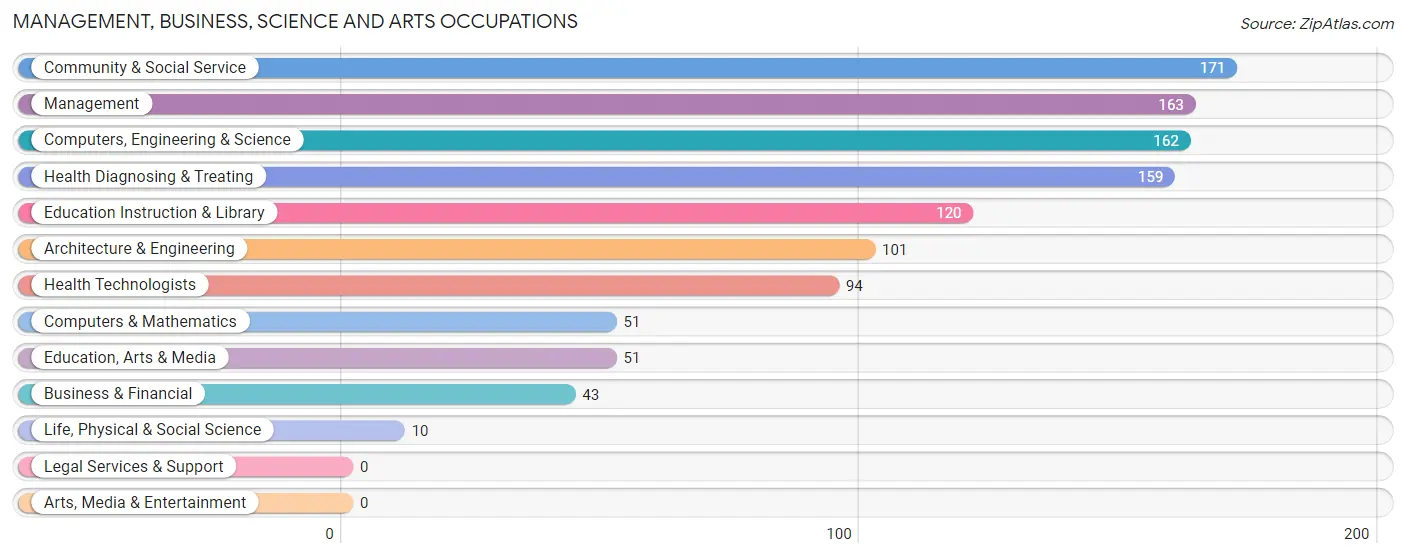
Management, Business, Science and Arts Occupations
The most common Management, Business, Science and Arts occupations in Estherville are Community & Social Service (171 | 5.7%), Management (163 | 5.4%), Computers, Engineering & Science (162 | 5.4%), Health Diagnosing & Treating (159 | 5.3%), and Education Instruction & Library (120 | 4.0%).
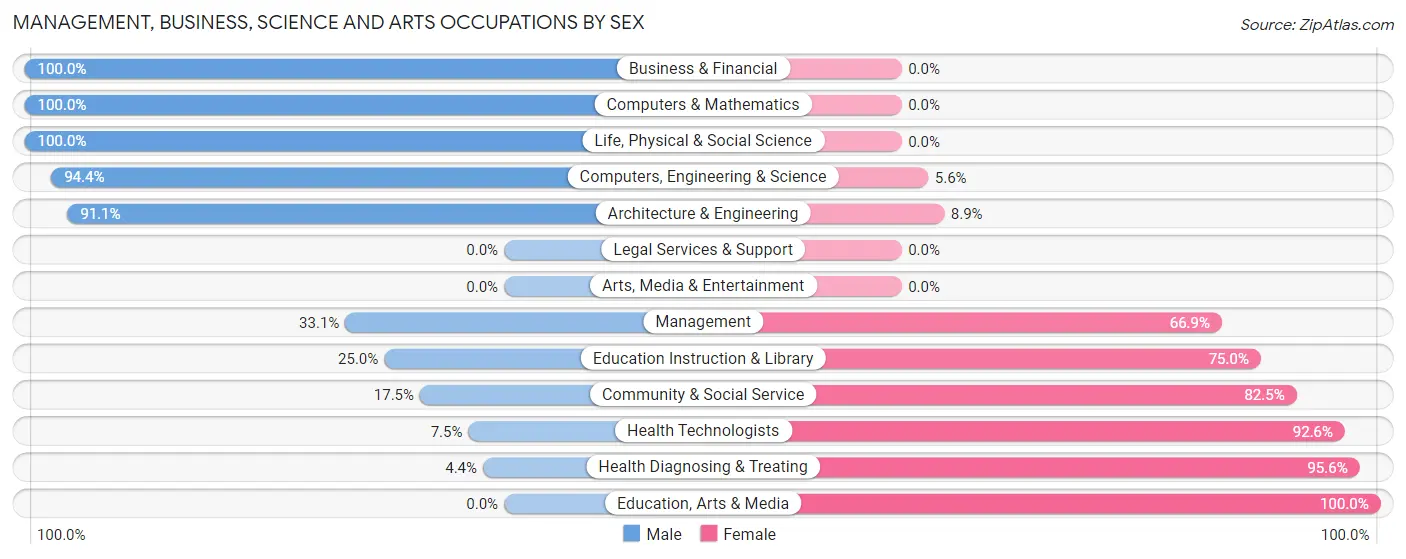
Management, Business, Science and Arts Occupations by Sex
Within the Management, Business, Science and Arts occupations in Estherville, the most male-oriented occupations are Business & Financial (100.0%), Computers & Mathematics (100.0%), and Life, Physical & Social Science (100.0%), while the most female-oriented occupations are Education, Arts & Media (100.0%), Health Diagnosing & Treating (95.6%), and Health Technologists (92.5%).
| Occupation | Male | Female |
| Management | 54 (33.1%) | 109 (66.9%) |
| Business & Financial | 43 (100.0%) | 0 (0.0%) |
| Computers, Engineering & Science | 153 (94.4%) | 9 (5.6%) |
| Computers & Mathematics | 51 (100.0%) | 0 (0.0%) |
| Architecture & Engineering | 92 (91.1%) | 9 (8.9%) |
| Life, Physical & Social Science | 10 (100.0%) | 0 (0.0%) |
| Community & Social Service | 30 (17.5%) | 141 (82.5%) |
| Education, Arts & Media | 0 (0.0%) | 51 (100.0%) |
| Legal Services & Support | 0 (0.0%) | 0 (0.0%) |
| Education Instruction & Library | 30 (25.0%) | 90 (75.0%) |
| Arts, Media & Entertainment | 0 (0.0%) | 0 (0.0%) |
| Health Diagnosing & Treating | 7 (4.4%) | 152 (95.6%) |
| Health Technologists | 7 (7.4%) | 87 (92.5%) |
| Total (Category) | 287 (41.1%) | 411 (58.9%) |
| Total (Overall) | 1,703 (56.8%) | 1,293 (43.2%) |
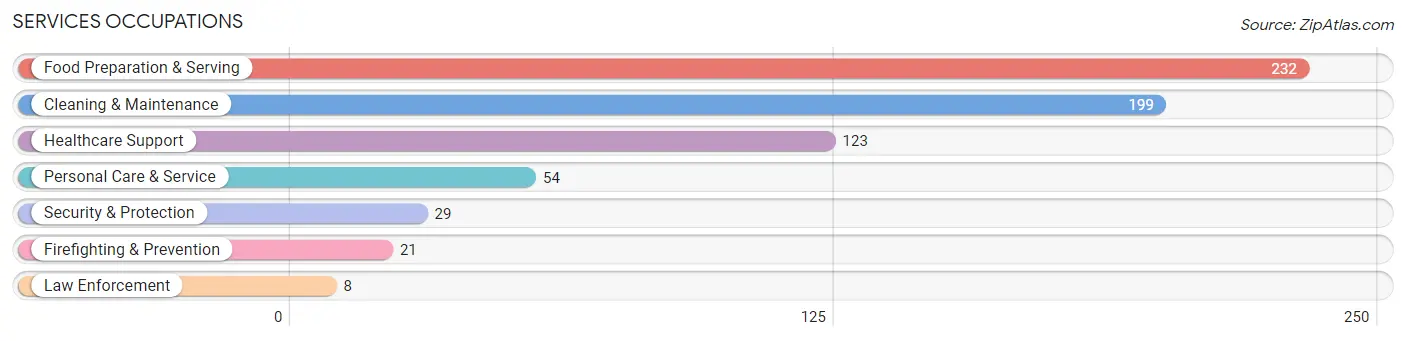
Services Occupations
The most common Services occupations in Estherville are Food Preparation & Serving (232 | 7.7%), Cleaning & Maintenance (199 | 6.6%), Healthcare Support (123 | 4.1%), Personal Care & Service (54 | 1.8%), and Security & Protection (29 | 1.0%).
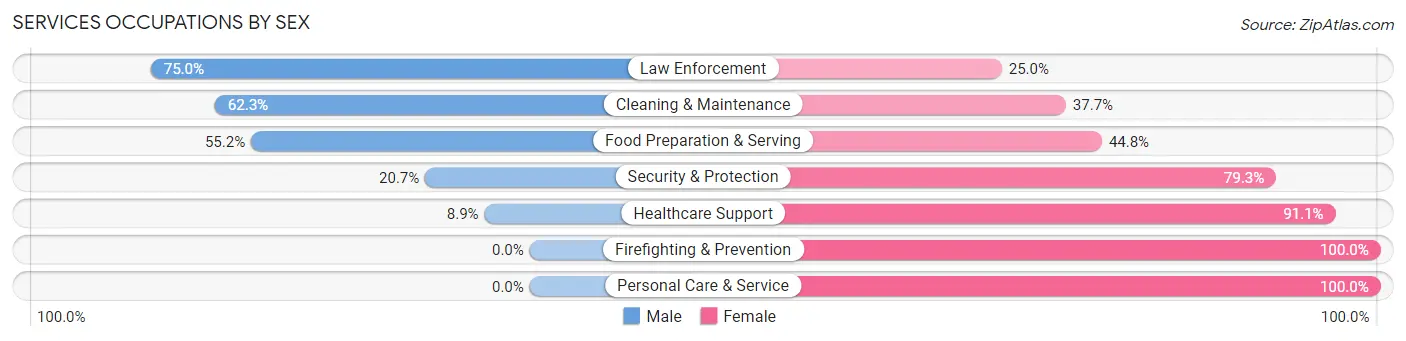
Services Occupations by Sex
Within the Services occupations in Estherville, the most male-oriented occupations are Law Enforcement (75.0%), Cleaning & Maintenance (62.3%), and Food Preparation & Serving (55.2%), while the most female-oriented occupations are Firefighting & Prevention (100.0%), Personal Care & Service (100.0%), and Healthcare Support (91.1%).
| Occupation | Male | Female |
| Healthcare Support | 11 (8.9%) | 112 (91.1%) |
| Security & Protection | 6 (20.7%) | 23 (79.3%) |
| Firefighting & Prevention | 0 (0.0%) | 21 (100.0%) |
| Law Enforcement | 6 (75.0%) | 2 (25.0%) |
| Food Preparation & Serving | 128 (55.2%) | 104 (44.8%) |
| Cleaning & Maintenance | 124 (62.3%) | 75 (37.7%) |
| Personal Care & Service | 0 (0.0%) | 54 (100.0%) |
| Total (Category) | 269 (42.2%) | 368 (57.8%) |
| Total (Overall) | 1,703 (56.8%) | 1,293 (43.2%) |
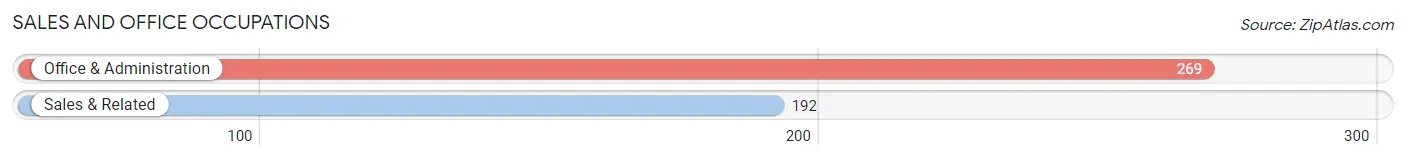
Sales and Office Occupations
The most common Sales and Office occupations in Estherville are Office & Administration (269 | 9.0%), and Sales & Related (192 | 6.4%).
Sales and Office Occupations by Sex
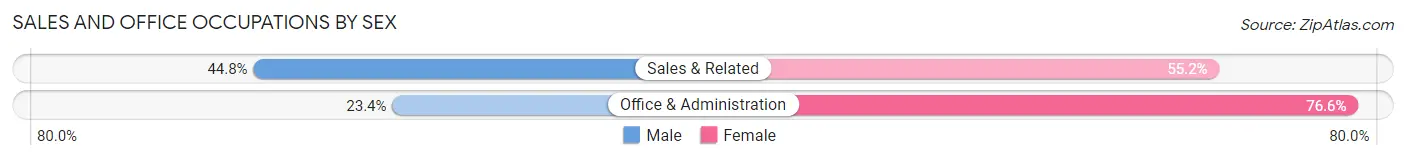
| Occupation | Male | Female |
| Sales & Related | 86 (44.8%) | 106 (55.2%) |
| Office & Administration | 63 (23.4%) | 206 (76.6%) |
| Total (Category) | 149 (32.3%) | 312 (67.7%) |
| Total (Overall) | 1,703 (56.8%) | 1,293 (43.2%) |
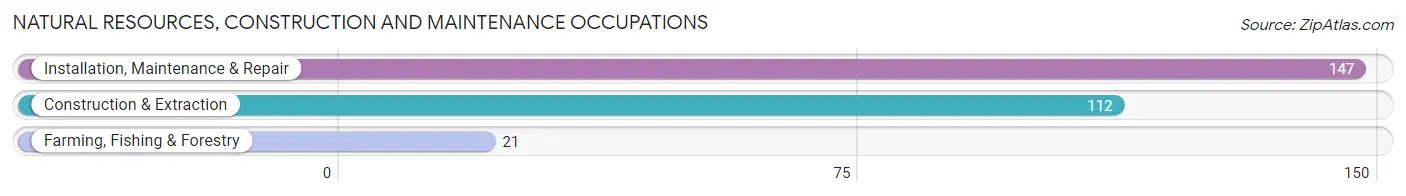
Natural Resources, Construction and Maintenance Occupations
The most common Natural Resources, Construction and Maintenance occupations in Estherville are Installation, Maintenance & Repair (147 | 4.9%), Construction & Extraction (112 | 3.7%), and Farming, Fishing & Forestry (21 | 0.7%).
Natural Resources, Construction and Maintenance Occupations by Sex
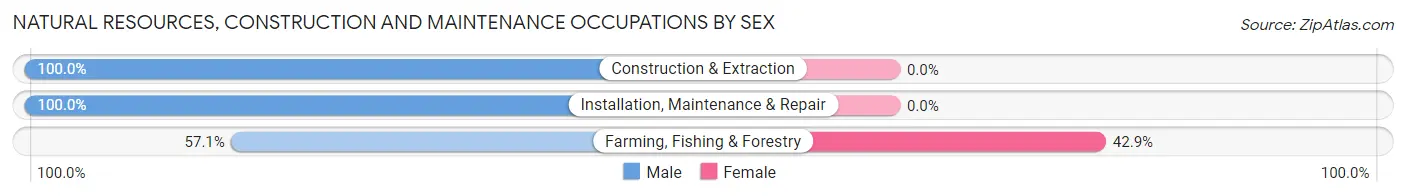
| Occupation | Male | Female |
| Farming, Fishing & Forestry | 12 (57.1%) | 9 (42.9%) |
| Construction & Extraction | 112 (100.0%) | 0 (0.0%) |
| Installation, Maintenance & Repair | 147 (100.0%) | 0 (0.0%) |
| Total (Category) | 271 (96.8%) | 9 (3.2%) |
| Total (Overall) | 1,703 (56.8%) | 1,293 (43.2%) |
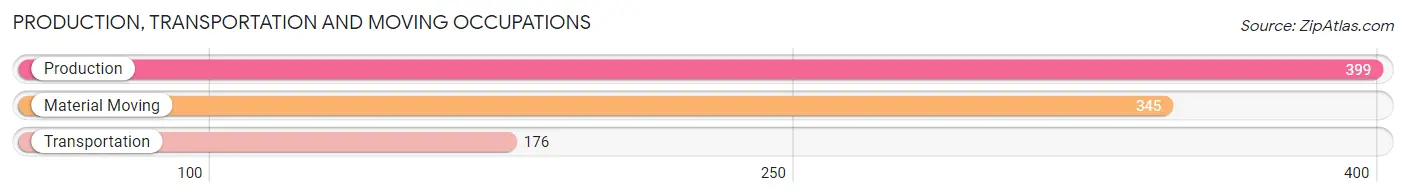
Production, Transportation and Moving Occupations
The most common Production, Transportation and Moving occupations in Estherville are Production (399 | 13.3%), Material Moving (345 | 11.5%), and Transportation (176 | 5.9%).
Production, Transportation and Moving Occupations by Sex
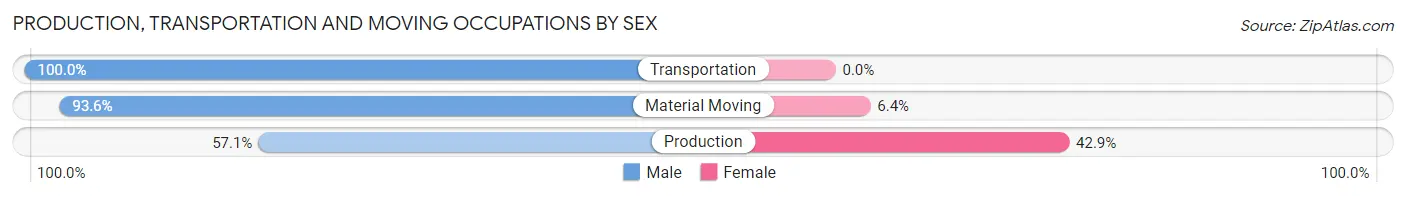
| Occupation | Male | Female |
| Production | 228 (57.1%) | 171 (42.9%) |
| Transportation | 176 (100.0%) | 0 (0.0%) |
| Material Moving | 323 (93.6%) | 22 (6.4%) |
| Total (Category) | 727 (79.0%) | 193 (21.0%) |
| Total (Overall) | 1,703 (56.8%) | 1,293 (43.2%) |
Employment Industries by Sex in Estherville
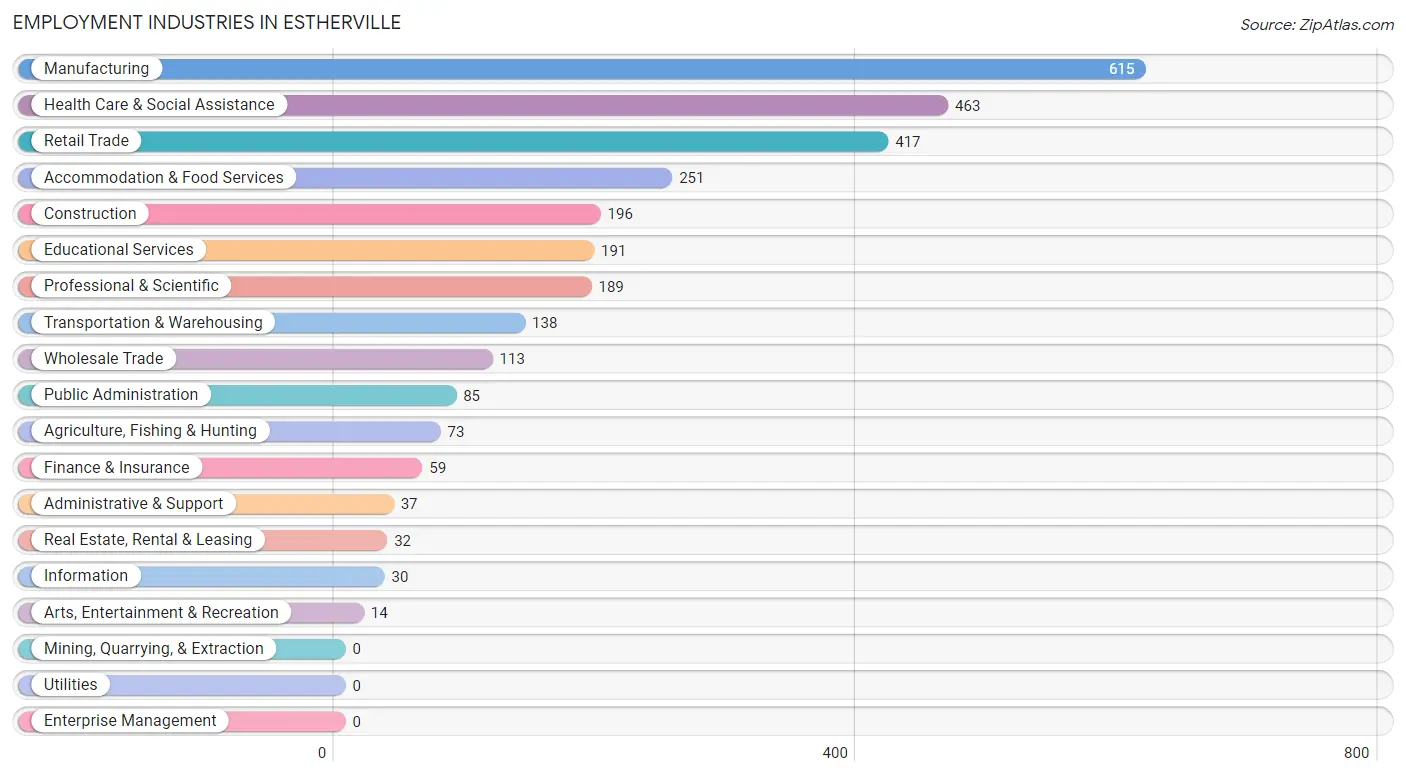
Employment Industries in Estherville
The major employment industries in Estherville include Manufacturing (615 | 20.5%), Health Care & Social Assistance (463 | 15.4%), Retail Trade (417 | 13.9%), Accommodation & Food Services (251 | 8.4%), and Construction (196 | 6.5%).
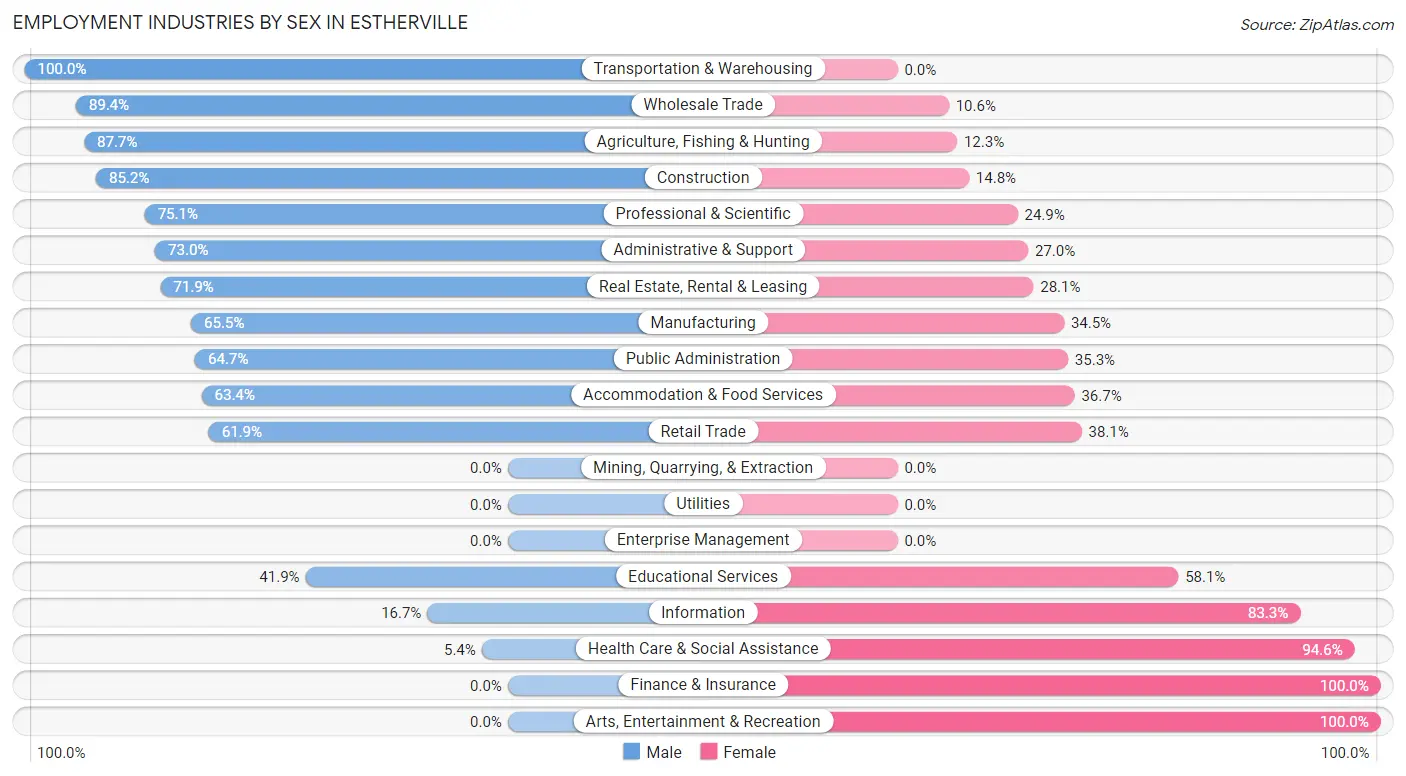
Employment Industries by Sex in Estherville
The Estherville industries that see more men than women are Transportation & Warehousing (100.0%), Wholesale Trade (89.4%), and Agriculture, Fishing & Hunting (87.7%), whereas the industries that tend to have a higher number of women are Finance & Insurance (100.0%), Arts, Entertainment & Recreation (100.0%), and Health Care & Social Assistance (94.6%).
| Industry | Male | Female |
| Agriculture, Fishing & Hunting | 64 (87.7%) | 9 (12.3%) |
| Mining, Quarrying, & Extraction | 0 (0.0%) | 0 (0.0%) |
| Construction | 167 (85.2%) | 29 (14.8%) |
| Manufacturing | 403 (65.5%) | 212 (34.5%) |
| Wholesale Trade | 101 (89.4%) | 12 (10.6%) |
| Retail Trade | 258 (61.9%) | 159 (38.1%) |
| Transportation & Warehousing | 138 (100.0%) | 0 (0.0%) |
| Utilities | 0 (0.0%) | 0 (0.0%) |
| Information | 5 (16.7%) | 25 (83.3%) |
| Finance & Insurance | 0 (0.0%) | 59 (100.0%) |
| Real Estate, Rental & Leasing | 23 (71.9%) | 9 (28.1%) |
| Professional & Scientific | 142 (75.1%) | 47 (24.9%) |
| Enterprise Management | 0 (0.0%) | 0 (0.0%) |
| Administrative & Support | 27 (73.0%) | 10 (27.0%) |
| Educational Services | 80 (41.9%) | 111 (58.1%) |
| Health Care & Social Assistance | 25 (5.4%) | 438 (94.6%) |
| Arts, Entertainment & Recreation | 0 (0.0%) | 14 (100.0%) |
| Accommodation & Food Services | 159 (63.3%) | 92 (36.6%) |
| Public Administration | 55 (64.7%) | 30 (35.3%) |
| Total | 1,703 (56.8%) | 1,293 (43.2%) |
Education in Estherville
School Enrollment in Estherville
The most common levels of schooling among the 1,511 students in Estherville are college / undergraduate (561 | 37.1%), elementary school (367 | 24.3%), and middle school (238 | 15.8%).
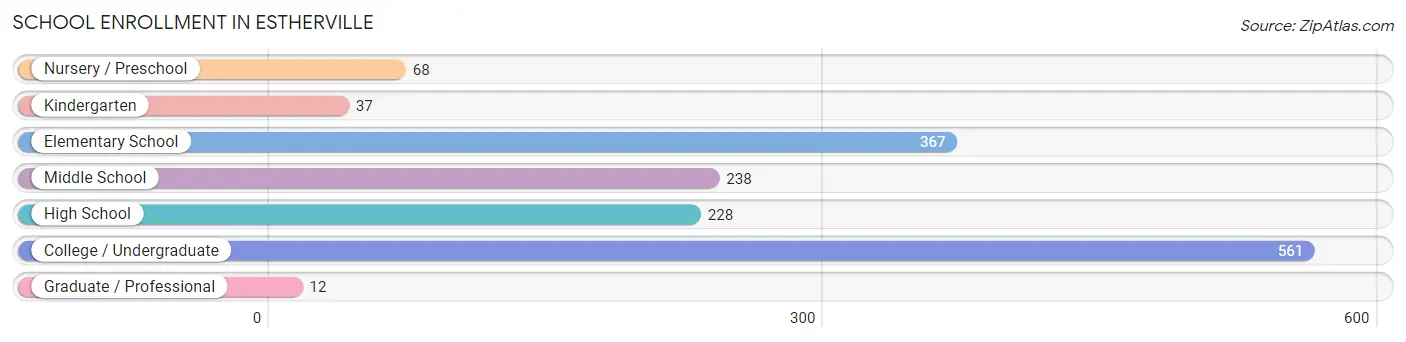
| School Level | # Students | % Students |
| Nursery / Preschool | 68 | 4.5% |
| Kindergarten | 37 | 2.5% |
| Elementary School | 367 | 24.3% |
| Middle School | 238 | 15.8% |
| High School | 228 | 15.1% |
| College / Undergraduate | 561 | 37.1% |
| Graduate / Professional | 12 | 0.8% |
| Total | 1,511 | 100.0% |
School Enrollment by Age by Funding Source in Estherville
Out of a total of 1,511 students who are enrolled in schools in Estherville, 54 (3.6%) attend a private institution, while the remaining 1,457 (96.4%) are enrolled in public schools. The age group of 3 to 4 year olds has the highest likelihood of being enrolled in private schools, with 5 (8.1% in the age bracket) enrolled. Conversely, the age group of 25 to 34 year olds has the lowest likelihood of being enrolled in a private school, with 1 (100.0% in the age bracket) attending a public institution.
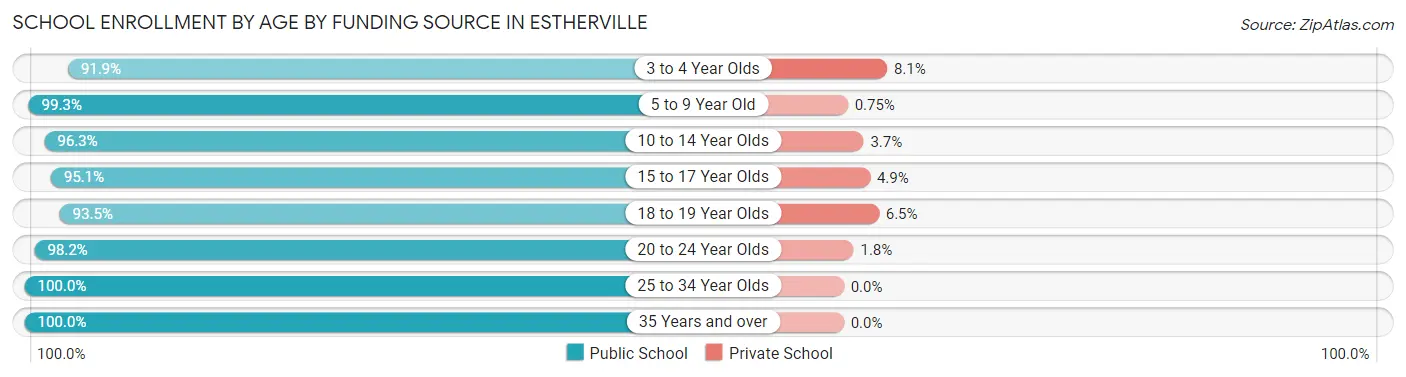
| Age Bracket | Public School | Private School |
| 3 to 4 Year Olds | 57 (91.9%) | 5 (8.1%) |
| 5 to 9 Year Old | 398 (99.3%) | 3 (0.7%) |
| 10 to 14 Year Olds | 235 (96.3%) | 9 (3.7%) |
| 15 to 17 Year Olds | 175 (95.1%) | 9 (4.9%) |
| 18 to 19 Year Olds | 357 (93.5%) | 25 (6.5%) |
| 20 to 24 Year Olds | 160 (98.2%) | 3 (1.8%) |
| 25 to 34 Year Olds | 1 (100.0%) | 0 (0.0%) |
| 35 Years and over | 74 (100.0%) | 0 (0.0%) |
| Total | 1,457 (96.4%) | 54 (3.6%) |
Educational Attainment by Field of Study in Estherville
Business (190 | 31.7%), education (114 | 19.0%), science & technology (64 | 10.7%), arts & humanities (63 | 10.5%), and bio, nature & agricultural (52 | 8.7%) are the most common fields of study among 599 individuals in Estherville who have obtained a bachelor's degree or higher.
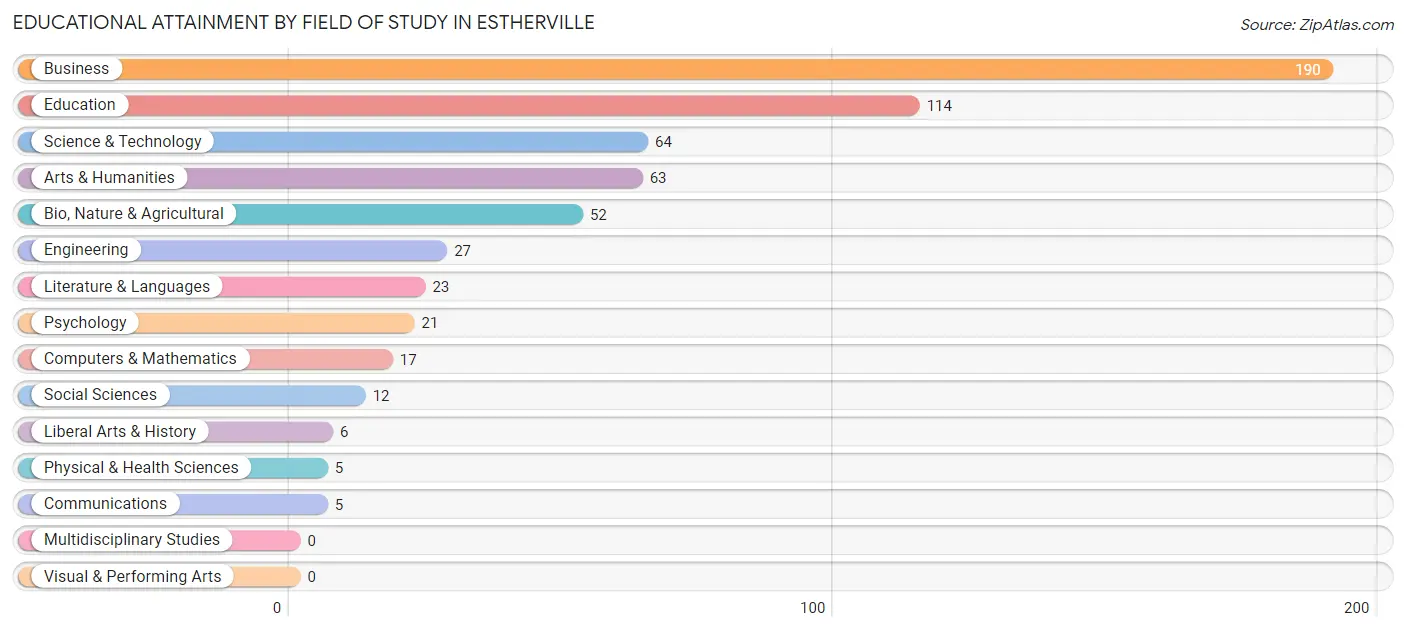
| Field of Study | # Graduates | % Graduates |
| Computers & Mathematics | 17 | 2.8% |
| Bio, Nature & Agricultural | 52 | 8.7% |
| Physical & Health Sciences | 5 | 0.8% |
| Psychology | 21 | 3.5% |
| Social Sciences | 12 | 2.0% |
| Engineering | 27 | 4.5% |
| Multidisciplinary Studies | 0 | 0.0% |
| Science & Technology | 64 | 10.7% |
| Business | 190 | 31.7% |
| Education | 114 | 19.0% |
| Literature & Languages | 23 | 3.8% |
| Liberal Arts & History | 6 | 1.0% |
| Visual & Performing Arts | 0 | 0.0% |
| Communications | 5 | 0.8% |
| Arts & Humanities | 63 | 10.5% |
| Total | 599 | 100.0% |
Transportation & Commute in Estherville
Vehicle Availability by Sex in Estherville
The most prevalent vehicle ownership categories in Estherville are males with 2 vehicles (674, accounting for 42.0%) and females with 2 vehicles (478, making up 55.4%).
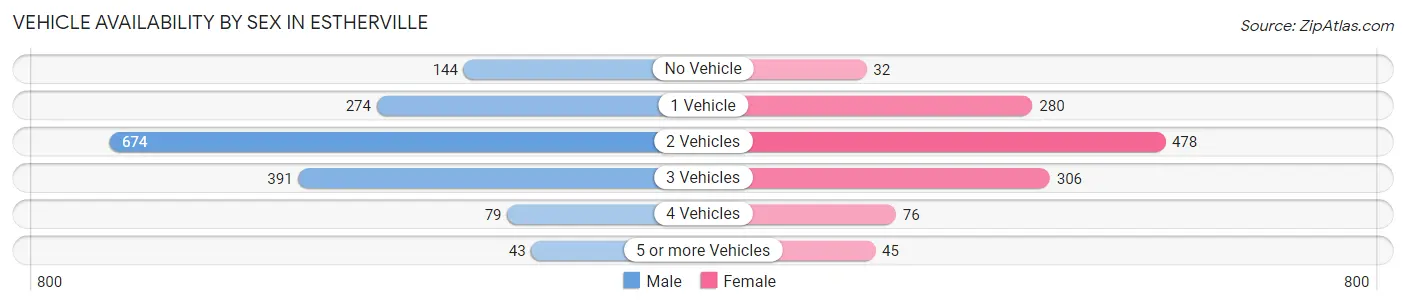
| Vehicles Available | Male | Female |
| No Vehicle | 144 (9.0%) | 32 (2.6%) |
| 1 Vehicle | 274 (17.1%) | 280 (23.0%) |
| 2 Vehicles | 674 (42.0%) | 478 (39.3%) |
| 3 Vehicles | 391 (24.4%) | 306 (25.1%) |
| 4 Vehicles | 79 (4.9%) | 76 (6.2%) |
| 5 or more Vehicles | 43 (2.7%) | 45 (3.7%) |
| Total | 1,605 (100.0%) | 1,217 (100.0%) |
Commute Time in Estherville
The most frequently occuring commute durations in Estherville are 5 to 9 minutes (833 commuters, 29.7%), 10 to 14 minutes (484 commuters, 17.3%), and less than 5 minutes (369 commuters, 13.2%).
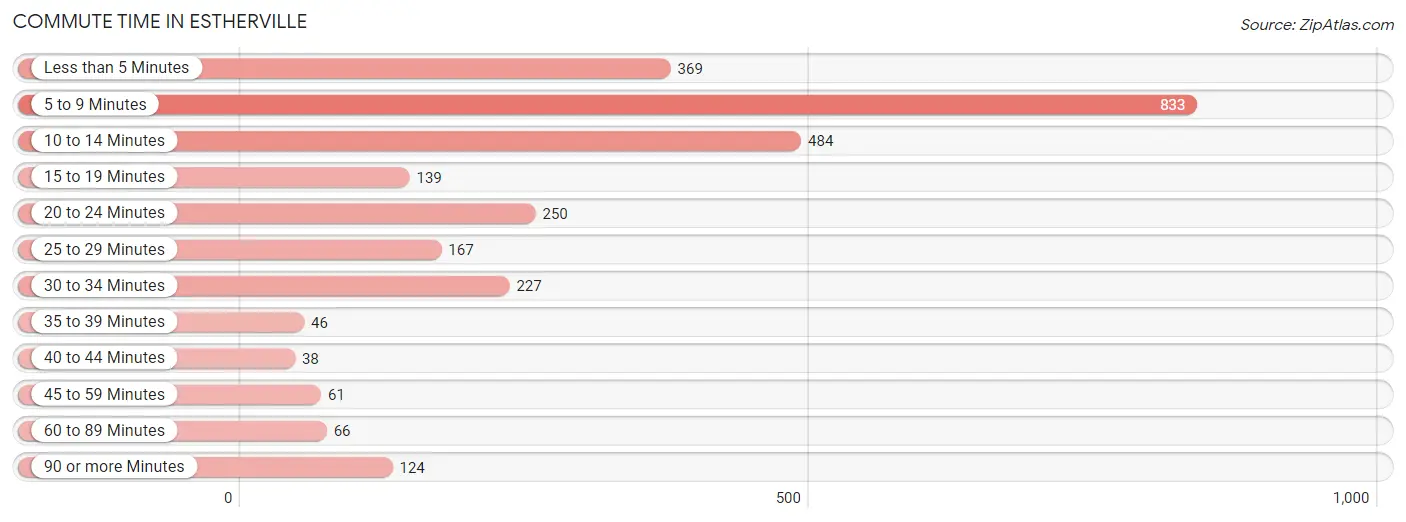
| Commute Time | # Commuters | % Commuters |
| Less than 5 Minutes | 369 | 13.2% |
| 5 to 9 Minutes | 833 | 29.7% |
| 10 to 14 Minutes | 484 | 17.3% |
| 15 to 19 Minutes | 139 | 5.0% |
| 20 to 24 Minutes | 250 | 8.9% |
| 25 to 29 Minutes | 167 | 6.0% |
| 30 to 34 Minutes | 227 | 8.1% |
| 35 to 39 Minutes | 46 | 1.6% |
| 40 to 44 Minutes | 38 | 1.4% |
| 45 to 59 Minutes | 61 | 2.2% |
| 60 to 89 Minutes | 66 | 2.4% |
| 90 or more Minutes | 124 | 4.4% |
Commute Time by Sex in Estherville
The most common commute times in Estherville are 5 to 9 minutes (342 commuters, 20.9%) for males and 5 to 9 minutes (491 commuters, 42.0%) for females.
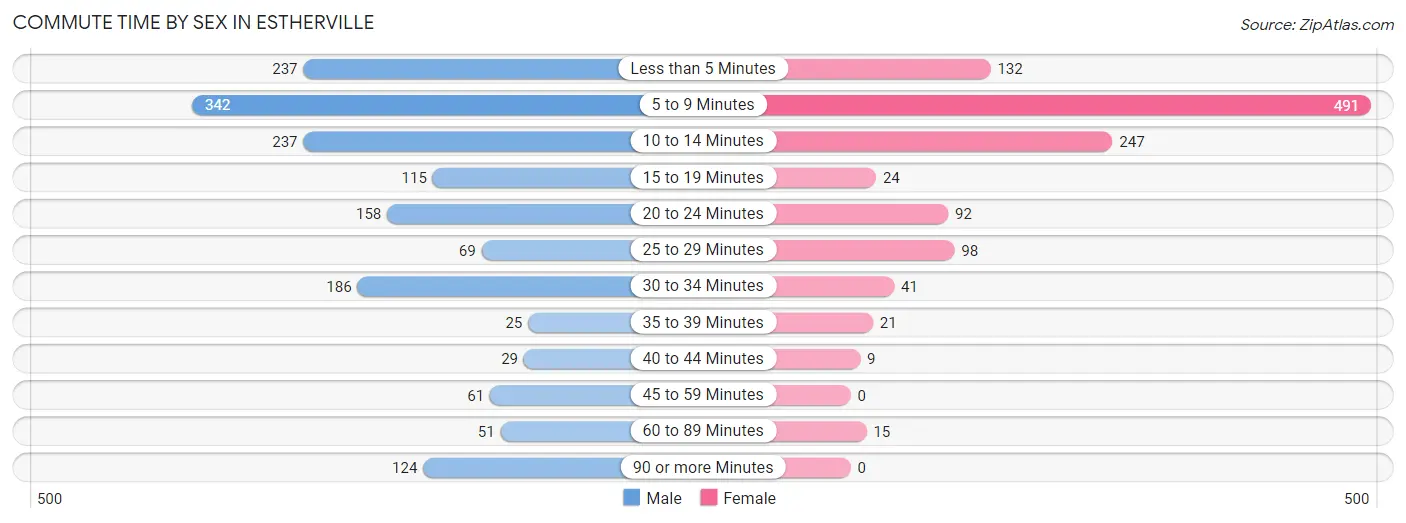
| Commute Time | Male | Female |
| Less than 5 Minutes | 237 (14.5%) | 132 (11.3%) |
| 5 to 9 Minutes | 342 (20.9%) | 491 (42.0%) |
| 10 to 14 Minutes | 237 (14.5%) | 247 (21.1%) |
| 15 to 19 Minutes | 115 (7.0%) | 24 (2.1%) |
| 20 to 24 Minutes | 158 (9.7%) | 92 (7.9%) |
| 25 to 29 Minutes | 69 (4.2%) | 98 (8.4%) |
| 30 to 34 Minutes | 186 (11.4%) | 41 (3.5%) |
| 35 to 39 Minutes | 25 (1.5%) | 21 (1.8%) |
| 40 to 44 Minutes | 29 (1.8%) | 9 (0.8%) |
| 45 to 59 Minutes | 61 (3.7%) | 0 (0.0%) |
| 60 to 89 Minutes | 51 (3.1%) | 15 (1.3%) |
| 90 or more Minutes | 124 (7.6%) | 0 (0.0%) |
Time of Departure to Work by Sex in Estherville
The most frequent times of departure to work in Estherville are 8:00 AM to 8:29 AM (225, 13.8%) for males and 7:30 AM to 7:59 AM (253, 21.6%) for females.
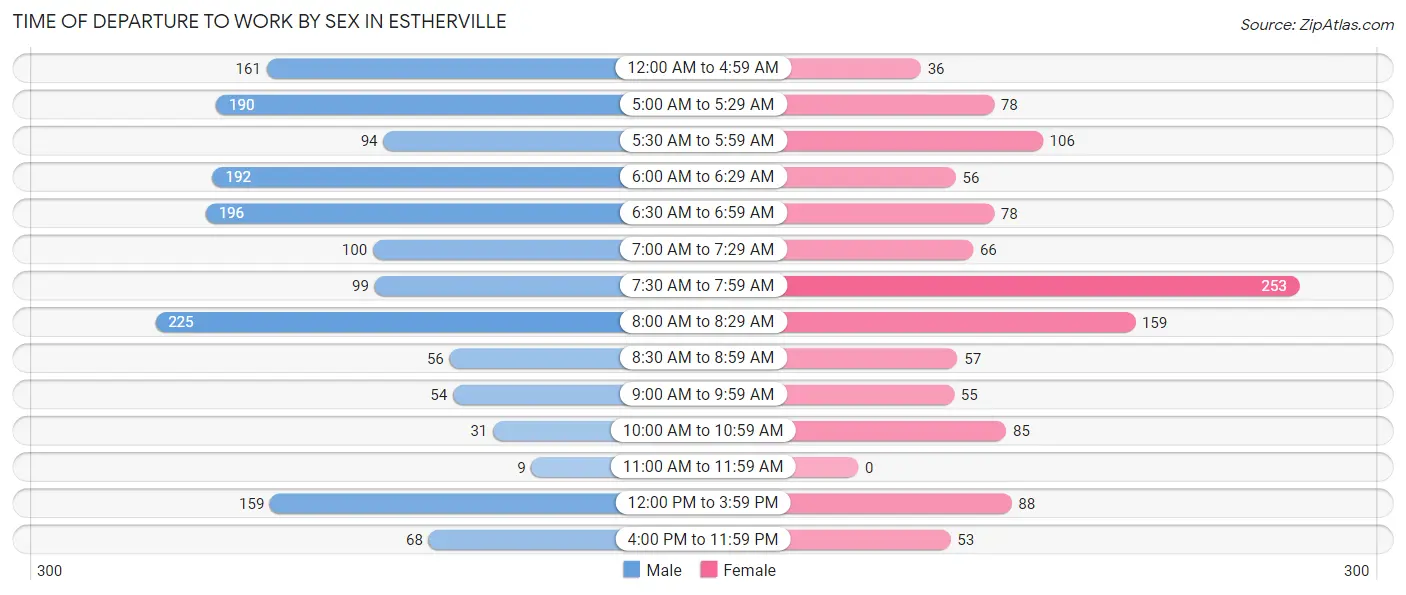
| Time of Departure | Male | Female |
| 12:00 AM to 4:59 AM | 161 (9.9%) | 36 (3.1%) |
| 5:00 AM to 5:29 AM | 190 (11.6%) | 78 (6.7%) |
| 5:30 AM to 5:59 AM | 94 (5.8%) | 106 (9.1%) |
| 6:00 AM to 6:29 AM | 192 (11.7%) | 56 (4.8%) |
| 6:30 AM to 6:59 AM | 196 (12.0%) | 78 (6.7%) |
| 7:00 AM to 7:29 AM | 100 (6.1%) | 66 (5.6%) |
| 7:30 AM to 7:59 AM | 99 (6.1%) | 253 (21.6%) |
| 8:00 AM to 8:29 AM | 225 (13.8%) | 159 (13.6%) |
| 8:30 AM to 8:59 AM | 56 (3.4%) | 57 (4.9%) |
| 9:00 AM to 9:59 AM | 54 (3.3%) | 55 (4.7%) |
| 10:00 AM to 10:59 AM | 31 (1.9%) | 85 (7.3%) |
| 11:00 AM to 11:59 AM | 9 (0.5%) | 0 (0.0%) |
| 12:00 PM to 3:59 PM | 159 (9.7%) | 88 (7.5%) |
| 4:00 PM to 11:59 PM | 68 (4.2%) | 53 (4.5%) |
| Total | 1,634 (100.0%) | 1,170 (100.0%) |
Housing Occupancy in Estherville
Occupancy by Ownership in Estherville
Of the total 2,383 dwellings in Estherville, owner-occupied units account for 1,716 (72.0%), while renter-occupied units make up 667 (28.0%).
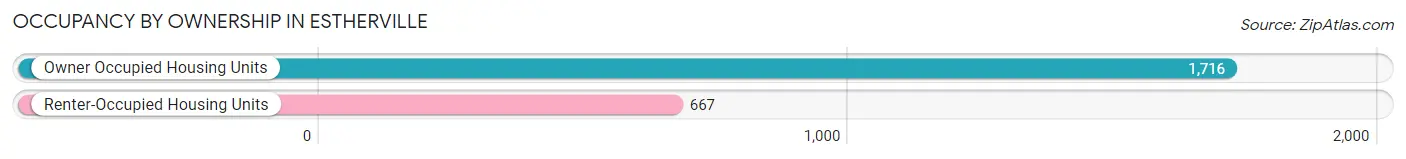
| Occupancy | # Housing Units | % Housing Units |
| Owner Occupied Housing Units | 1,716 | 72.0% |
| Renter-Occupied Housing Units | 667 | 28.0% |
| Total Occupied Housing Units | 2,383 | 100.0% |
Occupancy by Household Size in Estherville
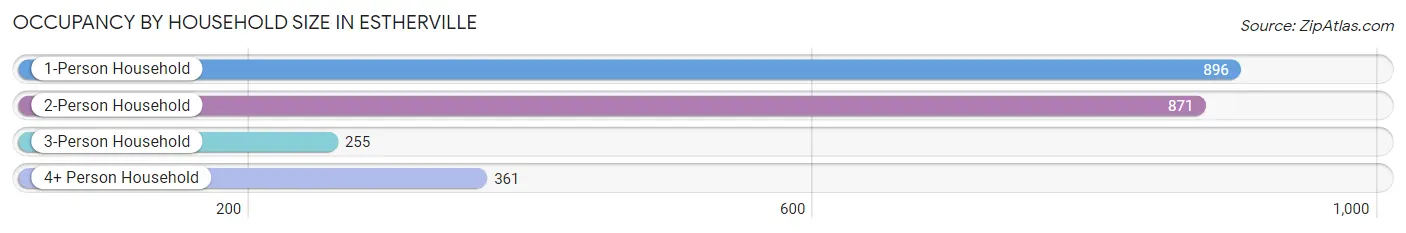
| Household Size | # Housing Units | % Housing Units |
| 1-Person Household | 896 | 37.6% |
| 2-Person Household | 871 | 36.5% |
| 3-Person Household | 255 | 10.7% |
| 4+ Person Household | 361 | 15.1% |
| Total Housing Units | 2,383 | 100.0% |
Occupancy by Ownership by Household Size in Estherville
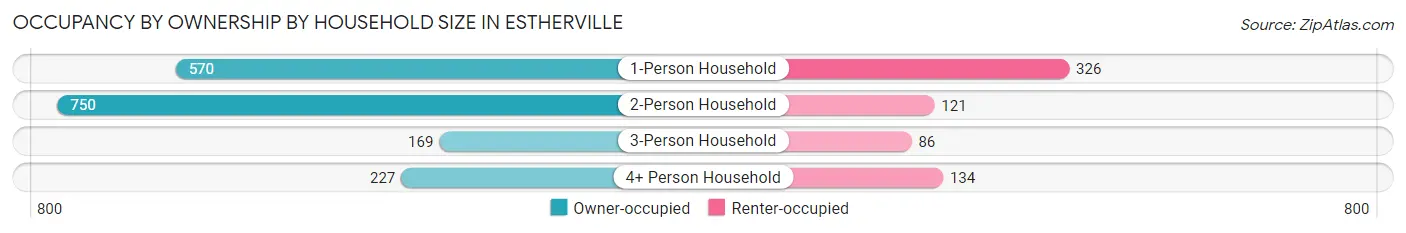
| Household Size | Owner-occupied | Renter-occupied |
| 1-Person Household | 570 (63.6%) | 326 (36.4%) |
| 2-Person Household | 750 (86.1%) | 121 (13.9%) |
| 3-Person Household | 169 (66.3%) | 86 (33.7%) |
| 4+ Person Household | 227 (62.9%) | 134 (37.1%) |
| Total Housing Units | 1,716 (72.0%) | 667 (28.0%) |
Occupancy by Educational Attainment in Estherville
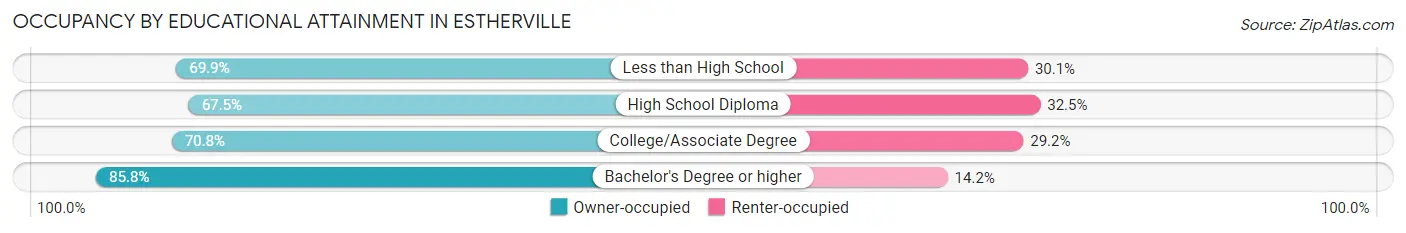
| Household Size | Owner-occupied | Renter-occupied |
| Less than High School | 237 (69.9%) | 102 (30.1%) |
| High School Diploma | 456 (67.5%) | 220 (32.5%) |
| College/Associate Degree | 714 (70.8%) | 294 (29.2%) |
| Bachelor's Degree or higher | 309 (85.8%) | 51 (14.2%) |
Occupancy by Age of Householder in Estherville
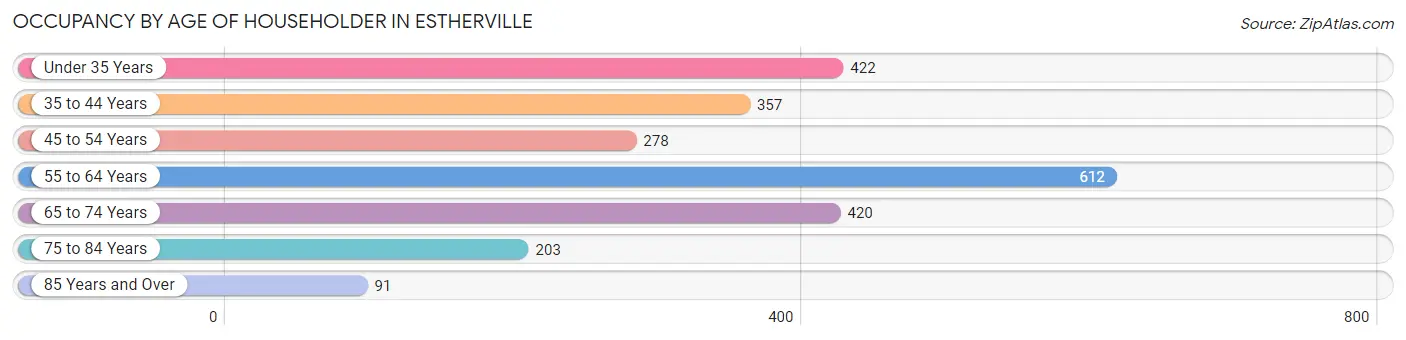
| Age Bracket | # Households | % Households |
| Under 35 Years | 422 | 17.7% |
| 35 to 44 Years | 357 | 15.0% |
| 45 to 54 Years | 278 | 11.7% |
| 55 to 64 Years | 612 | 25.7% |
| 65 to 74 Years | 420 | 17.6% |
| 75 to 84 Years | 203 | 8.5% |
| 85 Years and Over | 91 | 3.8% |
| Total | 2,383 | 100.0% |
Housing Finances in Estherville
Median Income by Occupancy in Estherville
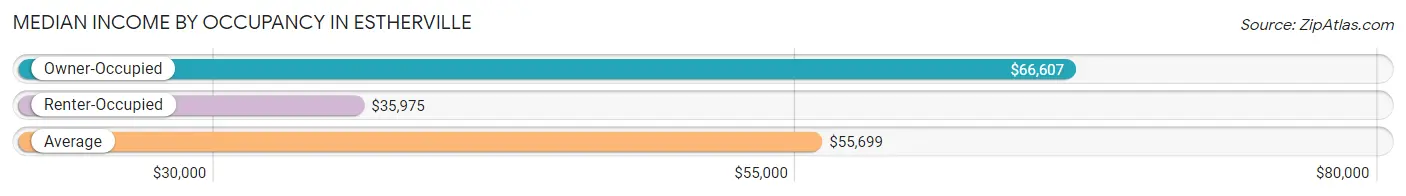
| Occupancy Type | # Households | Median Income |
| Owner-Occupied | 1,716 (72.0%) | $66,607 |
| Renter-Occupied | 667 (28.0%) | $35,975 |
| Average | 2,383 (100.0%) | $55,699 |
Occupancy by Householder Income Bracket in Estherville
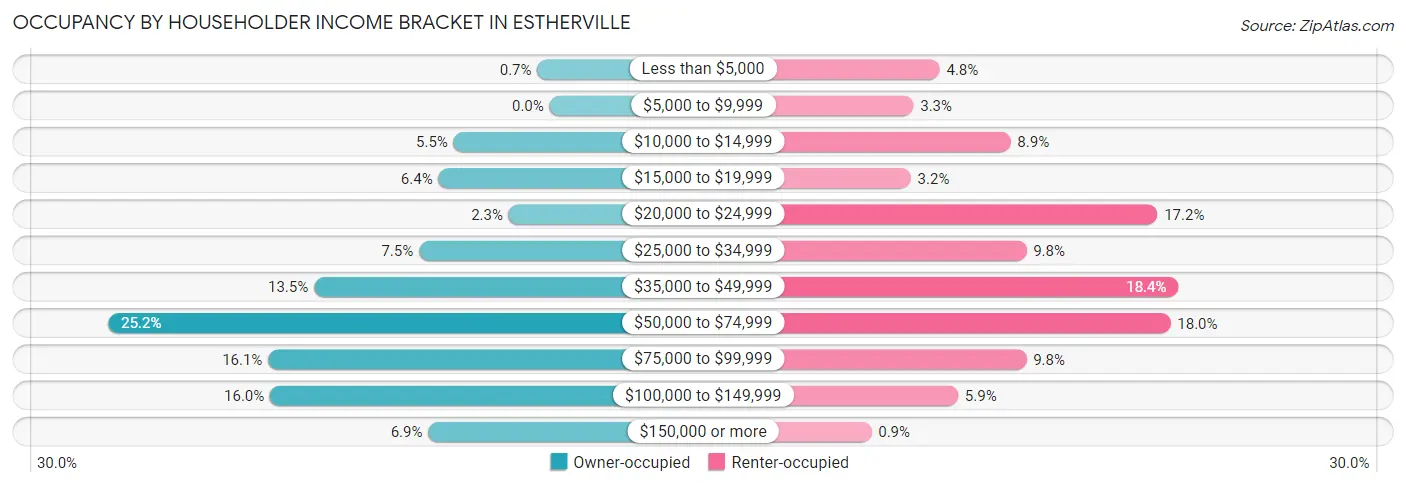
| Income Bracket | Owner-occupied | Renter-occupied |
| Less than $5,000 | 12 (0.7%) | 32 (4.8%) |
| $5,000 to $9,999 | 0 (0.0%) | 22 (3.3%) |
| $10,000 to $14,999 | 94 (5.5%) | 59 (8.8%) |
| $15,000 to $19,999 | 109 (6.4%) | 21 (3.2%) |
| $20,000 to $24,999 | 40 (2.3%) | 115 (17.2%) |
| $25,000 to $34,999 | 128 (7.5%) | 65 (9.8%) |
| $35,000 to $49,999 | 231 (13.5%) | 123 (18.4%) |
| $50,000 to $74,999 | 433 (25.2%) | 120 (18.0%) |
| $75,000 to $99,999 | 276 (16.1%) | 65 (9.8%) |
| $100,000 to $149,999 | 274 (16.0%) | 39 (5.9%) |
| $150,000 or more | 119 (6.9%) | 6 (0.9%) |
| Total | 1,716 (100.0%) | 667 (100.0%) |
Monthly Housing Cost Tiers in Estherville
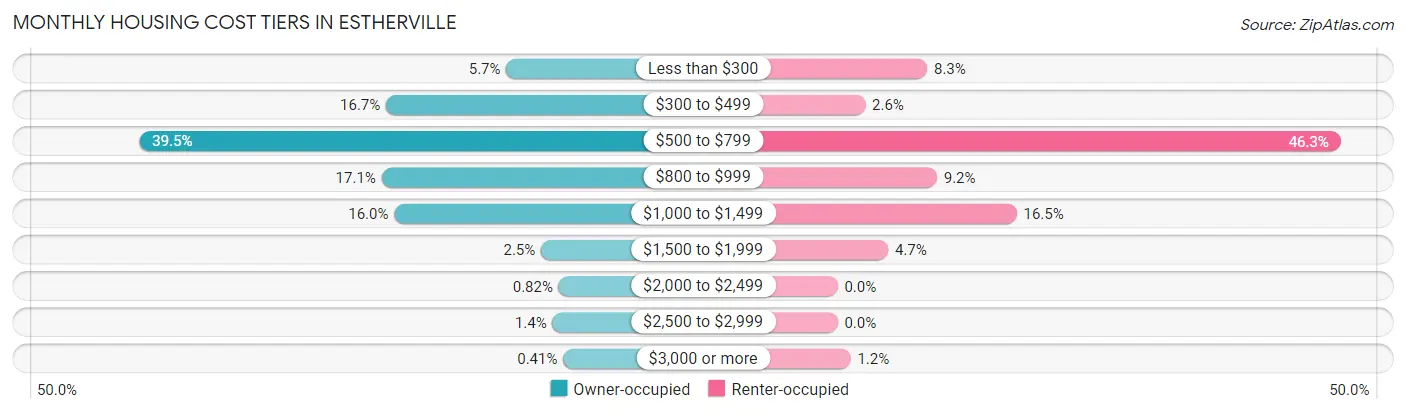
| Monthly Cost | Owner-occupied | Renter-occupied |
| Less than $300 | 97 (5.7%) | 55 (8.3%) |
| $300 to $499 | 287 (16.7%) | 17 (2.5%) |
| $500 to $799 | 677 (39.5%) | 309 (46.3%) |
| $800 to $999 | 294 (17.1%) | 61 (9.1%) |
| $1,000 to $1,499 | 274 (16.0%) | 110 (16.5%) |
| $1,500 to $1,999 | 42 (2.5%) | 31 (4.6%) |
| $2,000 to $2,499 | 14 (0.8%) | 0 (0.0%) |
| $2,500 to $2,999 | 24 (1.4%) | 0 (0.0%) |
| $3,000 or more | 7 (0.4%) | 8 (1.2%) |
| Total | 1,716 (100.0%) | 667 (100.0%) |
Physical Housing Characteristics in Estherville
Housing Structures in Estherville
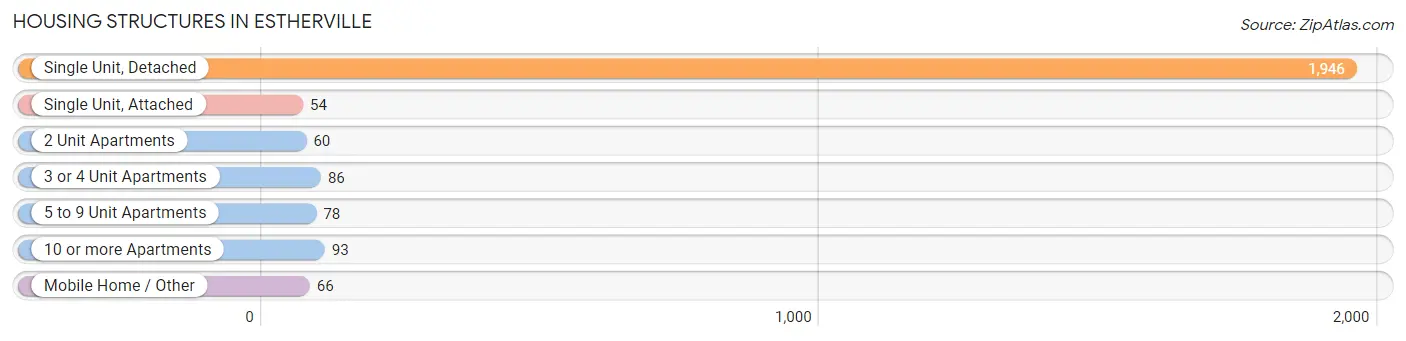
| Structure Type | # Housing Units | % Housing Units |
| Single Unit, Detached | 1,946 | 81.7% |
| Single Unit, Attached | 54 | 2.3% |
| 2 Unit Apartments | 60 | 2.5% |
| 3 or 4 Unit Apartments | 86 | 3.6% |
| 5 to 9 Unit Apartments | 78 | 3.3% |
| 10 or more Apartments | 93 | 3.9% |
| Mobile Home / Other | 66 | 2.8% |
| Total | 2,383 | 100.0% |
Housing Structures by Occupancy in Estherville
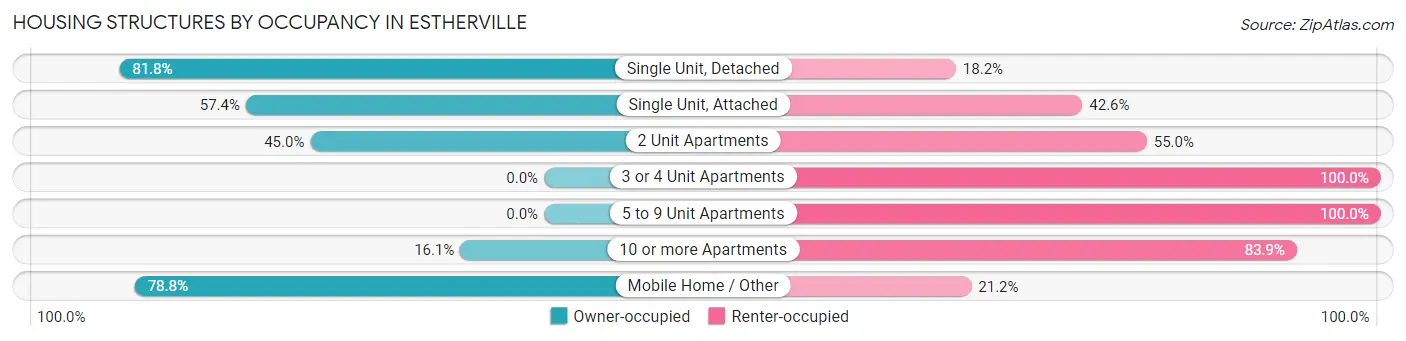
| Structure Type | Owner-occupied | Renter-occupied |
| Single Unit, Detached | 1,591 (81.8%) | 355 (18.2%) |
| Single Unit, Attached | 31 (57.4%) | 23 (42.6%) |
| 2 Unit Apartments | 27 (45.0%) | 33 (55.0%) |
| 3 or 4 Unit Apartments | 0 (0.0%) | 86 (100.0%) |
| 5 to 9 Unit Apartments | 0 (0.0%) | 78 (100.0%) |
| 10 or more Apartments | 15 (16.1%) | 78 (83.9%) |
| Mobile Home / Other | 52 (78.8%) | 14 (21.2%) |
| Total | 1,716 (72.0%) | 667 (28.0%) |
Housing Structures by Number of Rooms in Estherville
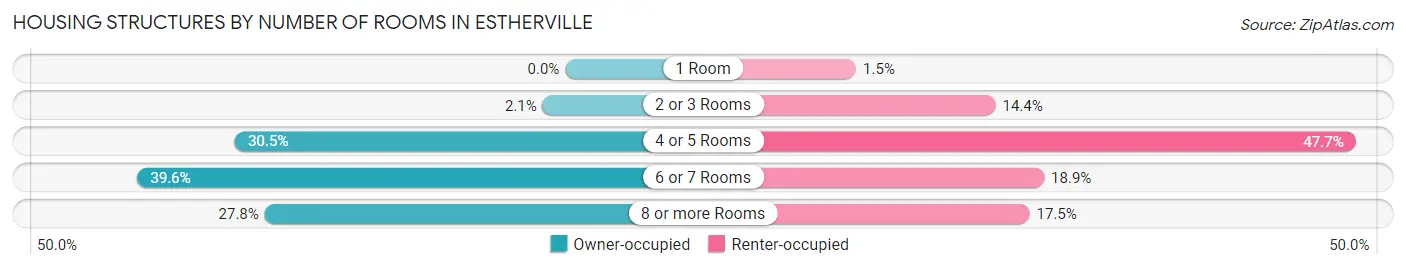
| Number of Rooms | Owner-occupied | Renter-occupied |
| 1 Room | 0 (0.0%) | 10 (1.5%) |
| 2 or 3 Rooms | 36 (2.1%) | 96 (14.4%) |
| 4 or 5 Rooms | 524 (30.5%) | 318 (47.7%) |
| 6 or 7 Rooms | 679 (39.6%) | 126 (18.9%) |
| 8 or more Rooms | 477 (27.8%) | 117 (17.5%) |
| Total | 1,716 (100.0%) | 667 (100.0%) |
Housing Structure by Heating Type in Estherville
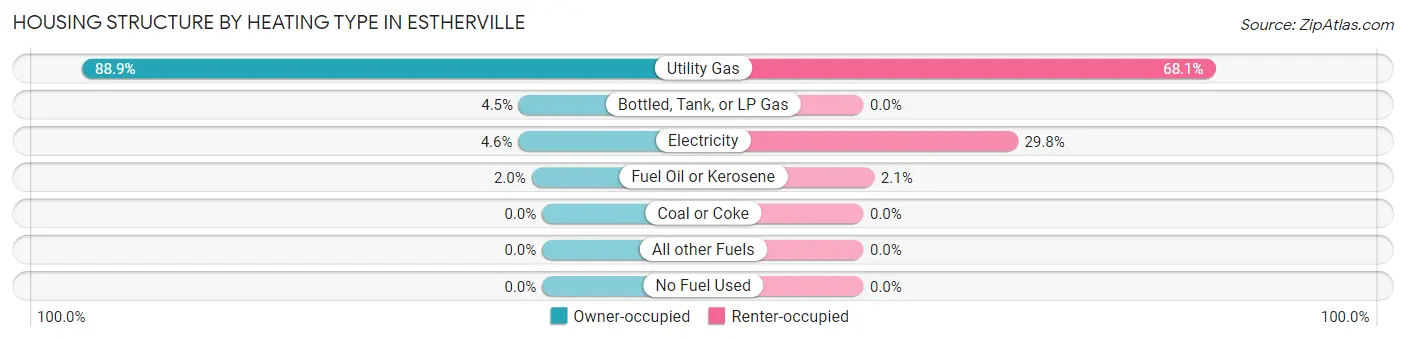
| Heating Type | Owner-occupied | Renter-occupied |
| Utility Gas | 1,525 (88.9%) | 454 (68.1%) |
| Bottled, Tank, or LP Gas | 77 (4.5%) | 0 (0.0%) |
| Electricity | 79 (4.6%) | 199 (29.8%) |
| Fuel Oil or Kerosene | 35 (2.0%) | 14 (2.1%) |
| Coal or Coke | 0 (0.0%) | 0 (0.0%) |
| All other Fuels | 0 (0.0%) | 0 (0.0%) |
| No Fuel Used | 0 (0.0%) | 0 (0.0%) |
| Total | 1,716 (100.0%) | 667 (100.0%) |
Household Vehicle Usage in Estherville
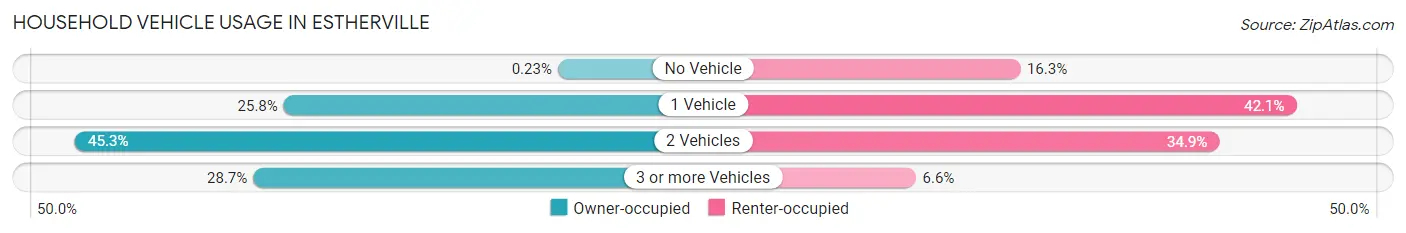
| Vehicles per Household | Owner-occupied | Renter-occupied |
| No Vehicle | 4 (0.2%) | 109 (16.3%) |
| 1 Vehicle | 443 (25.8%) | 281 (42.1%) |
| 2 Vehicles | 777 (45.3%) | 233 (34.9%) |
| 3 or more Vehicles | 492 (28.7%) | 44 (6.6%) |
| Total | 1,716 (100.0%) | 667 (100.0%) |
Real Estate & Mortgages in Estherville
Real Estate and Mortgage Overview in Estherville
| Characteristic | Without Mortgage | With Mortgage |
| Housing Units | 826 | 890 |
| Median Property Value | $87,100 | $103,600 |
| Median Household Income | $54,565 | $84 |
| Monthly Housing Costs | $514 | $7 |
| Real Estate Taxes | $1,465 | $0 |
Property Value by Mortgage Status in Estherville
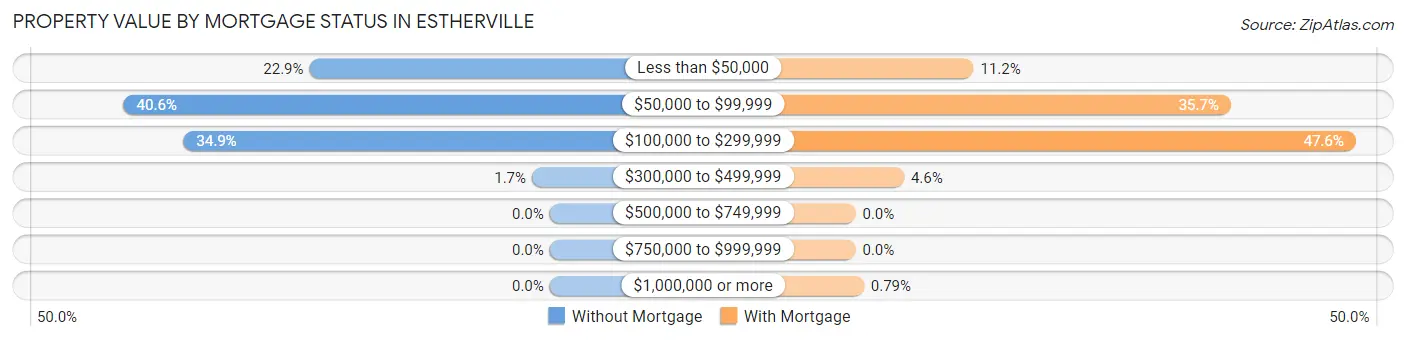
| Property Value | Without Mortgage | With Mortgage |
| Less than $50,000 | 189 (22.9%) | 100 (11.2%) |
| $50,000 to $99,999 | 335 (40.6%) | 318 (35.7%) |
| $100,000 to $299,999 | 288 (34.9%) | 424 (47.6%) |
| $300,000 to $499,999 | 14 (1.7%) | 41 (4.6%) |
| $500,000 to $749,999 | 0 (0.0%) | 0 (0.0%) |
| $750,000 to $999,999 | 0 (0.0%) | 0 (0.0%) |
| $1,000,000 or more | 0 (0.0%) | 7 (0.8%) |
| Total | 826 (100.0%) | 890 (100.0%) |
Household Income by Mortgage Status in Estherville
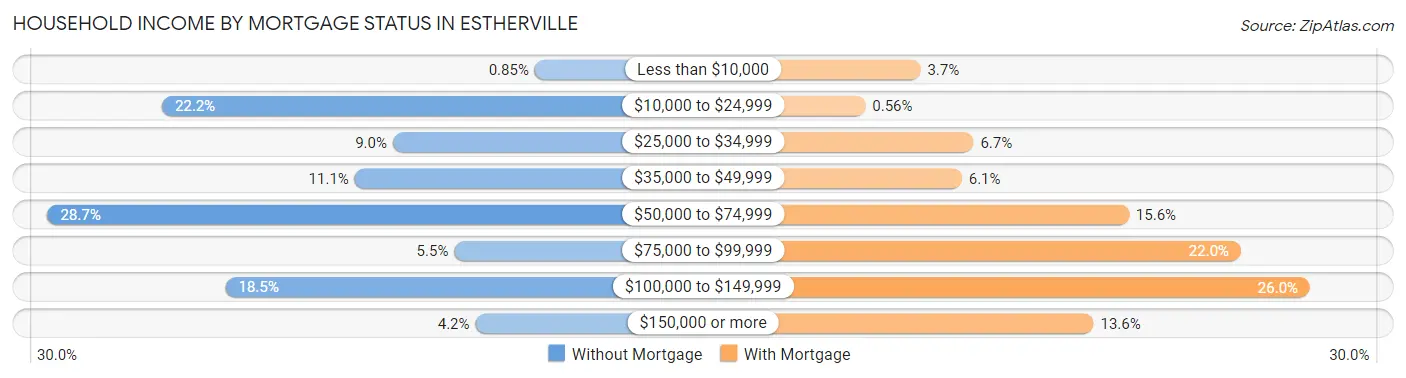
| Household Income | Without Mortgage | With Mortgage |
| Less than $10,000 | 7 (0.9%) | 33 (3.7%) |
| $10,000 to $24,999 | 183 (22.2%) | 5 (0.6%) |
| $25,000 to $34,999 | 74 (9.0%) | 60 (6.7%) |
| $35,000 to $49,999 | 92 (11.1%) | 54 (6.1%) |
| $50,000 to $74,999 | 237 (28.7%) | 139 (15.6%) |
| $75,000 to $99,999 | 45 (5.4%) | 196 (22.0%) |
| $100,000 to $149,999 | 153 (18.5%) | 231 (26.0%) |
| $150,000 or more | 35 (4.2%) | 121 (13.6%) |
| Total | 826 (100.0%) | 890 (100.0%) |
Property Value to Household Income Ratio in Estherville
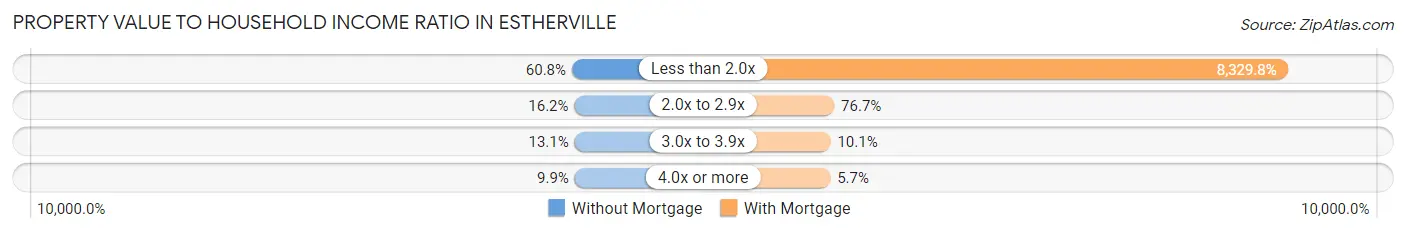
| Value-to-Income Ratio | Without Mortgage | With Mortgage |
| Less than 2.0x | 502 (60.8%) | 74,135 (8,329.8%) |
| 2.0x to 2.9x | 134 (16.2%) | 683 (76.7%) |
| 3.0x to 3.9x | 108 (13.1%) | 90 (10.1%) |
| 4.0x or more | 82 (9.9%) | 51 (5.7%) |
| Total | 826 (100.0%) | 890 (100.0%) |
Real Estate Taxes by Mortgage Status in Estherville
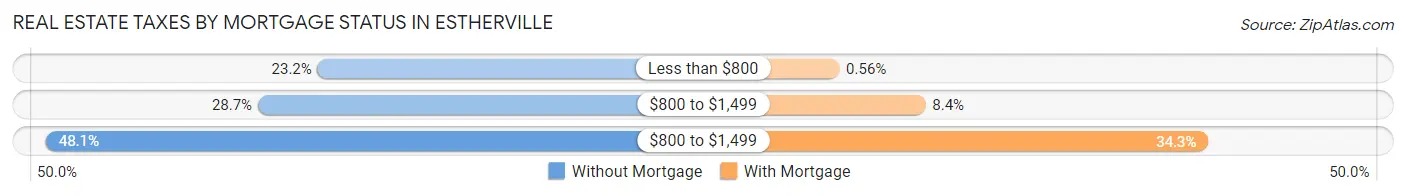
| Property Taxes | Without Mortgage | With Mortgage |
| Less than $800 | 192 (23.2%) | 5 (0.6%) |
| $800 to $1,499 | 237 (28.7%) | 75 (8.4%) |
| $800 to $1,499 | 397 (48.1%) | 305 (34.3%) |
| Total | 826 (100.0%) | 890 (100.0%) |
Health & Disability in Estherville
Health Insurance Coverage by Age in Estherville
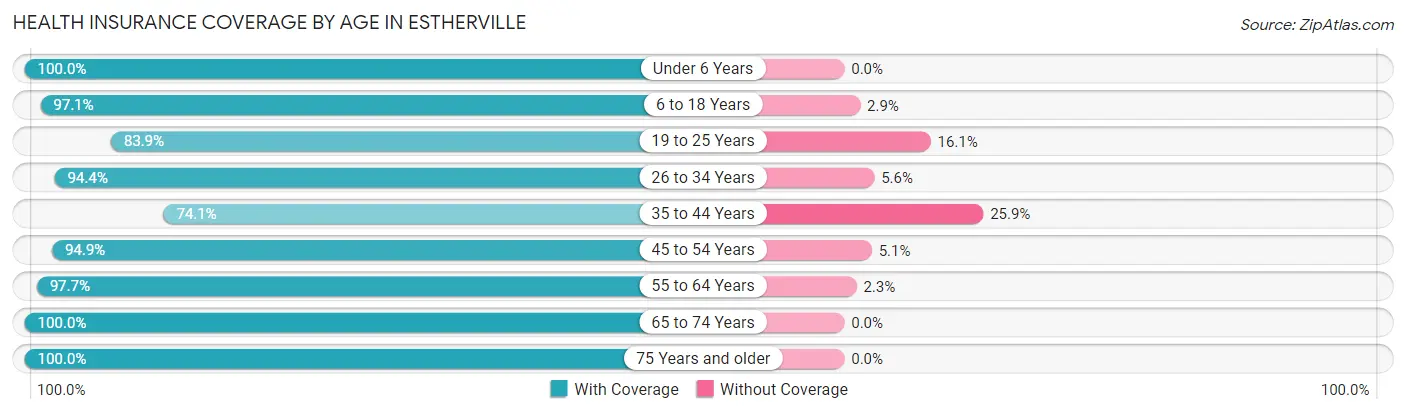
| Age Bracket | With Coverage | Without Coverage |
| Under 6 Years | 298 (100.0%) | 0 (0.0%) |
| 6 to 18 Years | 956 (97.1%) | 29 (2.9%) |
| 19 to 25 Years | 501 (83.9%) | 96 (16.1%) |
| 26 to 34 Years | 491 (94.4%) | 29 (5.6%) |
| 35 to 44 Years | 535 (74.1%) | 187 (25.9%) |
| 45 to 54 Years | 650 (94.9%) | 35 (5.1%) |
| 55 to 64 Years | 863 (97.7%) | 20 (2.3%) |
| 65 to 74 Years | 639 (100.0%) | 0 (0.0%) |
| 75 Years and older | 425 (100.0%) | 0 (0.0%) |
| Total | 5,358 (93.1%) | 396 (6.9%) |
Health Insurance Coverage by Citizenship Status in Estherville
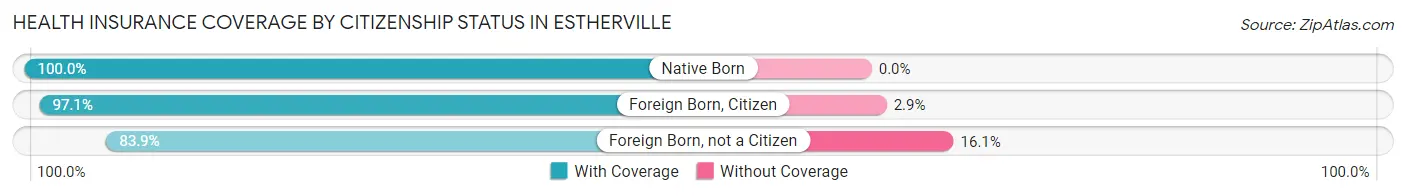
| Citizenship Status | With Coverage | Without Coverage |
| Native Born | 298 (100.0%) | 0 (0.0%) |
| Foreign Born, Citizen | 956 (97.1%) | 29 (2.9%) |
| Foreign Born, not a Citizen | 501 (83.9%) | 96 (16.1%) |
Health Insurance Coverage by Household Income in Estherville
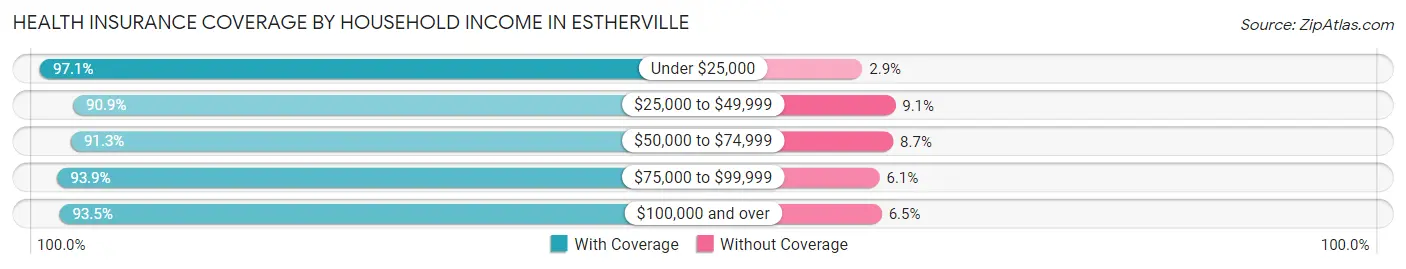
| Household Income | With Coverage | Without Coverage |
| Under $25,000 | 800 (97.1%) | 24 (2.9%) |
| $25,000 to $49,999 | 781 (90.9%) | 78 (9.1%) |
| $50,000 to $74,999 | 1,271 (91.3%) | 121 (8.7%) |
| $75,000 to $99,999 | 812 (93.9%) | 53 (6.1%) |
| $100,000 and over | 1,257 (93.5%) | 88 (6.5%) |
Public vs Private Health Insurance Coverage by Age in Estherville
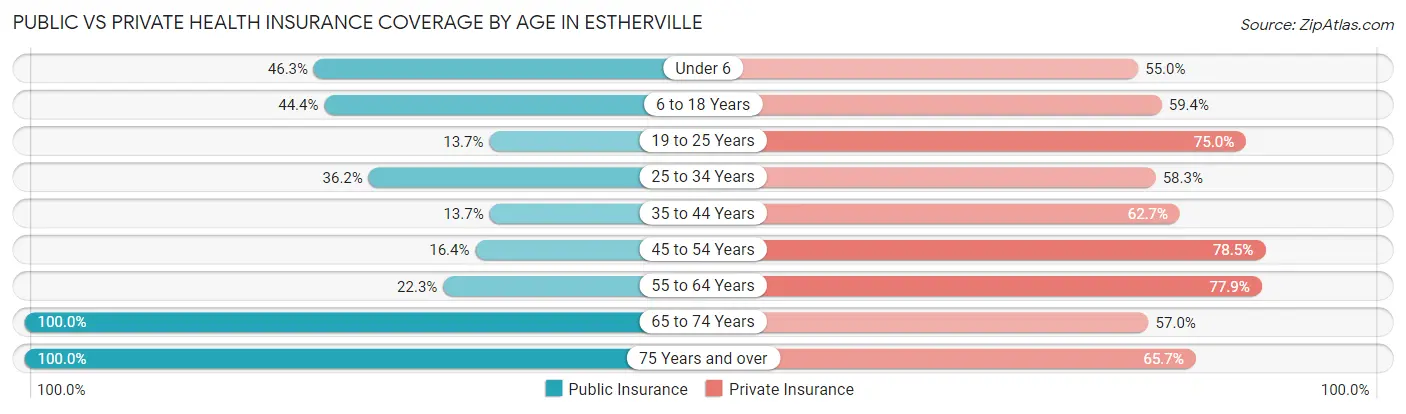
| Age Bracket | Public Insurance | Private Insurance |
| Under 6 | 138 (46.3%) | 164 (55.0%) |
| 6 to 18 Years | 437 (44.4%) | 585 (59.4%) |
| 19 to 25 Years | 82 (13.7%) | 448 (75.0%) |
| 25 to 34 Years | 188 (36.1%) | 303 (58.3%) |
| 35 to 44 Years | 99 (13.7%) | 453 (62.7%) |
| 45 to 54 Years | 112 (16.4%) | 538 (78.5%) |
| 55 to 64 Years | 197 (22.3%) | 688 (77.9%) |
| 65 to 74 Years | 639 (100.0%) | 364 (57.0%) |
| 75 Years and over | 425 (100.0%) | 279 (65.6%) |
| Total | 2,317 (40.3%) | 3,822 (66.4%) |
Disability Status by Sex by Age in Estherville
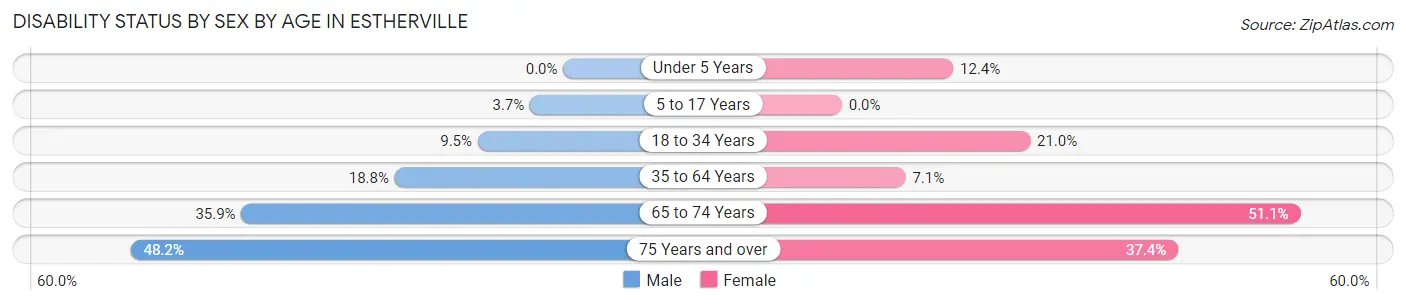
| Age Bracket | Male | Female |
| Under 5 Years | 0 (0.0%) | 16 (12.4%) |
| 5 to 17 Years | 13 (3.7%) | 0 (0.0%) |
| 18 to 34 Years | 70 (9.5%) | 114 (21.0%) |
| 35 to 64 Years | 226 (18.8%) | 77 (7.1%) |
| 65 to 74 Years | 95 (35.8%) | 191 (51.1%) |
| 75 Years and over | 107 (48.2%) | 76 (37.4%) |
Disability Class by Sex by Age in Estherville
Disability Class: Hearing Difficulty
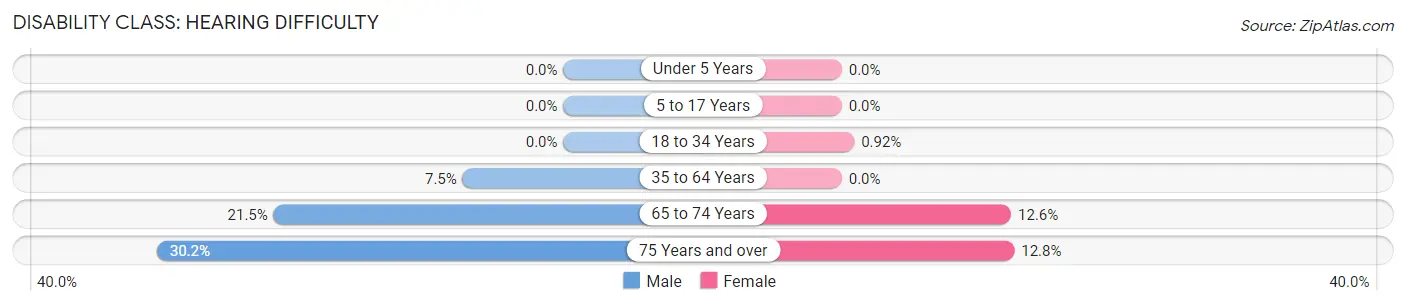
| Age Bracket | Male | Female |
| Under 5 Years | 0 (0.0%) | 0 (0.0%) |
| 5 to 17 Years | 0 (0.0%) | 0 (0.0%) |
| 18 to 34 Years | 0 (0.0%) | 5 (0.9%) |
| 35 to 64 Years | 90 (7.5%) | 0 (0.0%) |
| 65 to 74 Years | 57 (21.5%) | 47 (12.6%) |
| 75 Years and over | 67 (30.2%) | 26 (12.8%) |
Disability Class: Vision Difficulty
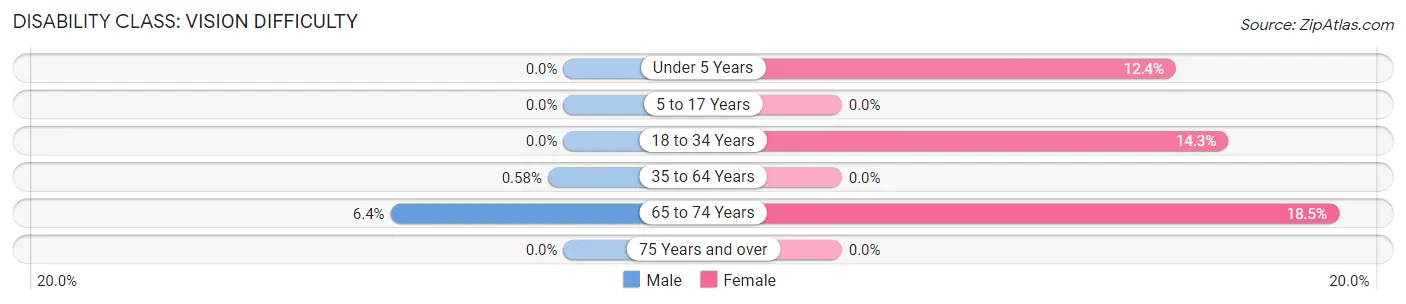
| Age Bracket | Male | Female |
| Under 5 Years | 0 (0.0%) | 16 (12.4%) |
| 5 to 17 Years | 0 (0.0%) | 0 (0.0%) |
| 18 to 34 Years | 0 (0.0%) | 78 (14.3%) |
| 35 to 64 Years | 7 (0.6%) | 0 (0.0%) |
| 65 to 74 Years | 17 (6.4%) | 69 (18.4%) |
| 75 Years and over | 0 (0.0%) | 0 (0.0%) |
Disability Class: Cognitive Difficulty
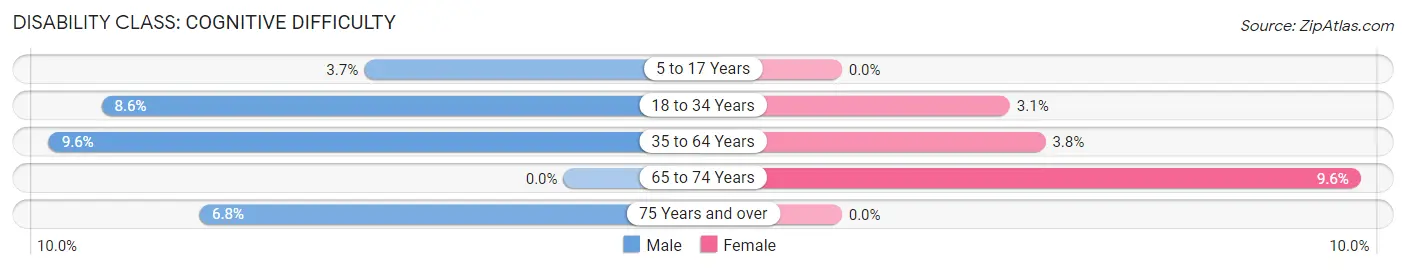
| Age Bracket | Male | Female |
| 5 to 17 Years | 13 (3.7%) | 0 (0.0%) |
| 18 to 34 Years | 63 (8.6%) | 17 (3.1%) |
| 35 to 64 Years | 115 (9.6%) | 41 (3.8%) |
| 65 to 74 Years | 0 (0.0%) | 36 (9.6%) |
| 75 Years and over | 15 (6.8%) | 0 (0.0%) |
Disability Class: Ambulatory Difficulty
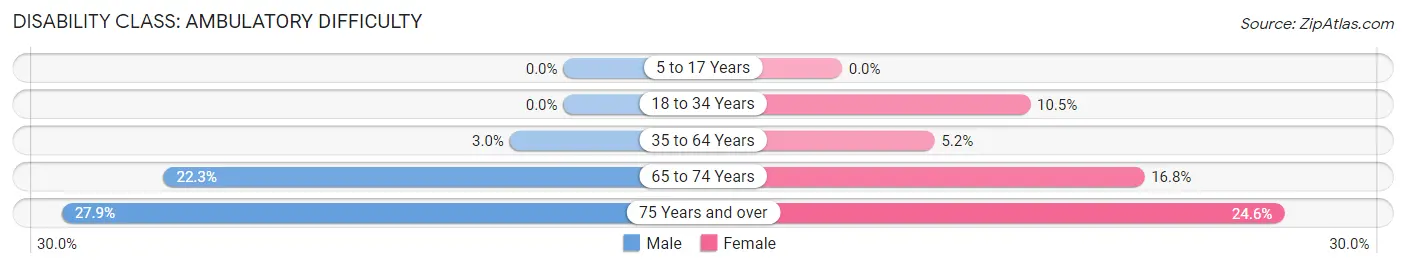
| Age Bracket | Male | Female |
| 5 to 17 Years | 0 (0.0%) | 0 (0.0%) |
| 18 to 34 Years | 0 (0.0%) | 57 (10.5%) |
| 35 to 64 Years | 36 (3.0%) | 56 (5.2%) |
| 65 to 74 Years | 59 (22.3%) | 63 (16.8%) |
| 75 Years and over | 62 (27.9%) | 50 (24.6%) |
Disability Class: Self-Care Difficulty
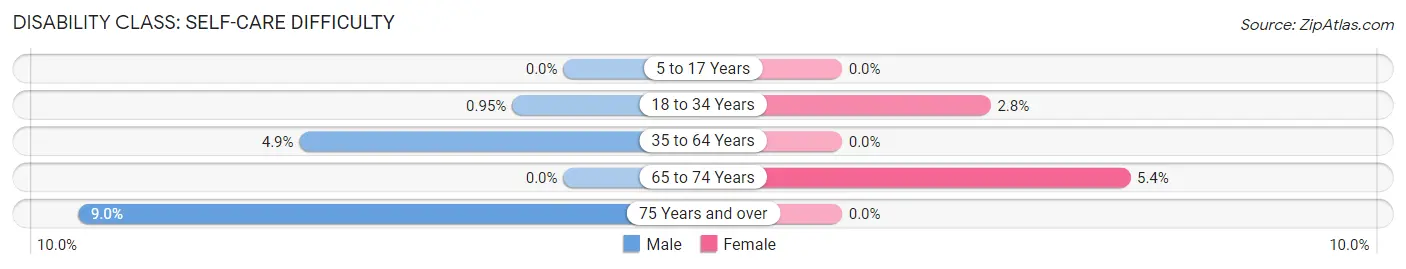
| Age Bracket | Male | Female |
| 5 to 17 Years | 0 (0.0%) | 0 (0.0%) |
| 18 to 34 Years | 7 (0.9%) | 15 (2.8%) |
| 35 to 64 Years | 59 (4.9%) | 0 (0.0%) |
| 65 to 74 Years | 0 (0.0%) | 20 (5.3%) |
| 75 Years and over | 20 (9.0%) | 0 (0.0%) |
Technology Access in Estherville
Computing Device Access in Estherville
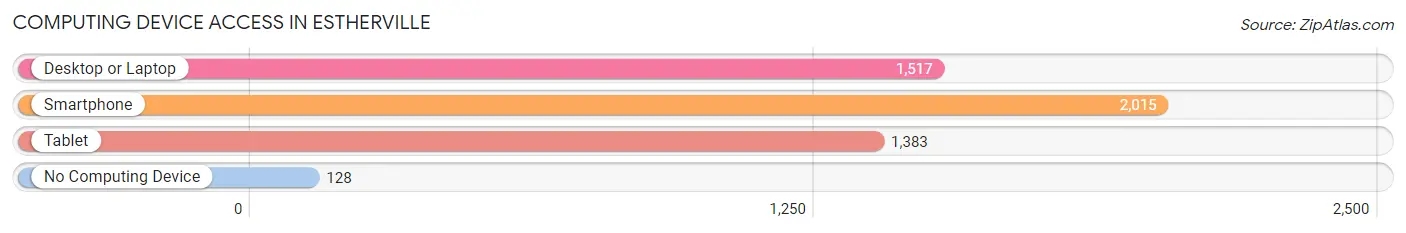
| Device Type | # Households | % Households |
| Desktop or Laptop | 1,517 | 63.7% |
| Smartphone | 2,015 | 84.6% |
| Tablet | 1,383 | 58.0% |
| No Computing Device | 128 | 5.4% |
| Total | 2,383 | 100.0% |
Internet Access in Estherville
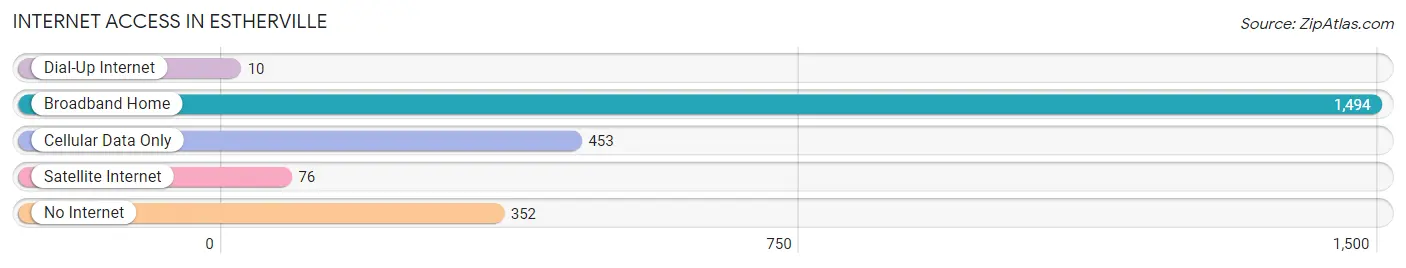
| Internet Type | # Households | % Households |
| Dial-Up Internet | 10 | 0.4% |
| Broadband Home | 1,494 | 62.7% |
| Cellular Data Only | 453 | 19.0% |
| Satellite Internet | 76 | 3.2% |
| No Internet | 352 | 14.8% |
| Total | 2,383 | 100.0% |
Estherville Summary
Estherville, Iowa is a small city located in Emmet County in the northwest corner of the state. It is situated on the banks of the Des Moines River and is the county seat. The city has a population of 5,310 according to the 2010 census.
History
Estherville was founded in 1856 by settlers from Ohio and Indiana. The city was named after Esther A. Voorhees, the daughter of one of the original settlers. The city was incorporated in 1876 and has since grown to become the largest city in Emmet County.
The city was an important center for the lumber industry in the late 19th and early 20th centuries. The city was also home to a large number of German immigrants who worked in the lumber industry.
Geography
Estherville is located in the northwest corner of Iowa, on the banks of the Des Moines River. The city is situated in a flat, open area of the state, with rolling hills to the north and east. The city is located approximately 90 miles from the state capital of Des Moines.
The city has a total area of 4.2 square miles, all of which is land. The city is located in the Central Time Zone and has a humid continental climate, with hot summers and cold winters.
Economy
Estherville’s economy is largely based on agriculture and manufacturing. The city is home to several large agricultural companies, including Iowa Select Farms, a pork producer, and Iowa Egg, a poultry producer. The city is also home to several manufacturing companies, including a large wind turbine manufacturer, a plastics manufacturer, and a metal fabrication company.
The city is also home to several retail stores, restaurants, and other businesses. The city is served by the Estherville Municipal Airport, which offers flights to several cities in Iowa and Minnesota.
Demographics
According to the 2010 census, Estherville has a population of 5,310. The population is predominantly white, with a small Hispanic population. The median household income is $41,945, and the median age is 38.
Estherville is home to several churches, including the First United Methodist Church, the First Presbyterian Church, and the St. Patrick’s Catholic Church. The city is also home to several schools, including Estherville Lincoln Central High School, Estherville Elementary School, and Estherville Middle School.
Conclusion
Estherville, Iowa is a small city located in Emmet County in the northwest corner of the state. It is situated on the banks of the Des Moines River and is the county seat. The city has a population of 5,310 according to the 2010 census. The city’s economy is largely based on agriculture and manufacturing, and the city is home to several churches, schools, and other businesses.
Common Questions
What is Per Capita Income in Estherville?
Per Capita income in Estherville is $29,523.
What is the Median Family Income in Estherville?
Median Family Income in Estherville is $67,236.
What is the Median Household income in Estherville?
Median Household Income in Estherville is $55,699.
What is Income or Wage Gap in Estherville?
Income or Wage Gap in Estherville is 27.3%.
Women in Estherville earn 72.7 cents for every dollar earned by a man.
What is Inequality or Gini Index in Estherville?
Inequality or Gini Index in Estherville is 0.42.
What is the Total Population of Estherville?
Total Population of Estherville is 5,881.
What is the Total Male Population of Estherville?
Total Male Population of Estherville is 2,950.
What is the Total Female Population of Estherville?
Total Female Population of Estherville is 2,931.
What is the Ratio of Males per 100 Females in Estherville?
There are 100.65 Males per 100 Females in Estherville.
What is the Ratio of Females per 100 Males in Estherville?
There are 99.36 Females per 100 Males in Estherville.
What is the Median Population Age in Estherville?
Median Population Age in Estherville is 40.2 Years.
What is the Average Family Size in Estherville
Average Family Size in Estherville is 2.9 People.
What is the Average Household Size in Estherville
Average Household Size in Estherville is 2.2 People.
How Large is the Labor Force in Estherville?
There are 3,063 People in the Labor Forcein in Estherville.
What is the Percentage of People in the Labor Force in Estherville?
62.7% of People are in the Labor Force in Estherville.
What is the Unemployment Rate in Estherville?
Unemployment Rate in Estherville is 2.3%.