Huxley, IA Map & Demographics
Huxley Map
Huxley Overview
$48,133
PER CAPITA INCOME
$133,933
AVG FAMILY INCOME
$120,868
AVG HOUSEHOLD INCOME
26.3%
WAGE / INCOME GAP [ % ]
73.7¢/ $1
WAGE / INCOME GAP [ $ ]
0.38
INEQUALITY / GINI INDEX
4,331
TOTAL POPULATION
2,098
MALE POPULATION
2,233
FEMALE POPULATION
93.95
MALES / 100 FEMALES
106.43
FEMALES / 100 MALES
35.1
MEDIAN AGE
3.2
AVG FAMILY SIZE
2.8
AVG HOUSEHOLD SIZE
2,320
LABOR FORCE [ PEOPLE ]
76.4%
PERCENT IN LABOR FORCE
1.4%
UNEMPLOYMENT RATE
Huxley Zip Codes
Huxley Area Codes
Income in Huxley
Income Overview in Huxley
Per Capita Income in Huxley is $48,133, while median incomes of families and households are $133,933 and $120,868 respectively.
| Characteristic | Number | Measure |
| Per Capita Income | 4,331 | $48,133 |
| Median Family Income | 1,204 | $133,933 |
| Mean Family Income | 1,204 | $163,268 |
| Median Household Income | 1,545 | $120,868 |
| Mean Household Income | 1,545 | $139,436 |
| Income Deficit | 1,204 | $0 |
| Wage / Income Gap (%) | 4,331 | 26.34% |
| Wage / Income Gap ($) | 4,331 | 73.66¢ per $1 |
| Gini / Inequality Index | 4,331 | 0.38 |
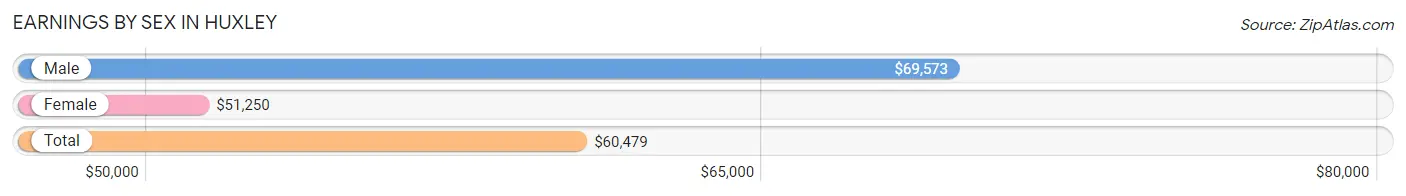
Earnings by Sex in Huxley
Average Earnings in Huxley are $60,479, $69,573 for men and $51,250 for women, a difference of 26.3%.
| Sex | Number | Average Earnings |
| Male | 1,256 (52.5%) | $69,573 |
| Female | 1,138 (47.5%) | $51,250 |
| Total | 2,394 (100.0%) | $60,479 |
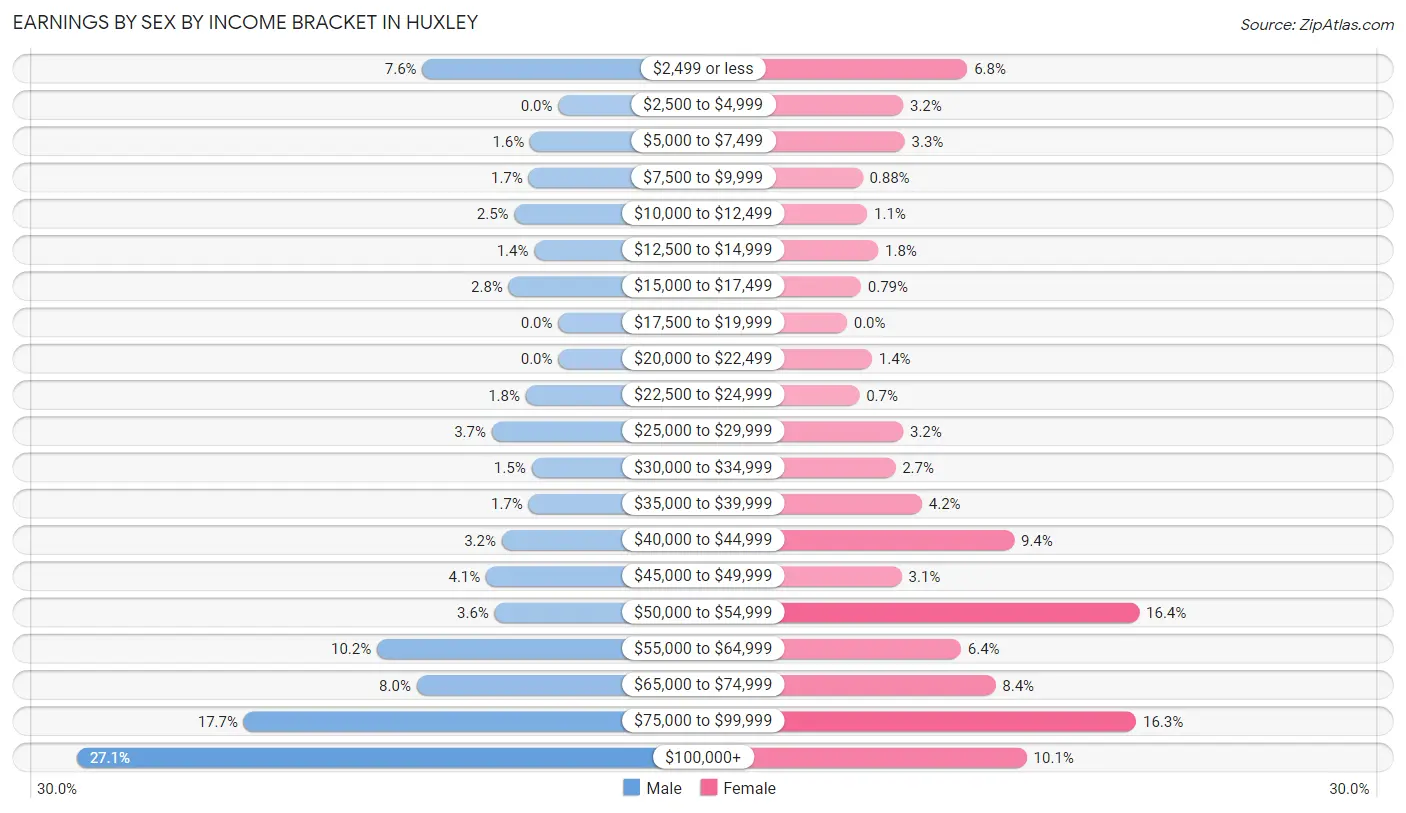
Earnings by Sex by Income Bracket in Huxley
The most common earnings brackets in Huxley are $100,000+ for men (340 | 27.1%) and $50,000 to $54,999 for women (187 | 16.4%).
| Income | Male | Female |
| $2,499 or less | 96 (7.6%) | 77 (6.8%) |
| $2,500 to $4,999 | 0 (0.0%) | 36 (3.2%) |
| $5,000 to $7,499 | 20 (1.6%) | 37 (3.3%) |
| $7,500 to $9,999 | 21 (1.7%) | 10 (0.9%) |
| $10,000 to $12,499 | 31 (2.5%) | 13 (1.1%) |
| $12,500 to $14,999 | 17 (1.3%) | 20 (1.8%) |
| $15,000 to $17,499 | 35 (2.8%) | 9 (0.8%) |
| $17,500 to $19,999 | 0 (0.0%) | 0 (0.0%) |
| $20,000 to $22,499 | 0 (0.0%) | 16 (1.4%) |
| $22,500 to $24,999 | 23 (1.8%) | 8 (0.7%) |
| $25,000 to $29,999 | 47 (3.7%) | 36 (3.2%) |
| $30,000 to $34,999 | 19 (1.5%) | 31 (2.7%) |
| $35,000 to $39,999 | 21 (1.7%) | 48 (4.2%) |
| $40,000 to $44,999 | 40 (3.2%) | 107 (9.4%) |
| $45,000 to $49,999 | 51 (4.1%) | 35 (3.1%) |
| $50,000 to $54,999 | 45 (3.6%) | 187 (16.4%) |
| $55,000 to $64,999 | 128 (10.2%) | 73 (6.4%) |
| $65,000 to $74,999 | 100 (8.0%) | 95 (8.4%) |
| $75,000 to $99,999 | 222 (17.7%) | 185 (16.3%) |
| $100,000+ | 340 (27.1%) | 115 (10.1%) |
| Total | 1,256 (100.0%) | 1,138 (100.0%) |
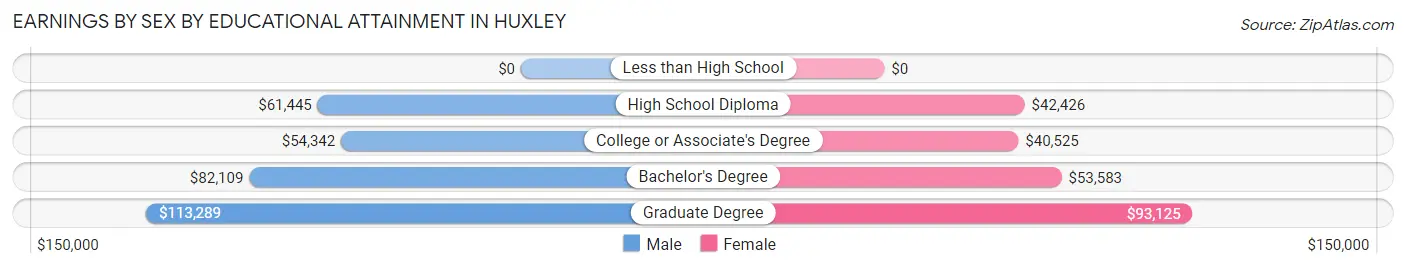
Earnings by Sex by Educational Attainment in Huxley
Average earnings in Huxley are $74,809 for men and $51,781 for women, a difference of 30.8%. Men with an educational attainment of graduate degree enjoy the highest average annual earnings of $113,289, while those with college or associate's degree education earn the least with $54,342. Women with an educational attainment of graduate degree earn the most with the average annual earnings of $93,125, while those with college or associate's degree education have the smallest earnings of $40,525.
| Educational Attainment | Male Income | Female Income |
| Less than High School | - | - |
| High School Diploma | $61,445 | $42,426 |
| College or Associate's Degree | $54,342 | $40,525 |
| Bachelor's Degree | $82,109 | $53,583 |
| Graduate Degree | $113,289 | $93,125 |
| Total | $74,809 | $51,781 |
Family Income in Huxley
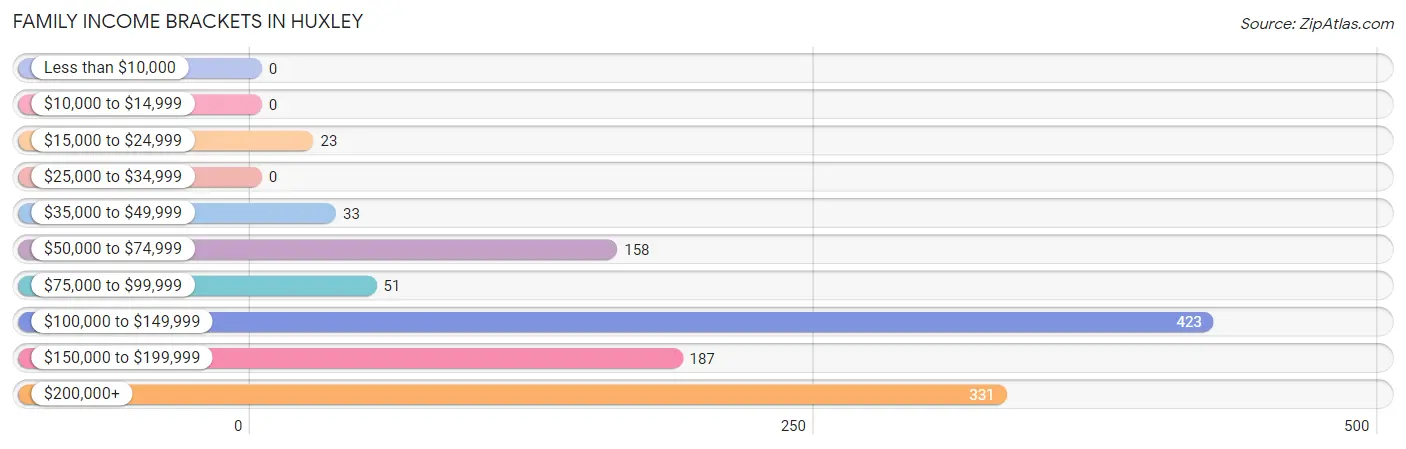
Family Income Brackets in Huxley
According to the Huxley family income data, there are 423 families falling into the $100,000 to $149,999 income range, which is the most common income bracket and makes up 35.1% of all families.
| Income Bracket | # Families | % Families |
| Less than $10,000 | 0 | 0.0% |
| $10,000 to $14,999 | 0 | 0.0% |
| $15,000 to $24,999 | 23 | 1.9% |
| $25,000 to $34,999 | 0 | 0.0% |
| $35,000 to $49,999 | 33 | 2.7% |
| $50,000 to $74,999 | 158 | 13.1% |
| $75,000 to $99,999 | 51 | 4.2% |
| $100,000 to $149,999 | 423 | 35.1% |
| $150,000 to $199,999 | 187 | 15.5% |
| $200,000+ | 331 | 27.5% |
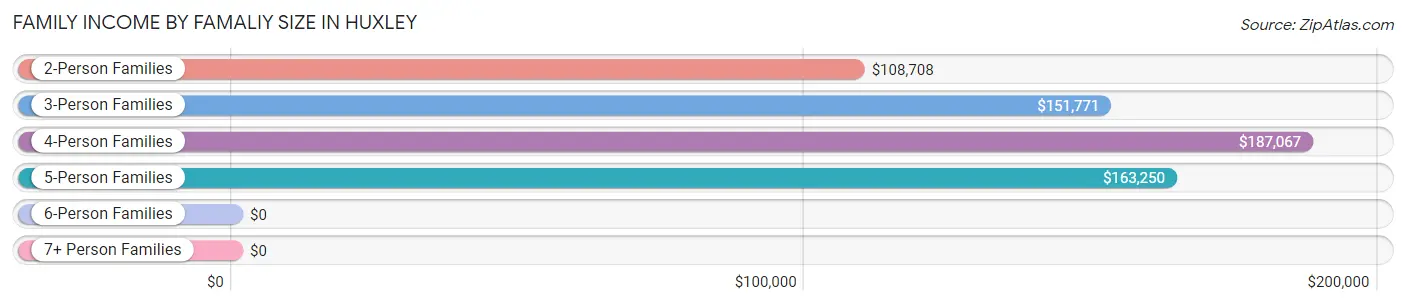
Family Income by Famaliy Size in Huxley
4-person families (423 | 35.1%) account for the highest median family income in Huxley with $187,067 per family, while 2-person families (438 | 36.4%) have the highest median income of $54,354 per family member.
| Income Bracket | # Families | Median Income |
| 2-Person Families | 438 (36.4%) | $108,708 |
| 3-Person Families | 184 (15.3%) | $151,771 |
| 4-Person Families | 423 (35.1%) | $187,067 |
| 5-Person Families | 122 (10.1%) | $163,250 |
| 6-Person Families | 37 (3.1%) | $0 |
| 7+ Person Families | 0 (0.0%) | $0 |
| Total | 1,204 (100.0%) | $133,933 |
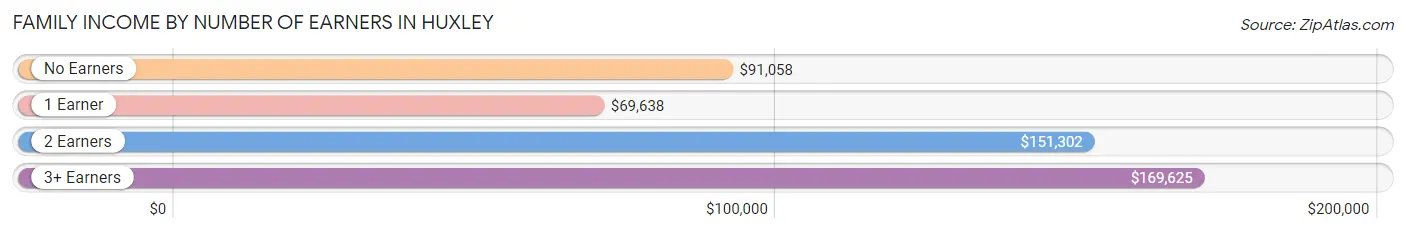
Family Income by Number of Earners in Huxley
The median family income in Huxley is $133,933, with families comprising 3+ earners (126) having the highest median family income of $169,625, while families with 1 earner (285) have the lowest median family income of $69,638, accounting for 10.5% and 23.7% of families, respectively.
| Number of Earners | # Families | Median Income |
| No Earners | 92 (7.6%) | $91,058 |
| 1 Earner | 285 (23.7%) | $69,638 |
| 2 Earners | 701 (58.2%) | $151,302 |
| 3+ Earners | 126 (10.5%) | $169,625 |
| Total | 1,204 (100.0%) | $133,933 |
Household Income in Huxley
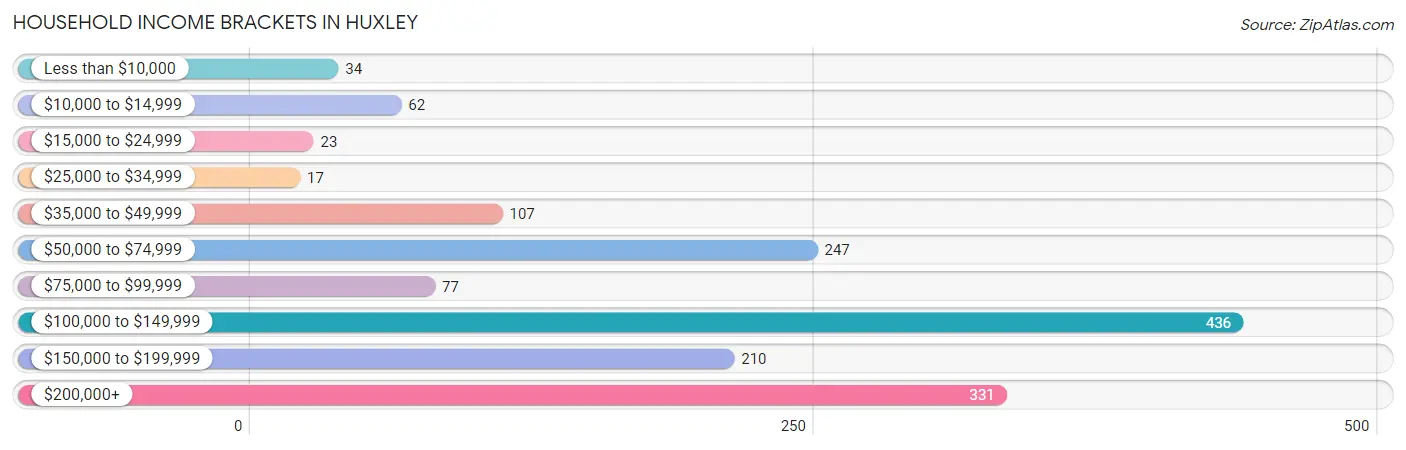
Household Income Brackets in Huxley
With 436 households falling in the category, the $100,000 to $149,999 income range is the most frequent in Huxley, accounting for 28.2% of all households. In contrast, only 17 households (1.1%) fall into the $25,000 to $34,999 income bracket, making it the least populous group.
| Income Bracket | # Households | % Households |
| Less than $10,000 | 34 | 2.2% |
| $10,000 to $14,999 | 62 | 4.0% |
| $15,000 to $24,999 | 23 | 1.5% |
| $25,000 to $34,999 | 17 | 1.1% |
| $35,000 to $49,999 | 107 | 6.9% |
| $50,000 to $74,999 | 247 | 16.0% |
| $75,000 to $99,999 | 77 | 5.0% |
| $100,000 to $149,999 | 436 | 28.2% |
| $150,000 to $199,999 | 210 | 13.6% |
| $200,000+ | 331 | 21.4% |
Household Income by Householder Age in Huxley
The median household income in Huxley is $120,868, with the highest median household income of $135,500 found in the 25 to 44 years age bracket for the primary householder. A total of 708 households (45.8%) fall into this category. Meanwhile, the 15 to 24 years age bracket for the primary householder has the lowest median household income of $0, with 30 households (1.9%) in this group.
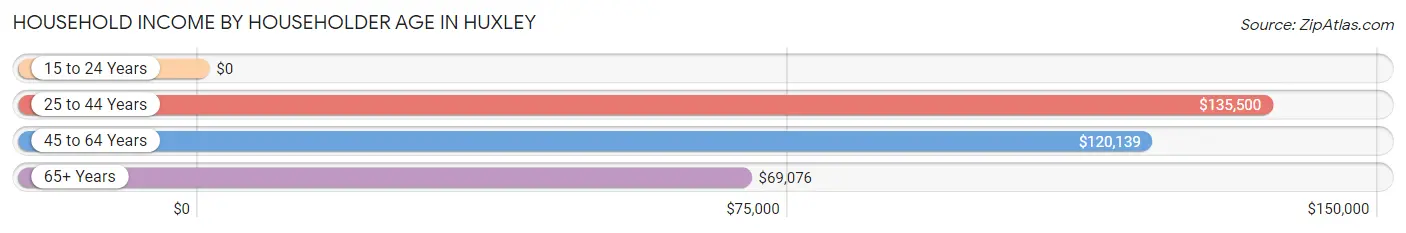
| Income Bracket | # Households | Median Income |
| 15 to 24 Years | 30 (1.9%) | $0 |
| 25 to 44 Years | 708 (45.8%) | $135,500 |
| 45 to 64 Years | 544 (35.2%) | $120,139 |
| 65+ Years | 263 (17.0%) | $69,076 |
| Total | 1,545 (100.0%) | $120,868 |
Poverty in Huxley
Income Below Poverty by Sex and Age in Huxley
With 1.8% poverty level for males and 5.3% for females among the residents of Huxley, 16 and 17 year old males and 18 to 24 year old females are the most vulnerable to poverty, with 9 males (16.1%) and 13 females (76.5%) in their respective age groups living below the poverty level.
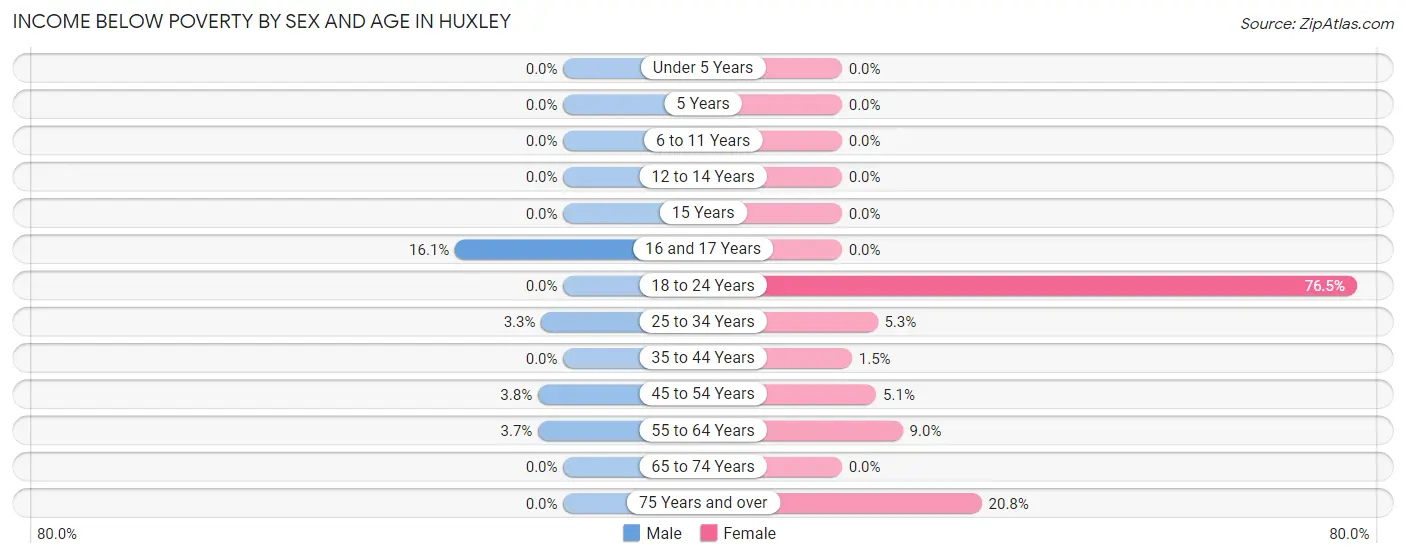
| Age Bracket | Male | Female |
| Under 5 Years | 0 (0.0%) | 0 (0.0%) |
| 5 Years | 0 (0.0%) | 0 (0.0%) |
| 6 to 11 Years | 0 (0.0%) | 0 (0.0%) |
| 12 to 14 Years | 0 (0.0%) | 0 (0.0%) |
| 15 Years | 0 (0.0%) | 0 (0.0%) |
| 16 and 17 Years | 9 (16.1%) | 0 (0.0%) |
| 18 to 24 Years | 0 (0.0%) | 13 (76.5%) |
| 25 to 34 Years | 9 (3.3%) | 17 (5.3%) |
| 35 to 44 Years | 0 (0.0%) | 6 (1.5%) |
| 45 to 54 Years | 11 (3.8%) | 15 (5.1%) |
| 55 to 64 Years | 8 (3.7%) | 17 (9.0%) |
| 65 to 74 Years | 0 (0.0%) | 0 (0.0%) |
| 75 Years and over | 0 (0.0%) | 49 (20.8%) |
| Total | 37 (1.8%) | 117 (5.3%) |
Income Above Poverty by Sex and Age in Huxley
According to the poverty statistics in Huxley, males aged under 5 years and females aged under 5 years are the age groups that are most secure financially, with 100.0% of males and 100.0% of females in these age groups living above the poverty line.
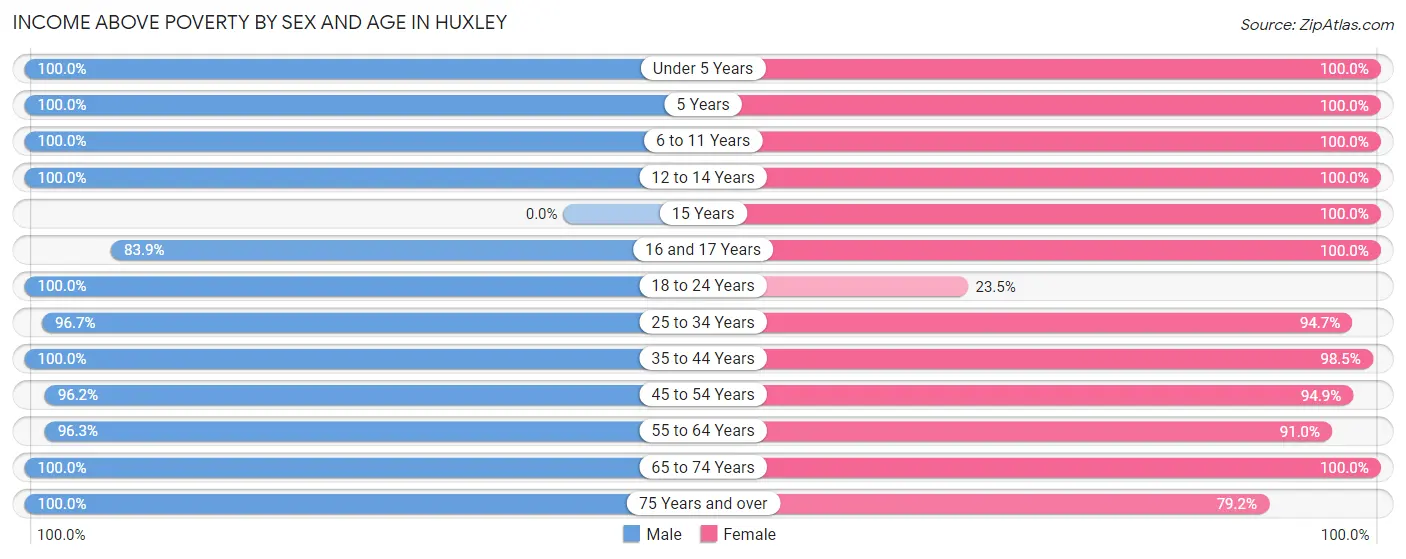
| Age Bracket | Male | Female |
| Under 5 Years | 224 (100.0%) | 141 (100.0%) |
| 5 Years | 54 (100.0%) | 28 (100.0%) |
| 6 to 11 Years | 283 (100.0%) | 349 (100.0%) |
| 12 to 14 Years | 110 (100.0%) | 87 (100.0%) |
| 15 Years | 0 (0.0%) | 5 (100.0%) |
| 16 and 17 Years | 47 (83.9%) | 82 (100.0%) |
| 18 to 24 Years | 109 (100.0%) | 4 (23.5%) |
| 25 to 34 Years | 266 (96.7%) | 304 (94.7%) |
| 35 to 44 Years | 305 (100.0%) | 397 (98.5%) |
| 45 to 54 Years | 281 (96.2%) | 279 (94.9%) |
| 55 to 64 Years | 206 (96.3%) | 171 (91.0%) |
| 65 to 74 Years | 61 (100.0%) | 68 (100.0%) |
| 75 Years and over | 115 (100.0%) | 187 (79.2%) |
| Total | 2,061 (98.2%) | 2,102 (94.7%) |
Income Below Poverty Among Married-Couple Families in Huxley
The poverty statistics for married-couple families in Huxley show that 1.3% or 15 of the total 1,123 families live below the poverty line. Families with no children have the highest poverty rate of 3.6%, comprising of 15 families. On the other hand, families with 1 or 2 children have the lowest poverty rate of 0.0%, which includes 0 families.
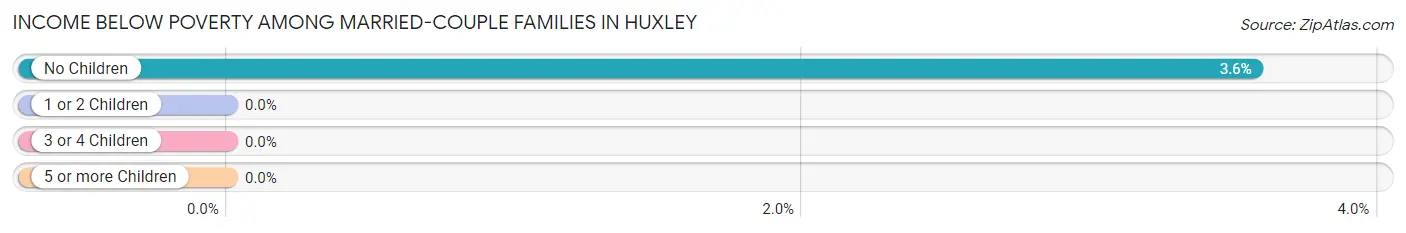
| Children | Above Poverty | Below Poverty |
| No Children | 405 (96.4%) | 15 (3.6%) |
| 1 or 2 Children | 544 (100.0%) | 0 (0.0%) |
| 3 or 4 Children | 159 (100.0%) | 0 (0.0%) |
| 5 or more Children | 0 (0.0%) | 0 (0.0%) |
| Total | 1,108 (98.7%) | 15 (1.3%) |
Income Below Poverty Among Single-Parent Households in Huxley
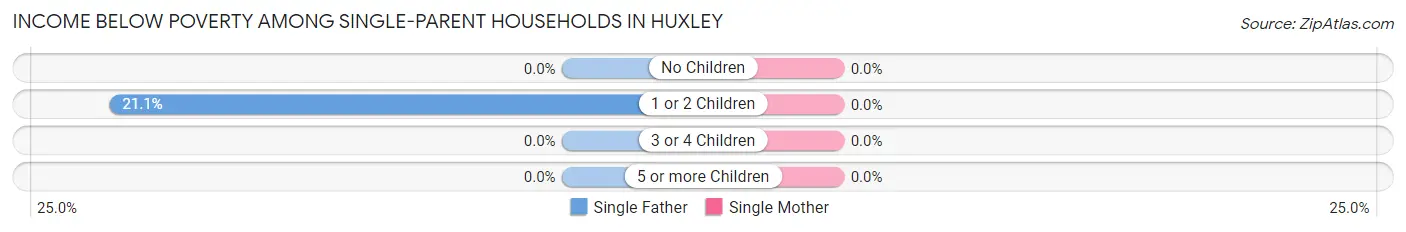
| Children | Single Father | Single Mother |
| No Children | 0 (0.0%) | 0 (0.0%) |
| 1 or 2 Children | 8 (21.0%) | 0 (0.0%) |
| 3 or 4 Children | 0 (0.0%) | 0 (0.0%) |
| 5 or more Children | 0 (0.0%) | 0 (0.0%) |
| Total | 8 (21.0%) | 0 (0.0%) |
Income Below Poverty Among Married-Couple vs Single-Parent Households in Huxley
The poverty data for Huxley shows that 15 of the married-couple family households (1.3%) and 8 of the single-parent households (9.9%) are living below the poverty level. Within the married-couple family households, those with no children have the highest poverty rate, with 15 households (3.6%) falling below the poverty line. Among the single-parent households, those with 1 or 2 children have the highest poverty rate, with 8 household (21.0%) living below poverty.
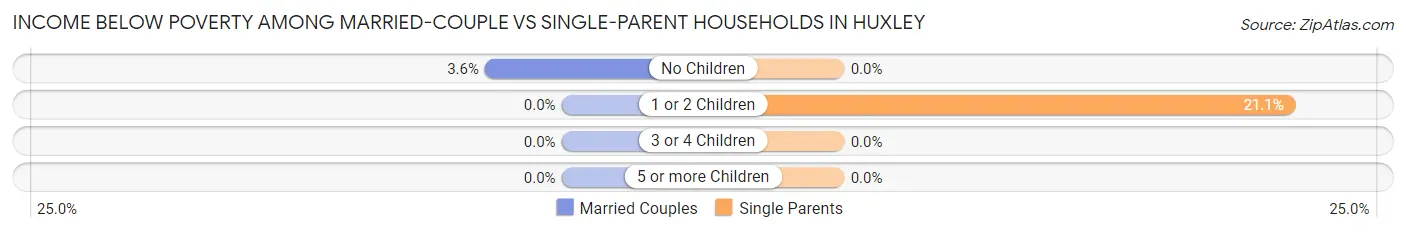
| Children | Married-Couple Families | Single-Parent Households |
| No Children | 15 (3.6%) | 0 (0.0%) |
| 1 or 2 Children | 0 (0.0%) | 8 (21.0%) |
| 3 or 4 Children | 0 (0.0%) | 0 (0.0%) |
| 5 or more Children | 0 (0.0%) | 0 (0.0%) |
| Total | 15 (1.3%) | 8 (9.9%) |
Race in Huxley
The most populous races in Huxley are White / Caucasian (4,057 | 93.7%), Hispanic or Latino (141 | 3.3%), and Two or more Races (105 | 2.4%).
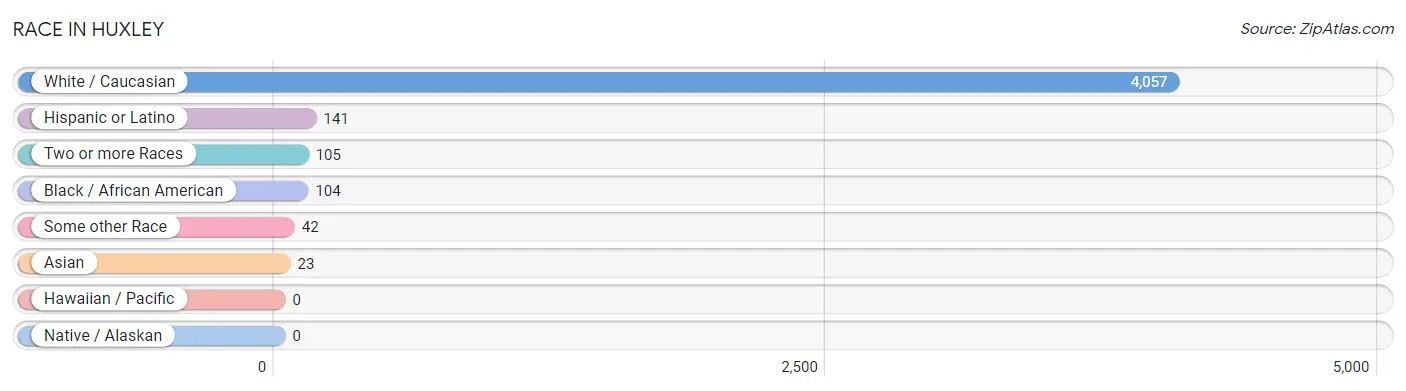
| Race | # Population | % Population |
| Asian | 23 | 0.5% |
| Black / African American | 104 | 2.4% |
| Hawaiian / Pacific | 0 | 0.0% |
| Hispanic or Latino | 141 | 3.3% |
| Native / Alaskan | 0 | 0.0% |
| White / Caucasian | 4,057 | 93.7% |
| Two or more Races | 105 | 2.4% |
| Some other Race | 42 | 1.0% |
| Total | 4,331 | 100.0% |
Ancestry in Huxley
The most populous ancestries reported in Huxley are German (1,794 | 41.4%), English (688 | 15.9%), Norwegian (475 | 11.0%), Irish (440 | 10.2%), and Italian (138 | 3.2%), together accounting for 81.6% of all Huxley residents.
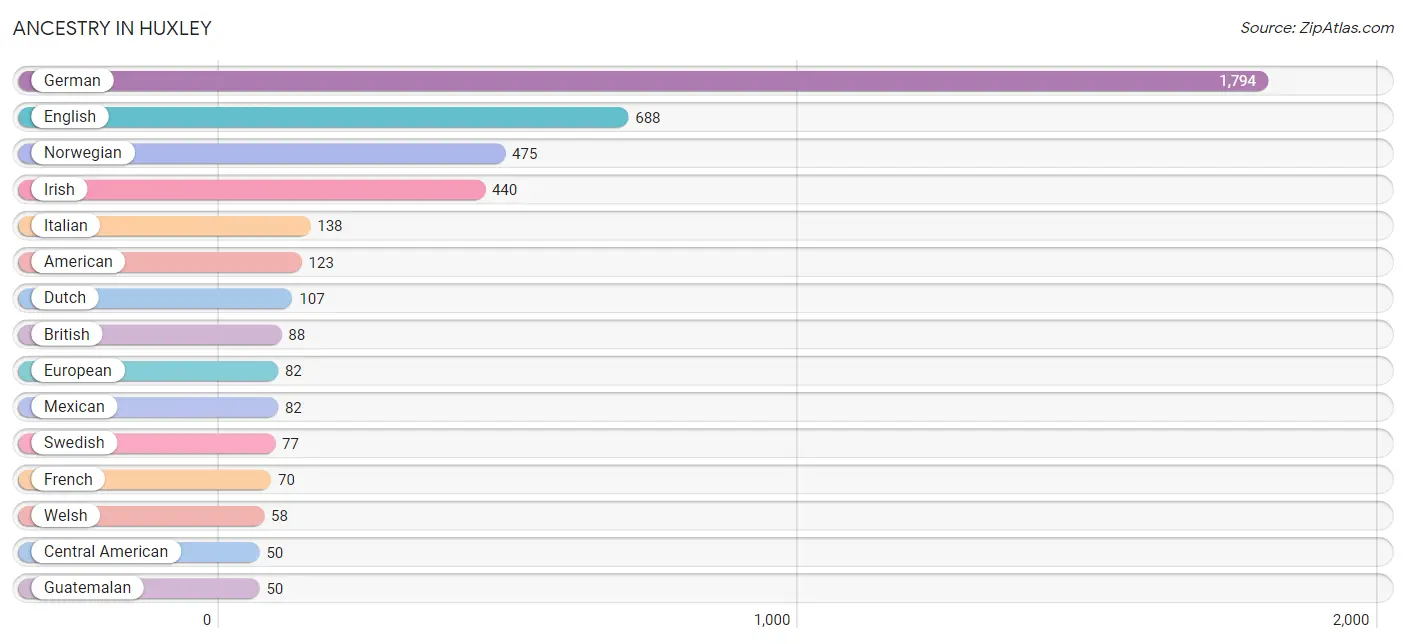
| Ancestry | # Population | % Population |
| American | 123 | 2.8% |
| Austrian | 17 | 0.4% |
| British | 88 | 2.0% |
| Canadian | 17 | 0.4% |
| Central American | 50 | 1.1% |
| Cherokee | 26 | 0.6% |
| Czech | 11 | 0.3% |
| Danish | 38 | 0.9% |
| Dutch | 107 | 2.5% |
| English | 688 | 15.9% |
| European | 82 | 1.9% |
| French | 70 | 1.6% |
| German | 1,794 | 41.4% |
| Guatemalan | 50 | 1.1% |
| Hungarian | 17 | 0.4% |
| Irish | 440 | 10.2% |
| Italian | 138 | 3.2% |
| Korean | 23 | 0.5% |
| Luxembourger | 22 | 0.5% |
| Mexican | 82 | 1.9% |
| Northern European | 26 | 0.6% |
| Norwegian | 475 | 11.0% |
| Pakistani | 8 | 0.2% |
| Peruvian | 9 | 0.2% |
| Polish | 30 | 0.7% |
| Scotch-Irish | 8 | 0.2% |
| Scottish | 26 | 0.6% |
| South American | 9 | 0.2% |
| Swedish | 77 | 1.8% |
| Swiss | 44 | 1.0% |
| Welsh | 58 | 1.3% | View All 31 Rows |
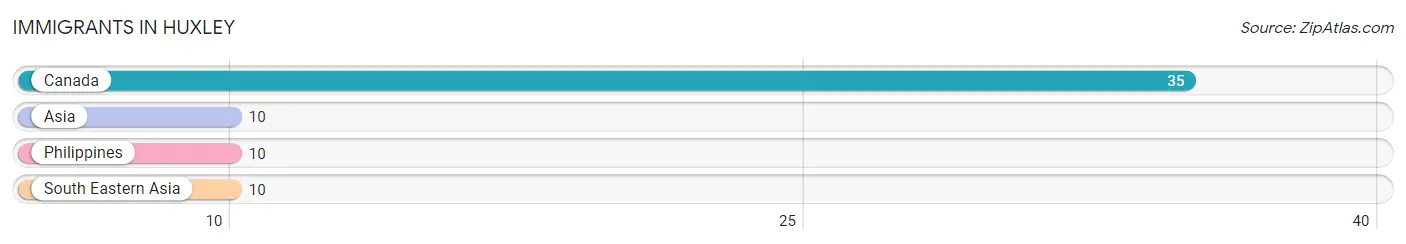
Immigrants in Huxley
The most numerous immigrant groups reported in Huxley came from Canada (35 | 0.8%), Asia (10 | 0.2%), Philippines (10 | 0.2%), and South Eastern Asia (10 | 0.2%), together accounting for 1.5% of all Huxley residents.
| Immigration Origin | # Population | % Population |
| Asia | 10 | 0.2% |
| Canada | 35 | 0.8% |
| Philippines | 10 | 0.2% |
| South Eastern Asia | 10 | 0.2% | View All 4 Rows |
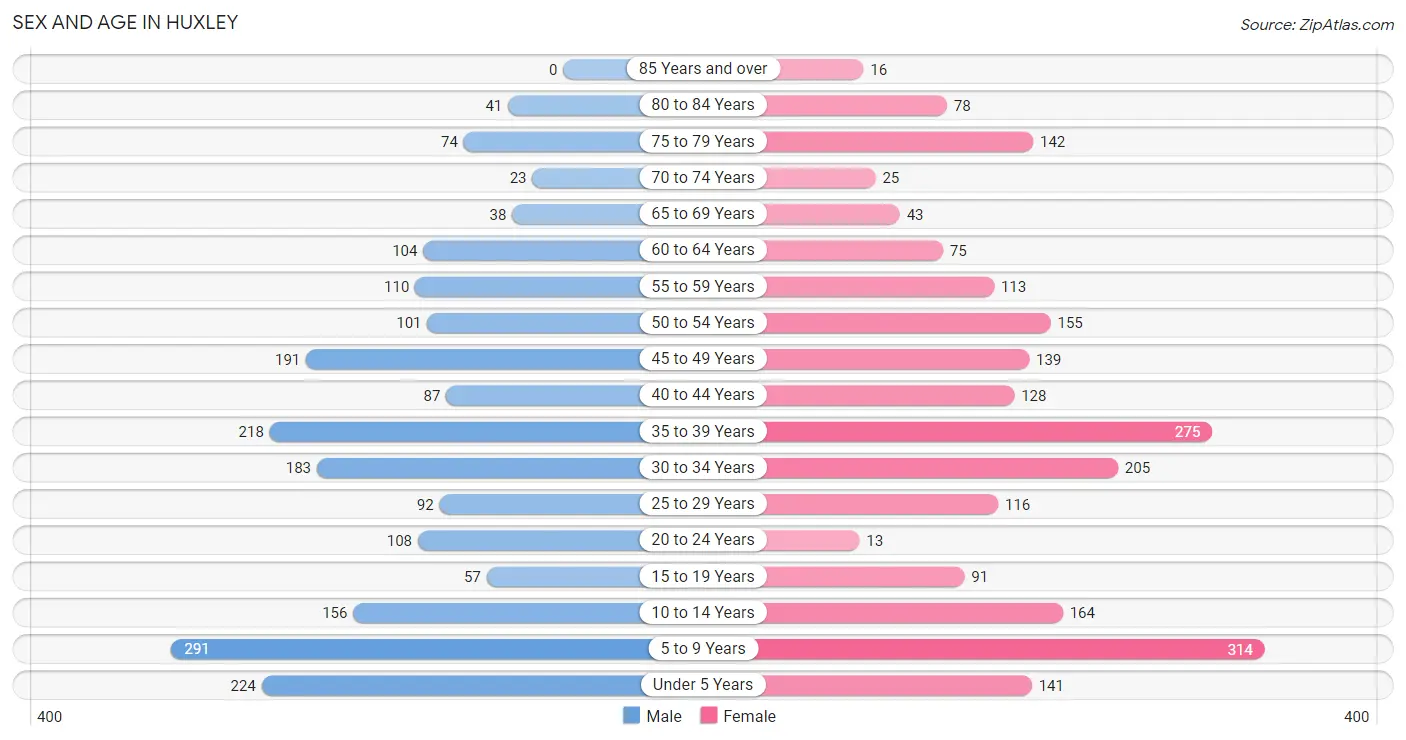
Sex and Age in Huxley
Sex and Age in Huxley
The most populous age groups in Huxley are 5 to 9 Years (291 | 13.9%) for men and 5 to 9 Years (314 | 14.1%) for women.
| Age Bracket | Male | Female |
| Under 5 Years | 224 (10.7%) | 141 (6.3%) |
| 5 to 9 Years | 291 (13.9%) | 314 (14.1%) |
| 10 to 14 Years | 156 (7.4%) | 164 (7.3%) |
| 15 to 19 Years | 57 (2.7%) | 91 (4.1%) |
| 20 to 24 Years | 108 (5.1%) | 13 (0.6%) |
| 25 to 29 Years | 92 (4.4%) | 116 (5.2%) |
| 30 to 34 Years | 183 (8.7%) | 205 (9.2%) |
| 35 to 39 Years | 218 (10.4%) | 275 (12.3%) |
| 40 to 44 Years | 87 (4.2%) | 128 (5.7%) |
| 45 to 49 Years | 191 (9.1%) | 139 (6.2%) |
| 50 to 54 Years | 101 (4.8%) | 155 (6.9%) |
| 55 to 59 Years | 110 (5.2%) | 113 (5.1%) |
| 60 to 64 Years | 104 (5.0%) | 75 (3.4%) |
| 65 to 69 Years | 38 (1.8%) | 43 (1.9%) |
| 70 to 74 Years | 23 (1.1%) | 25 (1.1%) |
| 75 to 79 Years | 74 (3.5%) | 142 (6.4%) |
| 80 to 84 Years | 41 (1.9%) | 78 (3.5%) |
| 85 Years and over | 0 (0.0%) | 16 (0.7%) |
| Total | 2,098 (100.0%) | 2,233 (100.0%) |
Families and Households in Huxley
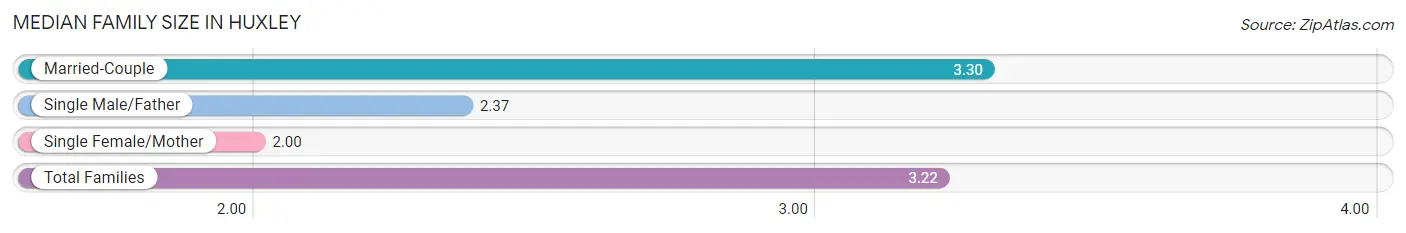
Median Family Size in Huxley
The median family size in Huxley is 3.22 persons per family, with married-couple families (1,123 | 93.3%) accounting for the largest median family size of 3.3 persons per family. On the other hand, single female/mother families (43 | 3.6%) represent the smallest median family size with 2.00 persons per family.
| Family Type | # Families | Family Size |
| Married-Couple | 1,123 (93.3%) | 3.30 |
| Single Male/Father | 38 (3.2%) | 2.37 |
| Single Female/Mother | 43 (3.6%) | 2.00 |
| Total Families | 1,204 (100.0%) | 3.22 |
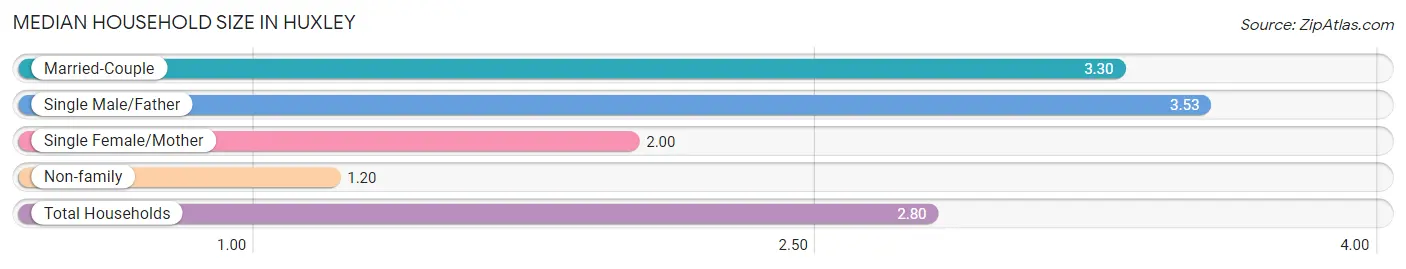
Median Household Size in Huxley
The median household size in Huxley is 2.80 persons per household, with single male/father households (38 | 2.5%) accounting for the largest median household size of 3.53 persons per household. non-family households (341 | 22.1%) represent the smallest median household size with 1.20 persons per household.
| Household Type | # Households | Household Size |
| Married-Couple | 1,123 (72.7%) | 3.30 |
| Single Male/Father | 38 (2.5%) | 3.53 |
| Single Female/Mother | 43 (2.8%) | 2.00 |
| Non-family | 341 (22.1%) | 1.20 |
| Total Households | 1,545 (100.0%) | 2.80 |
Household Size by Marriage Status in Huxley
Out of a total of 1,545 households in Huxley, 1,204 (77.9%) are family households, while 341 (22.1%) are nonfamily households. The most numerous type of family households are 4-person households, comprising 423, and the most common type of nonfamily households are 1-person households, comprising 263.
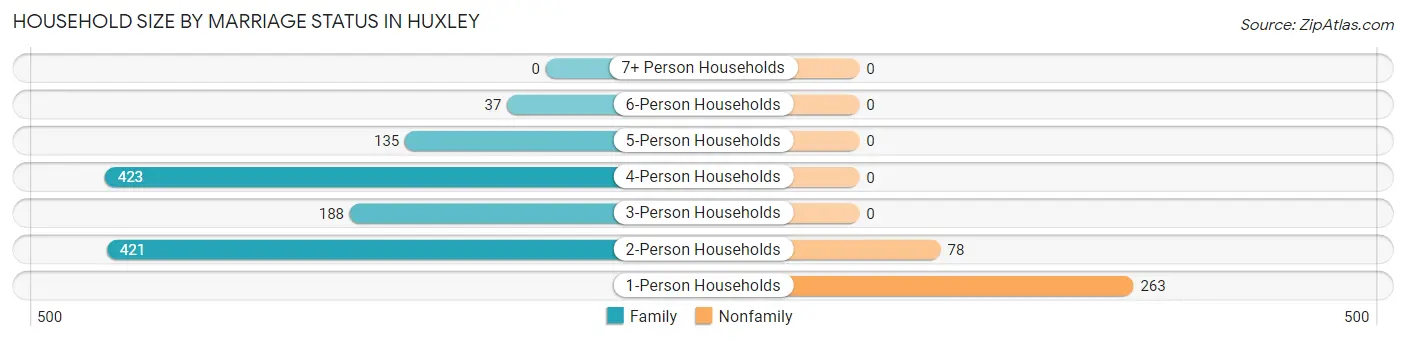
| Household Size | Family Households | Nonfamily Households |
| 1-Person Households | - | 263 (17.0%) |
| 2-Person Households | 421 (27.3%) | 78 (5.1%) |
| 3-Person Households | 188 (12.2%) | 0 (0.0%) |
| 4-Person Households | 423 (27.4%) | 0 (0.0%) |
| 5-Person Households | 135 (8.7%) | 0 (0.0%) |
| 6-Person Households | 37 (2.4%) | 0 (0.0%) |
| 7+ Person Households | 0 (0.0%) | 0 (0.0%) |
| Total | 1,204 (77.9%) | 341 (22.1%) |
Female Fertility in Huxley
Fertility by Age in Huxley
Average fertility rate in Huxley is 67.0 births per 1,000 women. Women in the age bracket of 20 to 34 years have the highest fertility rate with 195.0 births per 1,000 women. Women in the age bracket of 20 to 34 years acount for 100.0% of all women with births.
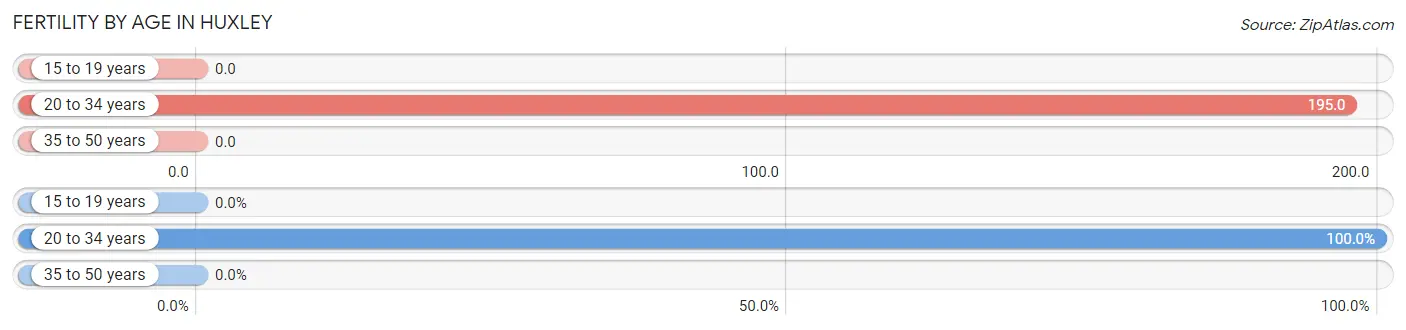
| Age Bracket | Women with Births | Births / 1,000 Women |
| 15 to 19 years | 0 (0.0%) | 0.0 |
| 20 to 34 years | 65 (100.0%) | 195.0 |
| 35 to 50 years | 0 (0.0%) | 0.0 |
| Total | 65 (100.0%) | 67.0 |
Fertility by Age by Marriage Status in Huxley
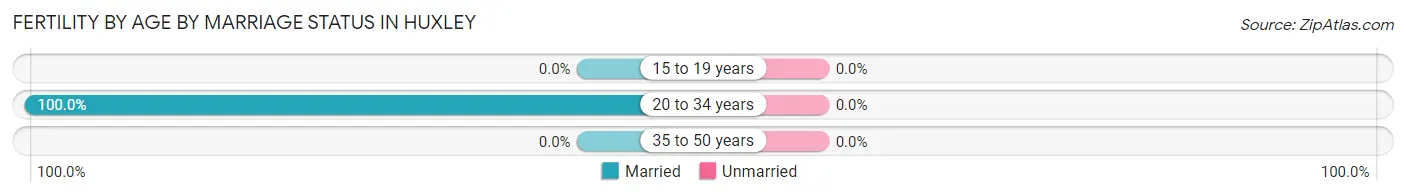
| Age Bracket | Married | Unmarried |
| 15 to 19 years | 0 (0.0%) | 0 (0.0%) |
| 20 to 34 years | 65 (100.0%) | 0 (0.0%) |
| 35 to 50 years | 0 (0.0%) | 0 (0.0%) |
| Total | 65 (100.0%) | 0 (0.0%) |
Fertility by Education in Huxley
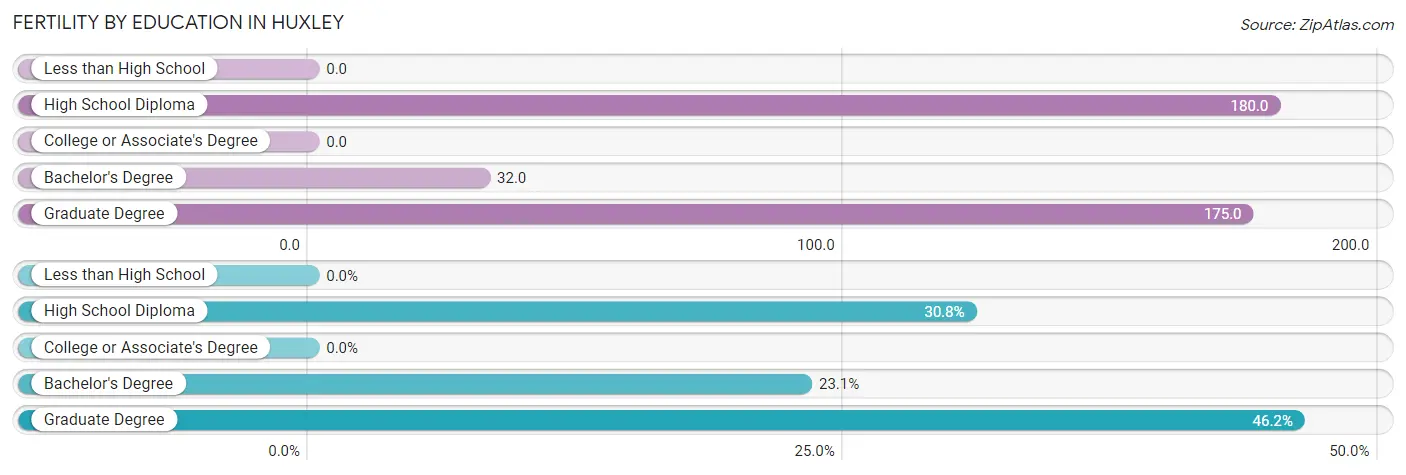
| Educational Attainment | Women with Births | Births / 1,000 Women |
| Less than High School | 0 (0.0%) | 0.0 |
| High School Diploma | 20 (30.8%) | 180.0 |
| College or Associate's Degree | 0 (0.0%) | 0.0 |
| Bachelor's Degree | 15 (23.1%) | 32.0 |
| Graduate Degree | 30 (46.2%) | 175.0 |
| Total | 65 (100.0%) | 67.0 |
Fertility by Education by Marriage Status in Huxley
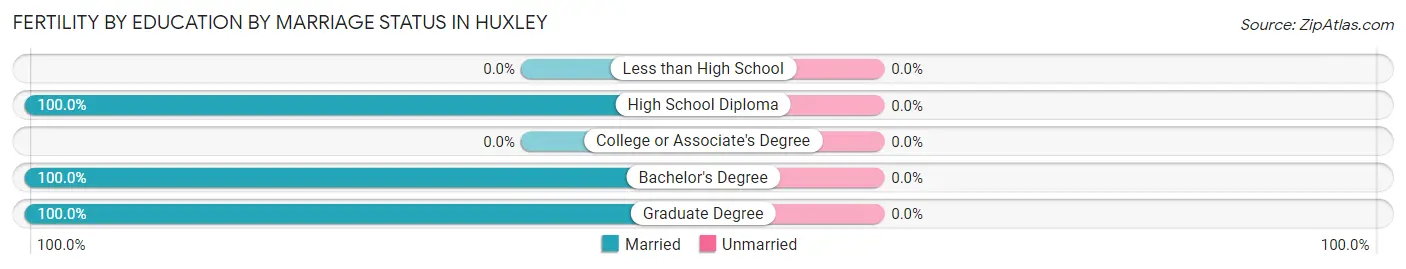
| Educational Attainment | Married | Unmarried |
| Less than High School | 0 (0.0%) | 0 (0.0%) |
| High School Diploma | 20 (100.0%) | 0 (0.0%) |
| College or Associate's Degree | 0 (0.0%) | 0 (0.0%) |
| Bachelor's Degree | 15 (100.0%) | 0 (0.0%) |
| Graduate Degree | 30 (100.0%) | 0 (0.0%) |
| Total | 65 (100.0%) | 0 (0.0%) |
Employment Characteristics in Huxley
Employment by Class of Employer in Huxley
Among the 2,262 employed individuals in Huxley, private company employees (1,145 | 50.6%), state government employees (407 | 18.0%), and local government employees (297 | 13.1%) make up the most common classes of employment.
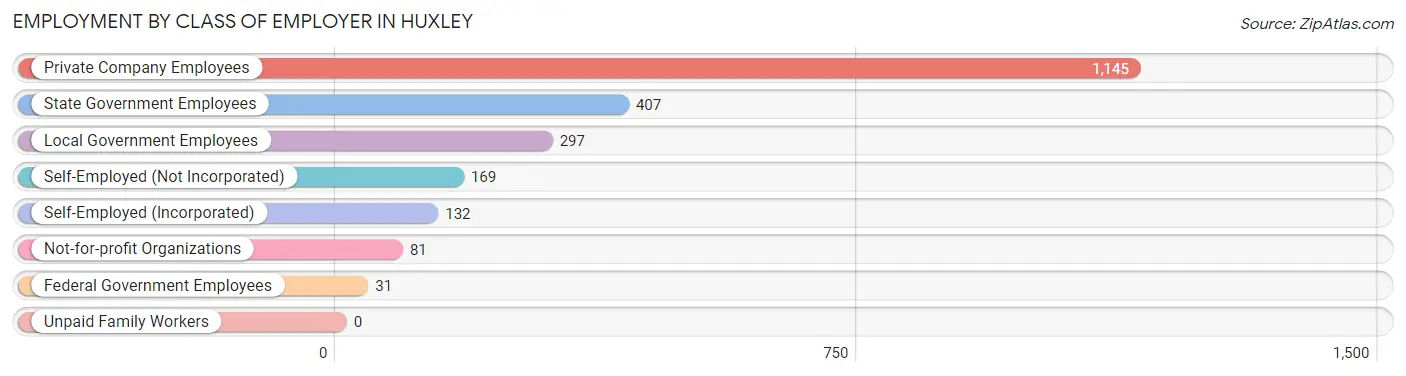
| Employer Class | # Employees | % Employees |
| Private Company Employees | 1,145 | 50.6% |
| Self-Employed (Incorporated) | 132 | 5.8% |
| Self-Employed (Not Incorporated) | 169 | 7.5% |
| Not-for-profit Organizations | 81 | 3.6% |
| Local Government Employees | 297 | 13.1% |
| State Government Employees | 407 | 18.0% |
| Federal Government Employees | 31 | 1.4% |
| Unpaid Family Workers | 0 | 0.0% |
| Total | 2,262 | 100.0% |
Employment Status by Age in Huxley
According to the labor force statistics for Huxley, out of the total population over 16 years of age (3,036), 76.4% or 2,320 individuals are in the labor force, with 1.4% or 32 of them unemployed. The age group with the highest labor force participation rate is 25 to 29 years, with 93.3% or 194 individuals in the labor force. Within the labor force, the 16 to 19 years age range has the highest percentage of unemployed individuals, with 17.2% or 15 of them being unemployed.
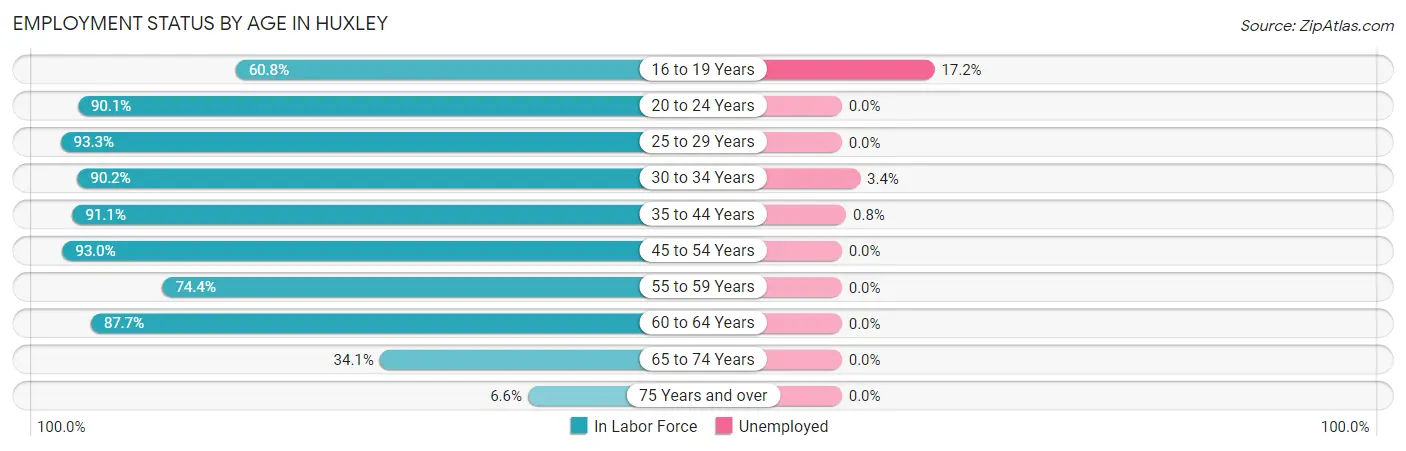
| Age Bracket | In Labor Force | Unemployed |
| 16 to 19 Years | 87 (60.8%) | 15 (17.2%) |
| 20 to 24 Years | 109 (90.1%) | 0 (0.0%) |
| 25 to 29 Years | 194 (93.3%) | 0 (0.0%) |
| 30 to 34 Years | 350 (90.2%) | 12 (3.4%) |
| 35 to 44 Years | 645 (91.1%) | 5 (0.8%) |
| 45 to 54 Years | 545 (93.0%) | 0 (0.0%) |
| 55 to 59 Years | 166 (74.4%) | 0 (0.0%) |
| 60 to 64 Years | 157 (87.7%) | 0 (0.0%) |
| 65 to 74 Years | 44 (34.1%) | 0 (0.0%) |
| 75 Years and over | 23 (6.6%) | 0 (0.0%) |
| Total | 2,320 (76.4%) | 32 (1.4%) |
Employment Status by Educational Attainment in Huxley
According to labor force statistics for Huxley, 89.7% of individuals (2,056) out of the total population between 25 and 64 years of age (2,292) are in the labor force, with 0.8% or 16 of them being unemployed. The group with the highest labor force participation rate are those with the educational attainment of bachelor's degree or higher, with 94.1% or 1,422 individuals in the labor force. Within the labor force, individuals with high school diploma education have the highest percentage of unemployment, with 5.3% or 12 of them being unemployed.
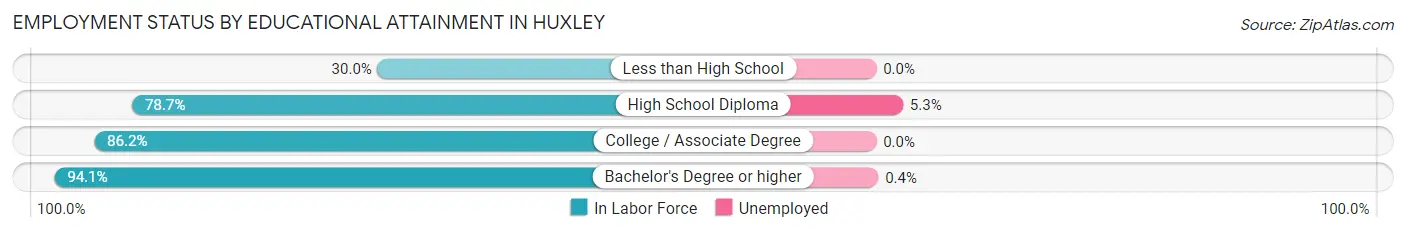
| Educational Attainment | In Labor Force | Unemployed |
| Less than High School | 9 (30.0%) | 0 (0.0%) |
| High School Diploma | 226 (78.7%) | 15 (5.3%) |
| College / Associate Degree | 400 (86.2%) | 0 (0.0%) |
| Bachelor's Degree or higher | 1,422 (94.1%) | 6 (0.4%) |
| Total | 2,056 (89.7%) | 18 (0.8%) |
Employment Occupations by Sex in Huxley
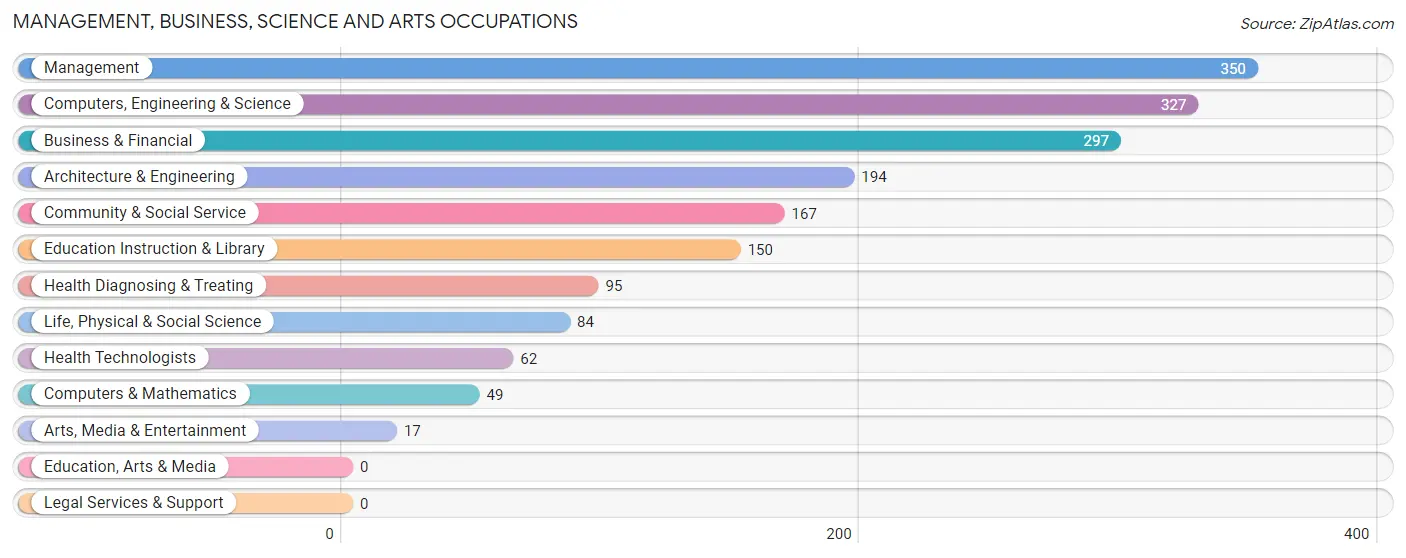
Management, Business, Science and Arts Occupations
The most common Management, Business, Science and Arts occupations in Huxley are Management (350 | 15.4%), Computers, Engineering & Science (327 | 14.4%), Business & Financial (297 | 13.0%), Architecture & Engineering (194 | 8.5%), and Community & Social Service (167 | 7.3%).
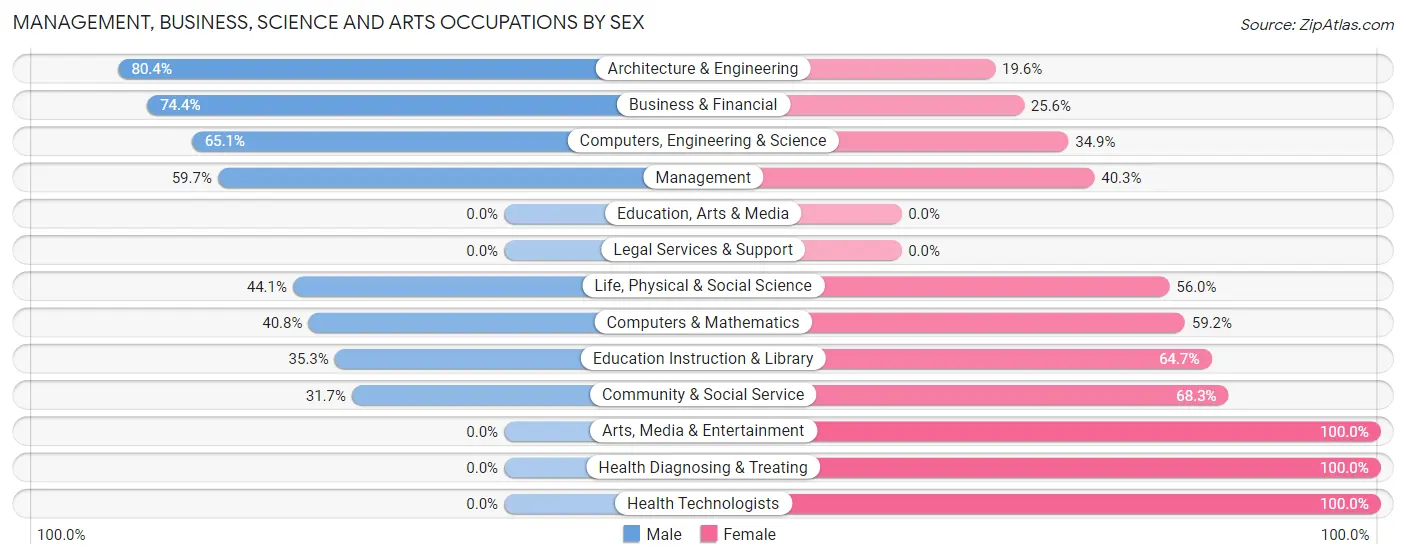
Management, Business, Science and Arts Occupations by Sex
Within the Management, Business, Science and Arts occupations in Huxley, the most male-oriented occupations are Architecture & Engineering (80.4%), Business & Financial (74.4%), and Computers, Engineering & Science (65.1%), while the most female-oriented occupations are Arts, Media & Entertainment (100.0%), Health Diagnosing & Treating (100.0%), and Health Technologists (100.0%).
| Occupation | Male | Female |
| Management | 209 (59.7%) | 141 (40.3%) |
| Business & Financial | 221 (74.4%) | 76 (25.6%) |
| Computers, Engineering & Science | 213 (65.1%) | 114 (34.9%) |
| Computers & Mathematics | 20 (40.8%) | 29 (59.2%) |
| Architecture & Engineering | 156 (80.4%) | 38 (19.6%) |
| Life, Physical & Social Science | 37 (44.1%) | 47 (55.9%) |
| Community & Social Service | 53 (31.7%) | 114 (68.3%) |
| Education, Arts & Media | 0 (0.0%) | 0 (0.0%) |
| Legal Services & Support | 0 (0.0%) | 0 (0.0%) |
| Education Instruction & Library | 53 (35.3%) | 97 (64.7%) |
| Arts, Media & Entertainment | 0 (0.0%) | 17 (100.0%) |
| Health Diagnosing & Treating | 0 (0.0%) | 95 (100.0%) |
| Health Technologists | 0 (0.0%) | 62 (100.0%) |
| Total (Category) | 696 (56.3%) | 540 (43.7%) |
| Total (Overall) | 1,190 (52.3%) | 1,087 (47.7%) |
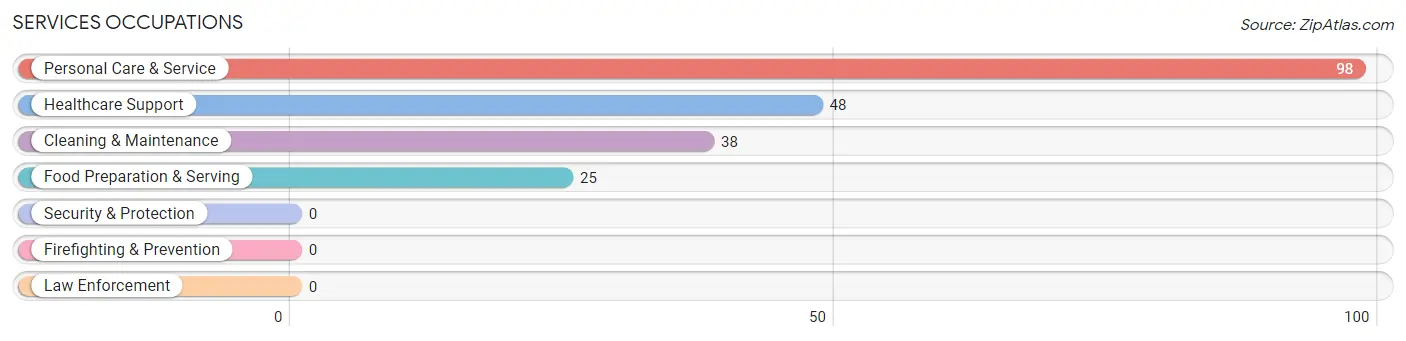
Services Occupations
The most common Services occupations in Huxley are Personal Care & Service (98 | 4.3%), Healthcare Support (48 | 2.1%), Cleaning & Maintenance (38 | 1.7%), and Food Preparation & Serving (25 | 1.1%).
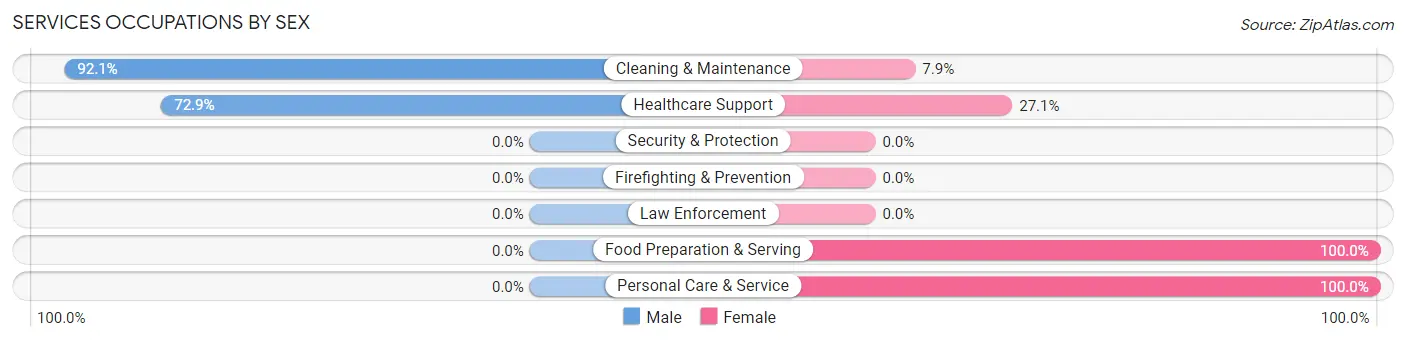
Services Occupations by Sex
Within the Services occupations in Huxley, the most male-oriented occupations are Cleaning & Maintenance (92.1%), and Healthcare Support (72.9%), while the most female-oriented occupations are Food Preparation & Serving (100.0%), Personal Care & Service (100.0%), and Healthcare Support (27.1%).
| Occupation | Male | Female |
| Healthcare Support | 35 (72.9%) | 13 (27.1%) |
| Security & Protection | 0 (0.0%) | 0 (0.0%) |
| Firefighting & Prevention | 0 (0.0%) | 0 (0.0%) |
| Law Enforcement | 0 (0.0%) | 0 (0.0%) |
| Food Preparation & Serving | 0 (0.0%) | 25 (100.0%) |
| Cleaning & Maintenance | 35 (92.1%) | 3 (7.9%) |
| Personal Care & Service | 0 (0.0%) | 98 (100.0%) |
| Total (Category) | 70 (33.5%) | 139 (66.5%) |
| Total (Overall) | 1,190 (52.3%) | 1,087 (47.7%) |
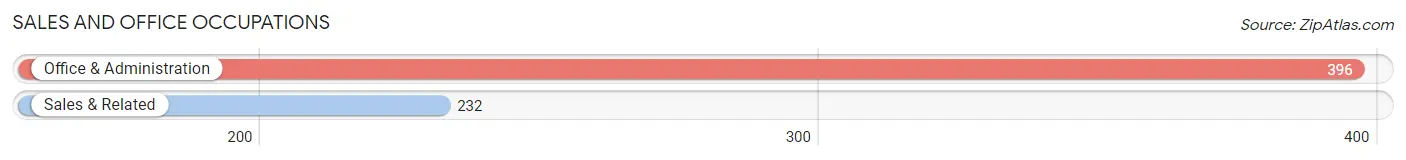
Sales and Office Occupations
The most common Sales and Office occupations in Huxley are Office & Administration (396 | 17.4%), and Sales & Related (232 | 10.2%).
Sales and Office Occupations by Sex
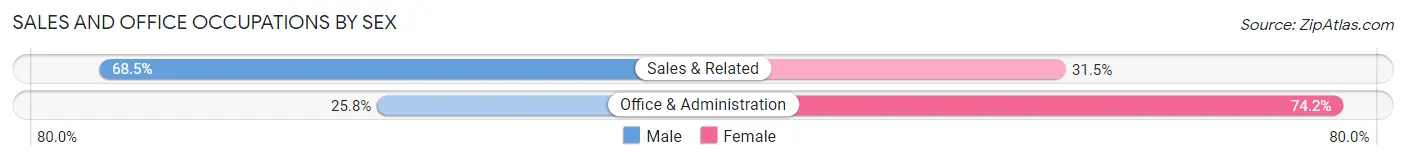
| Occupation | Male | Female |
| Sales & Related | 159 (68.5%) | 73 (31.5%) |
| Office & Administration | 102 (25.8%) | 294 (74.2%) |
| Total (Category) | 261 (41.6%) | 367 (58.4%) |
| Total (Overall) | 1,190 (52.3%) | 1,087 (47.7%) |
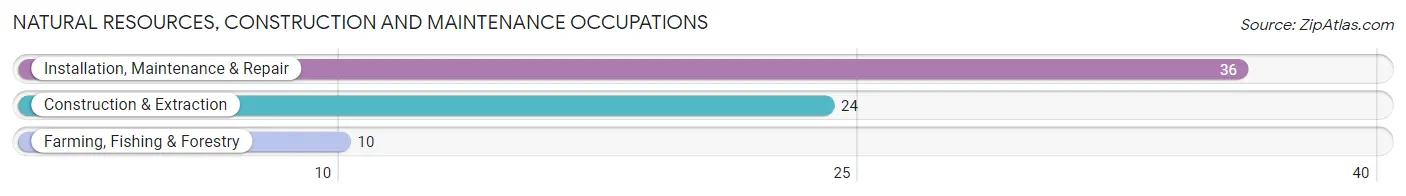
Natural Resources, Construction and Maintenance Occupations
The most common Natural Resources, Construction and Maintenance occupations in Huxley are Installation, Maintenance & Repair (36 | 1.6%), Construction & Extraction (24 | 1.1%), and Farming, Fishing & Forestry (10 | 0.4%).
Natural Resources, Construction and Maintenance Occupations by Sex
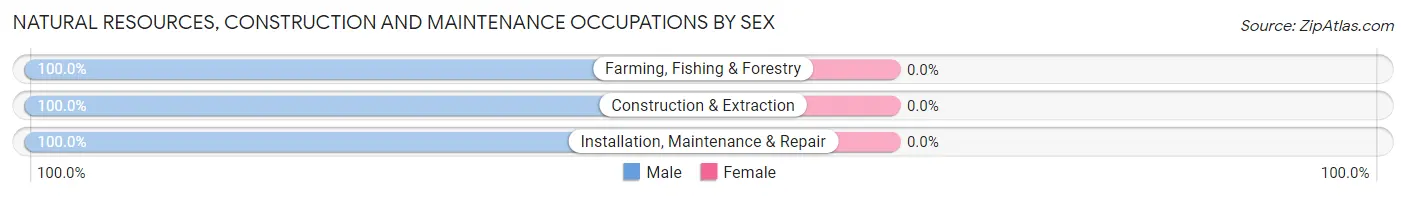
| Occupation | Male | Female |
| Farming, Fishing & Forestry | 10 (100.0%) | 0 (0.0%) |
| Construction & Extraction | 24 (100.0%) | 0 (0.0%) |
| Installation, Maintenance & Repair | 36 (100.0%) | 0 (0.0%) |
| Total (Category) | 70 (100.0%) | 0 (0.0%) |
| Total (Overall) | 1,190 (52.3%) | 1,087 (47.7%) |
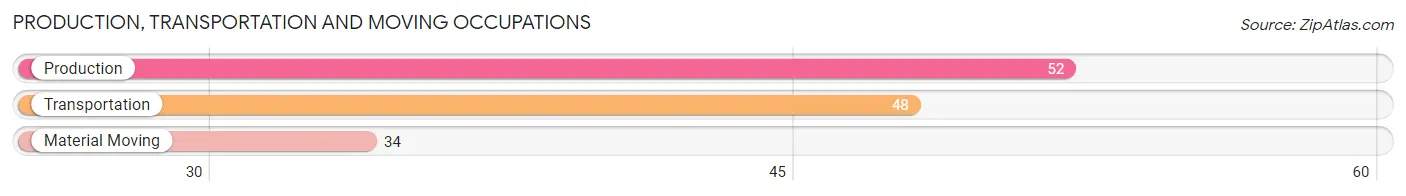
Production, Transportation and Moving Occupations
The most common Production, Transportation and Moving occupations in Huxley are Production (52 | 2.3%), Transportation (48 | 2.1%), and Material Moving (34 | 1.5%).
Production, Transportation and Moving Occupations by Sex
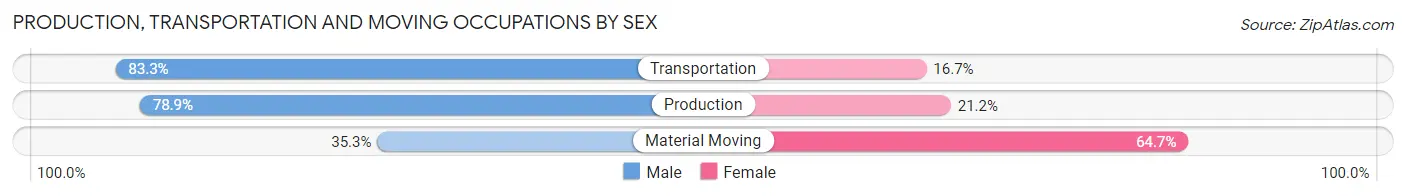
| Occupation | Male | Female |
| Production | 41 (78.8%) | 11 (21.1%) |
| Transportation | 40 (83.3%) | 8 (16.7%) |
| Material Moving | 12 (35.3%) | 22 (64.7%) |
| Total (Category) | 93 (69.4%) | 41 (30.6%) |
| Total (Overall) | 1,190 (52.3%) | 1,087 (47.7%) |
Employment Industries by Sex in Huxley
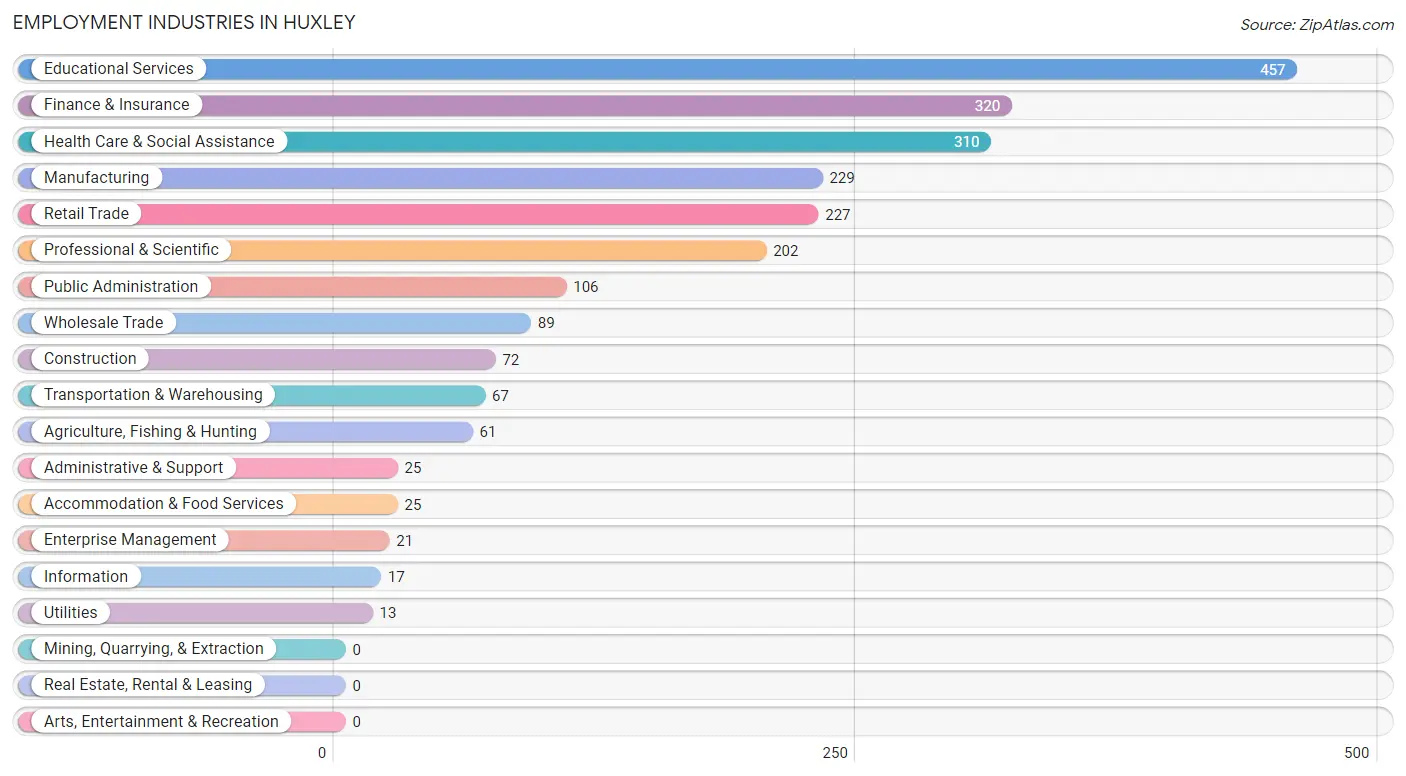
Employment Industries in Huxley
The major employment industries in Huxley include Educational Services (457 | 20.1%), Finance & Insurance (320 | 14.1%), Health Care & Social Assistance (310 | 13.6%), Manufacturing (229 | 10.1%), and Retail Trade (227 | 10.0%).
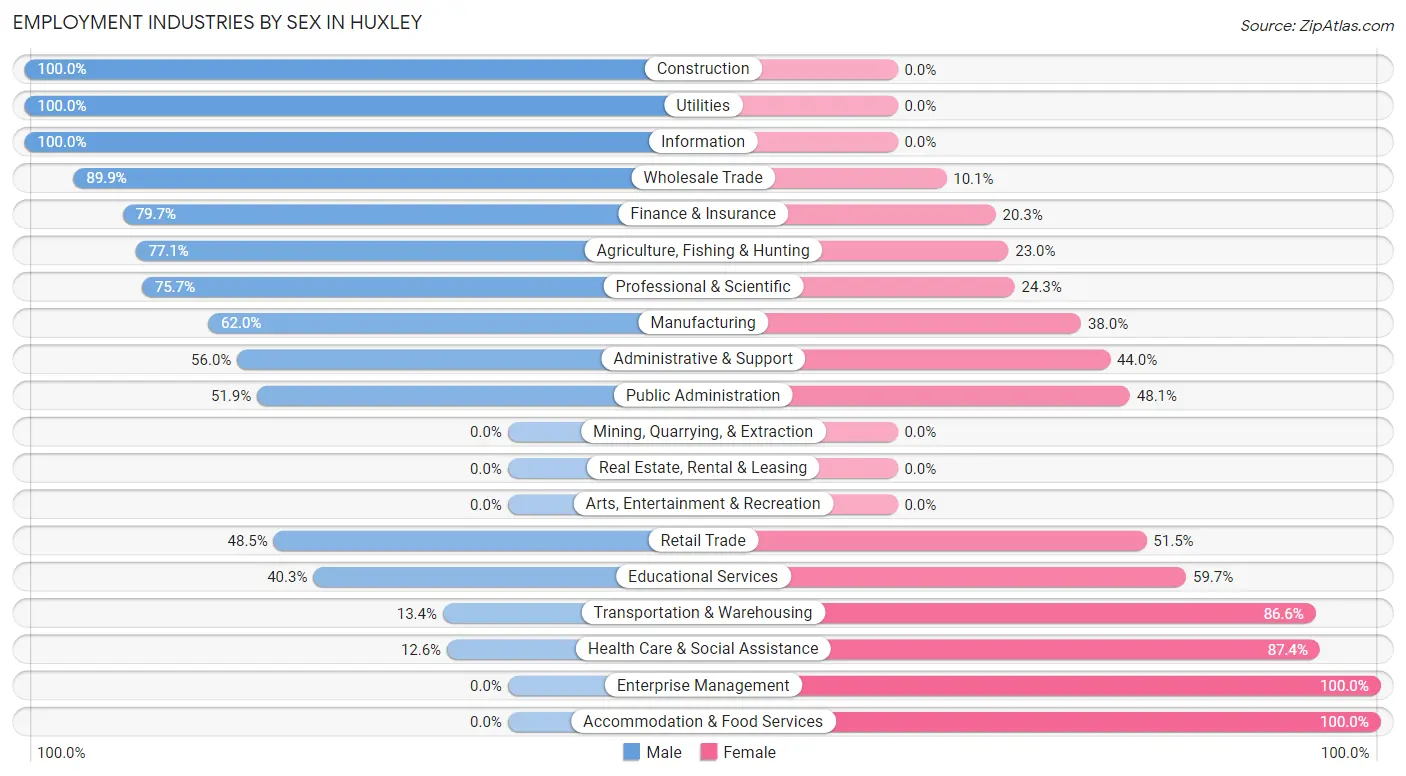
Employment Industries by Sex in Huxley
The Huxley industries that see more men than women are Construction (100.0%), Utilities (100.0%), and Information (100.0%), whereas the industries that tend to have a higher number of women are Enterprise Management (100.0%), Accommodation & Food Services (100.0%), and Health Care & Social Assistance (87.4%).
| Industry | Male | Female |
| Agriculture, Fishing & Hunting | 47 (77.0%) | 14 (23.0%) |
| Mining, Quarrying, & Extraction | 0 (0.0%) | 0 (0.0%) |
| Construction | 72 (100.0%) | 0 (0.0%) |
| Manufacturing | 142 (62.0%) | 87 (38.0%) |
| Wholesale Trade | 80 (89.9%) | 9 (10.1%) |
| Retail Trade | 110 (48.5%) | 117 (51.5%) |
| Transportation & Warehousing | 9 (13.4%) | 58 (86.6%) |
| Utilities | 13 (100.0%) | 0 (0.0%) |
| Information | 17 (100.0%) | 0 (0.0%) |
| Finance & Insurance | 255 (79.7%) | 65 (20.3%) |
| Real Estate, Rental & Leasing | 0 (0.0%) | 0 (0.0%) |
| Professional & Scientific | 153 (75.7%) | 49 (24.3%) |
| Enterprise Management | 0 (0.0%) | 21 (100.0%) |
| Administrative & Support | 14 (56.0%) | 11 (44.0%) |
| Educational Services | 184 (40.3%) | 273 (59.7%) |
| Health Care & Social Assistance | 39 (12.6%) | 271 (87.4%) |
| Arts, Entertainment & Recreation | 0 (0.0%) | 0 (0.0%) |
| Accommodation & Food Services | 0 (0.0%) | 25 (100.0%) |
| Public Administration | 55 (51.9%) | 51 (48.1%) |
| Total | 1,190 (52.3%) | 1,087 (47.7%) |
Education in Huxley
School Enrollment in Huxley
The most common levels of schooling among the 1,337 students in Huxley are elementary school (408 | 30.5%), middle school (269 | 20.1%), and nursery / preschool (177 | 13.2%).
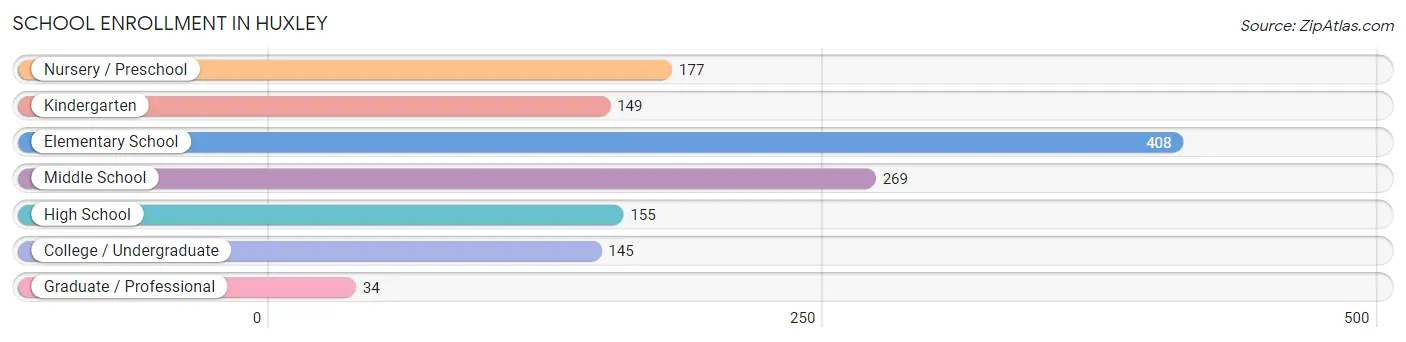
| School Level | # Students | % Students |
| Nursery / Preschool | 177 | 13.2% |
| Kindergarten | 149 | 11.1% |
| Elementary School | 408 | 30.5% |
| Middle School | 269 | 20.1% |
| High School | 155 | 11.6% |
| College / Undergraduate | 145 | 10.8% |
| Graduate / Professional | 34 | 2.5% |
| Total | 1,337 | 100.0% |
School Enrollment by Age by Funding Source in Huxley
Out of a total of 1,337 students who are enrolled in schools in Huxley, 57 (4.3%) attend a private institution, while the remaining 1,280 (95.7%) are enrolled in public schools. The age group of 20 to 24 year olds has the highest likelihood of being enrolled in private schools, with 30 (30.9% in the age bracket) enrolled. Conversely, the age group of 5 to 9 year old has the lowest likelihood of being enrolled in a private school, with 591 (100.0% in the age bracket) attending a public institution.
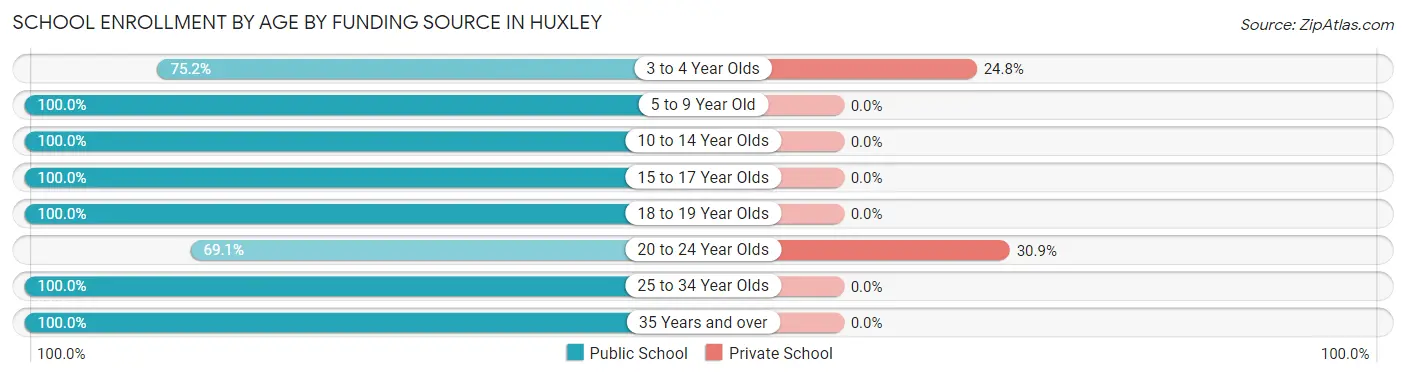
| Age Bracket | Public School | Private School |
| 3 to 4 Year Olds | 85 (75.2%) | 28 (24.8%) |
| 5 to 9 Year Old | 591 (100.0%) | 0 (0.0%) |
| 10 to 14 Year Olds | 320 (100.0%) | 0 (0.0%) |
| 15 to 17 Year Olds | 134 (100.0%) | 0 (0.0%) |
| 18 to 19 Year Olds | 5 (100.0%) | 0 (0.0%) |
| 20 to 24 Year Olds | 67 (69.1%) | 30 (30.9%) |
| 25 to 34 Year Olds | 51 (100.0%) | 0 (0.0%) |
| 35 Years and over | 26 (100.0%) | 0 (0.0%) |
| Total | 1,280 (95.7%) | 57 (4.3%) |
Educational Attainment by Field of Study in Huxley
Business (456 | 26.4%), arts & humanities (255 | 14.7%), education (251 | 14.5%), bio, nature & agricultural (170 | 9.8%), and engineering (161 | 9.3%) are the most common fields of study among 1,729 individuals in Huxley who have obtained a bachelor's degree or higher.
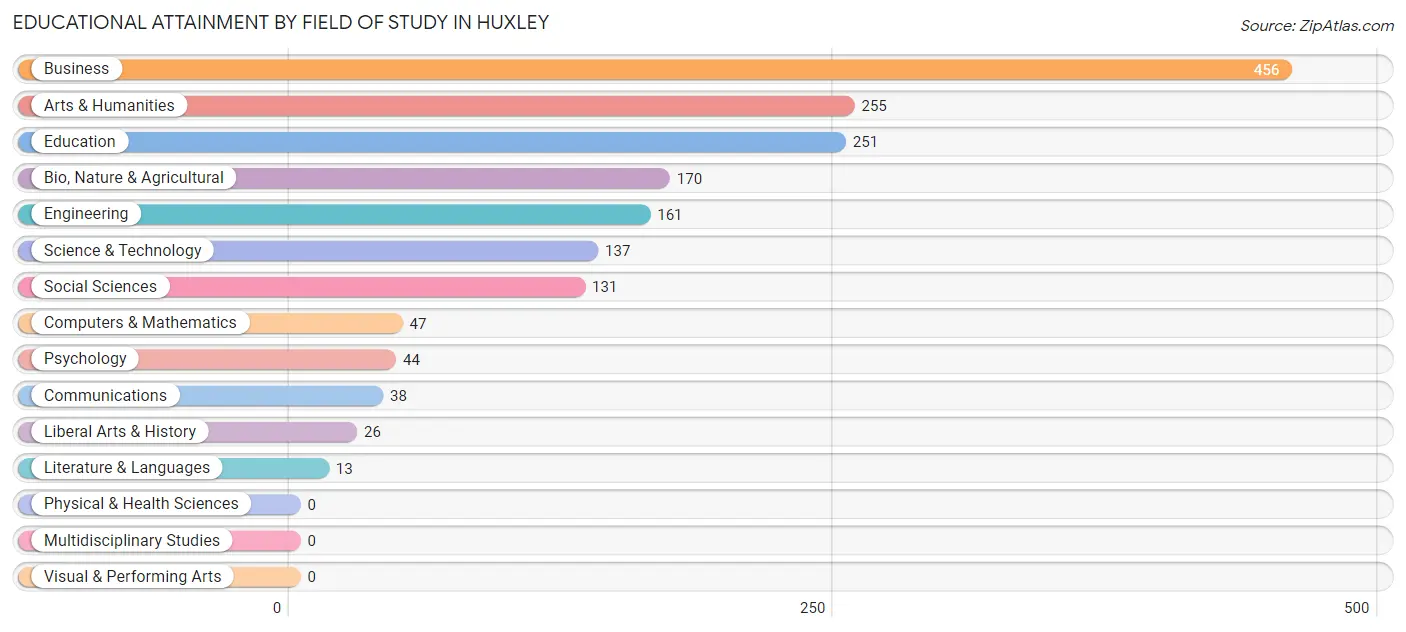
| Field of Study | # Graduates | % Graduates |
| Computers & Mathematics | 47 | 2.7% |
| Bio, Nature & Agricultural | 170 | 9.8% |
| Physical & Health Sciences | 0 | 0.0% |
| Psychology | 44 | 2.5% |
| Social Sciences | 131 | 7.6% |
| Engineering | 161 | 9.3% |
| Multidisciplinary Studies | 0 | 0.0% |
| Science & Technology | 137 | 7.9% |
| Business | 456 | 26.4% |
| Education | 251 | 14.5% |
| Literature & Languages | 13 | 0.7% |
| Liberal Arts & History | 26 | 1.5% |
| Visual & Performing Arts | 0 | 0.0% |
| Communications | 38 | 2.2% |
| Arts & Humanities | 255 | 14.7% |
| Total | 1,729 | 100.0% |
Transportation & Commute in Huxley
Vehicle Availability by Sex in Huxley
The most prevalent vehicle ownership categories in Huxley are males with 2 vehicles (519, accounting for 43.8%) and females with 2 vehicles (504, making up 48.1%).
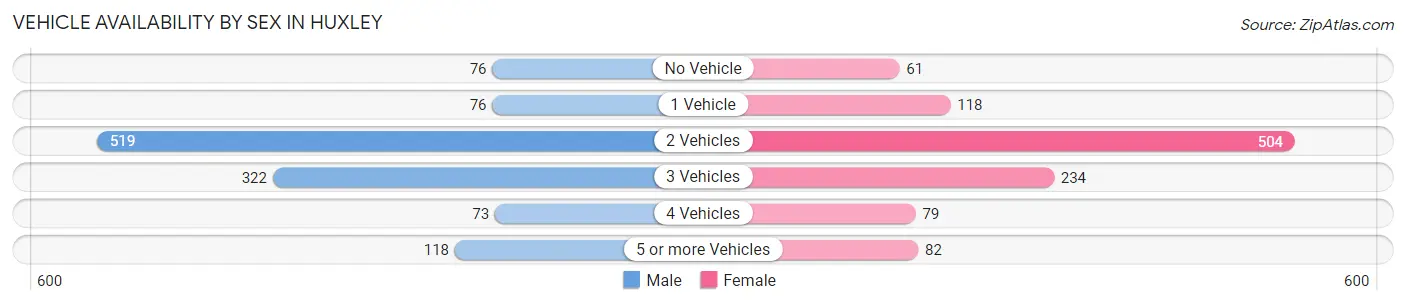
| Vehicles Available | Male | Female |
| No Vehicle | 76 (6.4%) | 61 (5.7%) |
| 1 Vehicle | 76 (6.4%) | 118 (11.0%) |
| 2 Vehicles | 519 (43.8%) | 504 (46.8%) |
| 3 Vehicles | 322 (27.2%) | 234 (21.7%) |
| 4 Vehicles | 73 (6.2%) | 79 (7.3%) |
| 5 or more Vehicles | 118 (10.0%) | 82 (7.6%) |
| Total | 1,184 (100.0%) | 1,078 (100.0%) |
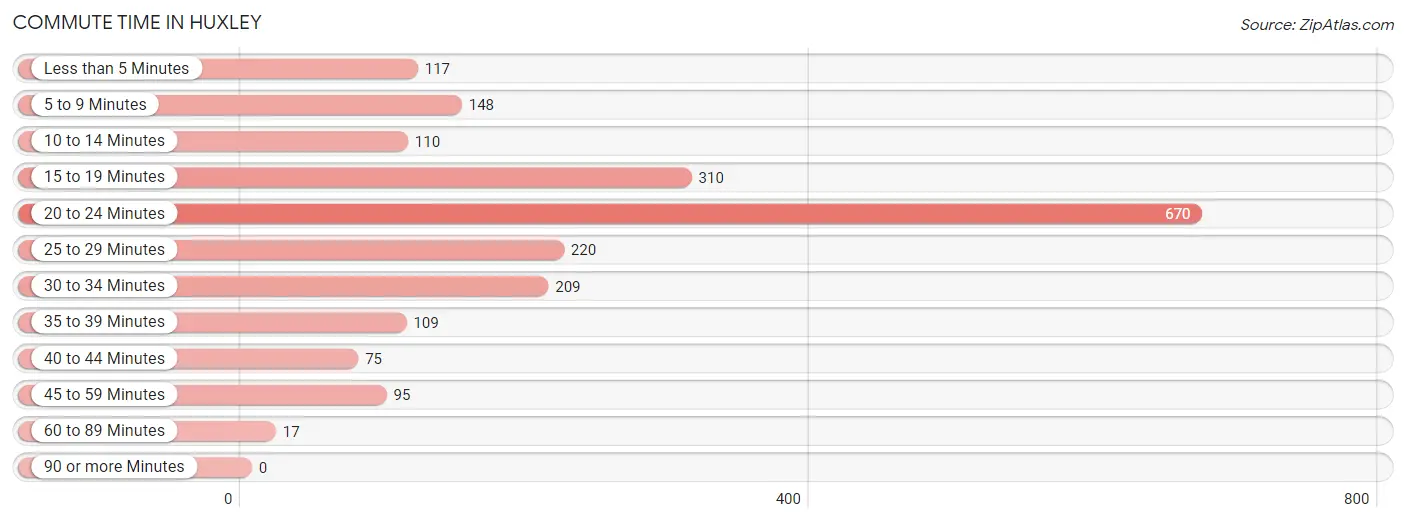
Commute Time in Huxley
The most frequently occuring commute durations in Huxley are 20 to 24 minutes (670 commuters, 32.2%), 15 to 19 minutes (310 commuters, 14.9%), and 25 to 29 minutes (220 commuters, 10.6%).
| Commute Time | # Commuters | % Commuters |
| Less than 5 Minutes | 117 | 5.6% |
| 5 to 9 Minutes | 148 | 7.1% |
| 10 to 14 Minutes | 110 | 5.3% |
| 15 to 19 Minutes | 310 | 14.9% |
| 20 to 24 Minutes | 670 | 32.2% |
| 25 to 29 Minutes | 220 | 10.6% |
| 30 to 34 Minutes | 209 | 10.1% |
| 35 to 39 Minutes | 109 | 5.2% |
| 40 to 44 Minutes | 75 | 3.6% |
| 45 to 59 Minutes | 95 | 4.6% |
| 60 to 89 Minutes | 17 | 0.8% |
| 90 or more Minutes | 0 | 0.0% |
Commute Time by Sex in Huxley
The most common commute times in Huxley are 20 to 24 minutes (356 commuters, 31.8%) for males and 20 to 24 minutes (314 commuters, 32.7%) for females.
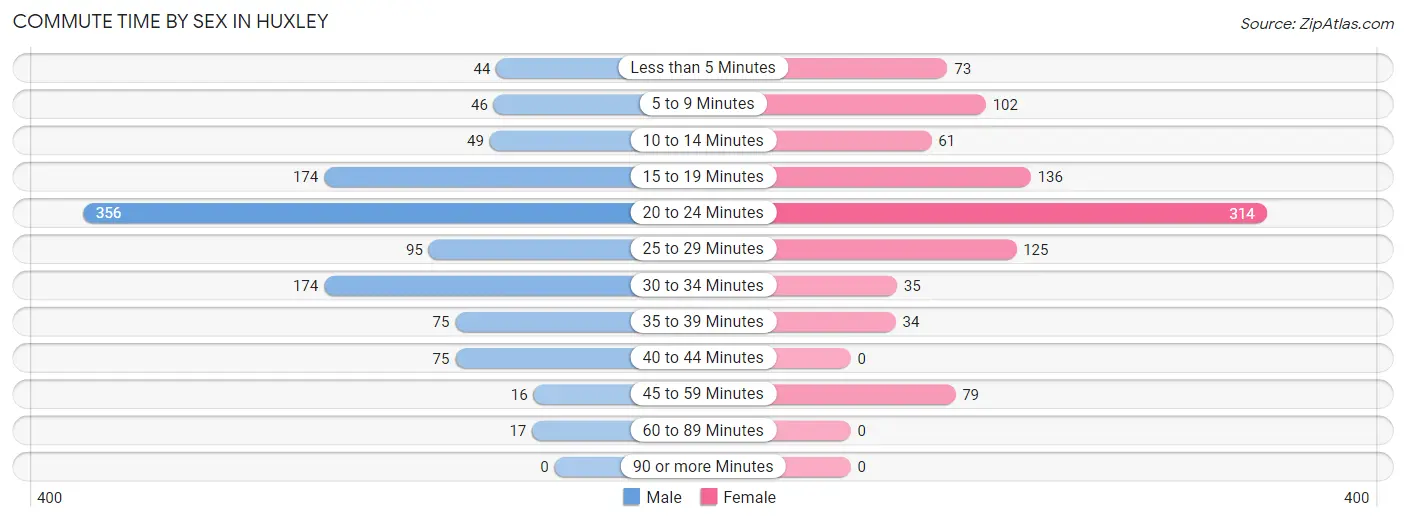
| Commute Time | Male | Female |
| Less than 5 Minutes | 44 (3.9%) | 73 (7.6%) |
| 5 to 9 Minutes | 46 (4.1%) | 102 (10.6%) |
| 10 to 14 Minutes | 49 (4.4%) | 61 (6.4%) |
| 15 to 19 Minutes | 174 (15.5%) | 136 (14.2%) |
| 20 to 24 Minutes | 356 (31.8%) | 314 (32.7%) |
| 25 to 29 Minutes | 95 (8.5%) | 125 (13.0%) |
| 30 to 34 Minutes | 174 (15.5%) | 35 (3.6%) |
| 35 to 39 Minutes | 75 (6.7%) | 34 (3.5%) |
| 40 to 44 Minutes | 75 (6.7%) | 0 (0.0%) |
| 45 to 59 Minutes | 16 (1.4%) | 79 (8.2%) |
| 60 to 89 Minutes | 17 (1.5%) | 0 (0.0%) |
| 90 or more Minutes | 0 (0.0%) | 0 (0.0%) |
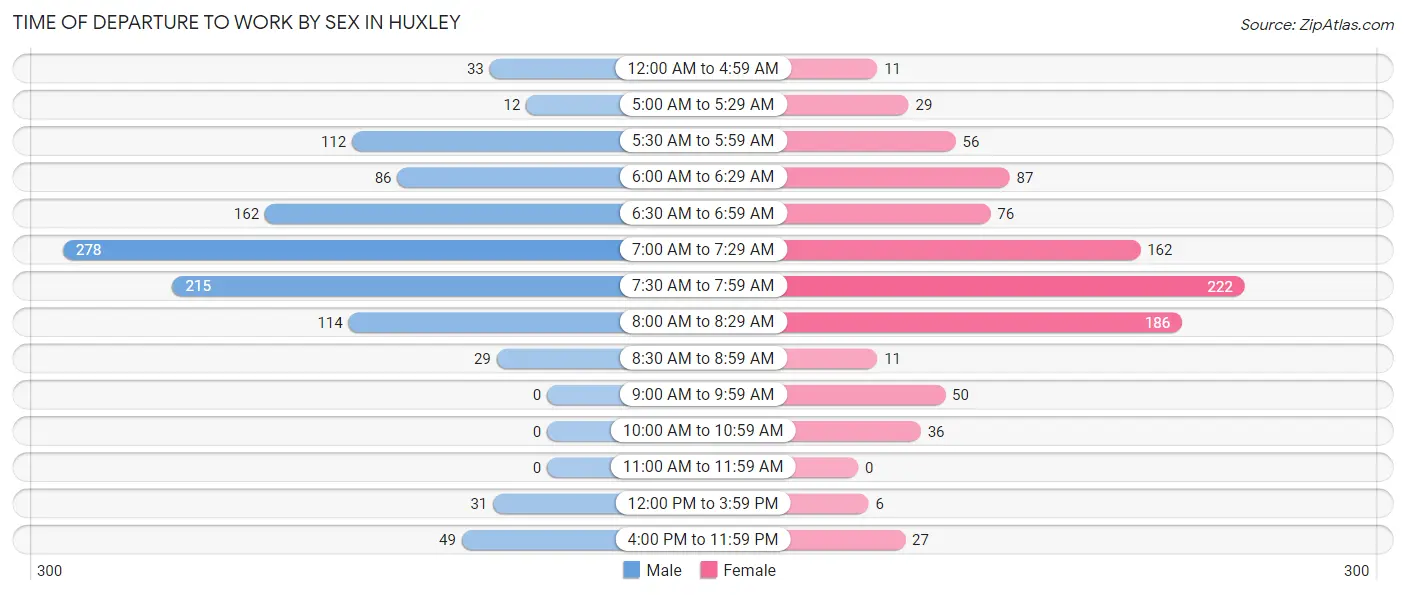
Time of Departure to Work by Sex in Huxley
The most frequent times of departure to work in Huxley are 7:00 AM to 7:29 AM (278, 24.8%) for males and 7:30 AM to 7:59 AM (222, 23.2%) for females.
| Time of Departure | Male | Female |
| 12:00 AM to 4:59 AM | 33 (2.9%) | 11 (1.1%) |
| 5:00 AM to 5:29 AM | 12 (1.1%) | 29 (3.0%) |
| 5:30 AM to 5:59 AM | 112 (10.0%) | 56 (5.8%) |
| 6:00 AM to 6:29 AM | 86 (7.7%) | 87 (9.1%) |
| 6:30 AM to 6:59 AM | 162 (14.4%) | 76 (7.9%) |
| 7:00 AM to 7:29 AM | 278 (24.8%) | 162 (16.9%) |
| 7:30 AM to 7:59 AM | 215 (19.2%) | 222 (23.2%) |
| 8:00 AM to 8:29 AM | 114 (10.2%) | 186 (19.4%) |
| 8:30 AM to 8:59 AM | 29 (2.6%) | 11 (1.1%) |
| 9:00 AM to 9:59 AM | 0 (0.0%) | 50 (5.2%) |
| 10:00 AM to 10:59 AM | 0 (0.0%) | 36 (3.7%) |
| 11:00 AM to 11:59 AM | 0 (0.0%) | 0 (0.0%) |
| 12:00 PM to 3:59 PM | 31 (2.8%) | 6 (0.6%) |
| 4:00 PM to 11:59 PM | 49 (4.4%) | 27 (2.8%) |
| Total | 1,121 (100.0%) | 959 (100.0%) |
Housing Occupancy in Huxley
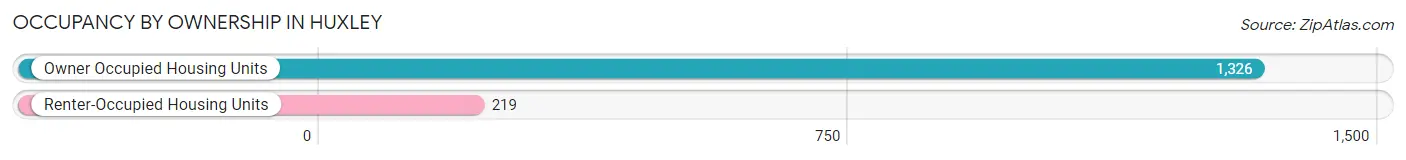
Occupancy by Ownership in Huxley
Of the total 1,545 dwellings in Huxley, owner-occupied units account for 1,326 (85.8%), while renter-occupied units make up 219 (14.2%).
| Occupancy | # Housing Units | % Housing Units |
| Owner Occupied Housing Units | 1,326 | 85.8% |
| Renter-Occupied Housing Units | 219 | 14.2% |
| Total Occupied Housing Units | 1,545 | 100.0% |
Occupancy by Household Size in Huxley
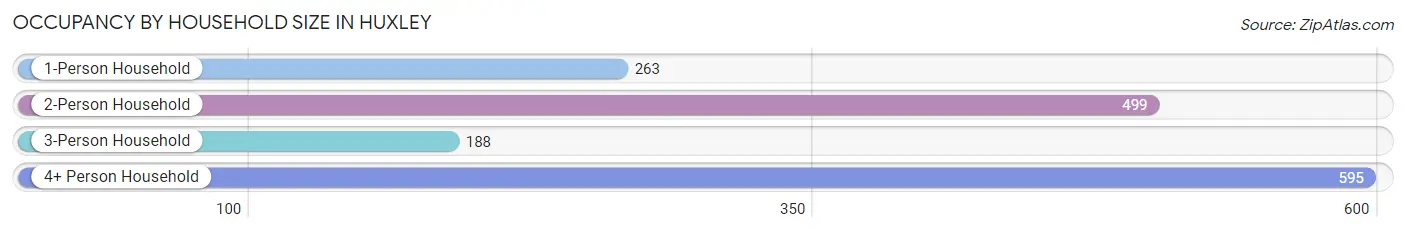
| Household Size | # Housing Units | % Housing Units |
| 1-Person Household | 263 | 17.0% |
| 2-Person Household | 499 | 32.3% |
| 3-Person Household | 188 | 12.2% |
| 4+ Person Household | 595 | 38.5% |
| Total Housing Units | 1,545 | 100.0% |
Occupancy by Ownership by Household Size in Huxley
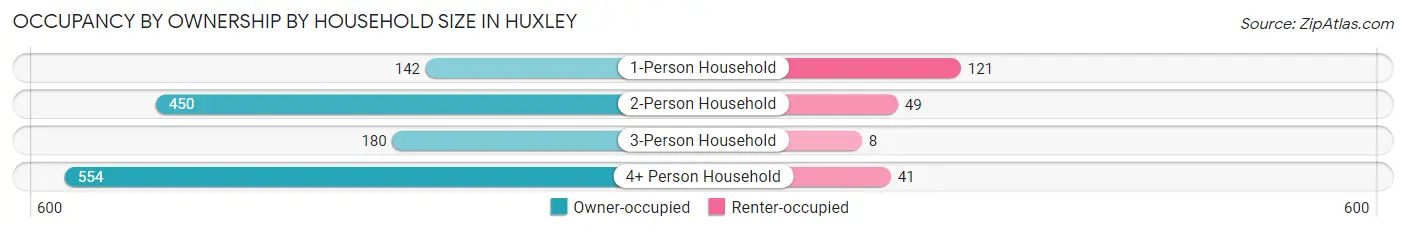
| Household Size | Owner-occupied | Renter-occupied |
| 1-Person Household | 142 (54.0%) | 121 (46.0%) |
| 2-Person Household | 450 (90.2%) | 49 (9.8%) |
| 3-Person Household | 180 (95.7%) | 8 (4.3%) |
| 4+ Person Household | 554 (93.1%) | 41 (6.9%) |
| Total Housing Units | 1,326 (85.8%) | 219 (14.2%) |
Occupancy by Educational Attainment in Huxley
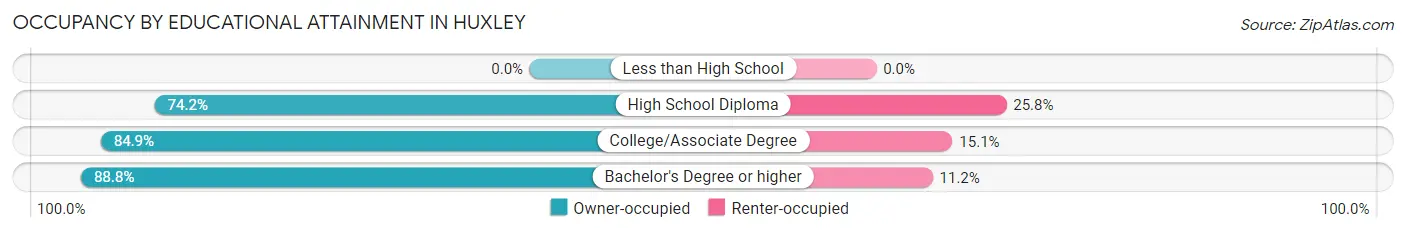
| Household Size | Owner-occupied | Renter-occupied |
| Less than High School | 0 (0.0%) | 0 (0.0%) |
| High School Diploma | 141 (74.2%) | 49 (25.8%) |
| College/Associate Degree | 399 (84.9%) | 71 (15.1%) |
| Bachelor's Degree or higher | 786 (88.8%) | 99 (11.2%) |
Occupancy by Age of Householder in Huxley
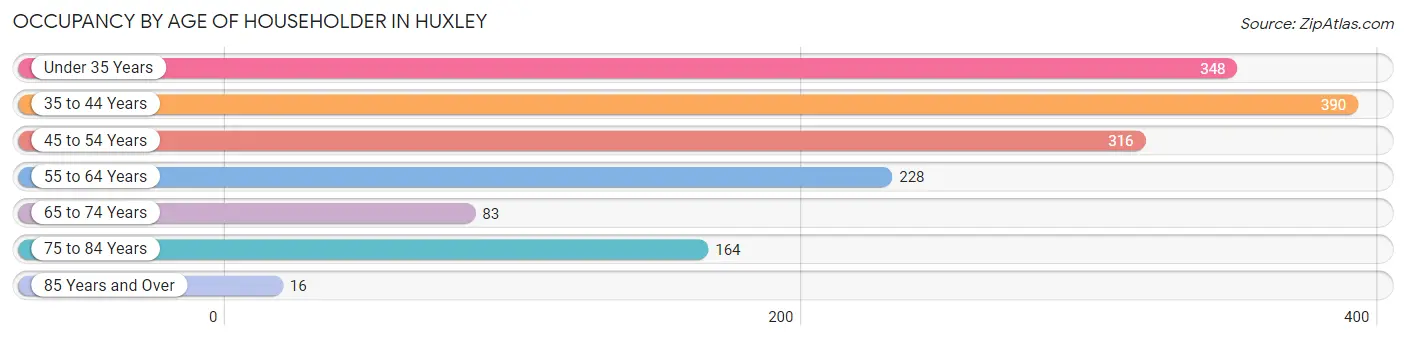
| Age Bracket | # Households | % Households |
| Under 35 Years | 348 | 22.5% |
| 35 to 44 Years | 390 | 25.2% |
| 45 to 54 Years | 316 | 20.4% |
| 55 to 64 Years | 228 | 14.8% |
| 65 to 74 Years | 83 | 5.4% |
| 75 to 84 Years | 164 | 10.6% |
| 85 Years and Over | 16 | 1.0% |
| Total | 1,545 | 100.0% |
Housing Finances in Huxley
Median Income by Occupancy in Huxley
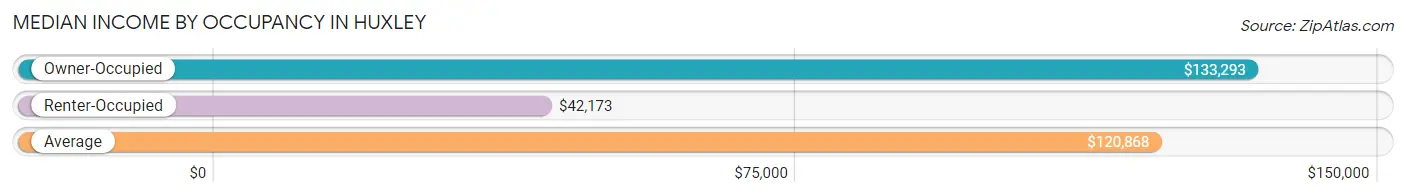
| Occupancy Type | # Households | Median Income |
| Owner-Occupied | 1,326 (85.8%) | $133,293 |
| Renter-Occupied | 219 (14.2%) | $42,173 |
| Average | 1,545 (100.0%) | $120,868 |
Occupancy by Householder Income Bracket in Huxley
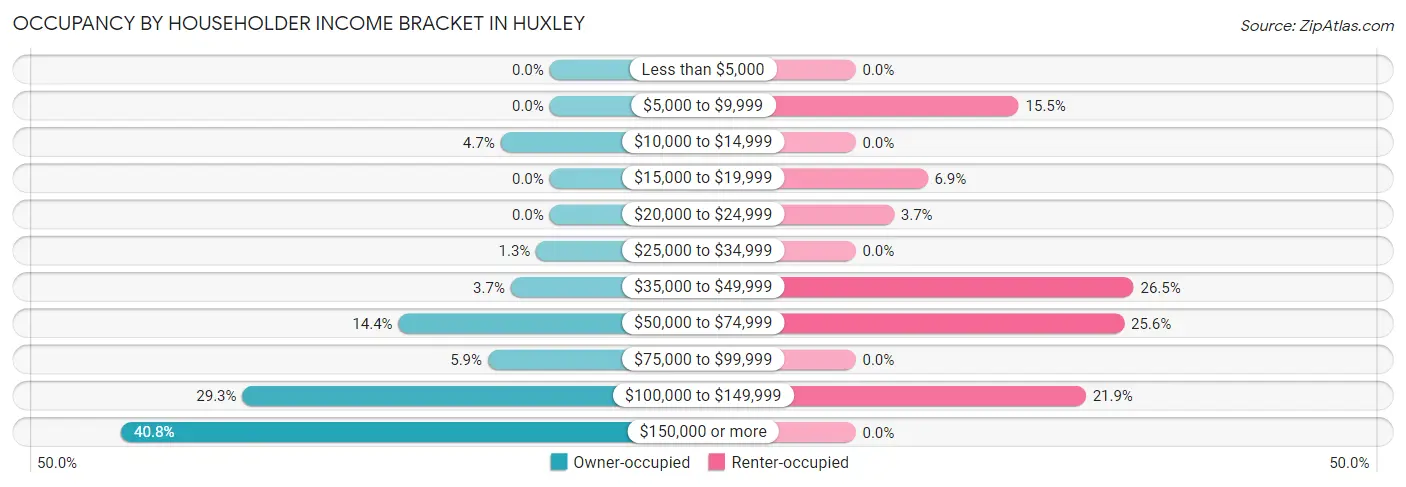
| Income Bracket | Owner-occupied | Renter-occupied |
| Less than $5,000 | 0 (0.0%) | 0 (0.0%) |
| $5,000 to $9,999 | 0 (0.0%) | 34 (15.5%) |
| $10,000 to $14,999 | 62 (4.7%) | 0 (0.0%) |
| $15,000 to $19,999 | 0 (0.0%) | 15 (6.9%) |
| $20,000 to $24,999 | 0 (0.0%) | 8 (3.6%) |
| $25,000 to $34,999 | 17 (1.3%) | 0 (0.0%) |
| $35,000 to $49,999 | 49 (3.7%) | 58 (26.5%) |
| $50,000 to $74,999 | 191 (14.4%) | 56 (25.6%) |
| $75,000 to $99,999 | 78 (5.9%) | 0 (0.0%) |
| $100,000 to $149,999 | 388 (29.3%) | 48 (21.9%) |
| $150,000 or more | 541 (40.8%) | 0 (0.0%) |
| Total | 1,326 (100.0%) | 219 (100.0%) |
Monthly Housing Cost Tiers in Huxley
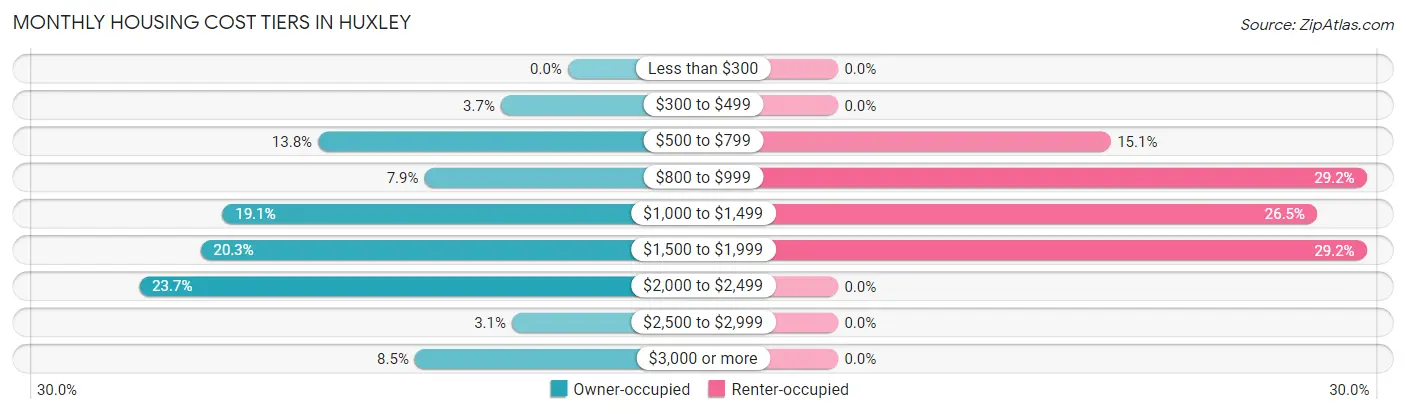
| Monthly Cost | Owner-occupied | Renter-occupied |
| Less than $300 | 0 (0.0%) | 0 (0.0%) |
| $300 to $499 | 49 (3.7%) | 0 (0.0%) |
| $500 to $799 | 183 (13.8%) | 33 (15.1%) |
| $800 to $999 | 105 (7.9%) | 64 (29.2%) |
| $1,000 to $1,499 | 253 (19.1%) | 58 (26.5%) |
| $1,500 to $1,999 | 269 (20.3%) | 64 (29.2%) |
| $2,000 to $2,499 | 314 (23.7%) | 0 (0.0%) |
| $2,500 to $2,999 | 41 (3.1%) | 0 (0.0%) |
| $3,000 or more | 112 (8.5%) | 0 (0.0%) |
| Total | 1,326 (100.0%) | 219 (100.0%) |
Physical Housing Characteristics in Huxley
Housing Structures in Huxley
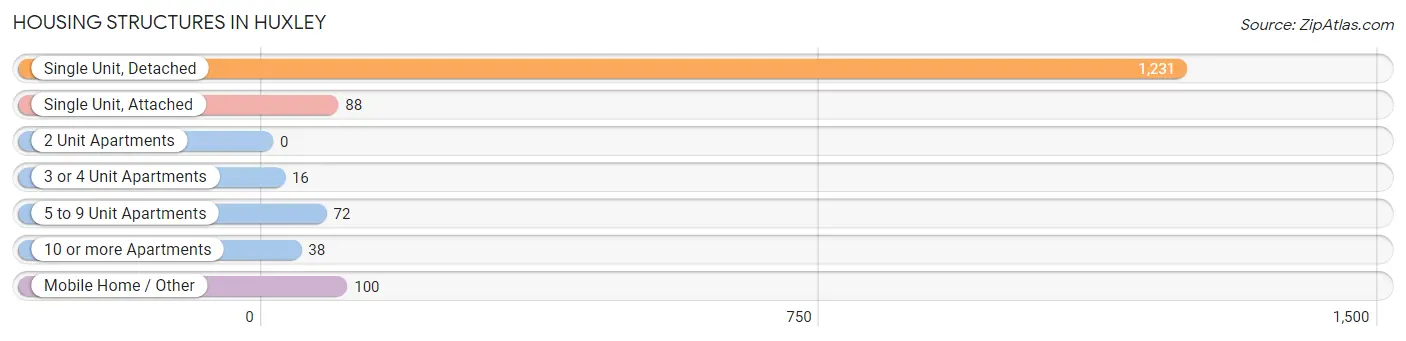
| Structure Type | # Housing Units | % Housing Units |
| Single Unit, Detached | 1,231 | 79.7% |
| Single Unit, Attached | 88 | 5.7% |
| 2 Unit Apartments | 0 | 0.0% |
| 3 or 4 Unit Apartments | 16 | 1.0% |
| 5 to 9 Unit Apartments | 72 | 4.7% |
| 10 or more Apartments | 38 | 2.5% |
| Mobile Home / Other | 100 | 6.5% |
| Total | 1,545 | 100.0% |
Housing Structures by Occupancy in Huxley
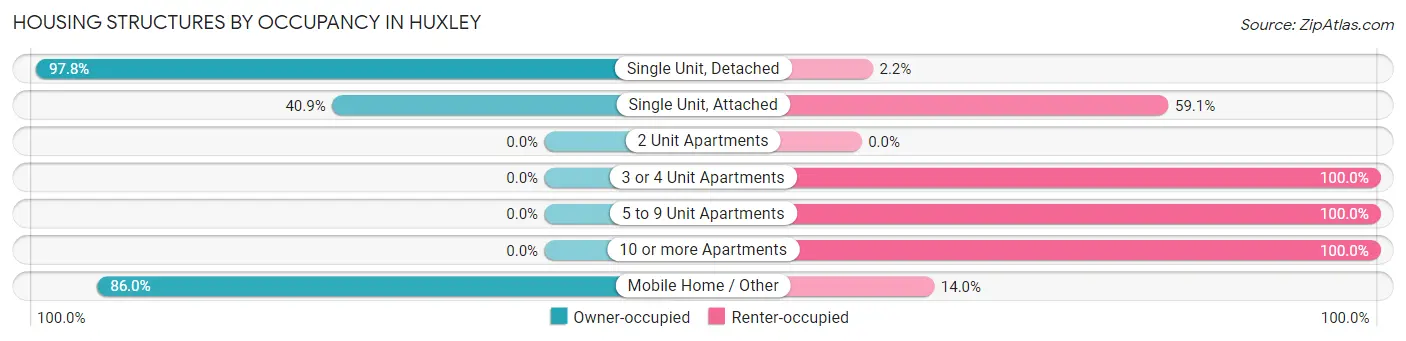
| Structure Type | Owner-occupied | Renter-occupied |
| Single Unit, Detached | 1,204 (97.8%) | 27 (2.2%) |
| Single Unit, Attached | 36 (40.9%) | 52 (59.1%) |
| 2 Unit Apartments | 0 (0.0%) | 0 (0.0%) |
| 3 or 4 Unit Apartments | 0 (0.0%) | 16 (100.0%) |
| 5 to 9 Unit Apartments | 0 (0.0%) | 72 (100.0%) |
| 10 or more Apartments | 0 (0.0%) | 38 (100.0%) |
| Mobile Home / Other | 86 (86.0%) | 14 (14.0%) |
| Total | 1,326 (85.8%) | 219 (14.2%) |
Housing Structures by Number of Rooms in Huxley
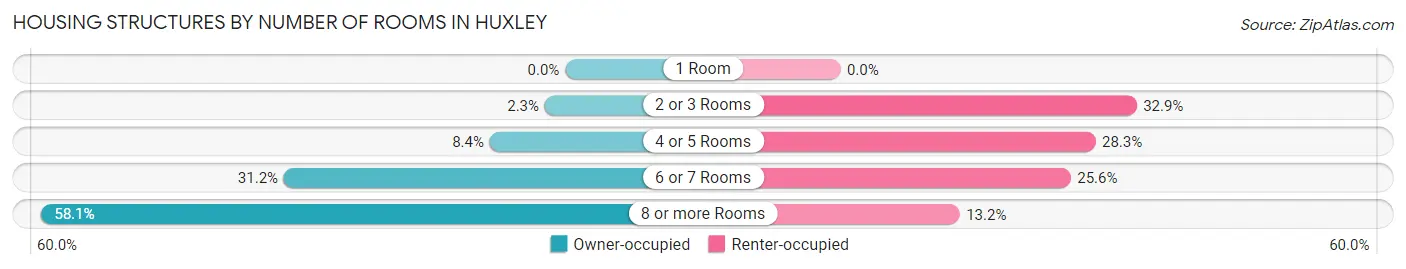
| Number of Rooms | Owner-occupied | Renter-occupied |
| 1 Room | 0 (0.0%) | 0 (0.0%) |
| 2 or 3 Rooms | 30 (2.3%) | 72 (32.9%) |
| 4 or 5 Rooms | 111 (8.4%) | 62 (28.3%) |
| 6 or 7 Rooms | 414 (31.2%) | 56 (25.6%) |
| 8 or more Rooms | 771 (58.1%) | 29 (13.2%) |
| Total | 1,326 (100.0%) | 219 (100.0%) |
Housing Structure by Heating Type in Huxley
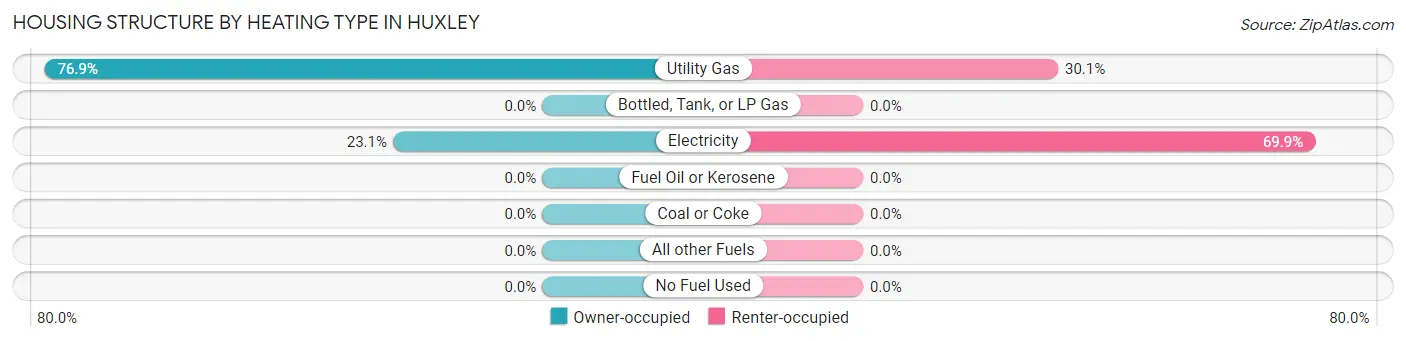
| Heating Type | Owner-occupied | Renter-occupied |
| Utility Gas | 1,020 (76.9%) | 66 (30.1%) |
| Bottled, Tank, or LP Gas | 0 (0.0%) | 0 (0.0%) |
| Electricity | 306 (23.1%) | 153 (69.9%) |
| Fuel Oil or Kerosene | 0 (0.0%) | 0 (0.0%) |
| Coal or Coke | 0 (0.0%) | 0 (0.0%) |
| All other Fuels | 0 (0.0%) | 0 (0.0%) |
| No Fuel Used | 0 (0.0%) | 0 (0.0%) |
| Total | 1,326 (100.0%) | 219 (100.0%) |
Household Vehicle Usage in Huxley
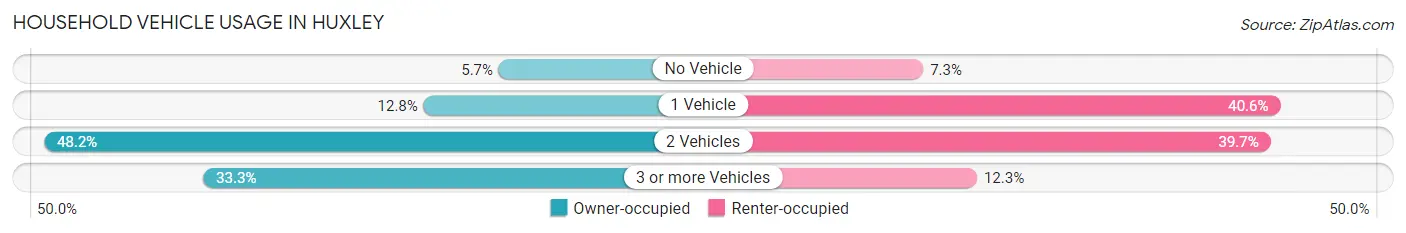
| Vehicles per Household | Owner-occupied | Renter-occupied |
| No Vehicle | 76 (5.7%) | 16 (7.3%) |
| 1 Vehicle | 169 (12.8%) | 89 (40.6%) |
| 2 Vehicles | 639 (48.2%) | 87 (39.7%) |
| 3 or more Vehicles | 442 (33.3%) | 27 (12.3%) |
| Total | 1,326 (100.0%) | 219 (100.0%) |
Real Estate & Mortgages in Huxley
Real Estate and Mortgage Overview in Huxley
| Characteristic | Without Mortgage | With Mortgage |
| Housing Units | 419 | 907 |
| Median Property Value | $270,300 | $297,100 |
| Median Household Income | $92,260 | $431 |
| Monthly Housing Costs | $789 | $112 |
| Real Estate Taxes | $3,772 | $0 |
Property Value by Mortgage Status in Huxley
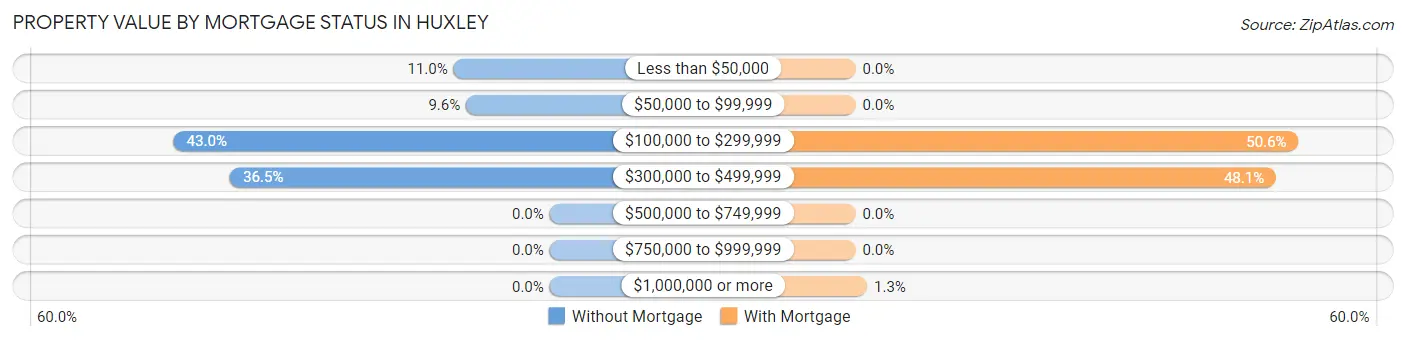
| Property Value | Without Mortgage | With Mortgage |
| Less than $50,000 | 46 (11.0%) | 0 (0.0%) |
| $50,000 to $99,999 | 40 (9.6%) | 0 (0.0%) |
| $100,000 to $299,999 | 180 (43.0%) | 459 (50.6%) |
| $300,000 to $499,999 | 153 (36.5%) | 436 (48.1%) |
| $500,000 to $749,999 | 0 (0.0%) | 0 (0.0%) |
| $750,000 to $999,999 | 0 (0.0%) | 0 (0.0%) |
| $1,000,000 or more | 0 (0.0%) | 12 (1.3%) |
| Total | 419 (100.0%) | 907 (100.0%) |
Household Income by Mortgage Status in Huxley
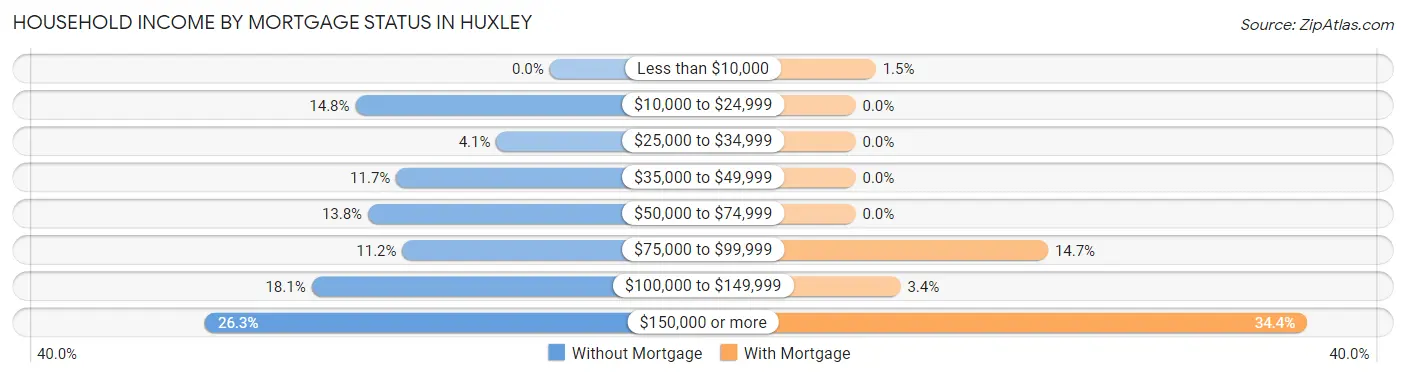
| Household Income | Without Mortgage | With Mortgage |
| Less than $10,000 | 0 (0.0%) | 14 (1.5%) |
| $10,000 to $24,999 | 62 (14.8%) | 0 (0.0%) |
| $25,000 to $34,999 | 17 (4.1%) | 0 (0.0%) |
| $35,000 to $49,999 | 49 (11.7%) | 0 (0.0%) |
| $50,000 to $74,999 | 58 (13.8%) | 0 (0.0%) |
| $75,000 to $99,999 | 47 (11.2%) | 133 (14.7%) |
| $100,000 to $149,999 | 76 (18.1%) | 31 (3.4%) |
| $150,000 or more | 110 (26.3%) | 312 (34.4%) |
| Total | 419 (100.0%) | 907 (100.0%) |
Property Value to Household Income Ratio in Huxley
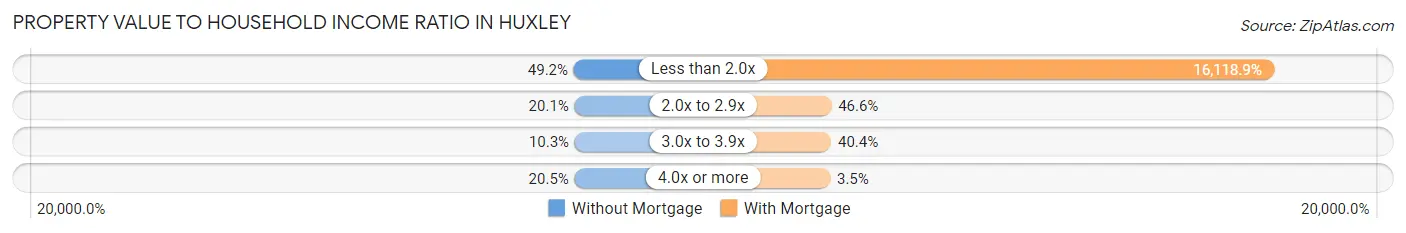
| Value-to-Income Ratio | Without Mortgage | With Mortgage |
| Less than 2.0x | 206 (49.2%) | 146,198 (16,118.9%) |
| 2.0x to 2.9x | 84 (20.1%) | 423 (46.6%) |
| 3.0x to 3.9x | 43 (10.3%) | 366 (40.4%) |
| 4.0x or more | 86 (20.5%) | 32 (3.5%) |
| Total | 419 (100.0%) | 907 (100.0%) |
Real Estate Taxes by Mortgage Status in Huxley
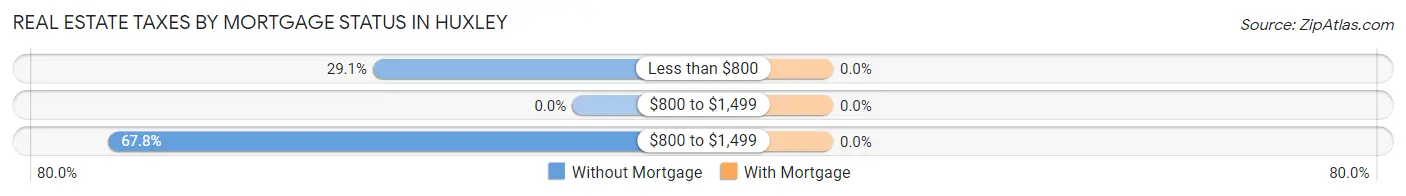
| Property Taxes | Without Mortgage | With Mortgage |
| Less than $800 | 122 (29.1%) | 0 (0.0%) |
| $800 to $1,499 | 0 (0.0%) | 0 (0.0%) |
| $800 to $1,499 | 284 (67.8%) | 0 (0.0%) |
| Total | 419 (100.0%) | 907 (100.0%) |
Health & Disability in Huxley
Health Insurance Coverage by Age in Huxley
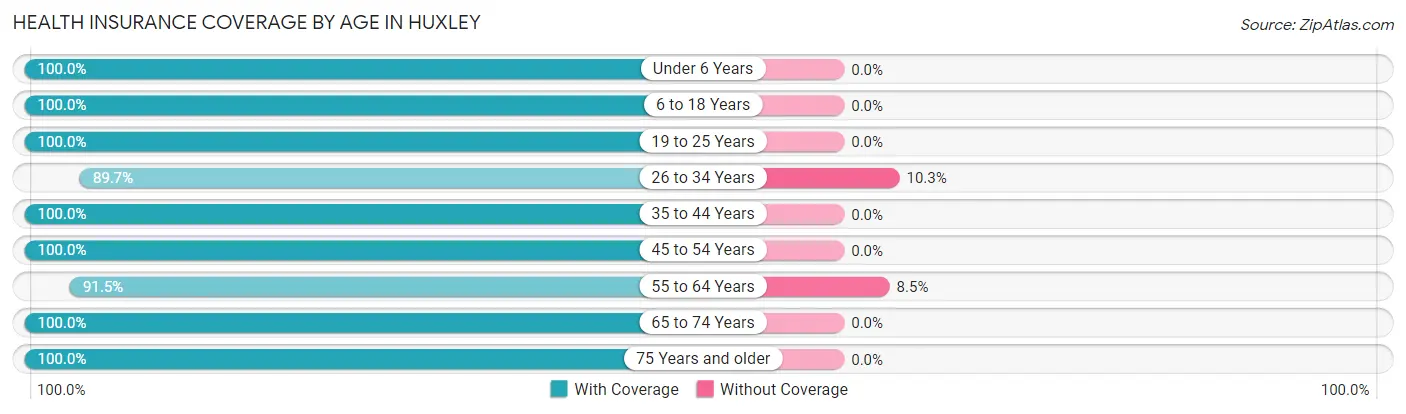
| Age Bracket | With Coverage | Without Coverage |
| Under 6 Years | 447 (100.0%) | 0 (0.0%) |
| 6 to 18 Years | 987 (100.0%) | 0 (0.0%) |
| 19 to 25 Years | 178 (100.0%) | 0 (0.0%) |
| 26 to 34 Years | 487 (89.7%) | 56 (10.3%) |
| 35 to 44 Years | 697 (100.0%) | 0 (0.0%) |
| 45 to 54 Years | 586 (100.0%) | 0 (0.0%) |
| 55 to 64 Years | 368 (91.5%) | 34 (8.5%) |
| 65 to 74 Years | 129 (100.0%) | 0 (0.0%) |
| 75 Years and older | 351 (100.0%) | 0 (0.0%) |
| Total | 4,230 (97.9%) | 90 (2.1%) |
Health Insurance Coverage by Citizenship Status in Huxley
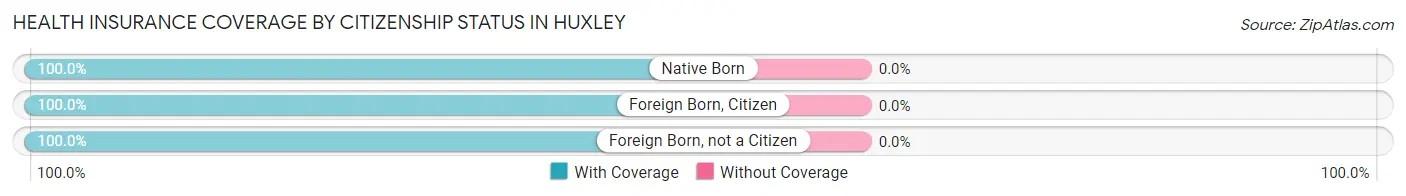
| Citizenship Status | With Coverage | Without Coverage |
| Native Born | 447 (100.0%) | 0 (0.0%) |
| Foreign Born, Citizen | 987 (100.0%) | 0 (0.0%) |
| Foreign Born, not a Citizen | 178 (100.0%) | 0 (0.0%) |
Health Insurance Coverage by Household Income in Huxley
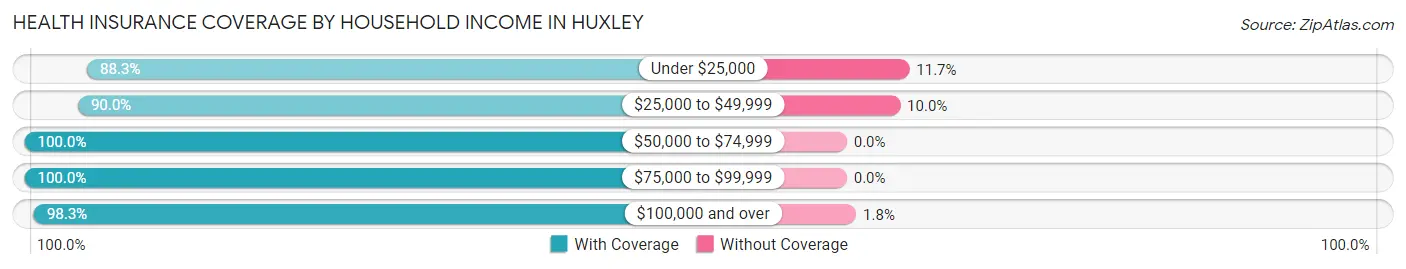
| Household Income | With Coverage | Without Coverage |
| Under $25,000 | 128 (88.3%) | 17 (11.7%) |
| $25,000 to $49,999 | 153 (90.0%) | 17 (10.0%) |
| $50,000 to $74,999 | 600 (100.0%) | 0 (0.0%) |
| $75,000 to $99,999 | 204 (100.0%) | 0 (0.0%) |
| $100,000 and over | 3,145 (98.3%) | 56 (1.8%) |
Public vs Private Health Insurance Coverage by Age in Huxley
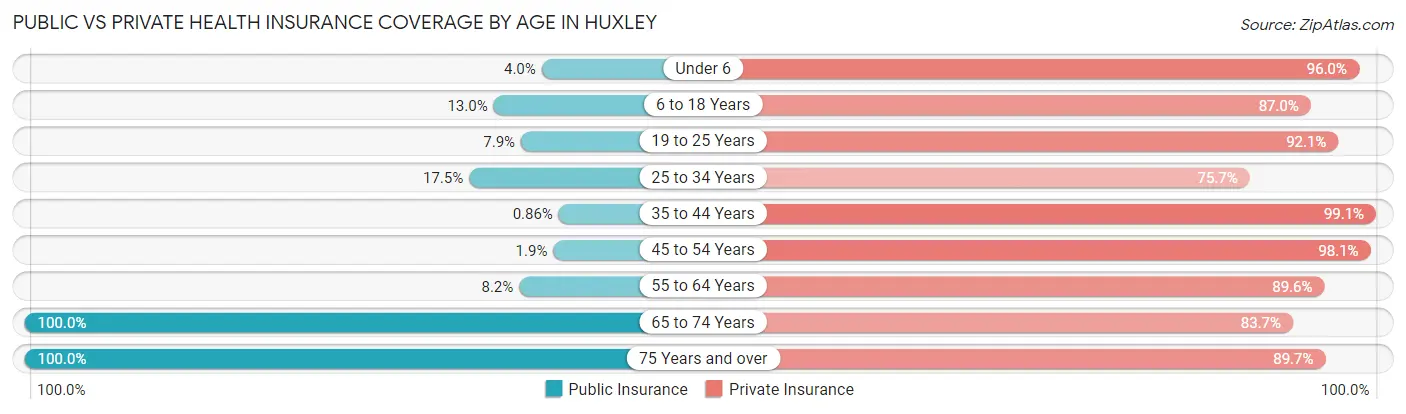
| Age Bracket | Public Insurance | Private Insurance |
| Under 6 | 18 (4.0%) | 429 (96.0%) |
| 6 to 18 Years | 128 (13.0%) | 859 (87.0%) |
| 19 to 25 Years | 14 (7.9%) | 164 (92.1%) |
| 25 to 34 Years | 95 (17.5%) | 411 (75.7%) |
| 35 to 44 Years | 6 (0.9%) | 691 (99.1%) |
| 45 to 54 Years | 11 (1.9%) | 575 (98.1%) |
| 55 to 64 Years | 33 (8.2%) | 360 (89.5%) |
| 65 to 74 Years | 129 (100.0%) | 108 (83.7%) |
| 75 Years and over | 351 (100.0%) | 315 (89.7%) |
| Total | 785 (18.2%) | 3,912 (90.6%) |
Disability Status by Sex by Age in Huxley
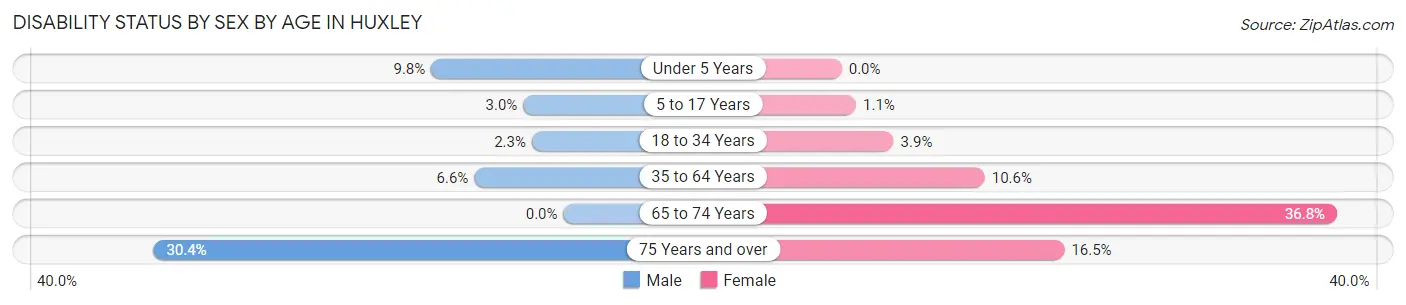
| Age Bracket | Male | Female |
| Under 5 Years | 22 (9.8%) | 0 (0.0%) |
| 5 to 17 Years | 15 (3.0%) | 6 (1.1%) |
| 18 to 34 Years | 9 (2.3%) | 13 (3.8%) |
| 35 to 64 Years | 53 (6.6%) | 94 (10.6%) |
| 65 to 74 Years | 0 (0.0%) | 25 (36.8%) |
| 75 Years and over | 35 (30.4%) | 39 (16.5%) |
Disability Class by Sex by Age in Huxley
Disability Class: Hearing Difficulty
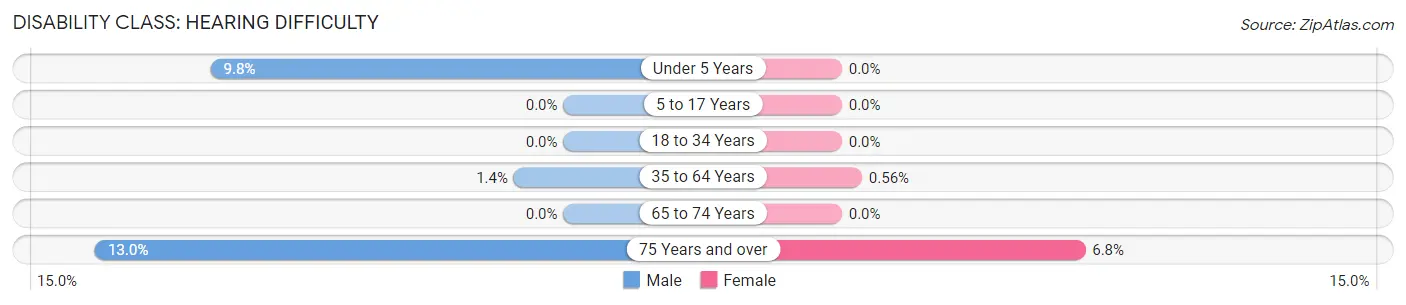
| Age Bracket | Male | Female |
| Under 5 Years | 22 (9.8%) | 0 (0.0%) |
| 5 to 17 Years | 0 (0.0%) | 0 (0.0%) |
| 18 to 34 Years | 0 (0.0%) | 0 (0.0%) |
| 35 to 64 Years | 11 (1.4%) | 5 (0.6%) |
| 65 to 74 Years | 0 (0.0%) | 0 (0.0%) |
| 75 Years and over | 15 (13.0%) | 16 (6.8%) |
Disability Class: Vision Difficulty
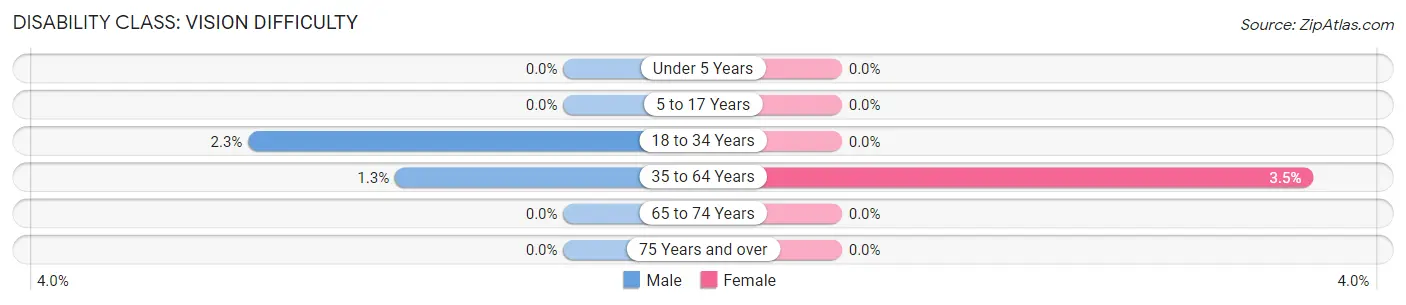
| Age Bracket | Male | Female |
| Under 5 Years | 0 (0.0%) | 0 (0.0%) |
| 5 to 17 Years | 0 (0.0%) | 0 (0.0%) |
| 18 to 34 Years | 9 (2.3%) | 0 (0.0%) |
| 35 to 64 Years | 10 (1.3%) | 31 (3.5%) |
| 65 to 74 Years | 0 (0.0%) | 0 (0.0%) |
| 75 Years and over | 0 (0.0%) | 0 (0.0%) |
Disability Class: Cognitive Difficulty
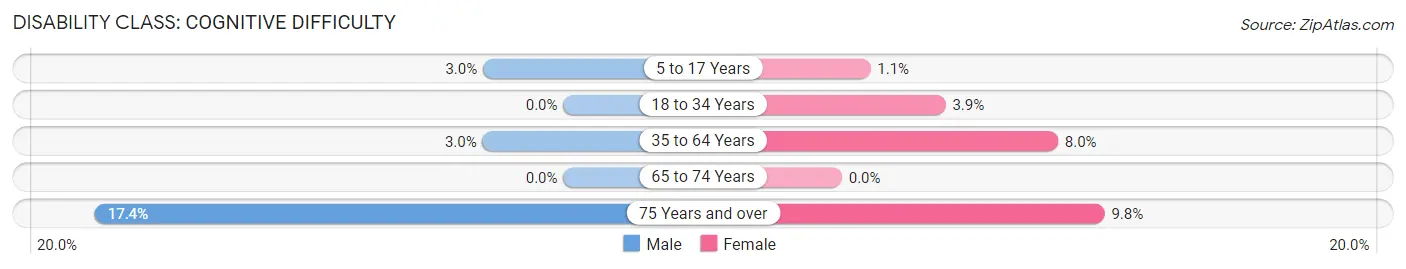
| Age Bracket | Male | Female |
| 5 to 17 Years | 15 (3.0%) | 6 (1.1%) |
| 18 to 34 Years | 0 (0.0%) | 13 (3.8%) |
| 35 to 64 Years | 24 (3.0%) | 71 (8.0%) |
| 65 to 74 Years | 0 (0.0%) | 0 (0.0%) |
| 75 Years and over | 20 (17.4%) | 23 (9.8%) |
Disability Class: Ambulatory Difficulty
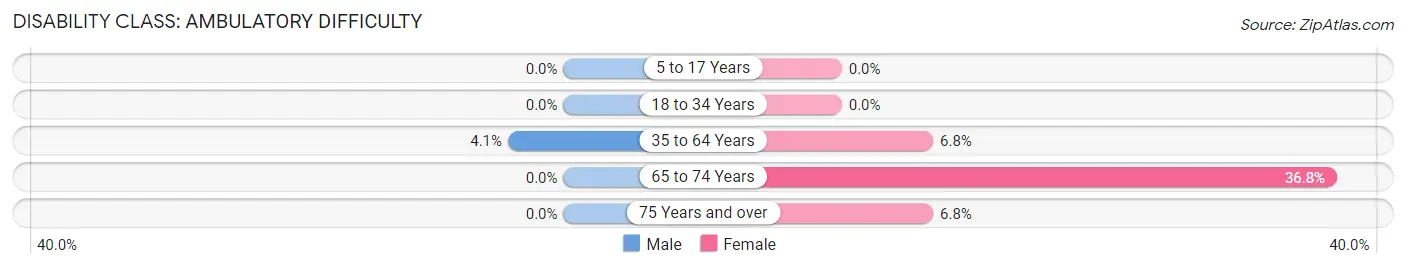
| Age Bracket | Male | Female |
| 5 to 17 Years | 0 (0.0%) | 0 (0.0%) |
| 18 to 34 Years | 0 (0.0%) | 0 (0.0%) |
| 35 to 64 Years | 33 (4.1%) | 60 (6.8%) |
| 65 to 74 Years | 0 (0.0%) | 25 (36.8%) |
| 75 Years and over | 0 (0.0%) | 16 (6.8%) |
Disability Class: Self-Care Difficulty
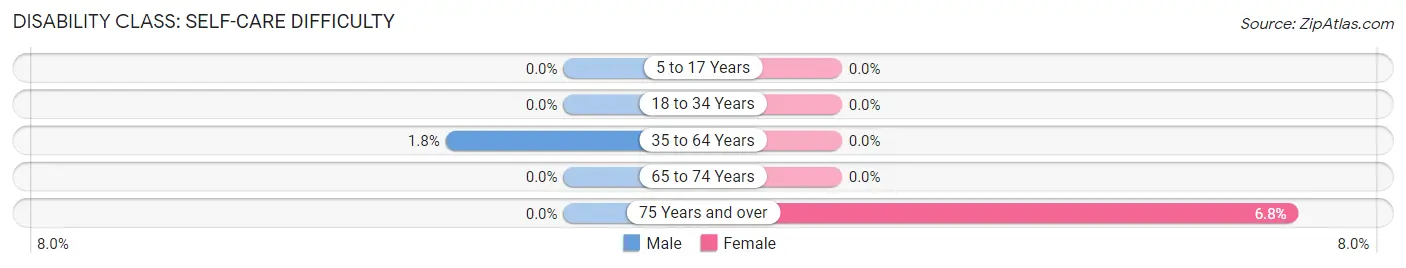
| Age Bracket | Male | Female |
| 5 to 17 Years | 0 (0.0%) | 0 (0.0%) |
| 18 to 34 Years | 0 (0.0%) | 0 (0.0%) |
| 35 to 64 Years | 14 (1.8%) | 0 (0.0%) |
| 65 to 74 Years | 0 (0.0%) | 0 (0.0%) |
| 75 Years and over | 0 (0.0%) | 16 (6.8%) |
Technology Access in Huxley
Computing Device Access in Huxley
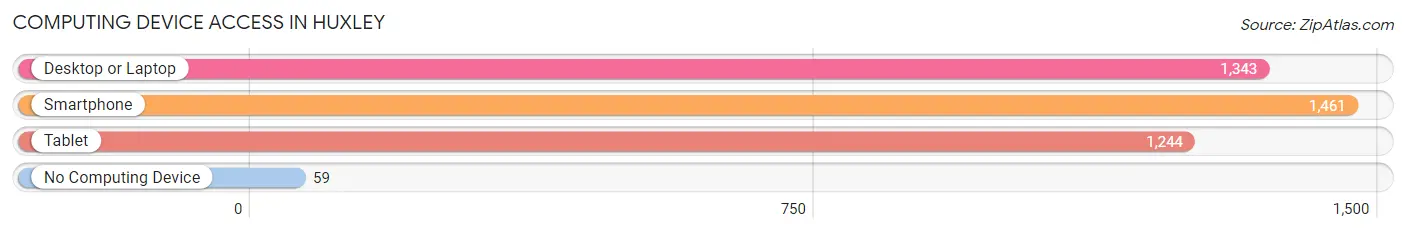
| Device Type | # Households | % Households |
| Desktop or Laptop | 1,343 | 86.9% |
| Smartphone | 1,461 | 94.6% |
| Tablet | 1,244 | 80.5% |
| No Computing Device | 59 | 3.8% |
| Total | 1,545 | 100.0% |
Internet Access in Huxley
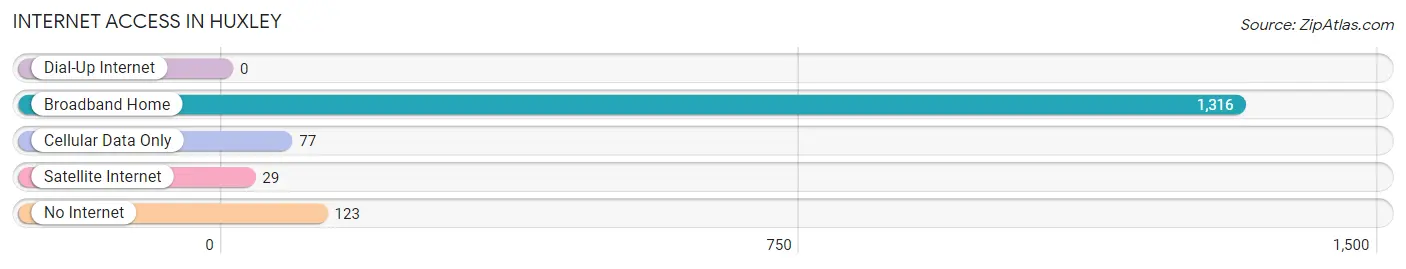
| Internet Type | # Households | % Households |
| Dial-Up Internet | 0 | 0.0% |
| Broadband Home | 1,316 | 85.2% |
| Cellular Data Only | 77 | 5.0% |
| Satellite Internet | 29 | 1.9% |
| No Internet | 123 | 8.0% |
| Total | 1,545 | 100.0% |
Huxley Summary
Huxley, Iowa is a small city located in Story County, Iowa, United States. It is situated along the Des Moines River, approximately 20 miles north of the state capital, Des Moines. The city has a population of 4,468 as of the 2010 census, making it the largest city in Story County.
History
Huxley was founded in 1881 by a group of settlers from the nearby town of Cambridge. The town was named after Thomas Henry Huxley, an English biologist and naturalist. The town was incorporated in 1882 and was the first town in Story County to be incorporated.
The town grew rapidly in the late 19th century, and by 1900, it had a population of 1,092. The town was home to a variety of businesses, including a flour mill, a creamery, a brickyard, and a furniture factory.
In the early 20th century, Huxley experienced a period of growth and prosperity. The town was home to a variety of businesses, including a bank, a hotel, a movie theater, and a variety of retail stores.
Geography
Huxley is located at 41°45'17" North, 93°37'45" West (41.754722, -93.629167). The city is situated along the Des Moines River, approximately 20 miles north of the state capital, Des Moines.
The city has a total area of 4.2 square miles, all of which is land. The city is located in the Central Iowa region, and is part of the Des Moines–West Des Moines Metropolitan Statistical Area.
Economy
Huxley is home to a variety of businesses, including manufacturing, retail, and service industries. The city is home to a variety of manufacturing companies, including a furniture factory, a printing company, and a plastics manufacturer.
The city is also home to a variety of retail stores, including a grocery store, a hardware store, and a variety of specialty shops. The city is also home to a variety of service businesses, including a bank, a hotel, and a variety of restaurants.
Demographics
As of the 2010 census, there were 4,468 people, 1,717 households, and 1,164 families residing in the city. The population density was 1,062.2 people per square mile. The racial makeup of the city was 95.2% White, 0.7% African American, 0.3% Native American, 0.7% Asian, 0.1% Pacific Islander, 1.3% from other races, and 1.7% from two or more races. Hispanic or Latino of any race were 3.2% of the population.
The median income for a household in the city was $50,938, and the median income for a family was $60,938. The per capita income for the city was $23,945. About 4.2% of families and 5.7% of the population were below the poverty line, including 7.2% of those under age 18 and 4.2% of those age 65 or over.
Common Questions
What is Per Capita Income in Huxley?
Per Capita income in Huxley is $48,133.
What is the Median Family Income in Huxley?
Median Family Income in Huxley is $133,933.
What is the Median Household income in Huxley?
Median Household Income in Huxley is $120,868.
What is Income or Wage Gap in Huxley?
Income or Wage Gap in Huxley is 26.3%.
Women in Huxley earn 73.7 cents for every dollar earned by a man.
What is Inequality or Gini Index in Huxley?
Inequality or Gini Index in Huxley is 0.38.
What is the Total Population of Huxley?
Total Population of Huxley is 4,331.
What is the Total Male Population of Huxley?
Total Male Population of Huxley is 2,098.
What is the Total Female Population of Huxley?
Total Female Population of Huxley is 2,233.
What is the Ratio of Males per 100 Females in Huxley?
There are 93.95 Males per 100 Females in Huxley.
What is the Ratio of Females per 100 Males in Huxley?
There are 106.43 Females per 100 Males in Huxley.
What is the Median Population Age in Huxley?
Median Population Age in Huxley is 35.1 Years.
What is the Average Family Size in Huxley
Average Family Size in Huxley is 3.2 People.
What is the Average Household Size in Huxley
Average Household Size in Huxley is 2.8 People.
How Large is the Labor Force in Huxley?
There are 2,320 People in the Labor Forcein in Huxley.
What is the Percentage of People in the Labor Force in Huxley?
76.4% of People are in the Labor Force in Huxley.
What is the Unemployment Rate in Huxley?
Unemployment Rate in Huxley is 1.4%.