Osage, IA Map & Demographics
Osage Map
Osage Overview
$35,179
PER CAPITA INCOME
$86,538
AVG FAMILY INCOME
$56,667
AVG HOUSEHOLD INCOME
23.0%
WAGE / INCOME GAP [ % ]
77.0¢/ $1
WAGE / INCOME GAP [ $ ]
0.42
INEQUALITY / GINI INDEX
3,590
TOTAL POPULATION
1,686
MALE POPULATION
1,904
FEMALE POPULATION
88.55
MALES / 100 FEMALES
112.93
FEMALES / 100 MALES
44.8
MEDIAN AGE
2.6
AVG FAMILY SIZE
2.0
AVG HOUSEHOLD SIZE
1,968
LABOR FORCE [ PEOPLE ]
65.7%
PERCENT IN LABOR FORCE
1.2%
UNEMPLOYMENT RATE
Osage Zip Codes
Osage Area Codes
Income in Osage
Income Overview in Osage
Per Capita Income in Osage is $35,179, while median incomes of families and households are $86,538 and $56,667 respectively.
| Characteristic | Number | Measure |
| Per Capita Income | 3,590 | $35,179 |
| Median Family Income | 982 | $86,538 |
| Mean Family Income | 982 | $97,834 |
| Median Household Income | 1,760 | $56,667 |
| Mean Household Income | 1,760 | $71,524 |
| Income Deficit | 982 | $0 |
| Wage / Income Gap (%) | 3,590 | 23.03% |
| Wage / Income Gap ($) | 3,590 | 76.97¢ per $1 |
| Gini / Inequality Index | 3,590 | 0.42 |
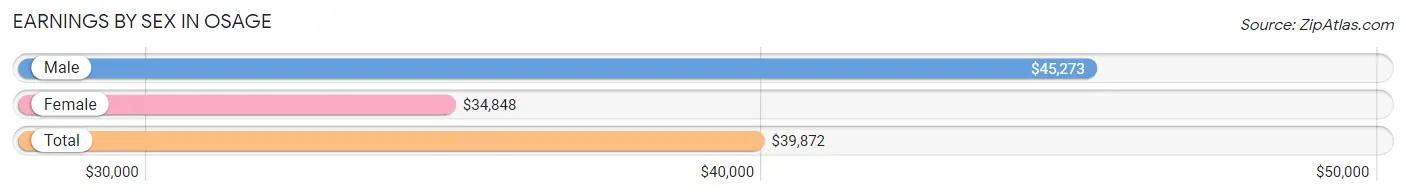
Earnings by Sex in Osage
Average Earnings in Osage are $39,872, $45,273 for men and $34,848 for women, a difference of 23.0%.
| Sex | Number | Average Earnings |
| Male | 1,045 (50.5%) | $45,273 |
| Female | 1,023 (49.5%) | $34,848 |
| Total | 2,068 (100.0%) | $39,872 |
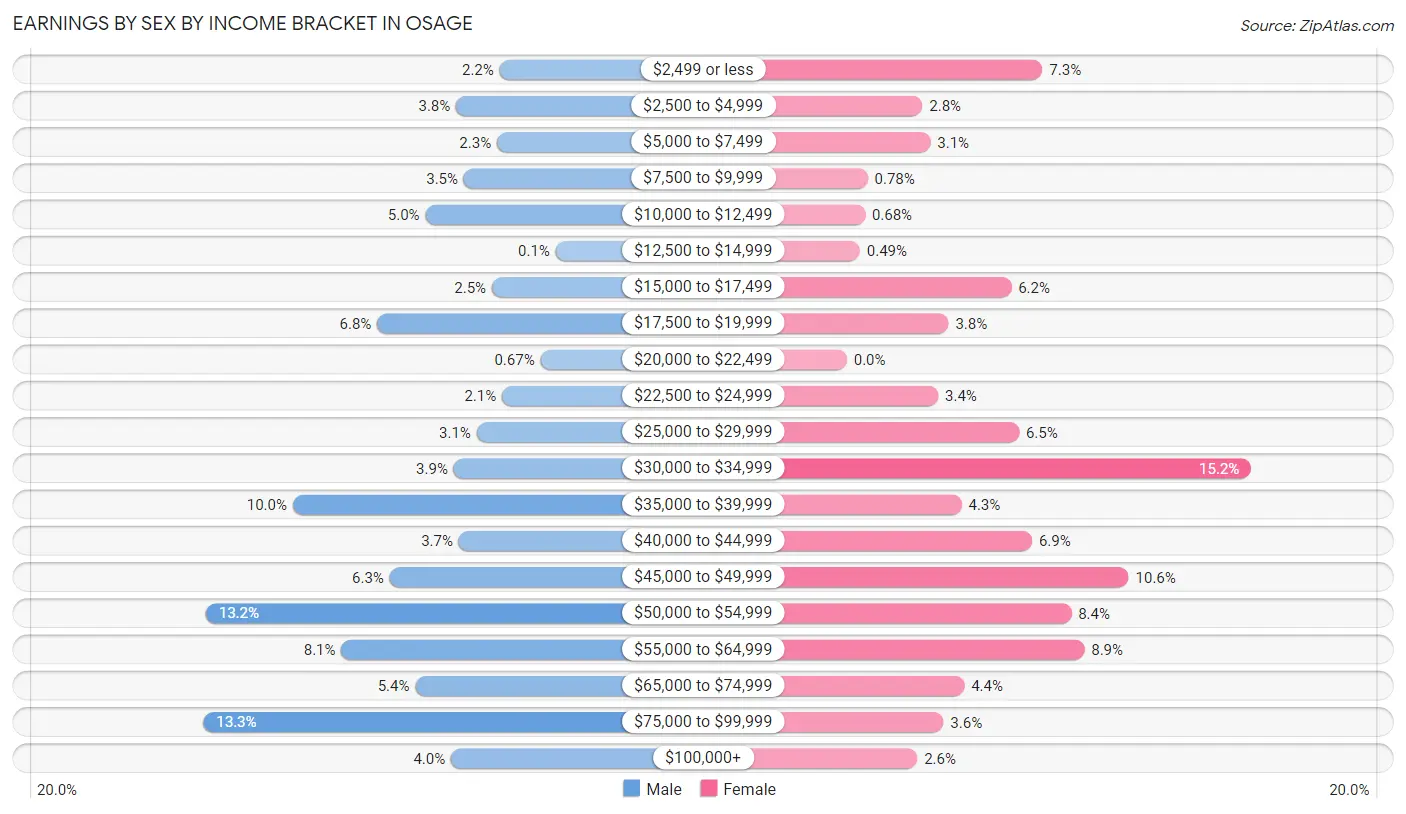
Earnings by Sex by Income Bracket in Osage
The most common earnings brackets in Osage are $75,000 to $99,999 for men (139 | 13.3%) and $30,000 to $34,999 for women (155 | 15.1%).
| Income | Male | Female |
| $2,499 or less | 23 (2.2%) | 75 (7.3%) |
| $2,500 to $4,999 | 40 (3.8%) | 29 (2.8%) |
| $5,000 to $7,499 | 24 (2.3%) | 32 (3.1%) |
| $7,500 to $9,999 | 37 (3.5%) | 8 (0.8%) |
| $10,000 to $12,499 | 52 (5.0%) | 7 (0.7%) |
| $12,500 to $14,999 | 1 (0.1%) | 5 (0.5%) |
| $15,000 to $17,499 | 26 (2.5%) | 63 (6.2%) |
| $17,500 to $19,999 | 71 (6.8%) | 39 (3.8%) |
| $20,000 to $22,499 | 7 (0.7%) | 0 (0.0%) |
| $22,500 to $24,999 | 22 (2.1%) | 35 (3.4%) |
| $25,000 to $29,999 | 32 (3.1%) | 66 (6.5%) |
| $30,000 to $34,999 | 41 (3.9%) | 155 (15.1%) |
| $35,000 to $39,999 | 104 (10.0%) | 44 (4.3%) |
| $40,000 to $44,999 | 39 (3.7%) | 71 (6.9%) |
| $45,000 to $49,999 | 66 (6.3%) | 108 (10.6%) |
| $50,000 to $54,999 | 138 (13.2%) | 86 (8.4%) |
| $55,000 to $64,999 | 85 (8.1%) | 91 (8.9%) |
| $65,000 to $74,999 | 56 (5.4%) | 45 (4.4%) |
| $75,000 to $99,999 | 139 (13.3%) | 37 (3.6%) |
| $100,000+ | 42 (4.0%) | 27 (2.6%) |
| Total | 1,045 (100.0%) | 1,023 (100.0%) |
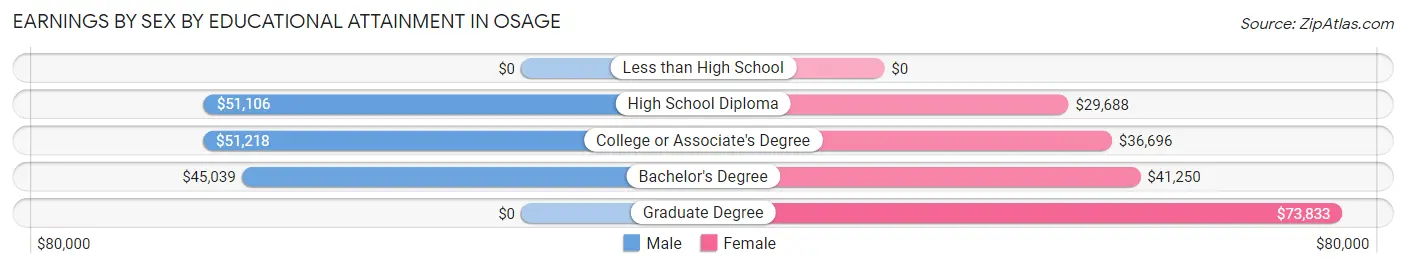
Earnings by Sex by Educational Attainment in Osage
Average earnings in Osage are $49,228 for men and $37,813 for women, a difference of 23.2%. Men with an educational attainment of college or associate's degree enjoy the highest average annual earnings of $51,218, while those with bachelor's degree education earn the least with $45,039. Women with an educational attainment of graduate degree earn the most with the average annual earnings of $73,833, while those with high school diploma education have the smallest earnings of $29,688.
| Educational Attainment | Male Income | Female Income |
| Less than High School | - | - |
| High School Diploma | $51,106 | $29,688 |
| College or Associate's Degree | $51,218 | $36,696 |
| Bachelor's Degree | $45,039 | $41,250 |
| Graduate Degree | - | - |
| Total | $49,228 | $37,813 |
Family Income in Osage
Family Income Brackets in Osage
According to the Osage family income data, there are 287 families falling into the $100,000 to $149,999 income range, which is the most common income bracket and makes up 29.2% of all families.
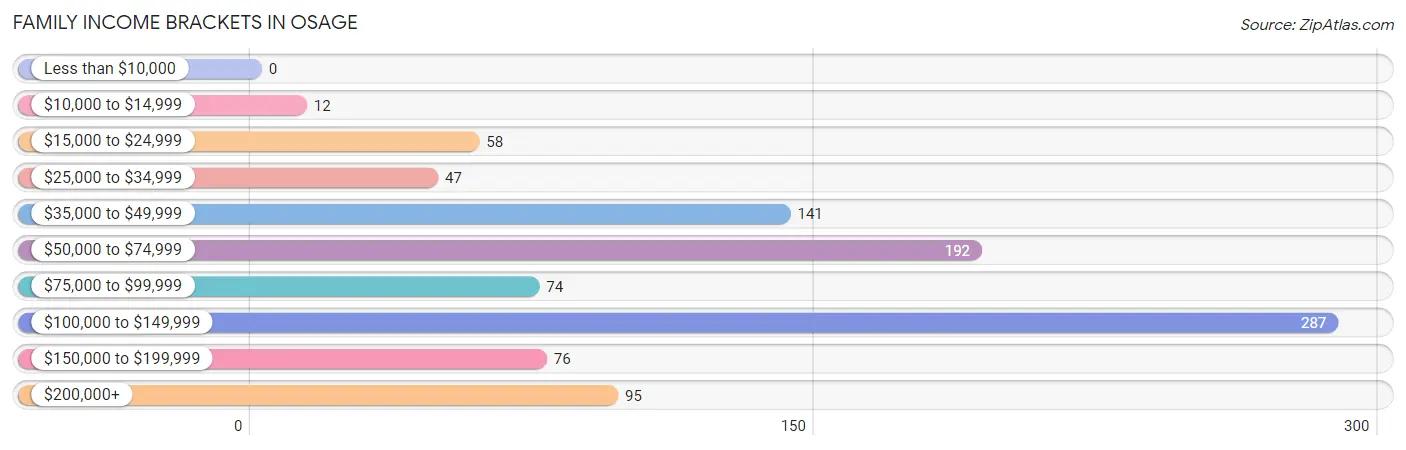
| Income Bracket | # Families | % Families |
| Less than $10,000 | 0 | 0.0% |
| $10,000 to $14,999 | 12 | 1.2% |
| $15,000 to $24,999 | 58 | 5.9% |
| $25,000 to $34,999 | 47 | 4.8% |
| $35,000 to $49,999 | 141 | 14.4% |
| $50,000 to $74,999 | 192 | 19.6% |
| $75,000 to $99,999 | 74 | 7.5% |
| $100,000 to $149,999 | 287 | 29.2% |
| $150,000 to $199,999 | 76 | 7.7% |
| $200,000+ | 95 | 9.7% |
Family Income by Famaliy Size in Osage
4-person families (95 | 9.7%) account for the highest median family income in Osage with $85,179 per family, while 2-person families (647 | 65.9%) have the highest median income of $39,688 per family member.
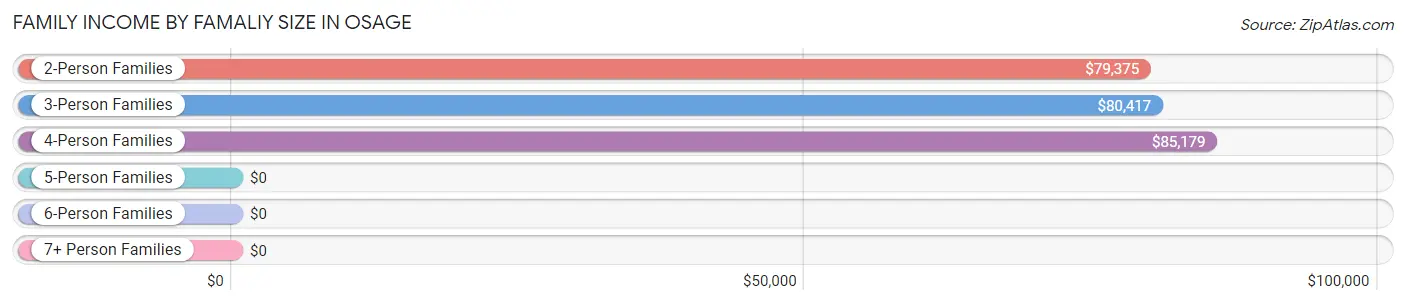
| Income Bracket | # Families | Median Income |
| 2-Person Families | 647 (65.9%) | $79,375 |
| 3-Person Families | 150 (15.3%) | $80,417 |
| 4-Person Families | 95 (9.7%) | $85,179 |
| 5-Person Families | 58 (5.9%) | $0 |
| 6-Person Families | 32 (3.3%) | $0 |
| 7+ Person Families | 0 (0.0%) | $0 |
| Total | 982 (100.0%) | $86,538 |
Family Income by Number of Earners in Osage
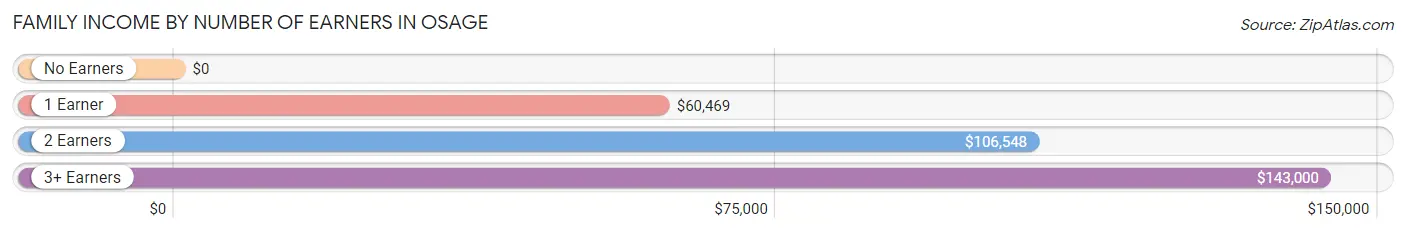
| Number of Earners | # Families | Median Income |
| No Earners | 110 (11.2%) | $0 |
| 1 Earner | 294 (29.9%) | $60,469 |
| 2 Earners | 516 (52.5%) | $106,548 |
| 3+ Earners | 62 (6.3%) | $143,000 |
| Total | 982 (100.0%) | $86,538 |
Household Income in Osage
Household Income Brackets in Osage
With 375 households falling in the category, the $50,000 to $74,999 income range is the most frequent in Osage, accounting for 21.3% of all households. In contrast, only 49 households (2.8%) fall into the less than $10,000 income bracket, making it the least populous group.
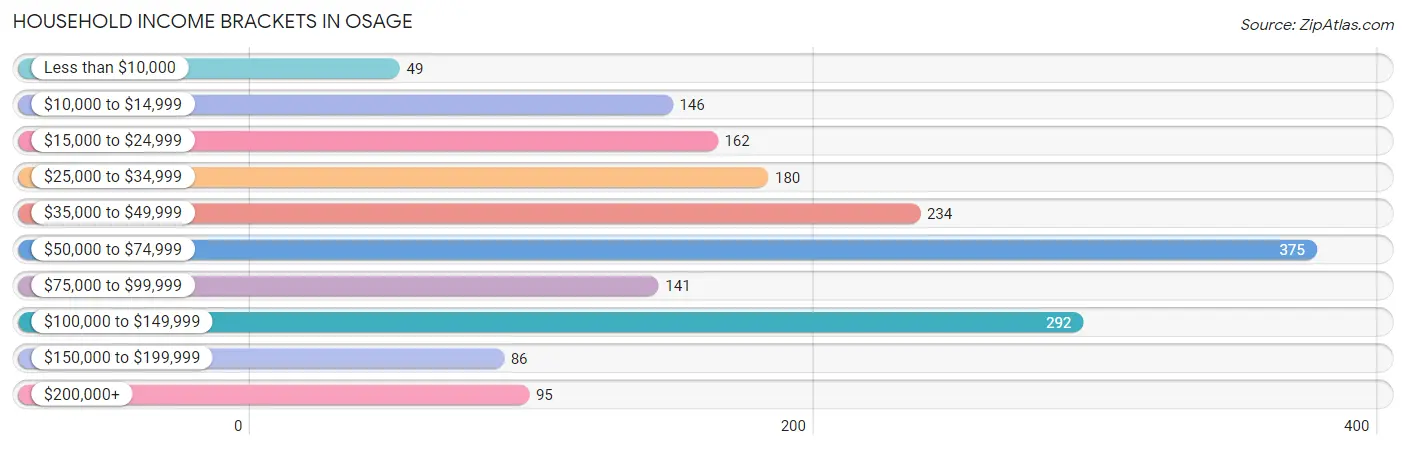
| Income Bracket | # Households | % Households |
| Less than $10,000 | 49 | 2.8% |
| $10,000 to $14,999 | 146 | 8.3% |
| $15,000 to $24,999 | 162 | 9.2% |
| $25,000 to $34,999 | 180 | 10.2% |
| $35,000 to $49,999 | 234 | 13.3% |
| $50,000 to $74,999 | 375 | 21.3% |
| $75,000 to $99,999 | 141 | 8.0% |
| $100,000 to $149,999 | 292 | 16.6% |
| $150,000 to $199,999 | 86 | 4.9% |
| $200,000+ | 95 | 5.4% |
Household Income by Householder Age in Osage
The median household income in Osage is $56,667, with the highest median household income of $66,146 found in the 45 to 64 years age bracket for the primary householder. A total of 563 households (32.0%) fall into this category. Meanwhile, the 15 to 24 years age bracket for the primary householder has the lowest median household income of $0, with 73 households (4.2%) in this group.
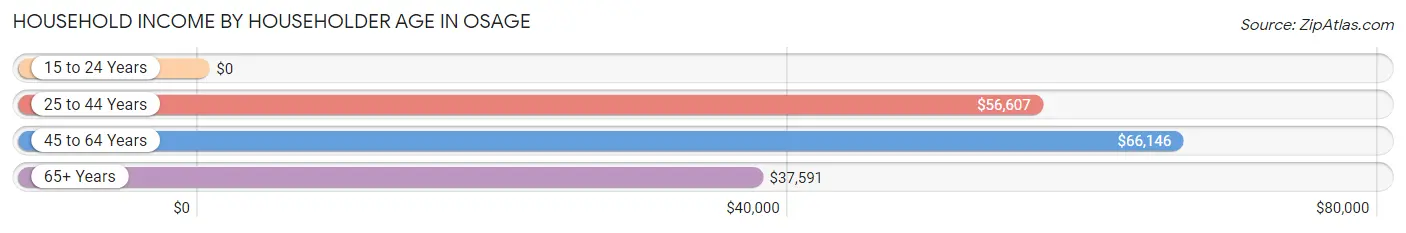
| Income Bracket | # Households | Median Income |
| 15 to 24 Years | 73 (4.2%) | $0 |
| 25 to 44 Years | 575 (32.7%) | $56,607 |
| 45 to 64 Years | 563 (32.0%) | $66,146 |
| 65+ Years | 549 (31.2%) | $37,591 |
| Total | 1,760 (100.0%) | $56,667 |
Poverty in Osage
Income Below Poverty by Sex and Age in Osage
With 6.8% poverty level for males and 8.8% for females among the residents of Osage, 18 to 24 year old males and 35 to 44 year old females are the most vulnerable to poverty, with 25 males (18.5%) and 48 females (23.3%) in their respective age groups living below the poverty level.
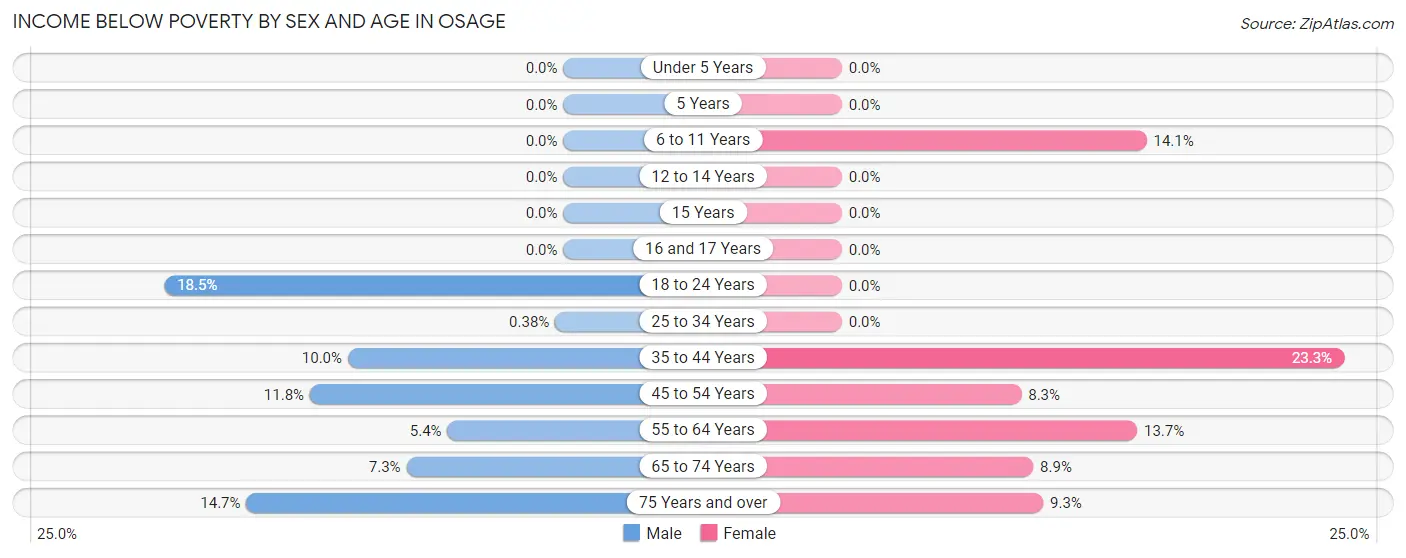
| Age Bracket | Male | Female |
| Under 5 Years | 0 (0.0%) | 0 (0.0%) |
| 5 Years | 0 (0.0%) | 0 (0.0%) |
| 6 to 11 Years | 0 (0.0%) | 14 (14.1%) |
| 12 to 14 Years | 0 (0.0%) | 0 (0.0%) |
| 15 Years | 0 (0.0%) | 0 (0.0%) |
| 16 and 17 Years | 0 (0.0%) | 0 (0.0%) |
| 18 to 24 Years | 25 (18.5%) | 0 (0.0%) |
| 25 to 34 Years | 1 (0.4%) | 0 (0.0%) |
| 35 to 44 Years | 19 (10.0%) | 48 (23.3%) |
| 45 to 54 Years | 20 (11.8%) | 19 (8.3%) |
| 55 to 64 Years | 14 (5.4%) | 37 (13.7%) |
| 65 to 74 Years | 11 (7.3%) | 19 (8.9%) |
| 75 Years and over | 20 (14.7%) | 24 (9.3%) |
| Total | 110 (6.8%) | 161 (8.8%) |
Income Above Poverty by Sex and Age in Osage
According to the poverty statistics in Osage, males aged under 5 years and females aged under 5 years are the age groups that are most secure financially, with 100.0% of males and 100.0% of females in these age groups living above the poverty line.
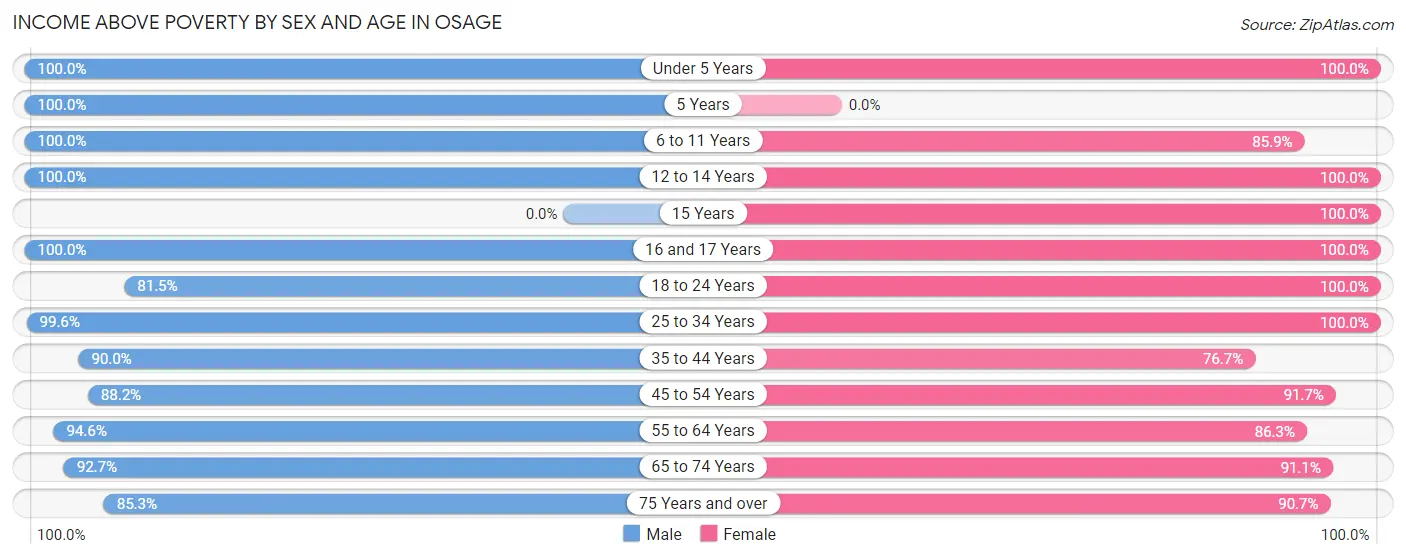
| Age Bracket | Male | Female |
| Under 5 Years | 96 (100.0%) | 83 (100.0%) |
| 5 Years | 26 (100.0%) | 0 (0.0%) |
| 6 to 11 Years | 118 (100.0%) | 85 (85.9%) |
| 12 to 14 Years | 68 (100.0%) | 55 (100.0%) |
| 15 Years | 0 (0.0%) | 34 (100.0%) |
| 16 and 17 Years | 18 (100.0%) | 36 (100.0%) |
| 18 to 24 Years | 110 (81.5%) | 140 (100.0%) |
| 25 to 34 Years | 260 (99.6%) | 207 (100.0%) |
| 35 to 44 Years | 171 (90.0%) | 158 (76.7%) |
| 45 to 54 Years | 150 (88.2%) | 209 (91.7%) |
| 55 to 64 Years | 246 (94.6%) | 233 (86.3%) |
| 65 to 74 Years | 140 (92.7%) | 195 (91.1%) |
| 75 Years and over | 116 (85.3%) | 233 (90.7%) |
| Total | 1,519 (93.2%) | 1,668 (91.2%) |
Income Below Poverty Among Married-Couple Families in Osage
The poverty statistics for married-couple families in Osage show that 3.7% or 29 of the total 778 families live below the poverty line. Families with no children have the highest poverty rate of 5.1%, comprising of 29 families. On the other hand, families with 1 or 2 children have the lowest poverty rate of 0.0%, which includes 0 families.
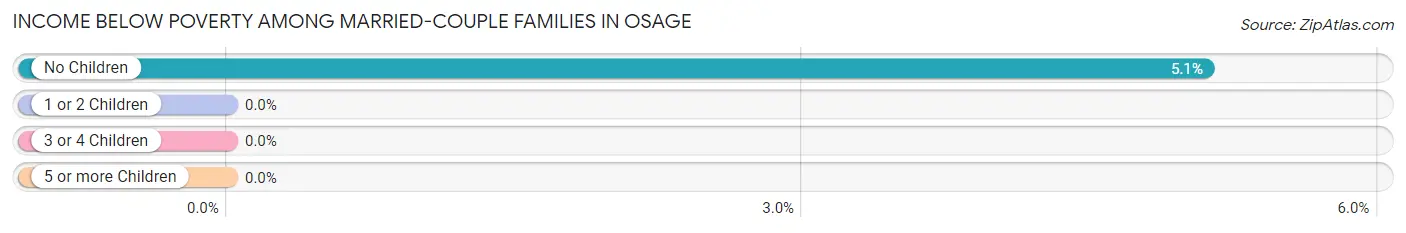
| Children | Above Poverty | Below Poverty |
| No Children | 540 (94.9%) | 29 (5.1%) |
| 1 or 2 Children | 119 (100.0%) | 0 (0.0%) |
| 3 or 4 Children | 90 (100.0%) | 0 (0.0%) |
| 5 or more Children | 0 (0.0%) | 0 (0.0%) |
| Total | 749 (96.3%) | 29 (3.7%) |
Income Below Poverty Among Single-Parent Households in Osage
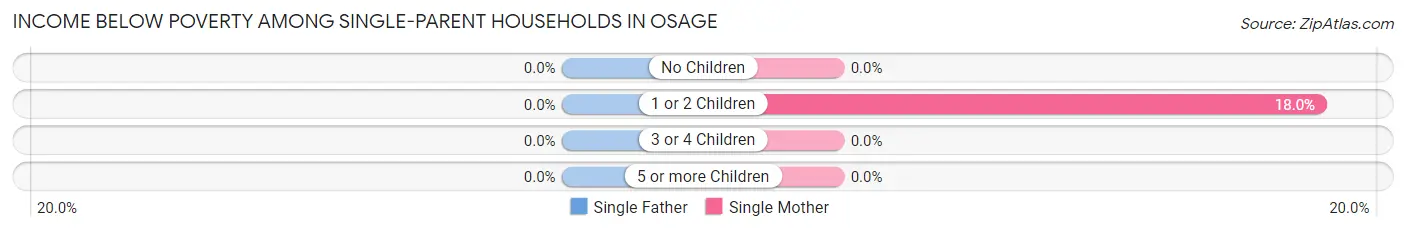
| Children | Single Father | Single Mother |
| No Children | 0 (0.0%) | 0 (0.0%) |
| 1 or 2 Children | 0 (0.0%) | 18 (18.0%) |
| 3 or 4 Children | 0 (0.0%) | 0 (0.0%) |
| 5 or more Children | 0 (0.0%) | 0 (0.0%) |
| Total | 0 (0.0%) | 18 (8.8%) |
Income Below Poverty Among Married-Couple vs Single-Parent Households in Osage
The poverty data for Osage shows that 29 of the married-couple family households (3.7%) and 18 of the single-parent households (8.8%) are living below the poverty level. Within the married-couple family households, those with no children have the highest poverty rate, with 29 households (5.1%) falling below the poverty line. Among the single-parent households, those with 1 or 2 children have the highest poverty rate, with 18 household (18.0%) living below poverty.
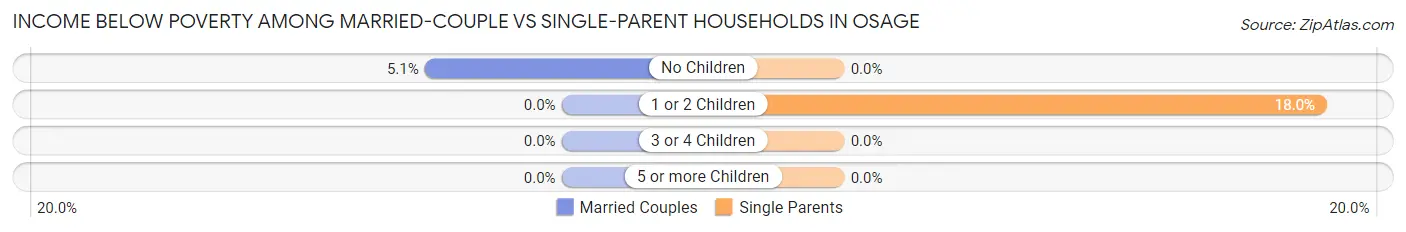
| Children | Married-Couple Families | Single-Parent Households |
| No Children | 29 (5.1%) | 0 (0.0%) |
| 1 or 2 Children | 0 (0.0%) | 18 (18.0%) |
| 3 or 4 Children | 0 (0.0%) | 0 (0.0%) |
| 5 or more Children | 0 (0.0%) | 0 (0.0%) |
| Total | 29 (3.7%) | 18 (8.8%) |
Race in Osage
The most populous races in Osage are White / Caucasian (3,379 | 94.1%), Hispanic or Latino (77 | 2.1%), and Asian (76 | 2.1%).
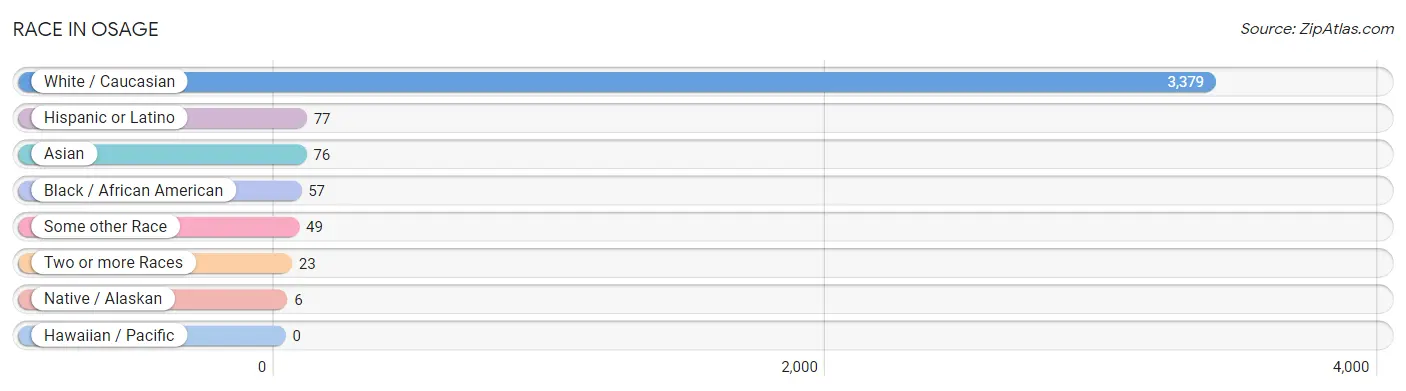
| Race | # Population | % Population |
| Asian | 76 | 2.1% |
| Black / African American | 57 | 1.6% |
| Hawaiian / Pacific | 0 | 0.0% |
| Hispanic or Latino | 77 | 2.1% |
| Native / Alaskan | 6 | 0.2% |
| White / Caucasian | 3,379 | 94.1% |
| Two or more Races | 23 | 0.6% |
| Some other Race | 49 | 1.4% |
| Total | 3,590 | 100.0% |
Ancestry in Osage
The most populous ancestries reported in Osage are German (1,392 | 38.8%), Norwegian (430 | 12.0%), Irish (278 | 7.7%), English (259 | 7.2%), and American (87 | 2.4%), together accounting for 68.1% of all Osage residents.
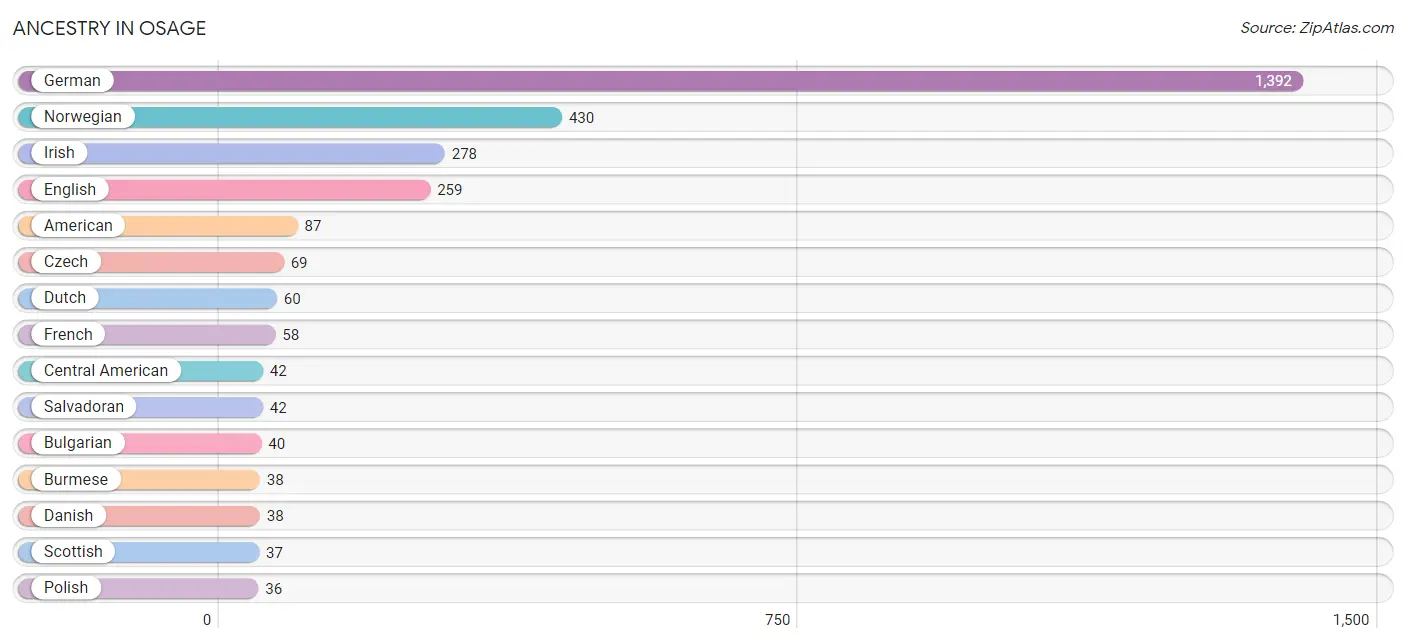
| Ancestry | # Population | % Population |
| African | 7 | 0.2% |
| American | 87 | 2.4% |
| Arab | 4 | 0.1% |
| Bhutanese | 5 | 0.1% |
| Bulgarian | 40 | 1.1% |
| Burmese | 38 | 1.1% |
| Central American | 42 | 1.2% |
| Crow | 3 | 0.1% |
| Czech | 69 | 1.9% |
| Czechoslovakian | 17 | 0.5% |
| Danish | 38 | 1.1% |
| Dutch | 60 | 1.7% |
| English | 259 | 7.2% |
| European | 20 | 0.6% |
| French | 58 | 1.6% |
| German | 1,392 | 38.8% |
| Irish | 278 | 7.7% |
| Italian | 30 | 0.8% |
| Korean | 31 | 0.9% |
| Lithuanian | 6 | 0.2% |
| Mexican | 28 | 0.8% |
| Norwegian | 430 | 12.0% |
| Pakistani | 2 | 0.1% |
| Polish | 36 | 1.0% |
| Puerto Rican | 7 | 0.2% |
| Salvadoran | 42 | 1.2% |
| Scandinavian | 9 | 0.3% |
| Scottish | 37 | 1.0% |
| Sioux | 6 | 0.2% |
| Subsaharan African | 7 | 0.2% |
| Swedish | 16 | 0.4% |
| Swiss | 4 | 0.1% |
| Syrian | 4 | 0.1% | View All 33 Rows |
Immigrants in Osage
The most numerous immigrant groups reported in Osage came from Asia (119 | 3.3%), Eastern Asia (86 | 2.4%), Korea (81 | 2.3%), Central America (54 | 1.5%), and Latin America (54 | 1.5%), together accounting for 11.0% of all Osage residents.
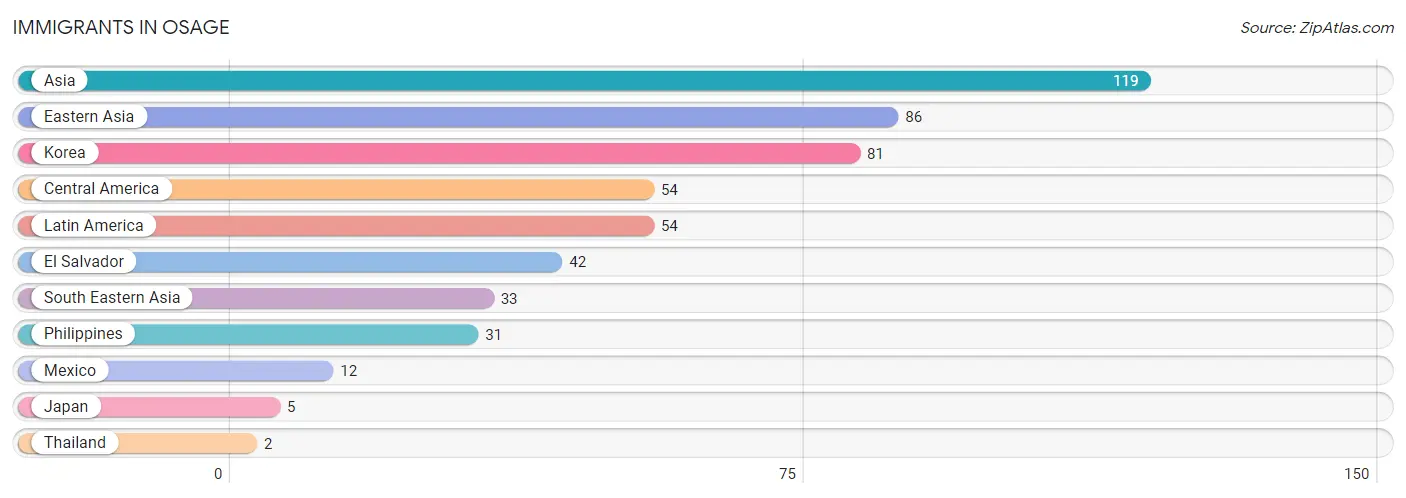
| Immigration Origin | # Population | % Population |
| Asia | 119 | 3.3% |
| Central America | 54 | 1.5% |
| Eastern Asia | 86 | 2.4% |
| El Salvador | 42 | 1.2% |
| Japan | 5 | 0.1% |
| Korea | 81 | 2.3% |
| Latin America | 54 | 1.5% |
| Mexico | 12 | 0.3% |
| Philippines | 31 | 0.9% |
| South Eastern Asia | 33 | 0.9% |
| Thailand | 2 | 0.1% | View All 11 Rows |
Sex and Age in Osage
Sex and Age in Osage
The most populous age groups in Osage are 60 to 64 Years (224 | 13.3%) for men and 40 to 44 Years (175 | 9.2%) for women.
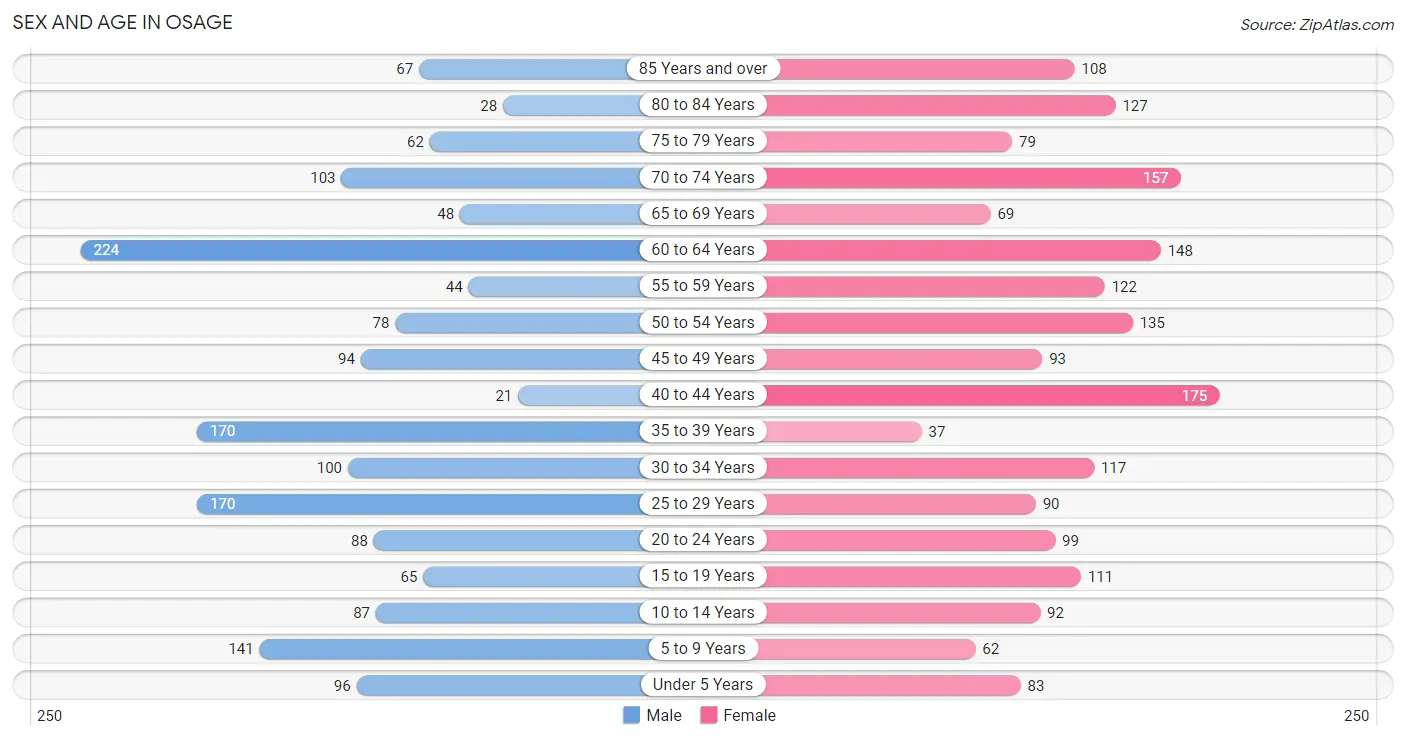
| Age Bracket | Male | Female |
| Under 5 Years | 96 (5.7%) | 83 (4.4%) |
| 5 to 9 Years | 141 (8.4%) | 62 (3.3%) |
| 10 to 14 Years | 87 (5.2%) | 92 (4.8%) |
| 15 to 19 Years | 65 (3.9%) | 111 (5.8%) |
| 20 to 24 Years | 88 (5.2%) | 99 (5.2%) |
| 25 to 29 Years | 170 (10.1%) | 90 (4.7%) |
| 30 to 34 Years | 100 (5.9%) | 117 (6.1%) |
| 35 to 39 Years | 170 (10.1%) | 37 (1.9%) |
| 40 to 44 Years | 21 (1.3%) | 175 (9.2%) |
| 45 to 49 Years | 94 (5.6%) | 93 (4.9%) |
| 50 to 54 Years | 78 (4.6%) | 135 (7.1%) |
| 55 to 59 Years | 44 (2.6%) | 122 (6.4%) |
| 60 to 64 Years | 224 (13.3%) | 148 (7.8%) |
| 65 to 69 Years | 48 (2.9%) | 69 (3.6%) |
| 70 to 74 Years | 103 (6.1%) | 157 (8.3%) |
| 75 to 79 Years | 62 (3.7%) | 79 (4.2%) |
| 80 to 84 Years | 28 (1.7%) | 127 (6.7%) |
| 85 Years and over | 67 (4.0%) | 108 (5.7%) |
| Total | 1,686 (100.0%) | 1,904 (100.0%) |
Families and Households in Osage
Median Family Size in Osage
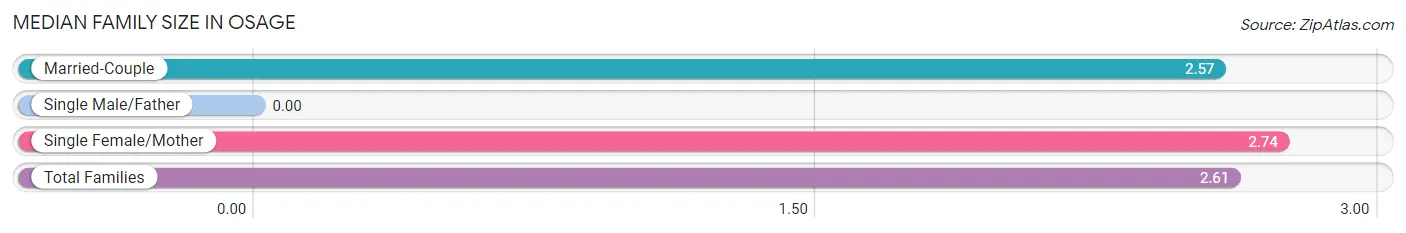
| Family Type | # Families | Family Size |
| Married-Couple | 778 (79.2%) | 2.57 |
| Single Male/Father | 0 (0.0%) | - |
| Single Female/Mother | 204 (20.8%) | 2.74 |
| Total Families | 982 (100.0%) | 2.61 |
Median Household Size in Osage
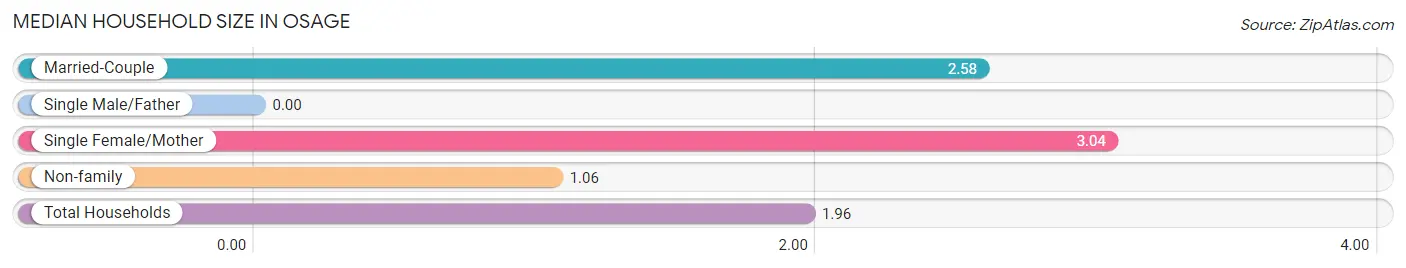
| Household Type | # Households | Household Size |
| Married-Couple | 778 (44.2%) | 2.58 |
| Single Male/Father | 0 (0.0%) | - |
| Single Female/Mother | 204 (11.6%) | 3.04 |
| Non-family | 778 (44.2%) | 1.06 |
| Total Households | 1,760 (100.0%) | 1.96 |
Household Size by Marriage Status in Osage
Out of a total of 1,760 households in Osage, 982 (55.8%) are family households, while 778 (44.2%) are nonfamily households. The most numerous type of family households are 2-person households, comprising 607, and the most common type of nonfamily households are 1-person households, comprising 731.
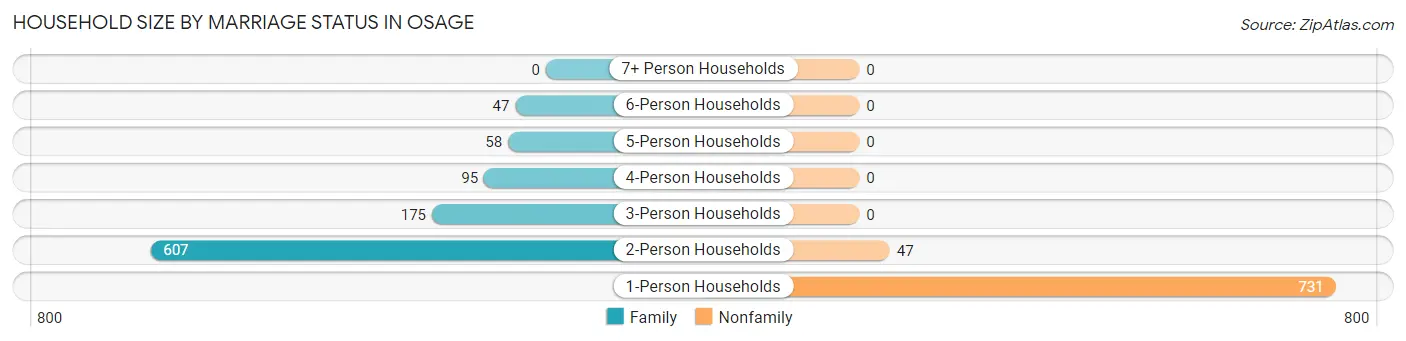
| Household Size | Family Households | Nonfamily Households |
| 1-Person Households | - | 731 (41.5%) |
| 2-Person Households | 607 (34.5%) | 47 (2.7%) |
| 3-Person Households | 175 (9.9%) | 0 (0.0%) |
| 4-Person Households | 95 (5.4%) | 0 (0.0%) |
| 5-Person Households | 58 (3.3%) | 0 (0.0%) |
| 6-Person Households | 47 (2.7%) | 0 (0.0%) |
| 7+ Person Households | 0 (0.0%) | 0 (0.0%) |
| Total | 982 (55.8%) | 778 (44.2%) |
Female Fertility in Osage
Fertility by Age in Osage
Average fertility rate in Osage is 103.0 births per 1,000 women. Women in the age bracket of 20 to 34 years have the highest fertility rate with 245.0 births per 1,000 women. Women in the age bracket of 20 to 34 years acount for 100.0% of all women with births.
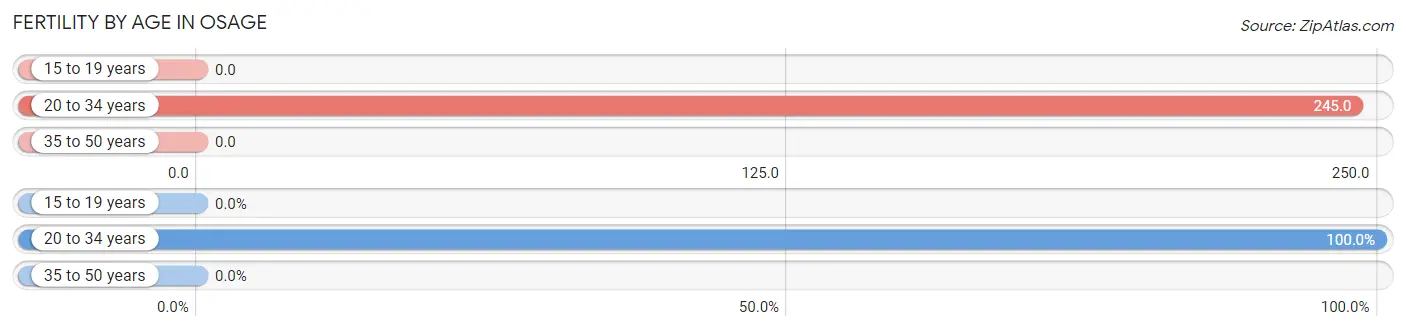
| Age Bracket | Women with Births | Births / 1,000 Women |
| 15 to 19 years | 0 (0.0%) | 0.0 |
| 20 to 34 years | 75 (100.0%) | 245.0 |
| 35 to 50 years | 0 (0.0%) | 0.0 |
| Total | 75 (100.0%) | 103.0 |
Fertility by Age by Marriage Status in Osage
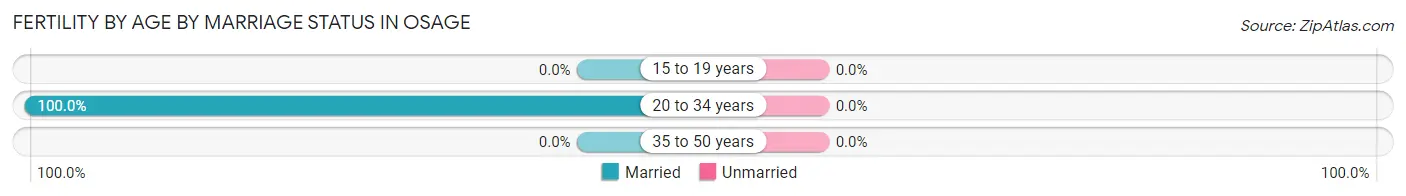
| Age Bracket | Married | Unmarried |
| 15 to 19 years | 0 (0.0%) | 0 (0.0%) |
| 20 to 34 years | 75 (100.0%) | 0 (0.0%) |
| 35 to 50 years | 0 (0.0%) | 0 (0.0%) |
| Total | 75 (100.0%) | 0 (0.0%) |
Fertility by Education in Osage
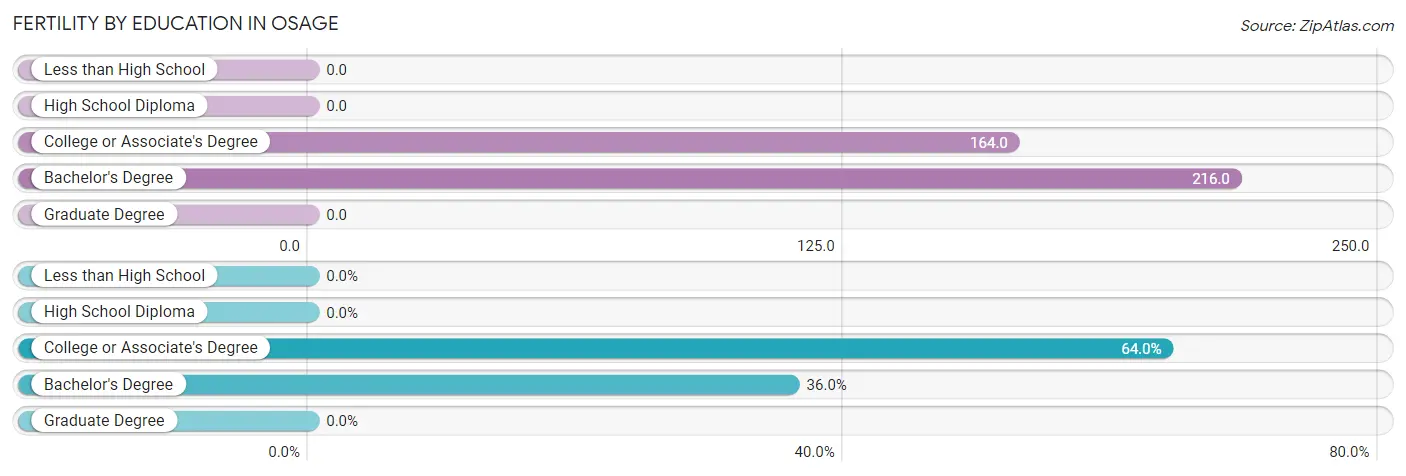
| Educational Attainment | Women with Births | Births / 1,000 Women |
| Less than High School | 0 (0.0%) | 0.0 |
| High School Diploma | 0 (0.0%) | 0.0 |
| College or Associate's Degree | 48 (64.0%) | 164.0 |
| Bachelor's Degree | 27 (36.0%) | 216.0 |
| Graduate Degree | 0 (0.0%) | 0.0 |
| Total | 75 (100.0%) | 103.0 |
Fertility by Education by Marriage Status in Osage
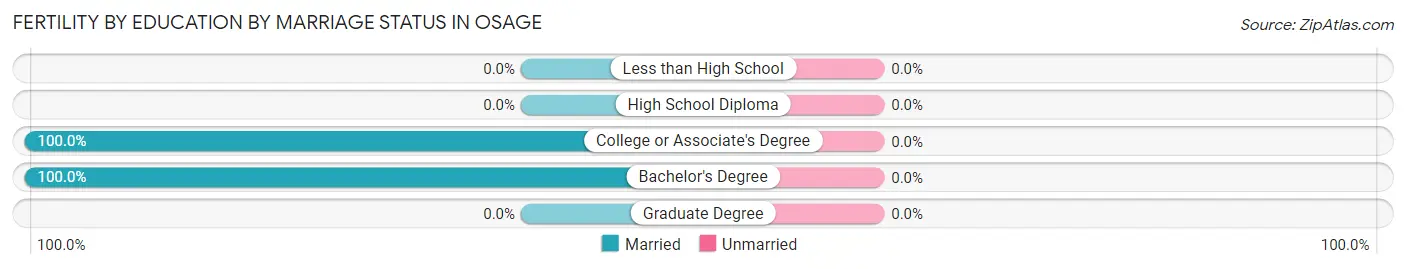
| Educational Attainment | Married | Unmarried |
| Less than High School | 0 (0.0%) | 0 (0.0%) |
| High School Diploma | 0 (0.0%) | 0 (0.0%) |
| College or Associate's Degree | 48 (100.0%) | 0 (0.0%) |
| Bachelor's Degree | 27 (100.0%) | 0 (0.0%) |
| Graduate Degree | 0 (0.0%) | 0 (0.0%) |
| Total | 75 (100.0%) | 0 (0.0%) |
Employment Characteristics in Osage
Employment by Class of Employer in Osage
Among the 1,917 employed individuals in Osage, private company employees (1,264 | 65.9%), not-for-profit organizations (246 | 12.8%), and local government employees (192 | 10.0%) make up the most common classes of employment.
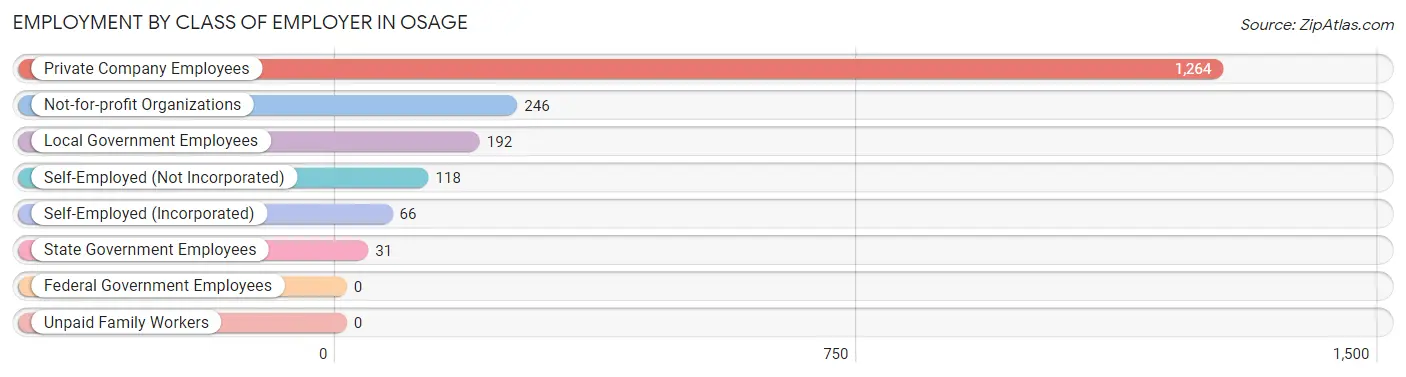
| Employer Class | # Employees | % Employees |
| Private Company Employees | 1,264 | 65.9% |
| Self-Employed (Incorporated) | 66 | 3.4% |
| Self-Employed (Not Incorporated) | 118 | 6.2% |
| Not-for-profit Organizations | 246 | 12.8% |
| Local Government Employees | 192 | 10.0% |
| State Government Employees | 31 | 1.6% |
| Federal Government Employees | 0 | 0.0% |
| Unpaid Family Workers | 0 | 0.0% |
| Total | 1,917 | 100.0% |
Employment Status by Age in Osage
According to the labor force statistics for Osage, out of the total population over 16 years of age (2,995), 65.7% or 1,968 individuals are in the labor force, with 1.2% or 24 of them unemployed. The age group with the highest labor force participation rate is 45 to 54 years, with 98.5% or 394 individuals in the labor force. Within the labor force, the 16 to 19 years age range has the highest percentage of unemployed individuals, with 12.9% or 8 of them being unemployed.
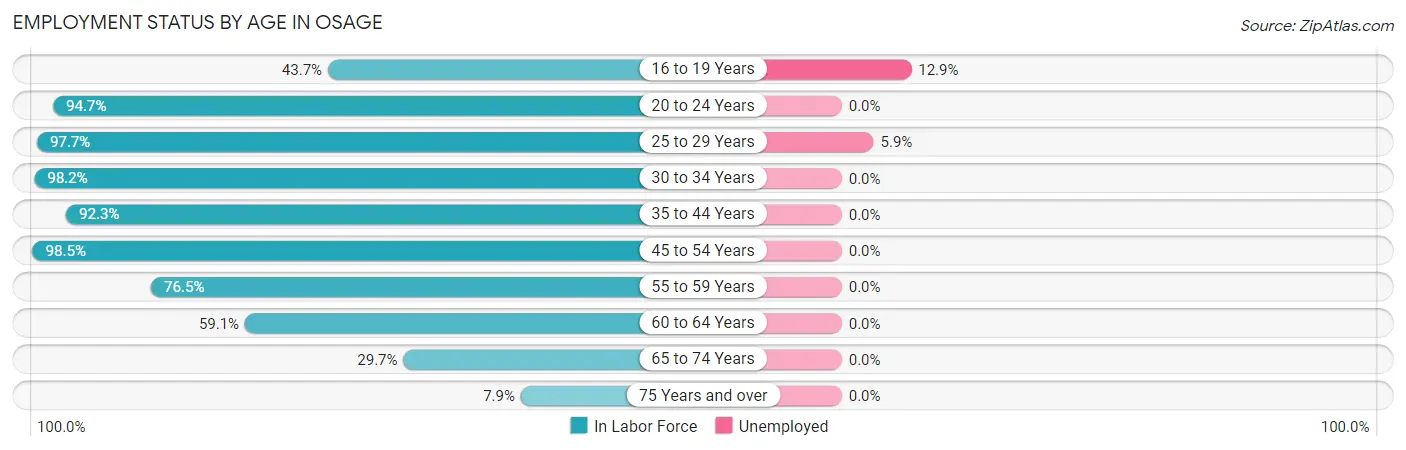
| Age Bracket | In Labor Force | Unemployed |
| 16 to 19 Years | 62 (43.7%) | 8 (12.9%) |
| 20 to 24 Years | 177 (94.7%) | 0 (0.0%) |
| 25 to 29 Years | 254 (97.7%) | 15 (5.9%) |
| 30 to 34 Years | 213 (98.2%) | 0 (0.0%) |
| 35 to 44 Years | 372 (92.3%) | 0 (0.0%) |
| 45 to 54 Years | 394 (98.5%) | 0 (0.0%) |
| 55 to 59 Years | 127 (76.5%) | 0 (0.0%) |
| 60 to 64 Years | 220 (59.1%) | 0 (0.0%) |
| 65 to 74 Years | 112 (29.7%) | 0 (0.0%) |
| 75 Years and over | 37 (7.9%) | 0 (0.0%) |
| Total | 1,968 (65.7%) | 24 (1.2%) |
Employment Status by Educational Attainment in Osage
According to labor force statistics for Osage, 86.9% of individuals (1,580) out of the total population between 25 and 64 years of age (1,818) are in the labor force, with 0.9% or 14 of them being unemployed. The group with the highest labor force participation rate are those with the educational attainment of bachelor's degree or higher, with 94.8% or 420 individuals in the labor force. Within the labor force, individuals with less than high school education have the highest percentage of unemployment, with 19.0% or 15 of them being unemployed.
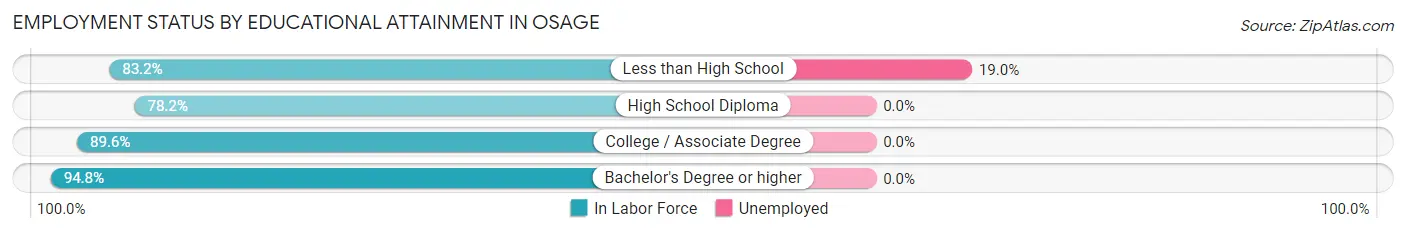
| Educational Attainment | In Labor Force | Unemployed |
| Less than High School | 79 (83.2%) | 18 (19.0%) |
| High School Diploma | 453 (78.2%) | 0 (0.0%) |
| College / Associate Degree | 628 (89.6%) | 0 (0.0%) |
| Bachelor's Degree or higher | 420 (94.8%) | 0 (0.0%) |
| Total | 1,580 (86.9%) | 16 (0.9%) |
Employment Occupations by Sex in Osage
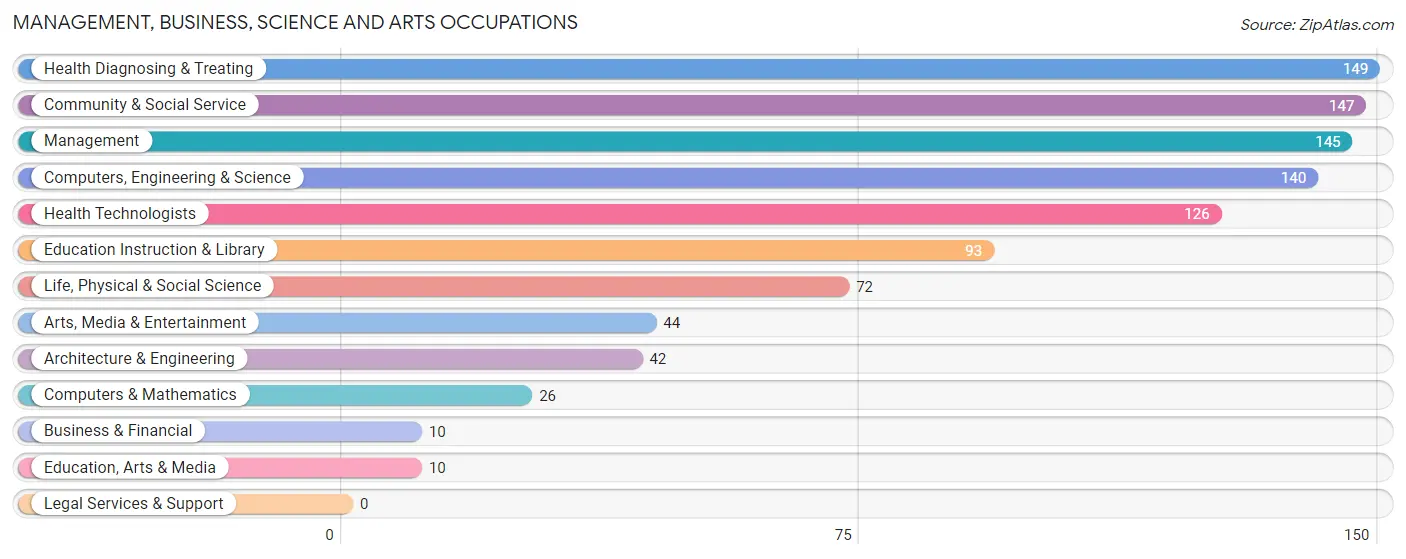
Management, Business, Science and Arts Occupations
The most common Management, Business, Science and Arts occupations in Osage are Health Diagnosing & Treating (149 | 7.7%), Community & Social Service (147 | 7.6%), Management (145 | 7.5%), Computers, Engineering & Science (140 | 7.2%), and Health Technologists (126 | 6.5%).
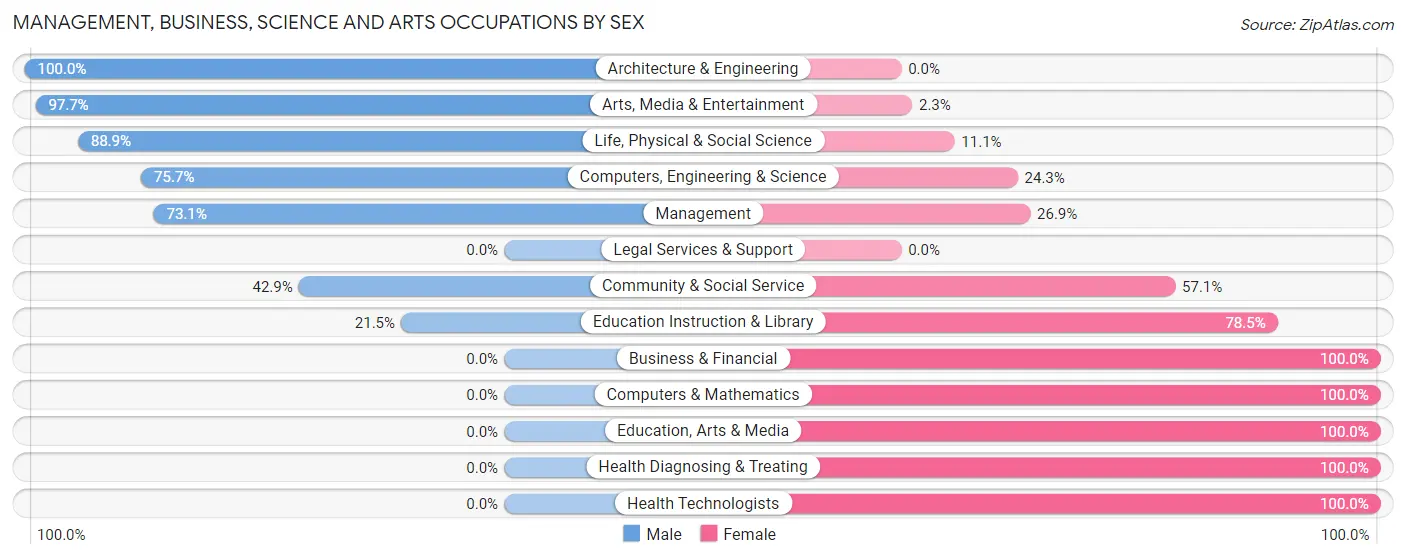
Management, Business, Science and Arts Occupations by Sex
Within the Management, Business, Science and Arts occupations in Osage, the most male-oriented occupations are Architecture & Engineering (100.0%), Arts, Media & Entertainment (97.7%), and Life, Physical & Social Science (88.9%), while the most female-oriented occupations are Business & Financial (100.0%), Computers & Mathematics (100.0%), and Education, Arts & Media (100.0%).
| Occupation | Male | Female |
| Management | 106 (73.1%) | 39 (26.9%) |
| Business & Financial | 0 (0.0%) | 10 (100.0%) |
| Computers, Engineering & Science | 106 (75.7%) | 34 (24.3%) |
| Computers & Mathematics | 0 (0.0%) | 26 (100.0%) |
| Architecture & Engineering | 42 (100.0%) | 0 (0.0%) |
| Life, Physical & Social Science | 64 (88.9%) | 8 (11.1%) |
| Community & Social Service | 63 (42.9%) | 84 (57.1%) |
| Education, Arts & Media | 0 (0.0%) | 10 (100.0%) |
| Legal Services & Support | 0 (0.0%) | 0 (0.0%) |
| Education Instruction & Library | 20 (21.5%) | 73 (78.5%) |
| Arts, Media & Entertainment | 43 (97.7%) | 1 (2.3%) |
| Health Diagnosing & Treating | 0 (0.0%) | 149 (100.0%) |
| Health Technologists | 0 (0.0%) | 126 (100.0%) |
| Total (Category) | 275 (46.5%) | 316 (53.5%) |
| Total (Overall) | 985 (50.6%) | 960 (49.4%) |
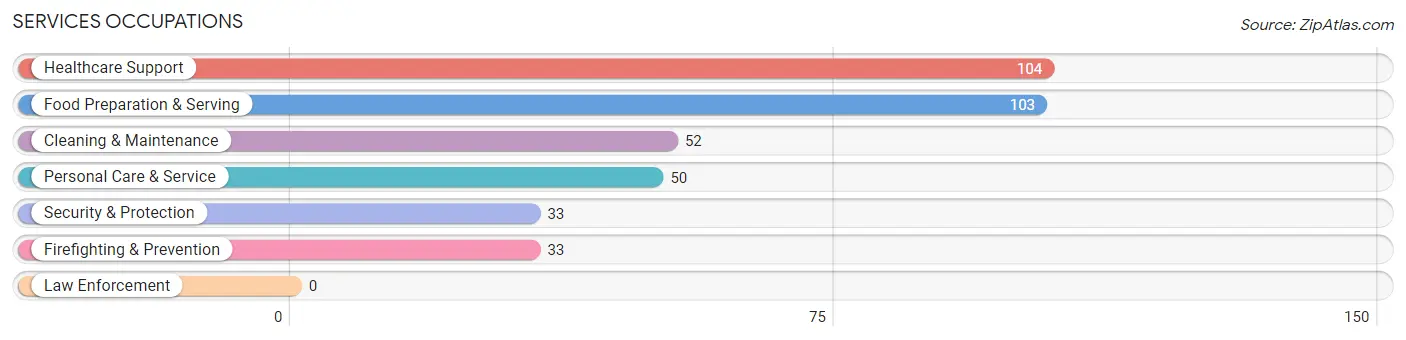
Services Occupations
The most common Services occupations in Osage are Healthcare Support (104 | 5.3%), Food Preparation & Serving (103 | 5.3%), Cleaning & Maintenance (52 | 2.7%), Personal Care & Service (50 | 2.6%), and Security & Protection (33 | 1.7%).
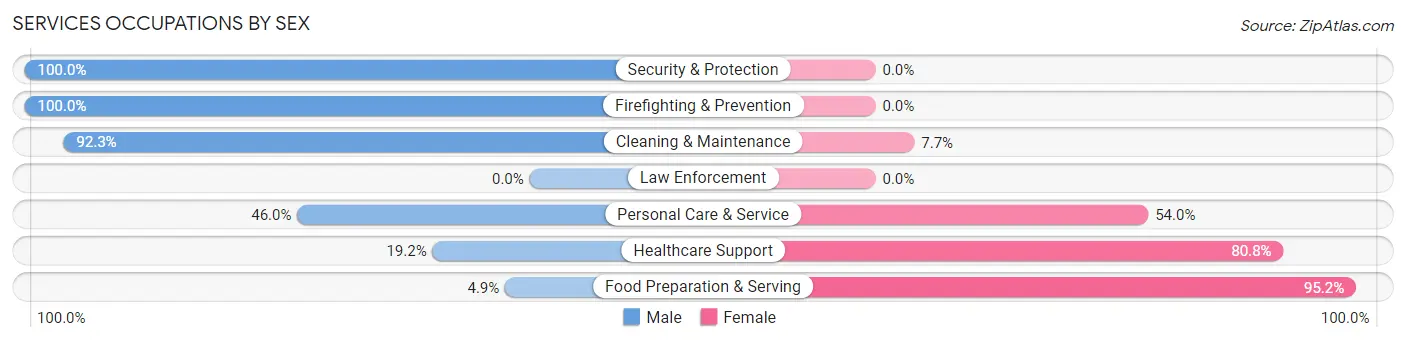
Services Occupations by Sex
Within the Services occupations in Osage, the most male-oriented occupations are Security & Protection (100.0%), Firefighting & Prevention (100.0%), and Cleaning & Maintenance (92.3%), while the most female-oriented occupations are Food Preparation & Serving (95.2%), Healthcare Support (80.8%), and Personal Care & Service (54.0%).
| Occupation | Male | Female |
| Healthcare Support | 20 (19.2%) | 84 (80.8%) |
| Security & Protection | 33 (100.0%) | 0 (0.0%) |
| Firefighting & Prevention | 33 (100.0%) | 0 (0.0%) |
| Law Enforcement | 0 (0.0%) | 0 (0.0%) |
| Food Preparation & Serving | 5 (4.9%) | 98 (95.2%) |
| Cleaning & Maintenance | 48 (92.3%) | 4 (7.7%) |
| Personal Care & Service | 23 (46.0%) | 27 (54.0%) |
| Total (Category) | 129 (37.7%) | 213 (62.3%) |
| Total (Overall) | 985 (50.6%) | 960 (49.4%) |
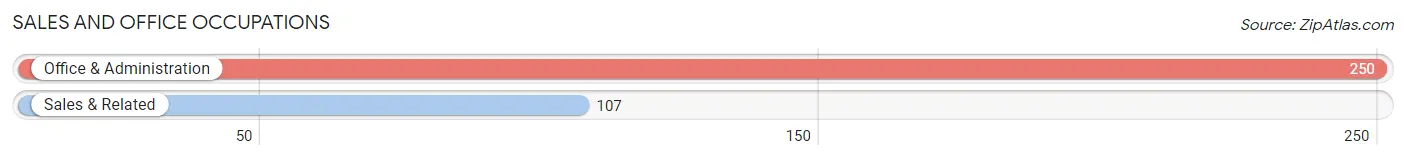
Sales and Office Occupations
The most common Sales and Office occupations in Osage are Office & Administration (250 | 12.9%), and Sales & Related (107 | 5.5%).
Sales and Office Occupations by Sex
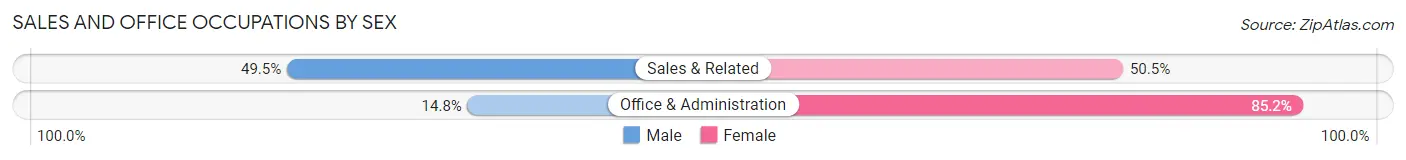
| Occupation | Male | Female |
| Sales & Related | 53 (49.5%) | 54 (50.5%) |
| Office & Administration | 37 (14.8%) | 213 (85.2%) |
| Total (Category) | 90 (25.2%) | 267 (74.8%) |
| Total (Overall) | 985 (50.6%) | 960 (49.4%) |
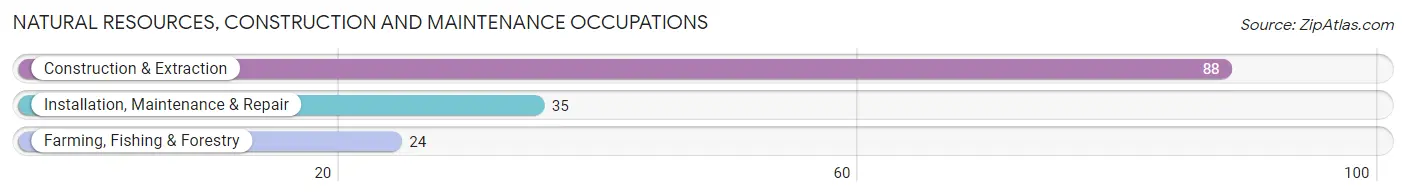
Natural Resources, Construction and Maintenance Occupations
The most common Natural Resources, Construction and Maintenance occupations in Osage are Construction & Extraction (88 | 4.5%), Installation, Maintenance & Repair (35 | 1.8%), and Farming, Fishing & Forestry (24 | 1.2%).
Natural Resources, Construction and Maintenance Occupations by Sex
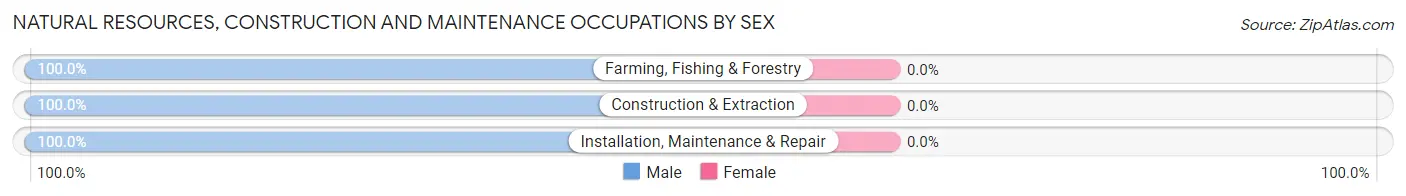
| Occupation | Male | Female |
| Farming, Fishing & Forestry | 24 (100.0%) | 0 (0.0%) |
| Construction & Extraction | 88 (100.0%) | 0 (0.0%) |
| Installation, Maintenance & Repair | 35 (100.0%) | 0 (0.0%) |
| Total (Category) | 147 (100.0%) | 0 (0.0%) |
| Total (Overall) | 985 (50.6%) | 960 (49.4%) |
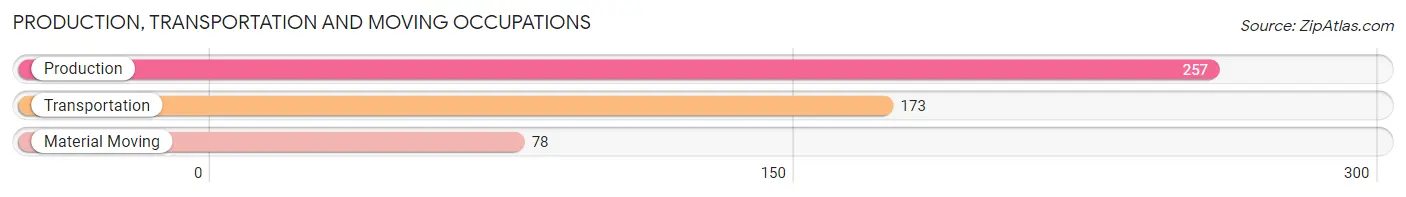
Production, Transportation and Moving Occupations
The most common Production, Transportation and Moving occupations in Osage are Production (257 | 13.2%), Transportation (173 | 8.9%), and Material Moving (78 | 4.0%).
Production, Transportation and Moving Occupations by Sex
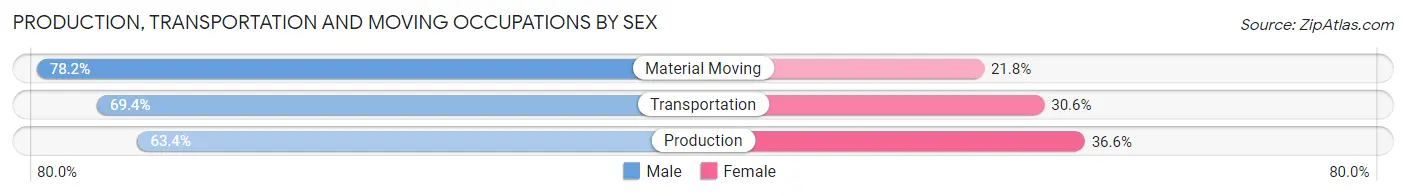
| Occupation | Male | Female |
| Production | 163 (63.4%) | 94 (36.6%) |
| Transportation | 120 (69.4%) | 53 (30.6%) |
| Material Moving | 61 (78.2%) | 17 (21.8%) |
| Total (Category) | 344 (67.7%) | 164 (32.3%) |
| Total (Overall) | 985 (50.6%) | 960 (49.4%) |
Employment Industries by Sex in Osage
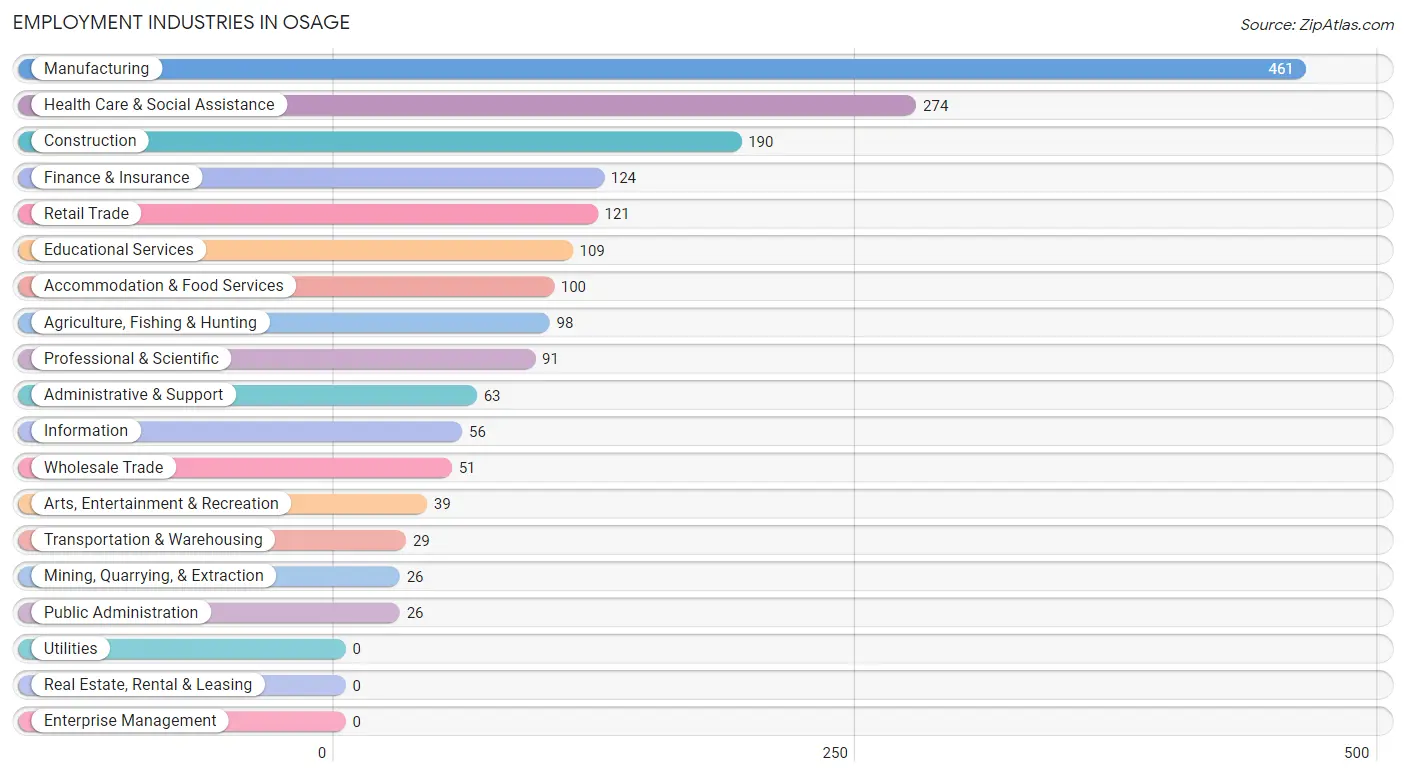
Employment Industries in Osage
The major employment industries in Osage include Manufacturing (461 | 23.7%), Health Care & Social Assistance (274 | 14.1%), Construction (190 | 9.8%), Finance & Insurance (124 | 6.4%), and Retail Trade (121 | 6.2%).
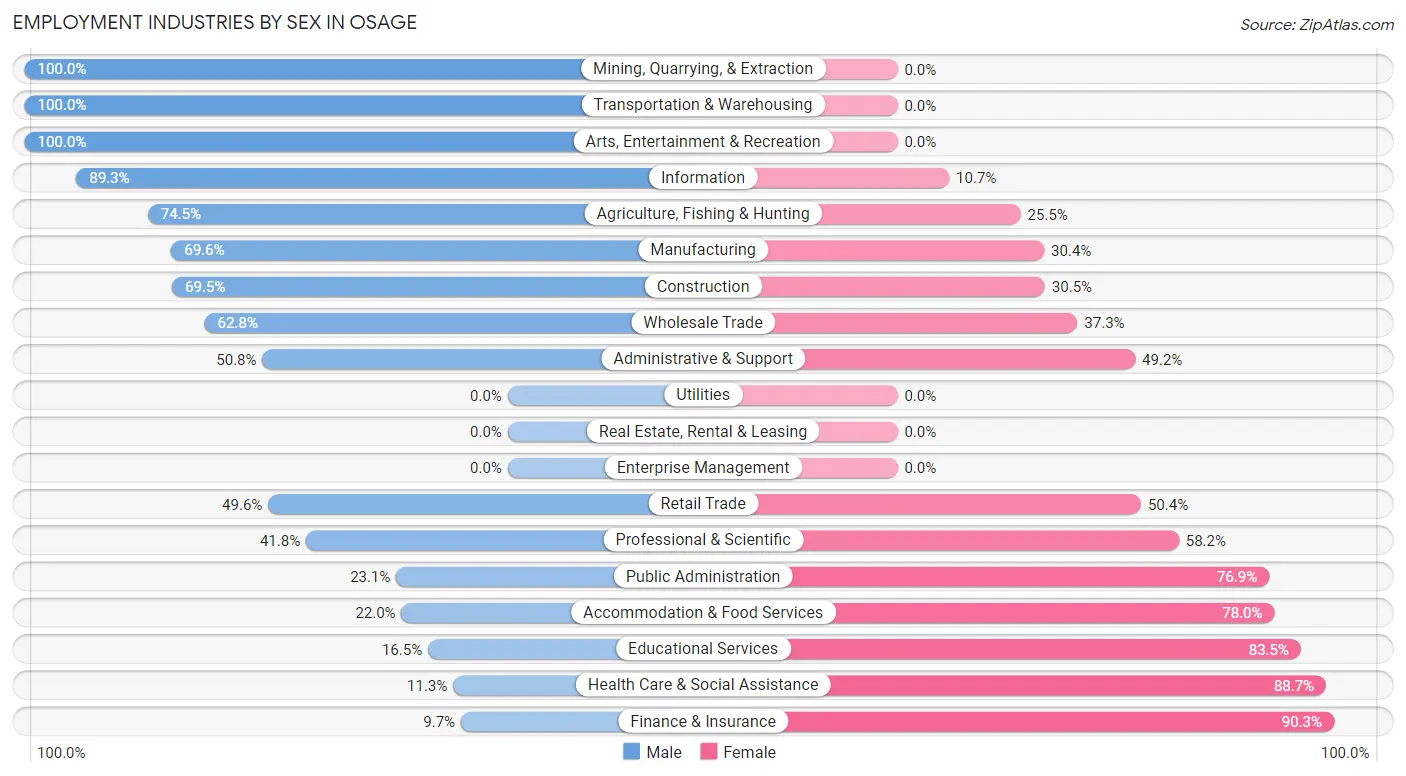
Employment Industries by Sex in Osage
The Osage industries that see more men than women are Mining, Quarrying, & Extraction (100.0%), Transportation & Warehousing (100.0%), and Arts, Entertainment & Recreation (100.0%), whereas the industries that tend to have a higher number of women are Finance & Insurance (90.3%), Health Care & Social Assistance (88.7%), and Educational Services (83.5%).
| Industry | Male | Female |
| Agriculture, Fishing & Hunting | 73 (74.5%) | 25 (25.5%) |
| Mining, Quarrying, & Extraction | 26 (100.0%) | 0 (0.0%) |
| Construction | 132 (69.5%) | 58 (30.5%) |
| Manufacturing | 321 (69.6%) | 140 (30.4%) |
| Wholesale Trade | 32 (62.7%) | 19 (37.2%) |
| Retail Trade | 60 (49.6%) | 61 (50.4%) |
| Transportation & Warehousing | 29 (100.0%) | 0 (0.0%) |
| Utilities | 0 (0.0%) | 0 (0.0%) |
| Information | 50 (89.3%) | 6 (10.7%) |
| Finance & Insurance | 12 (9.7%) | 112 (90.3%) |
| Real Estate, Rental & Leasing | 0 (0.0%) | 0 (0.0%) |
| Professional & Scientific | 38 (41.8%) | 53 (58.2%) |
| Enterprise Management | 0 (0.0%) | 0 (0.0%) |
| Administrative & Support | 32 (50.8%) | 31 (49.2%) |
| Educational Services | 18 (16.5%) | 91 (83.5%) |
| Health Care & Social Assistance | 31 (11.3%) | 243 (88.7%) |
| Arts, Entertainment & Recreation | 39 (100.0%) | 0 (0.0%) |
| Accommodation & Food Services | 22 (22.0%) | 78 (78.0%) |
| Public Administration | 6 (23.1%) | 20 (76.9%) |
| Total | 985 (50.6%) | 960 (49.4%) |
Education in Osage
School Enrollment in Osage
The most common levels of schooling among the 747 students in Osage are college / undergraduate (204 | 27.3%), elementary school (160 | 21.4%), and high school (159 | 21.3%).
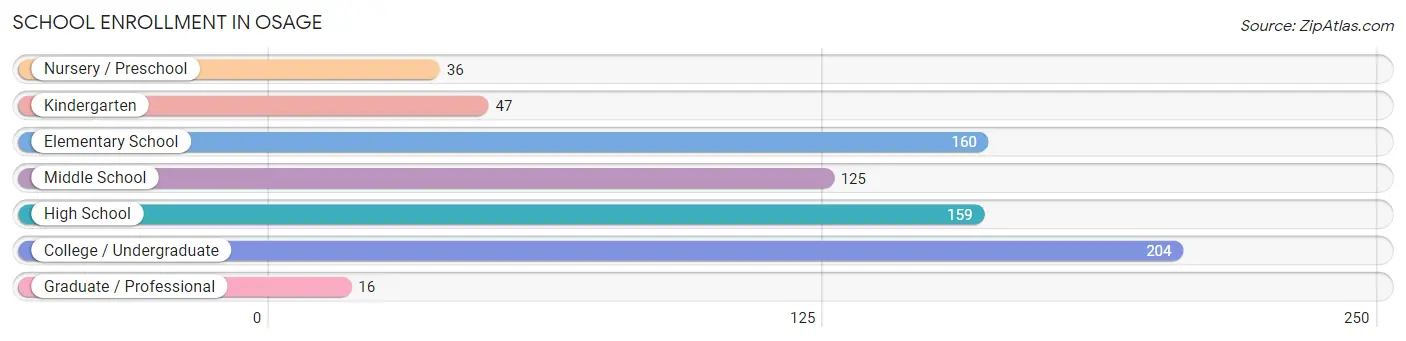
| School Level | # Students | % Students |
| Nursery / Preschool | 36 | 4.8% |
| Kindergarten | 47 | 6.3% |
| Elementary School | 160 | 21.4% |
| Middle School | 125 | 16.7% |
| High School | 159 | 21.3% |
| College / Undergraduate | 204 | 27.3% |
| Graduate / Professional | 16 | 2.1% |
| Total | 747 | 100.0% |
School Enrollment by Age by Funding Source in Osage
Out of a total of 747 students who are enrolled in schools in Osage, 48 (6.4%) attend a private institution, while the remaining 699 (93.6%) are enrolled in public schools. The age group of 20 to 24 year olds has the highest likelihood of being enrolled in private schools, with 48 (41.0% in the age bracket) enrolled. Conversely, the age group of 3 to 4 year olds has the lowest likelihood of being enrolled in a private school, with 21 (100.0% in the age bracket) attending a public institution.
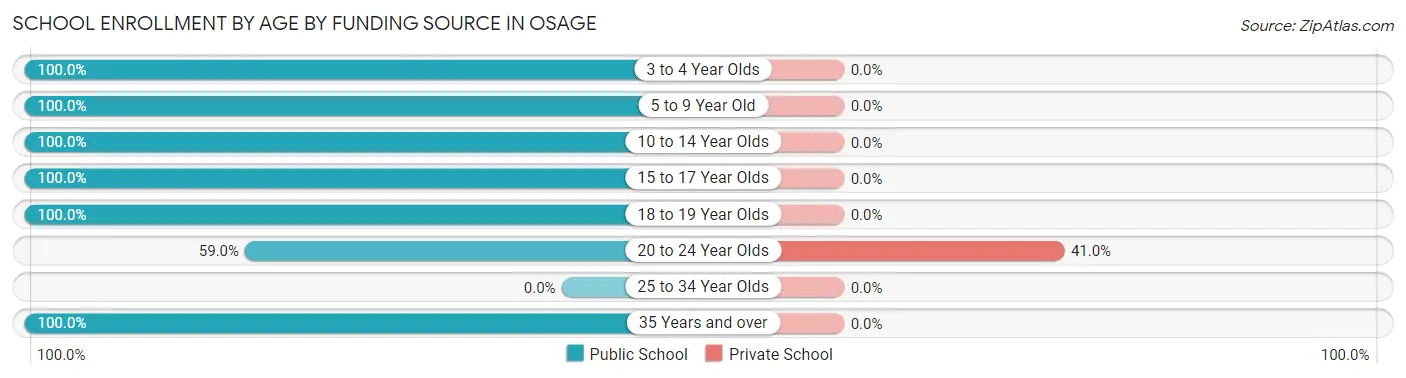
| Age Bracket | Public School | Private School |
| 3 to 4 Year Olds | 21 (100.0%) | 0 (0.0%) |
| 5 to 9 Year Old | 203 (100.0%) | 0 (0.0%) |
| 10 to 14 Year Olds | 179 (100.0%) | 0 (0.0%) |
| 15 to 17 Year Olds | 80 (100.0%) | 0 (0.0%) |
| 18 to 19 Year Olds | 88 (100.0%) | 0 (0.0%) |
| 20 to 24 Year Olds | 69 (59.0%) | 48 (41.0%) |
| 25 to 34 Year Olds | 0 (0.0%) | 0 (0.0%) |
| 35 Years and over | 59 (100.0%) | 0 (0.0%) |
| Total | 699 (93.6%) | 48 (6.4%) |
Educational Attainment by Field of Study in Osage
Education (145 | 23.9%), business (109 | 18.0%), bio, nature & agricultural (105 | 17.3%), engineering (54 | 8.9%), and science & technology (50 | 8.2%) are the most common fields of study among 607 individuals in Osage who have obtained a bachelor's degree or higher.
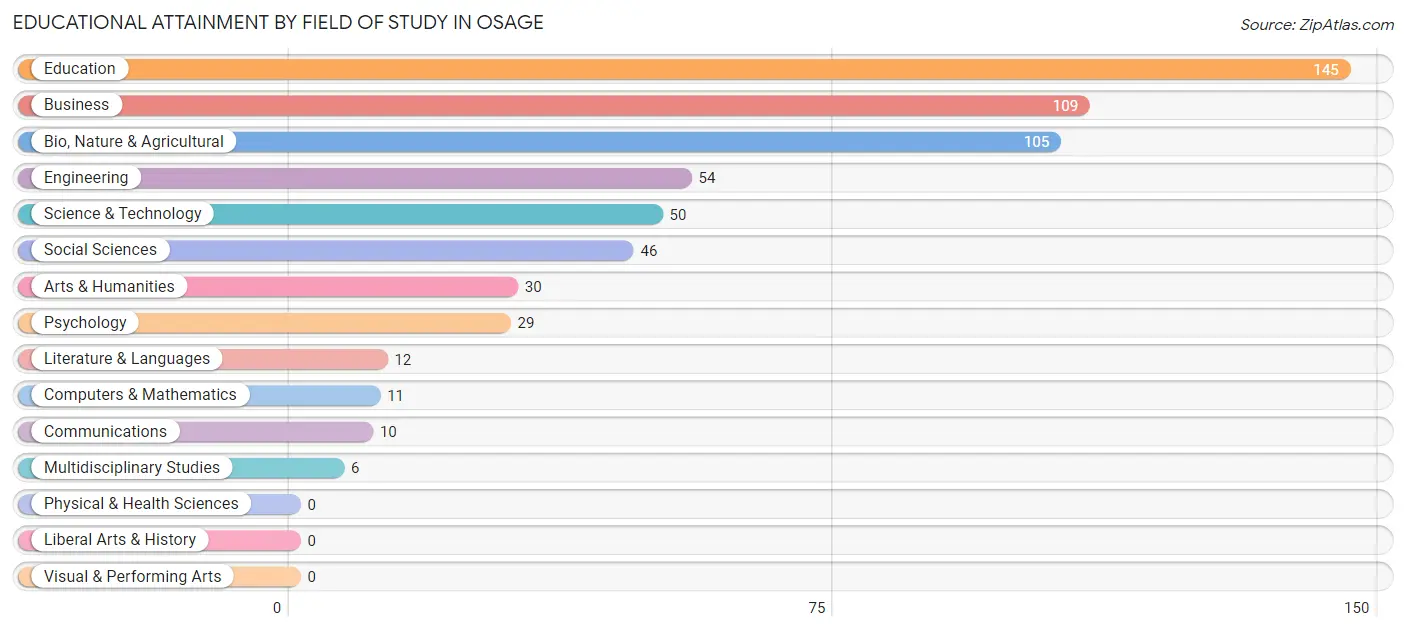
| Field of Study | # Graduates | % Graduates |
| Computers & Mathematics | 11 | 1.8% |
| Bio, Nature & Agricultural | 105 | 17.3% |
| Physical & Health Sciences | 0 | 0.0% |
| Psychology | 29 | 4.8% |
| Social Sciences | 46 | 7.6% |
| Engineering | 54 | 8.9% |
| Multidisciplinary Studies | 6 | 1.0% |
| Science & Technology | 50 | 8.2% |
| Business | 109 | 18.0% |
| Education | 145 | 23.9% |
| Literature & Languages | 12 | 2.0% |
| Liberal Arts & History | 0 | 0.0% |
| Visual & Performing Arts | 0 | 0.0% |
| Communications | 10 | 1.7% |
| Arts & Humanities | 30 | 4.9% |
| Total | 607 | 100.0% |
Transportation & Commute in Osage
Vehicle Availability by Sex in Osage
The most prevalent vehicle ownership categories in Osage are males with 2 vehicles (416, accounting for 42.8%) and females with 2 vehicles (396, making up 44.3%).
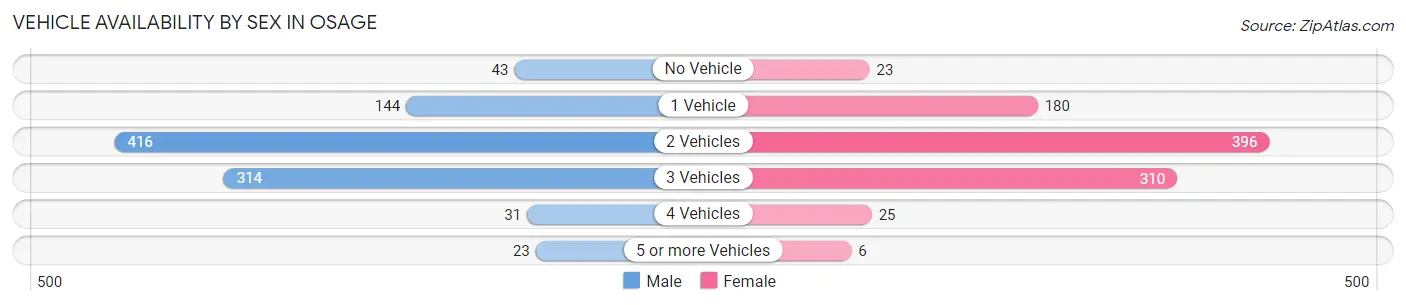
| Vehicles Available | Male | Female |
| No Vehicle | 43 (4.4%) | 23 (2.5%) |
| 1 Vehicle | 144 (14.8%) | 180 (19.2%) |
| 2 Vehicles | 416 (42.8%) | 396 (42.1%) |
| 3 Vehicles | 314 (32.3%) | 310 (33.0%) |
| 4 Vehicles | 31 (3.2%) | 25 (2.7%) |
| 5 or more Vehicles | 23 (2.4%) | 6 (0.6%) |
| Total | 971 (100.0%) | 940 (100.0%) |
Commute Time in Osage
The most frequently occuring commute durations in Osage are 5 to 9 minutes (577 commuters, 30.4%), less than 5 minutes (311 commuters, 16.4%), and 20 to 24 minutes (211 commuters, 11.1%).
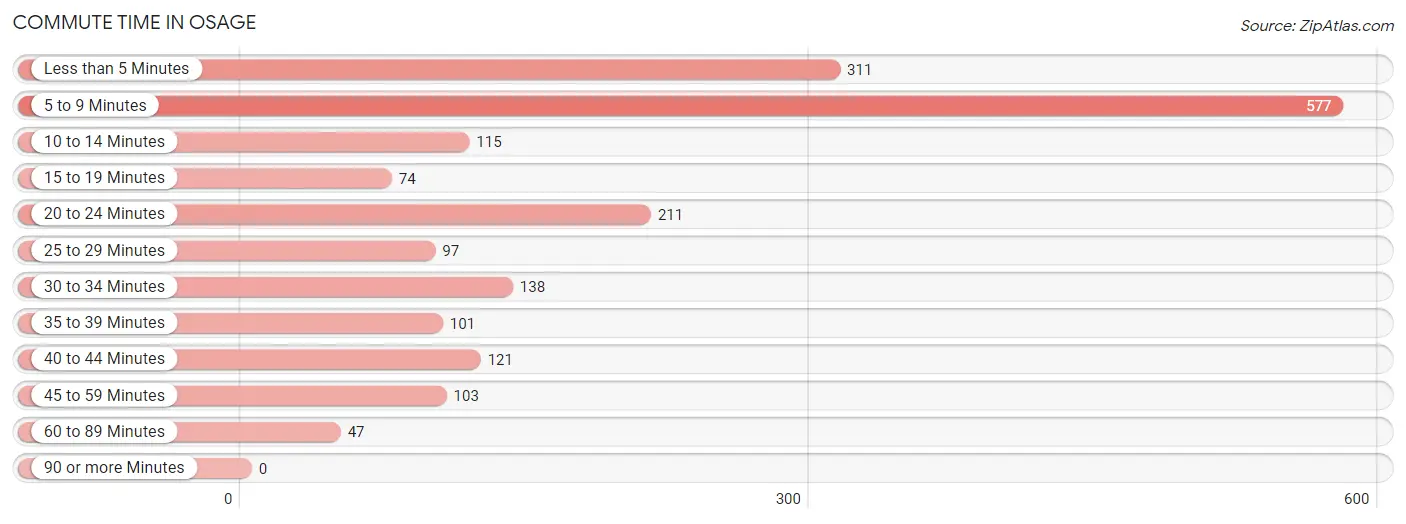
| Commute Time | # Commuters | % Commuters |
| Less than 5 Minutes | 311 | 16.4% |
| 5 to 9 Minutes | 577 | 30.4% |
| 10 to 14 Minutes | 115 | 6.1% |
| 15 to 19 Minutes | 74 | 3.9% |
| 20 to 24 Minutes | 211 | 11.1% |
| 25 to 29 Minutes | 97 | 5.1% |
| 30 to 34 Minutes | 138 | 7.3% |
| 35 to 39 Minutes | 101 | 5.3% |
| 40 to 44 Minutes | 121 | 6.4% |
| 45 to 59 Minutes | 103 | 5.4% |
| 60 to 89 Minutes | 47 | 2.5% |
| 90 or more Minutes | 0 | 0.0% |
Commute Time by Sex in Osage
The most common commute times in Osage are 5 to 9 minutes (238 commuters, 24.4%) for males and 5 to 9 minutes (339 commuters, 36.9%) for females.
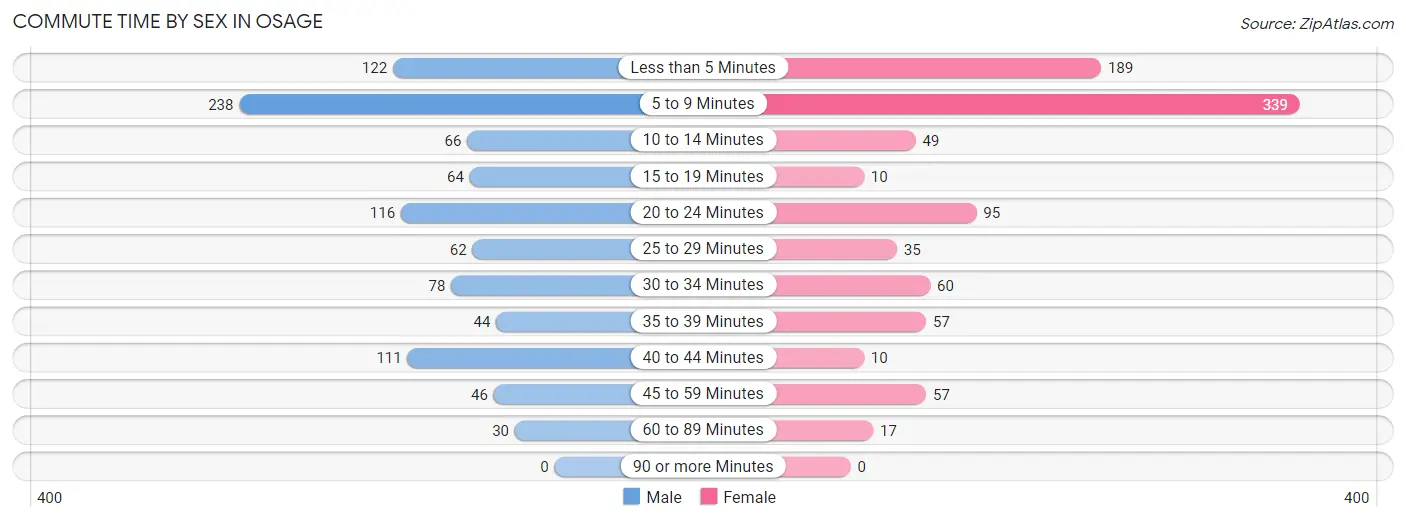
| Commute Time | Male | Female |
| Less than 5 Minutes | 122 (12.5%) | 189 (20.6%) |
| 5 to 9 Minutes | 238 (24.4%) | 339 (36.9%) |
| 10 to 14 Minutes | 66 (6.8%) | 49 (5.3%) |
| 15 to 19 Minutes | 64 (6.6%) | 10 (1.1%) |
| 20 to 24 Minutes | 116 (11.9%) | 95 (10.3%) |
| 25 to 29 Minutes | 62 (6.4%) | 35 (3.8%) |
| 30 to 34 Minutes | 78 (8.0%) | 60 (6.5%) |
| 35 to 39 Minutes | 44 (4.5%) | 57 (6.2%) |
| 40 to 44 Minutes | 111 (11.4%) | 10 (1.1%) |
| 45 to 59 Minutes | 46 (4.7%) | 57 (6.2%) |
| 60 to 89 Minutes | 30 (3.1%) | 17 (1.8%) |
| 90 or more Minutes | 0 (0.0%) | 0 (0.0%) |
Time of Departure to Work by Sex in Osage
The most frequent times of departure to work in Osage are 6:00 AM to 6:29 AM (203, 20.8%) for males and 7:00 AM to 7:29 AM (130, 14.2%) for females.
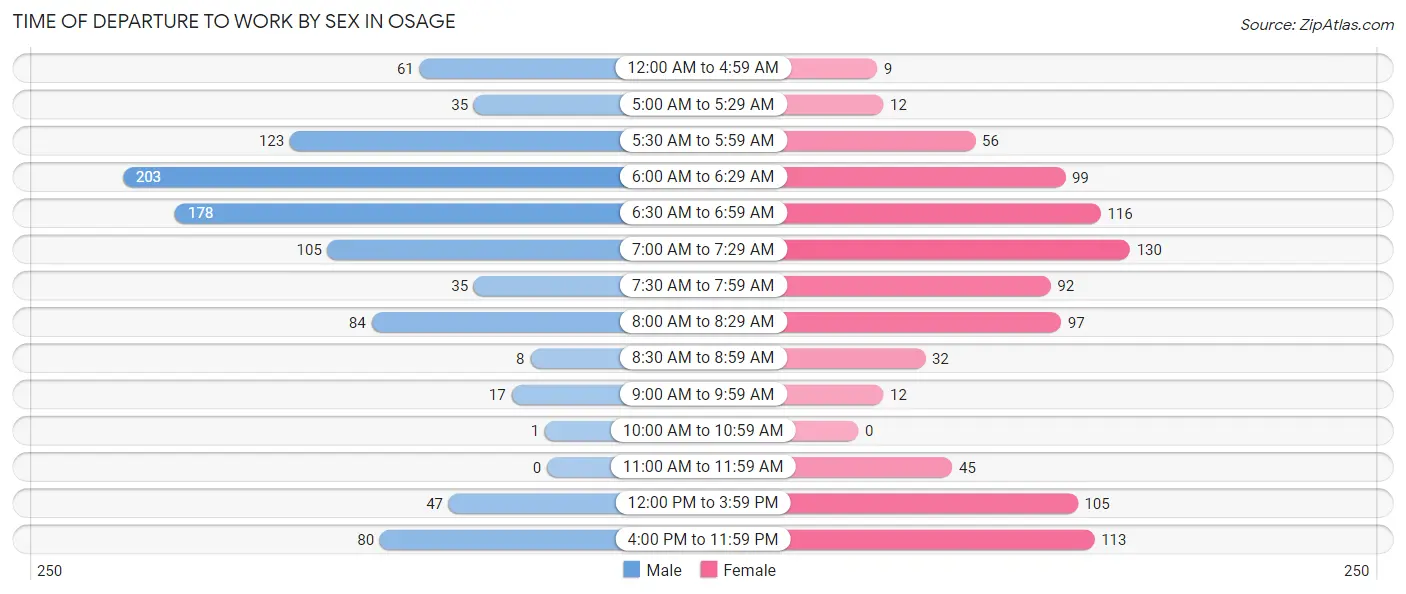
| Time of Departure | Male | Female |
| 12:00 AM to 4:59 AM | 61 (6.2%) | 9 (1.0%) |
| 5:00 AM to 5:29 AM | 35 (3.6%) | 12 (1.3%) |
| 5:30 AM to 5:59 AM | 123 (12.6%) | 56 (6.1%) |
| 6:00 AM to 6:29 AM | 203 (20.8%) | 99 (10.8%) |
| 6:30 AM to 6:59 AM | 178 (18.2%) | 116 (12.6%) |
| 7:00 AM to 7:29 AM | 105 (10.7%) | 130 (14.2%) |
| 7:30 AM to 7:59 AM | 35 (3.6%) | 92 (10.0%) |
| 8:00 AM to 8:29 AM | 84 (8.6%) | 97 (10.6%) |
| 8:30 AM to 8:59 AM | 8 (0.8%) | 32 (3.5%) |
| 9:00 AM to 9:59 AM | 17 (1.7%) | 12 (1.3%) |
| 10:00 AM to 10:59 AM | 1 (0.1%) | 0 (0.0%) |
| 11:00 AM to 11:59 AM | 0 (0.0%) | 45 (4.9%) |
| 12:00 PM to 3:59 PM | 47 (4.8%) | 105 (11.4%) |
| 4:00 PM to 11:59 PM | 80 (8.2%) | 113 (12.3%) |
| Total | 977 (100.0%) | 918 (100.0%) |
Housing Occupancy in Osage
Occupancy by Ownership in Osage
Of the total 1,760 dwellings in Osage, owner-occupied units account for 1,374 (78.1%), while renter-occupied units make up 386 (21.9%).
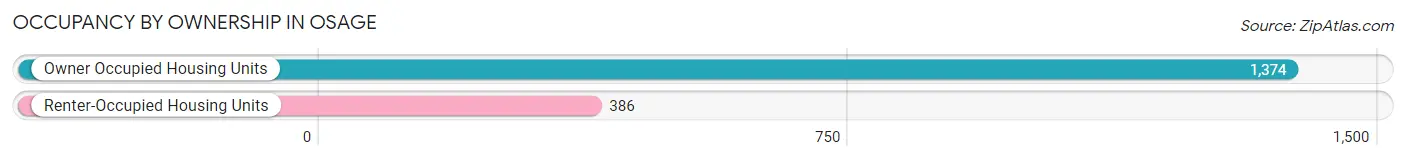
| Occupancy | # Housing Units | % Housing Units |
| Owner Occupied Housing Units | 1,374 | 78.1% |
| Renter-Occupied Housing Units | 386 | 21.9% |
| Total Occupied Housing Units | 1,760 | 100.0% |
Occupancy by Household Size in Osage
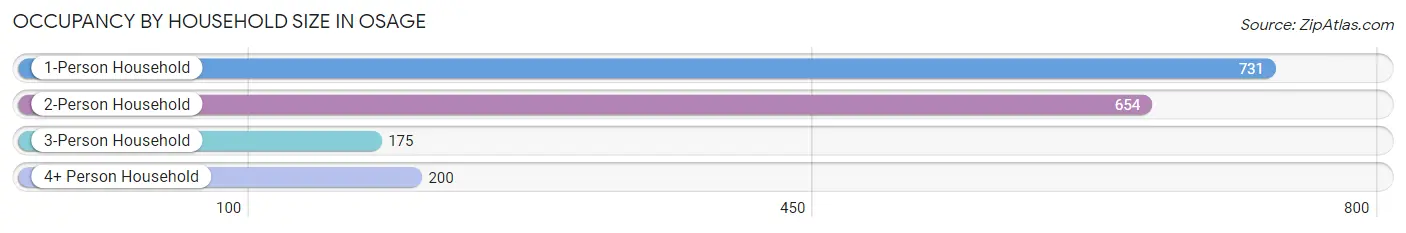
| Household Size | # Housing Units | % Housing Units |
| 1-Person Household | 731 | 41.5% |
| 2-Person Household | 654 | 37.2% |
| 3-Person Household | 175 | 9.9% |
| 4+ Person Household | 200 | 11.4% |
| Total Housing Units | 1,760 | 100.0% |
Occupancy by Ownership by Household Size in Osage
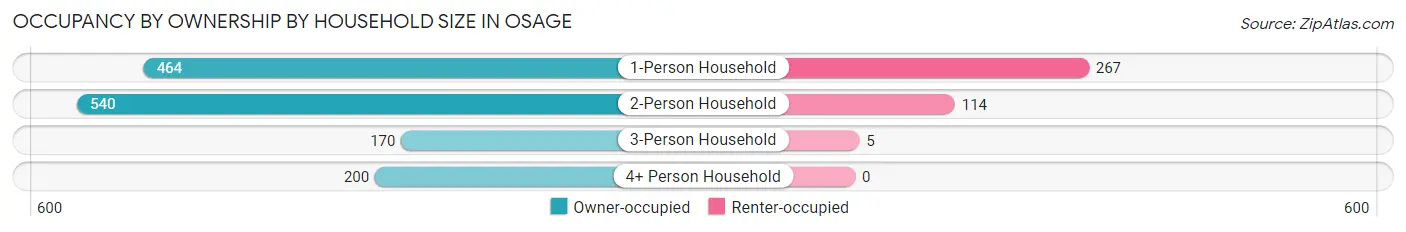
| Household Size | Owner-occupied | Renter-occupied |
| 1-Person Household | 464 (63.5%) | 267 (36.5%) |
| 2-Person Household | 540 (82.6%) | 114 (17.4%) |
| 3-Person Household | 170 (97.1%) | 5 (2.9%) |
| 4+ Person Household | 200 (100.0%) | 0 (0.0%) |
| Total Housing Units | 1,374 (78.1%) | 386 (21.9%) |
Occupancy by Educational Attainment in Osage
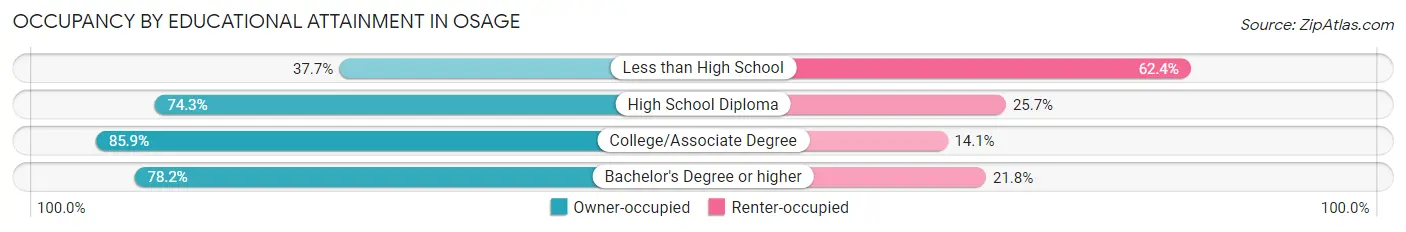
| Household Size | Owner-occupied | Renter-occupied |
| Less than High School | 32 (37.7%) | 53 (62.4%) |
| High School Diploma | 430 (74.3%) | 149 (25.7%) |
| College/Associate Degree | 614 (85.9%) | 101 (14.1%) |
| Bachelor's Degree or higher | 298 (78.2%) | 83 (21.8%) |
Occupancy by Age of Householder in Osage
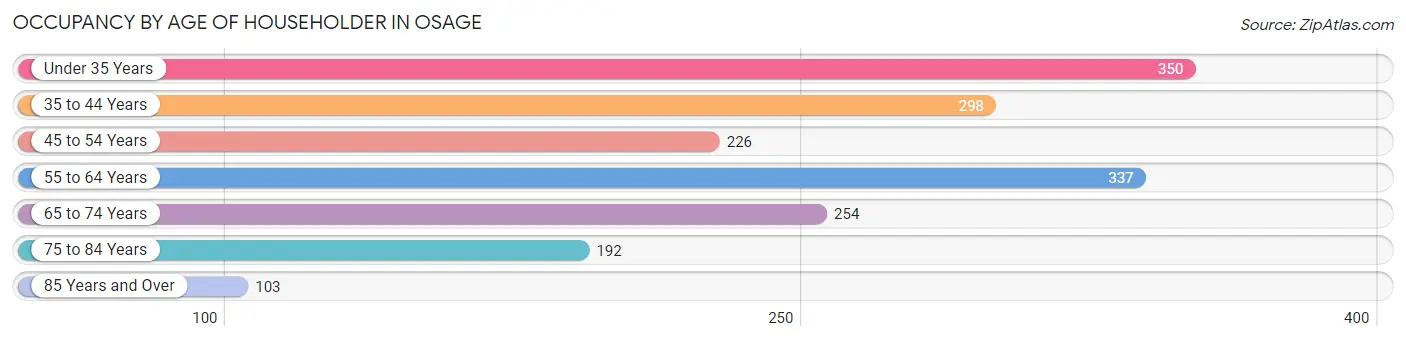
| Age Bracket | # Households | % Households |
| Under 35 Years | 350 | 19.9% |
| 35 to 44 Years | 298 | 16.9% |
| 45 to 54 Years | 226 | 12.8% |
| 55 to 64 Years | 337 | 19.2% |
| 65 to 74 Years | 254 | 14.4% |
| 75 to 84 Years | 192 | 10.9% |
| 85 Years and Over | 103 | 5.9% |
| Total | 1,760 | 100.0% |
Housing Finances in Osage
Median Income by Occupancy in Osage
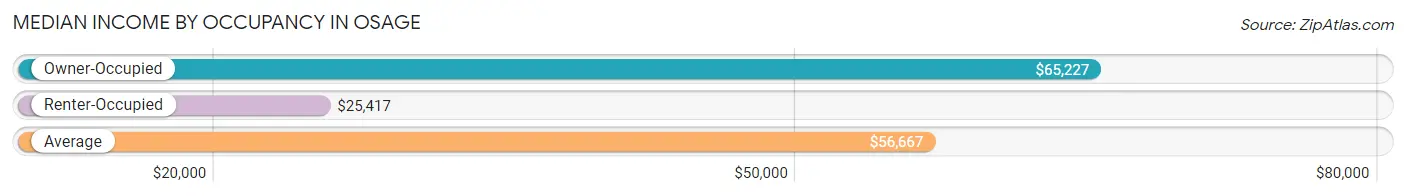
| Occupancy Type | # Households | Median Income |
| Owner-Occupied | 1,374 (78.1%) | $65,227 |
| Renter-Occupied | 386 (21.9%) | $25,417 |
| Average | 1,760 (100.0%) | $56,667 |
Occupancy by Householder Income Bracket in Osage
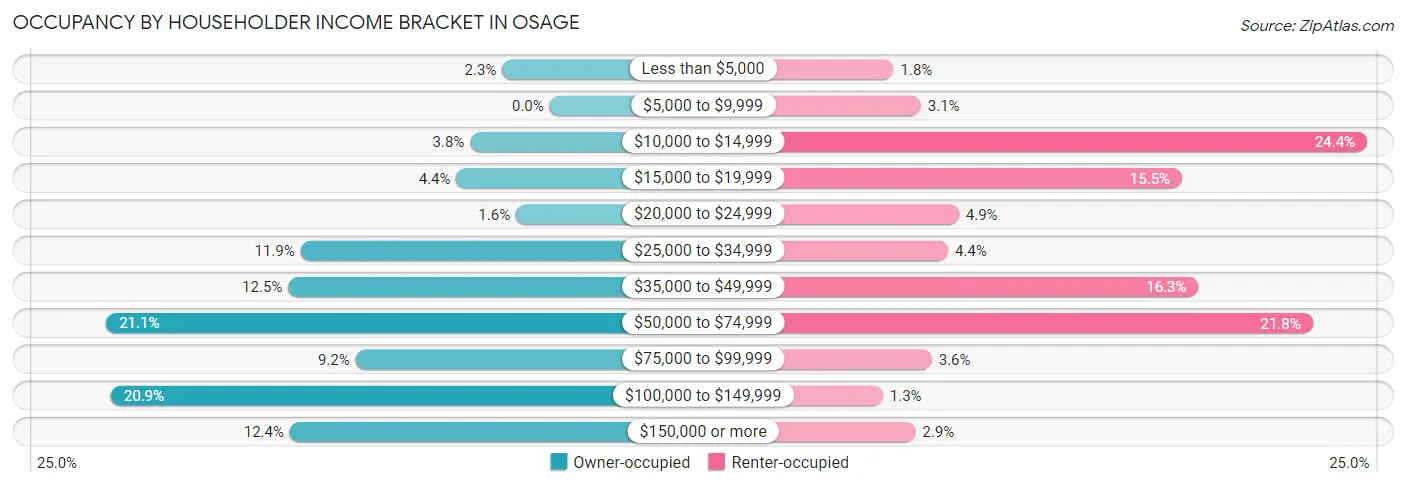
| Income Bracket | Owner-occupied | Renter-occupied |
| Less than $5,000 | 31 (2.3%) | 7 (1.8%) |
| $5,000 to $9,999 | 0 (0.0%) | 12 (3.1%) |
| $10,000 to $14,999 | 52 (3.8%) | 94 (24.3%) |
| $15,000 to $19,999 | 61 (4.4%) | 60 (15.5%) |
| $20,000 to $24,999 | 22 (1.6%) | 19 (4.9%) |
| $25,000 to $34,999 | 163 (11.9%) | 17 (4.4%) |
| $35,000 to $49,999 | 171 (12.4%) | 63 (16.3%) |
| $50,000 to $74,999 | 290 (21.1%) | 84 (21.8%) |
| $75,000 to $99,999 | 127 (9.2%) | 14 (3.6%) |
| $100,000 to $149,999 | 287 (20.9%) | 5 (1.3%) |
| $150,000 or more | 170 (12.4%) | 11 (2.9%) |
| Total | 1,374 (100.0%) | 386 (100.0%) |
Monthly Housing Cost Tiers in Osage
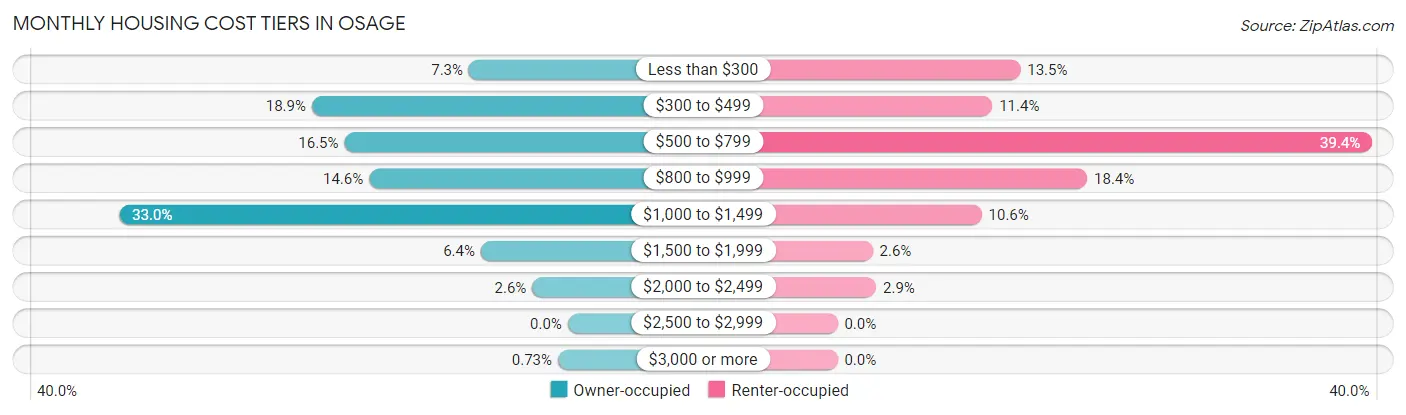
| Monthly Cost | Owner-occupied | Renter-occupied |
| Less than $300 | 100 (7.3%) | 52 (13.5%) |
| $300 to $499 | 259 (18.9%) | 44 (11.4%) |
| $500 to $799 | 226 (16.5%) | 152 (39.4%) |
| $800 to $999 | 201 (14.6%) | 71 (18.4%) |
| $1,000 to $1,499 | 454 (33.0%) | 41 (10.6%) |
| $1,500 to $1,999 | 88 (6.4%) | 10 (2.6%) |
| $2,000 to $2,499 | 36 (2.6%) | 11 (2.9%) |
| $2,500 to $2,999 | 0 (0.0%) | 0 (0.0%) |
| $3,000 or more | 10 (0.7%) | 0 (0.0%) |
| Total | 1,374 (100.0%) | 386 (100.0%) |
Physical Housing Characteristics in Osage
Housing Structures in Osage
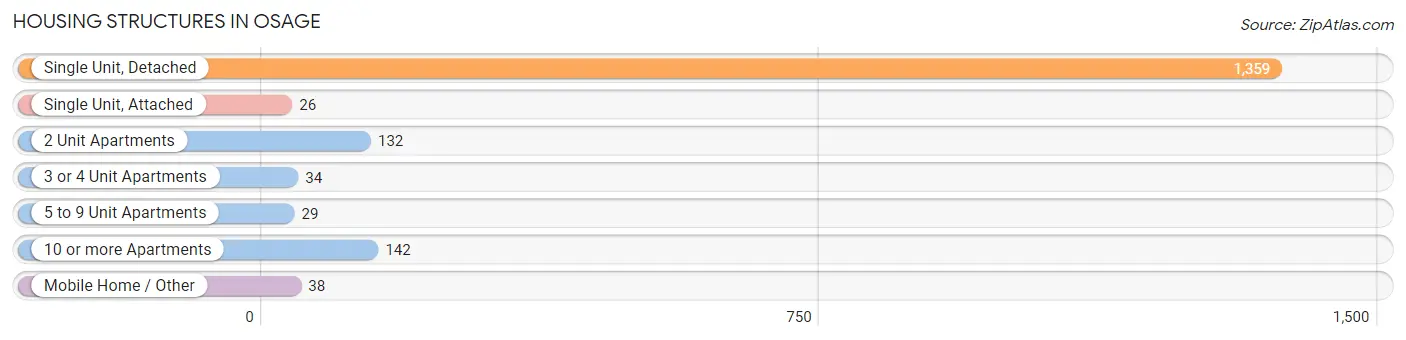
| Structure Type | # Housing Units | % Housing Units |
| Single Unit, Detached | 1,359 | 77.2% |
| Single Unit, Attached | 26 | 1.5% |
| 2 Unit Apartments | 132 | 7.5% |
| 3 or 4 Unit Apartments | 34 | 1.9% |
| 5 to 9 Unit Apartments | 29 | 1.7% |
| 10 or more Apartments | 142 | 8.1% |
| Mobile Home / Other | 38 | 2.2% |
| Total | 1,760 | 100.0% |
Housing Structures by Occupancy in Osage
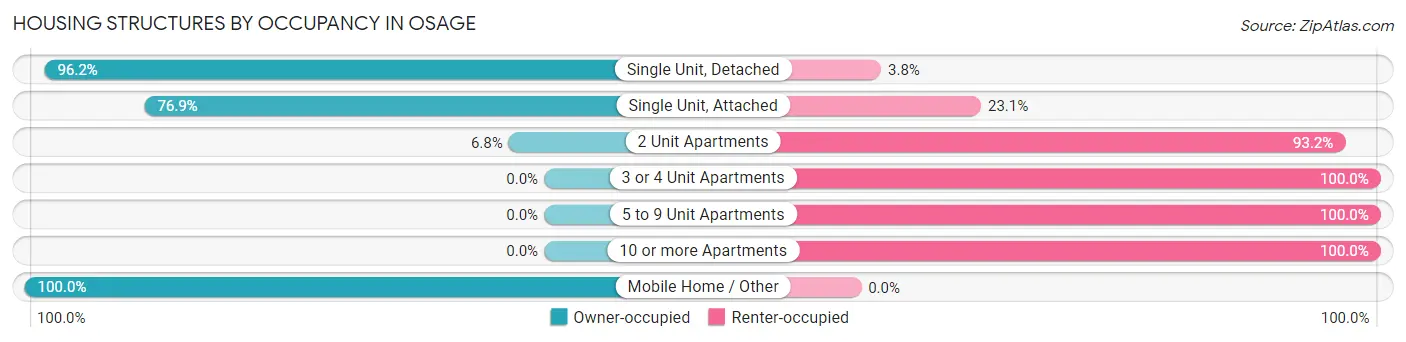
| Structure Type | Owner-occupied | Renter-occupied |
| Single Unit, Detached | 1,307 (96.2%) | 52 (3.8%) |
| Single Unit, Attached | 20 (76.9%) | 6 (23.1%) |
| 2 Unit Apartments | 9 (6.8%) | 123 (93.2%) |
| 3 or 4 Unit Apartments | 0 (0.0%) | 34 (100.0%) |
| 5 to 9 Unit Apartments | 0 (0.0%) | 29 (100.0%) |
| 10 or more Apartments | 0 (0.0%) | 142 (100.0%) |
| Mobile Home / Other | 38 (100.0%) | 0 (0.0%) |
| Total | 1,374 (78.1%) | 386 (21.9%) |
Housing Structures by Number of Rooms in Osage
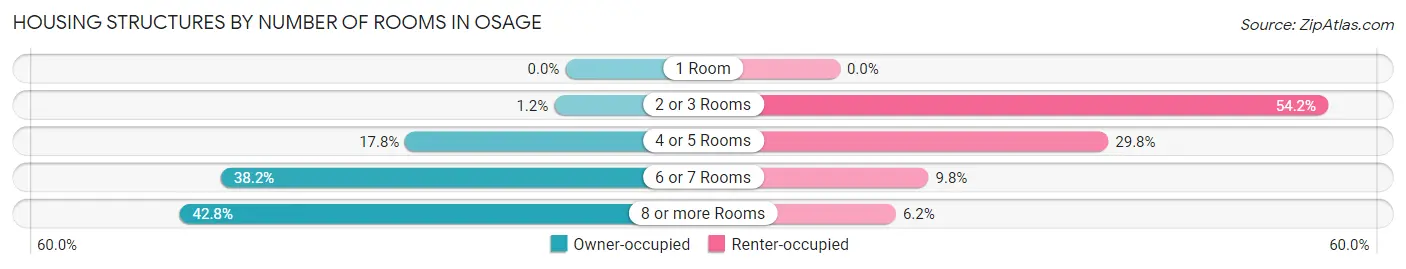
| Number of Rooms | Owner-occupied | Renter-occupied |
| 1 Room | 0 (0.0%) | 0 (0.0%) |
| 2 or 3 Rooms | 17 (1.2%) | 209 (54.1%) |
| 4 or 5 Rooms | 244 (17.8%) | 115 (29.8%) |
| 6 or 7 Rooms | 525 (38.2%) | 38 (9.8%) |
| 8 or more Rooms | 588 (42.8%) | 24 (6.2%) |
| Total | 1,374 (100.0%) | 386 (100.0%) |
Housing Structure by Heating Type in Osage
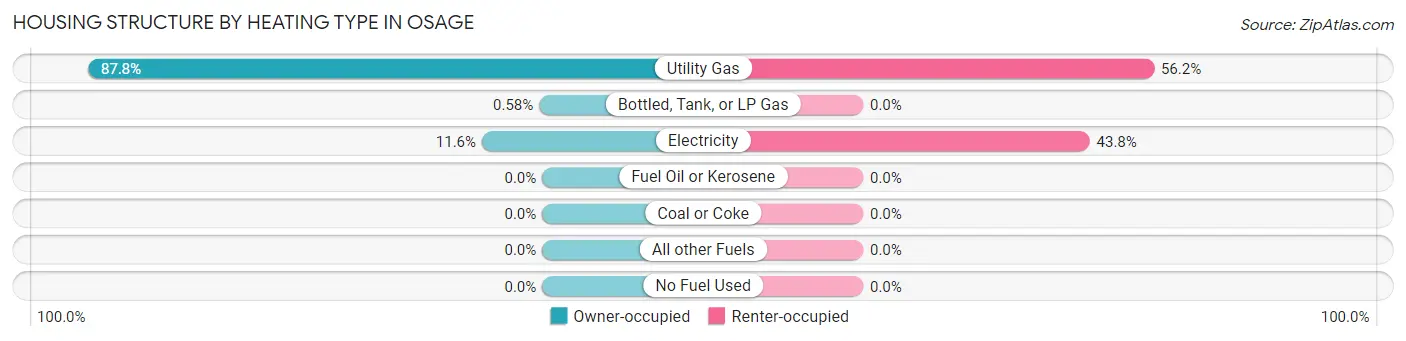
| Heating Type | Owner-occupied | Renter-occupied |
| Utility Gas | 1,206 (87.8%) | 217 (56.2%) |
| Bottled, Tank, or LP Gas | 8 (0.6%) | 0 (0.0%) |
| Electricity | 160 (11.6%) | 169 (43.8%) |
| Fuel Oil or Kerosene | 0 (0.0%) | 0 (0.0%) |
| Coal or Coke | 0 (0.0%) | 0 (0.0%) |
| All other Fuels | 0 (0.0%) | 0 (0.0%) |
| No Fuel Used | 0 (0.0%) | 0 (0.0%) |
| Total | 1,374 (100.0%) | 386 (100.0%) |
Household Vehicle Usage in Osage
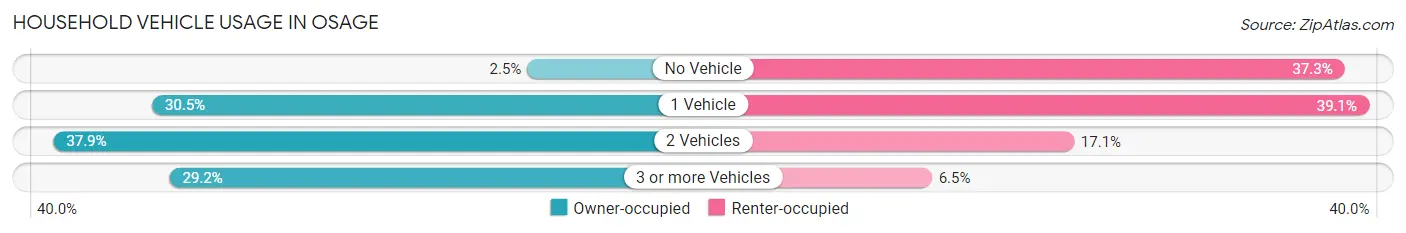
| Vehicles per Household | Owner-occupied | Renter-occupied |
| No Vehicle | 34 (2.5%) | 144 (37.3%) |
| 1 Vehicle | 419 (30.5%) | 151 (39.1%) |
| 2 Vehicles | 520 (37.9%) | 66 (17.1%) |
| 3 or more Vehicles | 401 (29.2%) | 25 (6.5%) |
| Total | 1,374 (100.0%) | 386 (100.0%) |
Real Estate & Mortgages in Osage
Real Estate and Mortgage Overview in Osage
| Characteristic | Without Mortgage | With Mortgage |
| Housing Units | 524 | 850 |
| Median Property Value | $143,500 | $128,900 |
| Median Household Income | $40,500 | $105 |
| Monthly Housing Costs | $421 | $0 |
| Real Estate Taxes | $1,900 | $0 |
Property Value by Mortgage Status in Osage
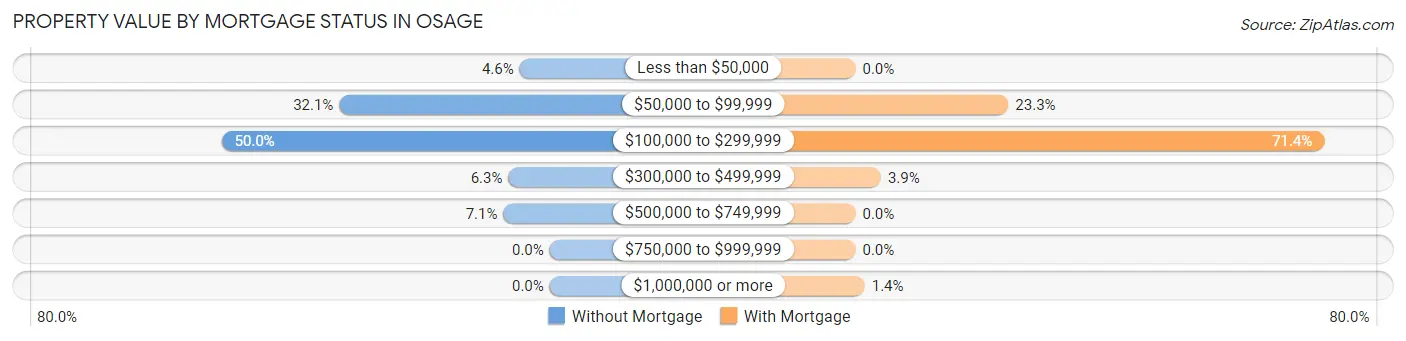
| Property Value | Without Mortgage | With Mortgage |
| Less than $50,000 | 24 (4.6%) | 0 (0.0%) |
| $50,000 to $99,999 | 168 (32.1%) | 198 (23.3%) |
| $100,000 to $299,999 | 262 (50.0%) | 607 (71.4%) |
| $300,000 to $499,999 | 33 (6.3%) | 33 (3.9%) |
| $500,000 to $749,999 | 37 (7.1%) | 0 (0.0%) |
| $750,000 to $999,999 | 0 (0.0%) | 0 (0.0%) |
| $1,000,000 or more | 0 (0.0%) | 12 (1.4%) |
| Total | 524 (100.0%) | 850 (100.0%) |
Household Income by Mortgage Status in Osage
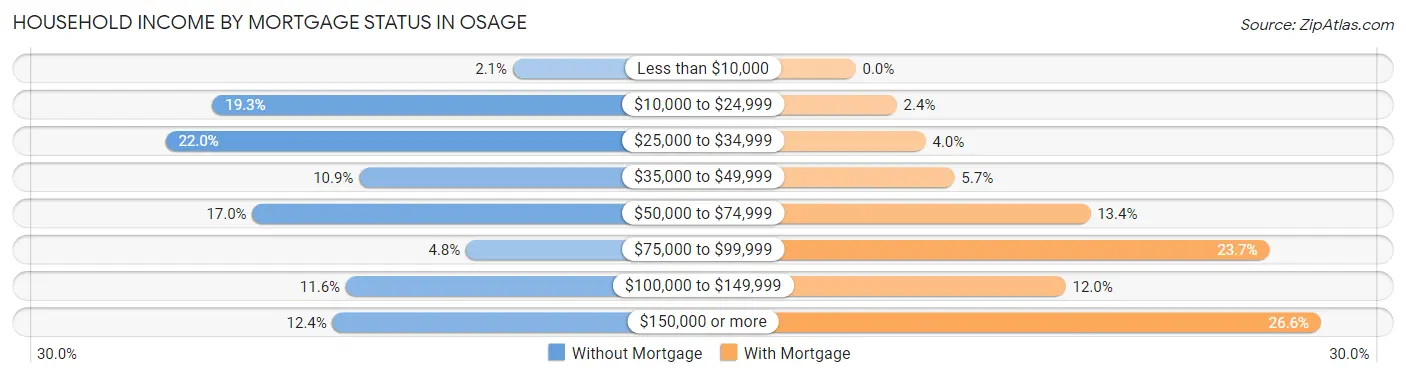
| Household Income | Without Mortgage | With Mortgage |
| Less than $10,000 | 11 (2.1%) | 0 (0.0%) |
| $10,000 to $24,999 | 101 (19.3%) | 20 (2.4%) |
| $25,000 to $34,999 | 115 (22.0%) | 34 (4.0%) |
| $35,000 to $49,999 | 57 (10.9%) | 48 (5.7%) |
| $50,000 to $74,999 | 89 (17.0%) | 114 (13.4%) |
| $75,000 to $99,999 | 25 (4.8%) | 201 (23.6%) |
| $100,000 to $149,999 | 61 (11.6%) | 102 (12.0%) |
| $150,000 or more | 65 (12.4%) | 226 (26.6%) |
| Total | 524 (100.0%) | 850 (100.0%) |
Property Value to Household Income Ratio in Osage
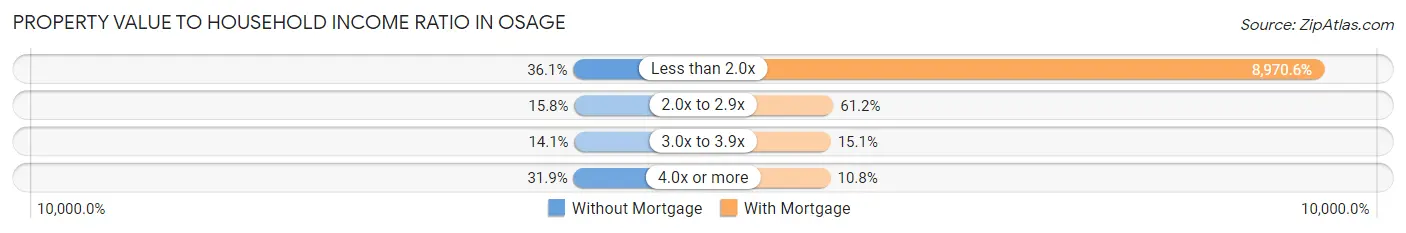
| Value-to-Income Ratio | Without Mortgage | With Mortgage |
| Less than 2.0x | 189 (36.1%) | 76,250 (8,970.6%) |
| 2.0x to 2.9x | 83 (15.8%) | 520 (61.2%) |
| 3.0x to 3.9x | 74 (14.1%) | 128 (15.1%) |
| 4.0x or more | 167 (31.9%) | 92 (10.8%) |
| Total | 524 (100.0%) | 850 (100.0%) |
Real Estate Taxes by Mortgage Status in Osage
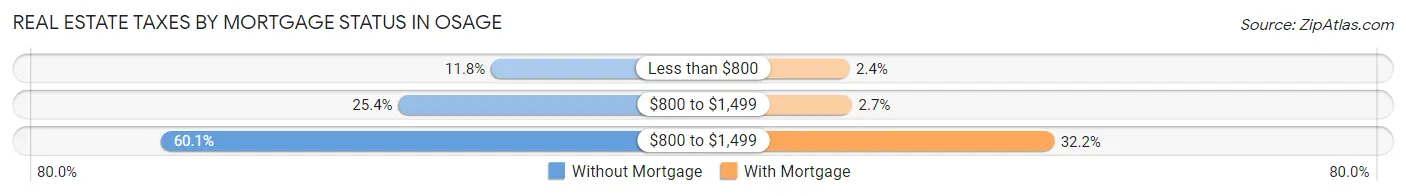
| Property Taxes | Without Mortgage | With Mortgage |
| Less than $800 | 62 (11.8%) | 20 (2.4%) |
| $800 to $1,499 | 133 (25.4%) | 23 (2.7%) |
| $800 to $1,499 | 315 (60.1%) | 274 (32.2%) |
| Total | 524 (100.0%) | 850 (100.0%) |
Health & Disability in Osage
Health Insurance Coverage by Age in Osage
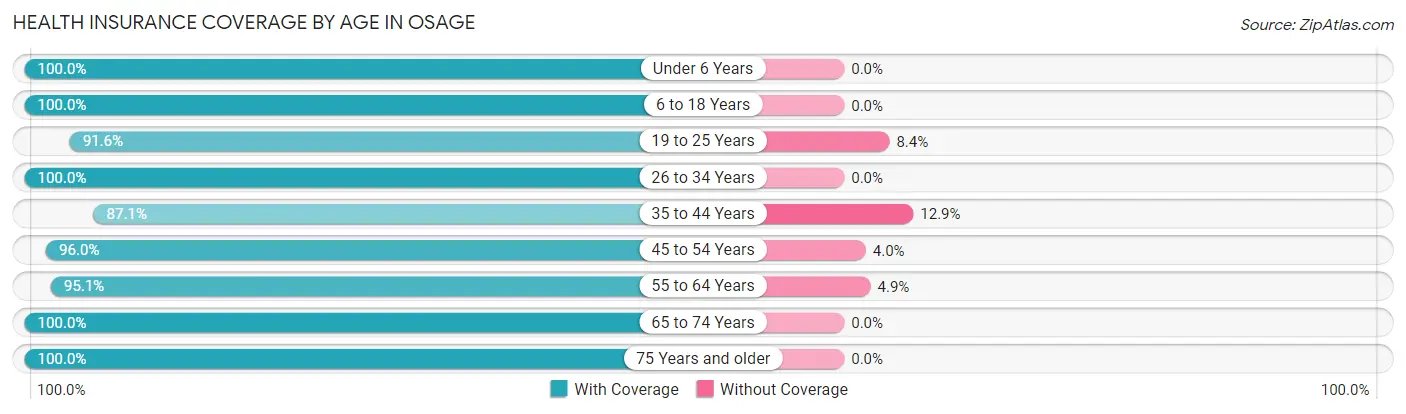
| Age Bracket | With Coverage | Without Coverage |
| Under 6 Years | 205 (100.0%) | 0 (0.0%) |
| 6 to 18 Years | 482 (100.0%) | 0 (0.0%) |
| 19 to 25 Years | 326 (91.6%) | 30 (8.4%) |
| 26 to 34 Years | 349 (100.0%) | 0 (0.0%) |
| 35 to 44 Years | 345 (87.1%) | 51 (12.9%) |
| 45 to 54 Years | 382 (96.0%) | 16 (4.0%) |
| 55 to 64 Years | 504 (95.1%) | 26 (4.9%) |
| 65 to 74 Years | 365 (100.0%) | 0 (0.0%) |
| 75 Years and older | 393 (100.0%) | 0 (0.0%) |
| Total | 3,351 (96.5%) | 123 (3.5%) |
Health Insurance Coverage by Citizenship Status in Osage
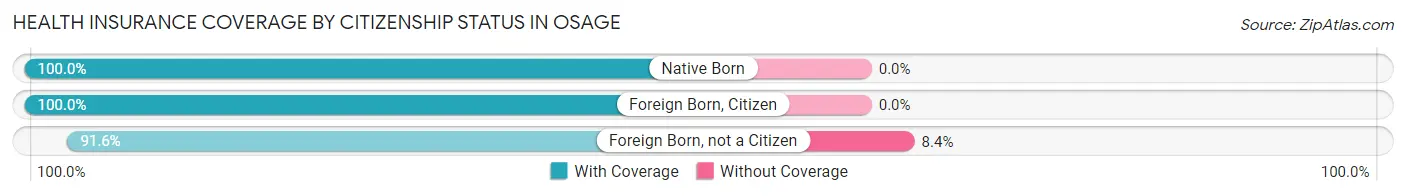
| Citizenship Status | With Coverage | Without Coverage |
| Native Born | 205 (100.0%) | 0 (0.0%) |
| Foreign Born, Citizen | 482 (100.0%) | 0 (0.0%) |
| Foreign Born, not a Citizen | 326 (91.6%) | 30 (8.4%) |
Health Insurance Coverage by Household Income in Osage
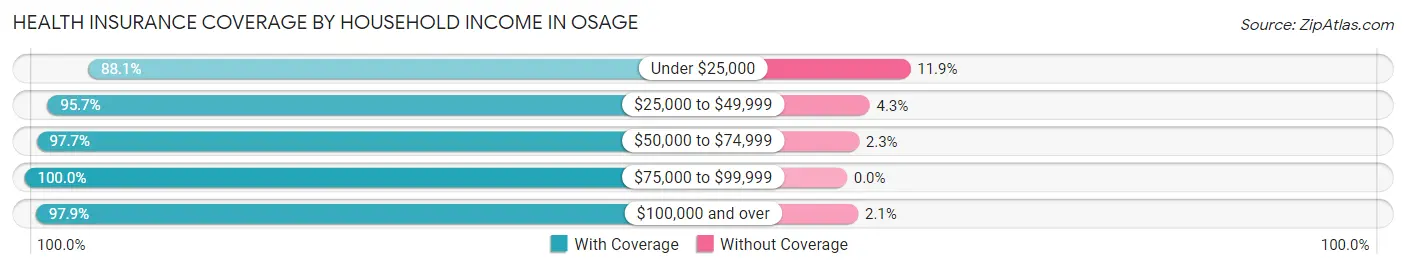
| Household Income | With Coverage | Without Coverage |
| Under $25,000 | 378 (88.1%) | 51 (11.9%) |
| $25,000 to $49,999 | 674 (95.7%) | 30 (4.3%) |
| $50,000 to $74,999 | 693 (97.7%) | 16 (2.3%) |
| $75,000 to $99,999 | 382 (100.0%) | 0 (0.0%) |
| $100,000 and over | 1,207 (97.9%) | 26 (2.1%) |
Public vs Private Health Insurance Coverage by Age in Osage
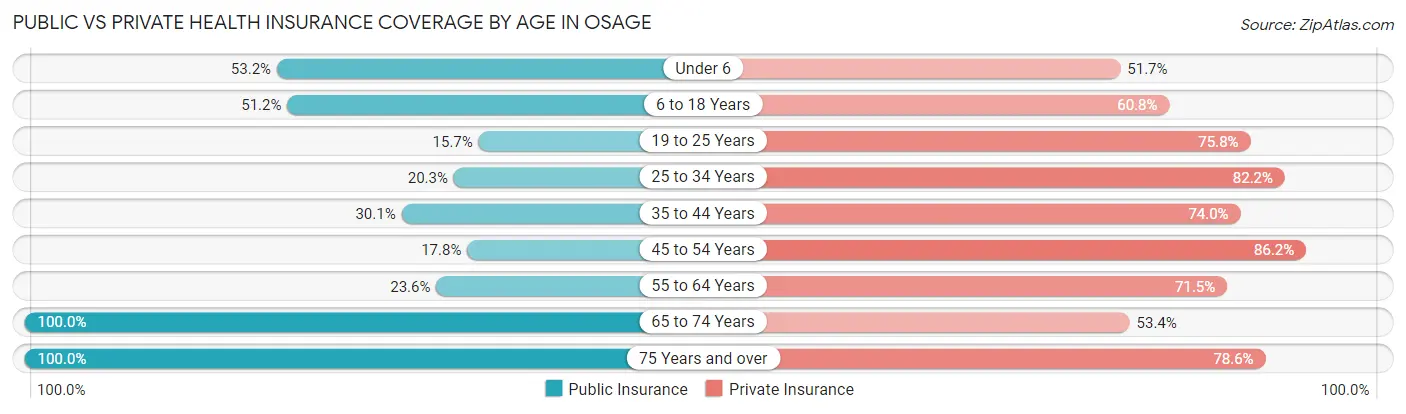
| Age Bracket | Public Insurance | Private Insurance |
| Under 6 | 109 (53.2%) | 106 (51.7%) |
| 6 to 18 Years | 247 (51.2%) | 293 (60.8%) |
| 19 to 25 Years | 56 (15.7%) | 270 (75.8%) |
| 25 to 34 Years | 71 (20.3%) | 287 (82.2%) |
| 35 to 44 Years | 119 (30.0%) | 293 (74.0%) |
| 45 to 54 Years | 71 (17.8%) | 343 (86.2%) |
| 55 to 64 Years | 125 (23.6%) | 379 (71.5%) |
| 65 to 74 Years | 365 (100.0%) | 195 (53.4%) |
| 75 Years and over | 393 (100.0%) | 309 (78.6%) |
| Total | 1,556 (44.8%) | 2,475 (71.2%) |
Disability Status by Sex by Age in Osage
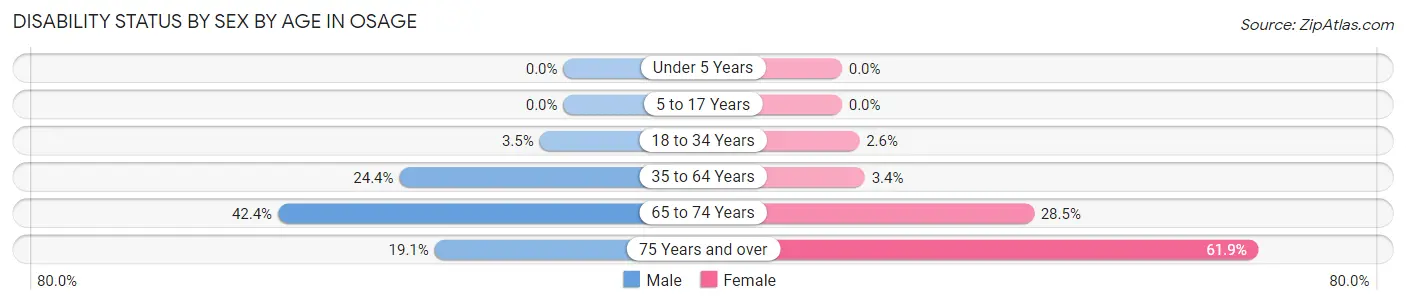
| Age Bracket | Male | Female |
| Under 5 Years | 0 (0.0%) | 0 (0.0%) |
| 5 to 17 Years | 0 (0.0%) | 0 (0.0%) |
| 18 to 34 Years | 14 (3.5%) | 9 (2.6%) |
| 35 to 64 Years | 151 (24.3%) | 24 (3.4%) |
| 65 to 74 Years | 64 (42.4%) | 61 (28.5%) |
| 75 Years and over | 26 (19.1%) | 159 (61.9%) |
Disability Class by Sex by Age in Osage
Disability Class: Hearing Difficulty
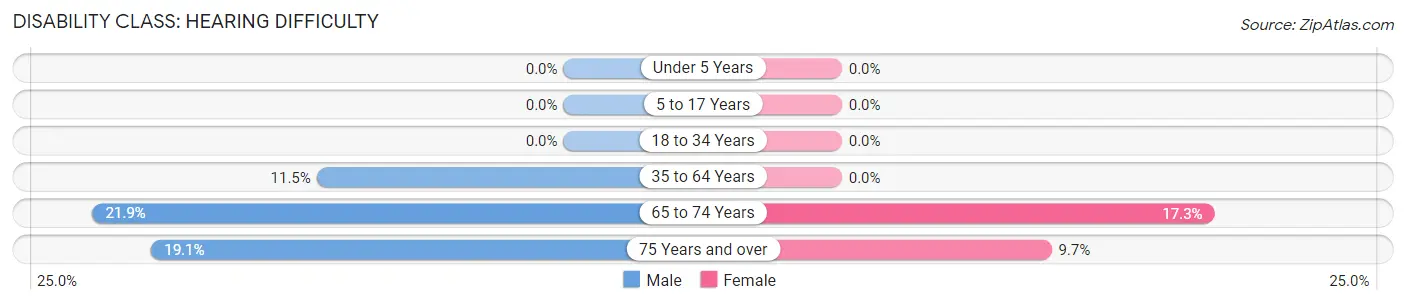
| Age Bracket | Male | Female |
| Under 5 Years | 0 (0.0%) | 0 (0.0%) |
| 5 to 17 Years | 0 (0.0%) | 0 (0.0%) |
| 18 to 34 Years | 0 (0.0%) | 0 (0.0%) |
| 35 to 64 Years | 71 (11.5%) | 0 (0.0%) |
| 65 to 74 Years | 33 (21.8%) | 37 (17.3%) |
| 75 Years and over | 26 (19.1%) | 25 (9.7%) |
Disability Class: Vision Difficulty
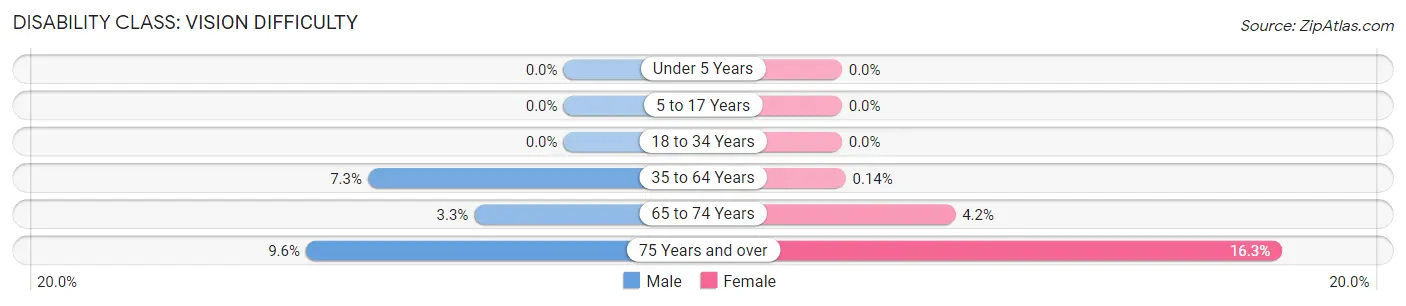
| Age Bracket | Male | Female |
| Under 5 Years | 0 (0.0%) | 0 (0.0%) |
| 5 to 17 Years | 0 (0.0%) | 0 (0.0%) |
| 18 to 34 Years | 0 (0.0%) | 0 (0.0%) |
| 35 to 64 Years | 45 (7.3%) | 1 (0.1%) |
| 65 to 74 Years | 5 (3.3%) | 9 (4.2%) |
| 75 Years and over | 13 (9.6%) | 42 (16.3%) |
Disability Class: Cognitive Difficulty
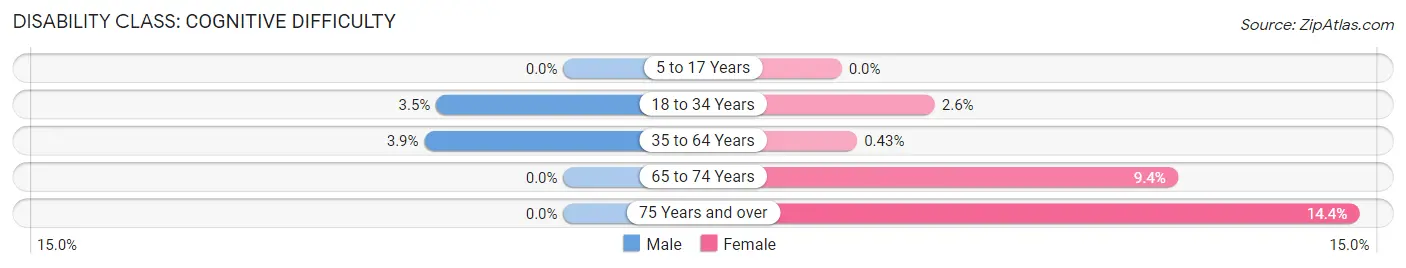
| Age Bracket | Male | Female |
| 5 to 17 Years | 0 (0.0%) | 0 (0.0%) |
| 18 to 34 Years | 14 (3.5%) | 9 (2.6%) |
| 35 to 64 Years | 24 (3.9%) | 3 (0.4%) |
| 65 to 74 Years | 0 (0.0%) | 20 (9.3%) |
| 75 Years and over | 0 (0.0%) | 37 (14.4%) |
Disability Class: Ambulatory Difficulty
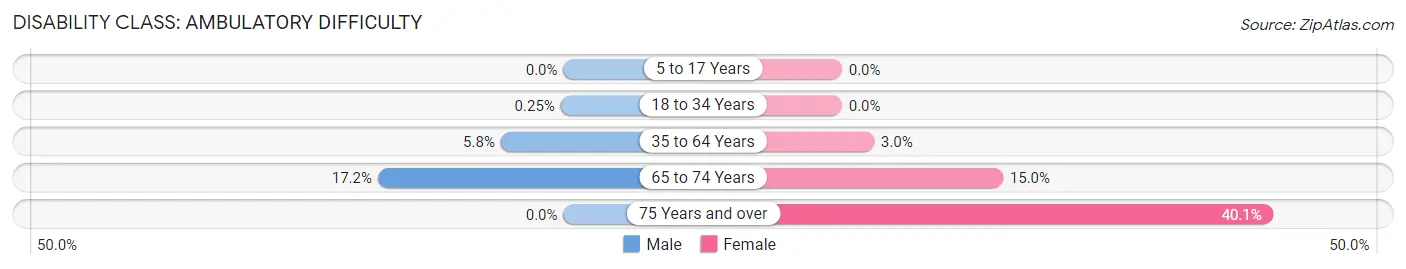
| Age Bracket | Male | Female |
| 5 to 17 Years | 0 (0.0%) | 0 (0.0%) |
| 18 to 34 Years | 1 (0.3%) | 0 (0.0%) |
| 35 to 64 Years | 36 (5.8%) | 21 (3.0%) |
| 65 to 74 Years | 26 (17.2%) | 32 (14.9%) |
| 75 Years and over | 0 (0.0%) | 103 (40.1%) |
Disability Class: Self-Care Difficulty
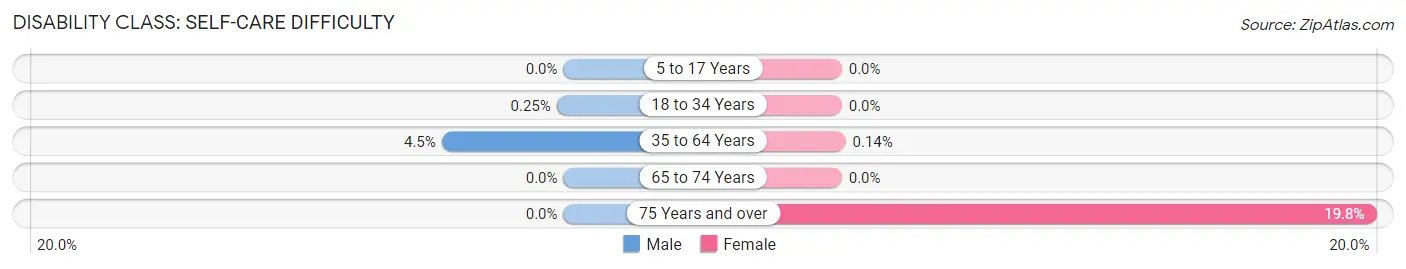
| Age Bracket | Male | Female |
| 5 to 17 Years | 0 (0.0%) | 0 (0.0%) |
| 18 to 34 Years | 1 (0.3%) | 0 (0.0%) |
| 35 to 64 Years | 28 (4.5%) | 1 (0.1%) |
| 65 to 74 Years | 0 (0.0%) | 0 (0.0%) |
| 75 Years and over | 0 (0.0%) | 51 (19.8%) |
Technology Access in Osage
Computing Device Access in Osage
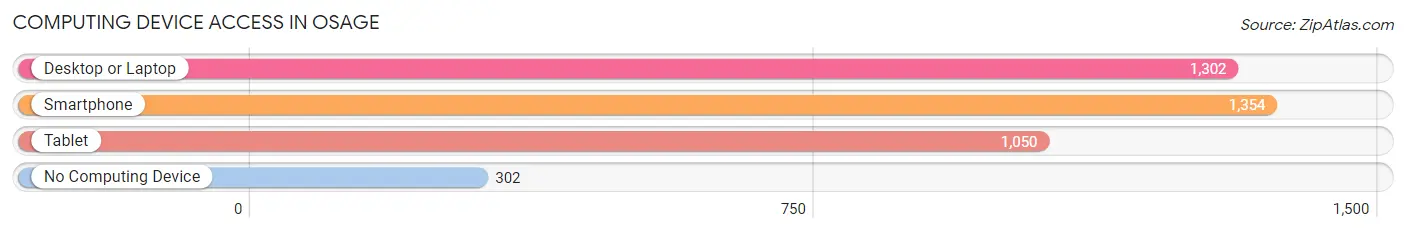
| Device Type | # Households | % Households |
| Desktop or Laptop | 1,302 | 74.0% |
| Smartphone | 1,354 | 76.9% |
| Tablet | 1,050 | 59.7% |
| No Computing Device | 302 | 17.2% |
| Total | 1,760 | 100.0% |
Internet Access in Osage
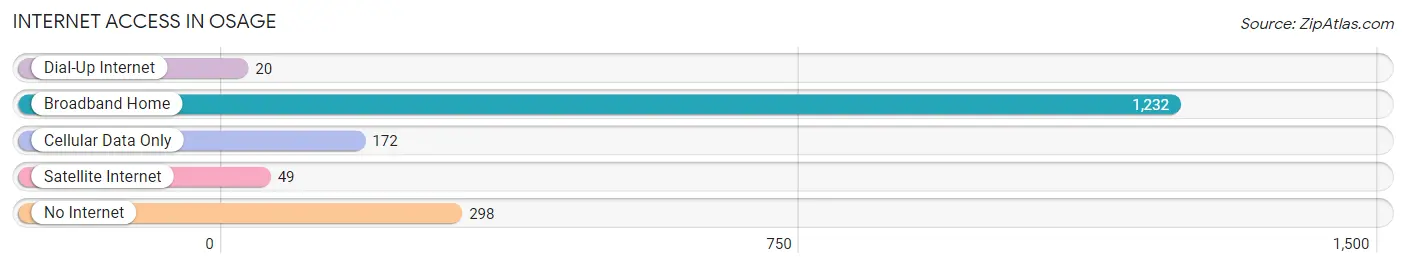
| Internet Type | # Households | % Households |
| Dial-Up Internet | 20 | 1.1% |
| Broadband Home | 1,232 | 70.0% |
| Cellular Data Only | 172 | 9.8% |
| Satellite Internet | 49 | 2.8% |
| No Internet | 298 | 16.9% |
| Total | 1,760 | 100.0% |
Osage Summary
Osage, Iowa is a small city located in Mitchell County, Iowa, United States. It is situated along the Cedar River and is the county seat of Mitchell County. The population of Osage was 3,737 at the 2010 census, making it the largest city in the county.
History
Osage was founded in 1856 by settlers from Ohio, Pennsylvania, and New York. The city was named after the Osage Indians, who had previously inhabited the area. The first settlers arrived in the area in 1854 and the city was officially incorporated in 1858.
Osage was an important stop on the Chicago, Milwaukee, St. Paul and Pacific Railroad, which ran through the city from 1881 to 1980. The railroad was a major factor in the growth of the city, as it allowed for the transportation of goods and people to and from the city.
Osage was also an important center for the lumber industry. The city was home to several sawmills and lumber yards, which provided employment for many of the city’s residents.
Geography
Osage is located at the intersection of U.S. Route 218 and Iowa Highway 9, approximately 50 miles north of Waterloo and 60 miles south of Mason City. The city is situated along the Cedar River, which flows through the city and provides a source of recreation for the city’s residents.
Osage has a total area of 4.2 square miles, all of which is land. The city has a humid continental climate, with cold winters and hot, humid summers.
Economy
Osage’s economy is largely based on agriculture and manufacturing. The city is home to several manufacturing companies, including a furniture factory, a plastics factory, and a metal fabrication plant.
Agriculture is also an important part of the city’s economy. The surrounding area is home to several farms, which produce corn, soybeans, and other crops.
Demographics
As of the 2010 census, Osage had a population of 3,737. The racial makeup of the city was 97.2% White, 0.3% African American, 0.2% Native American, 0.4% Asian, 0.1% Pacific Islander, 0.7% from other races, and 1.1% from two or more races. Hispanic or Latino of any race were 2.2% of the population.
The median income for a household in Osage was $41,944, and the median income for a family was $50,917. The per capita income for the city was $20,845. About 8.2% of families and 10.3% of the population were below the poverty line, including 14.2% of those under age 18 and 8.2% of those age 65 or over.
Osage is served by the Osage Community School District, which consists of two elementary schools, one middle school, and one high school. The city is also home to a branch of the Mitchell County Library.
Common Questions
What is Per Capita Income in Osage?
Per Capita income in Osage is $35,179.
What is the Median Family Income in Osage?
Median Family Income in Osage is $86,538.
What is the Median Household income in Osage?
Median Household Income in Osage is $56,667.
What is Income or Wage Gap in Osage?
Income or Wage Gap in Osage is 23.0%.
Women in Osage earn 77.0 cents for every dollar earned by a man.
What is Inequality or Gini Index in Osage?
Inequality or Gini Index in Osage is 0.42.
What is the Total Population of Osage?
Total Population of Osage is 3,590.
What is the Total Male Population of Osage?
Total Male Population of Osage is 1,686.
What is the Total Female Population of Osage?
Total Female Population of Osage is 1,904.
What is the Ratio of Males per 100 Females in Osage?
There are 88.55 Males per 100 Females in Osage.
What is the Ratio of Females per 100 Males in Osage?
There are 112.93 Females per 100 Males in Osage.
What is the Median Population Age in Osage?
Median Population Age in Osage is 44.8 Years.
What is the Average Family Size in Osage
Average Family Size in Osage is 2.6 People.
What is the Average Household Size in Osage
Average Household Size in Osage is 2.0 People.
How Large is the Labor Force in Osage?
There are 1,968 People in the Labor Forcein in Osage.
What is the Percentage of People in the Labor Force in Osage?
65.7% of People are in the Labor Force in Osage.
What is the Unemployment Rate in Osage?
Unemployment Rate in Osage is 1.2%.