Sabula, IA Map & Demographics
Sabula Map
Sabula Overview
$28,019
PER CAPITA INCOME
$74,821
AVG FAMILY INCOME
$54,375
AVG HOUSEHOLD INCOME
40.1%
WAGE / INCOME GAP [ % ]
59.9¢/ $1
WAGE / INCOME GAP [ $ ]
0.39
INEQUALITY / GINI INDEX
548
TOTAL POPULATION
291
MALE POPULATION
257
FEMALE POPULATION
113.23
MALES / 100 FEMALES
88.32
FEMALES / 100 MALES
46.8
MEDIAN AGE
2.8
AVG FAMILY SIZE
2.3
AVG HOUSEHOLD SIZE
240
LABOR FORCE [ PEOPLE ]
50.8%
PERCENT IN LABOR FORCE
4.6%
UNEMPLOYMENT RATE
Sabula Zip Codes
Sabula Area Codes
Income in Sabula
Income Overview in Sabula
Per Capita Income in Sabula is $28,019, while median incomes of families and households are $74,821 and $54,375 respectively.
| Characteristic | Number | Measure |
| Per Capita Income | 548 | $28,019 |
| Median Family Income | 160 | $74,821 |
| Mean Family Income | 160 | $77,375 |
| Median Household Income | 240 | $54,375 |
| Mean Household Income | 240 | $63,355 |
| Income Deficit | 160 | $0 |
| Wage / Income Gap (%) | 548 | 40.13% |
| Wage / Income Gap ($) | 548 | 59.87¢ per $1 |
| Gini / Inequality Index | 548 | 0.39 |
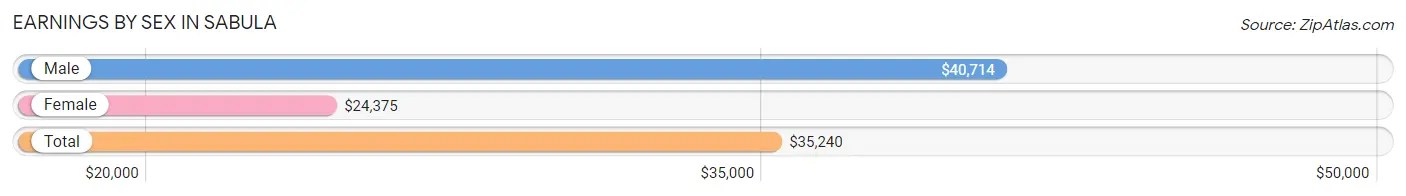
Earnings by Sex in Sabula
Average Earnings in Sabula are $35,240, $40,714 for men and $24,375 for women, a difference of 40.1%.
| Sex | Number | Average Earnings |
| Male | 130 (52.2%) | $40,714 |
| Female | 119 (47.8%) | $24,375 |
| Total | 249 (100.0%) | $35,240 |
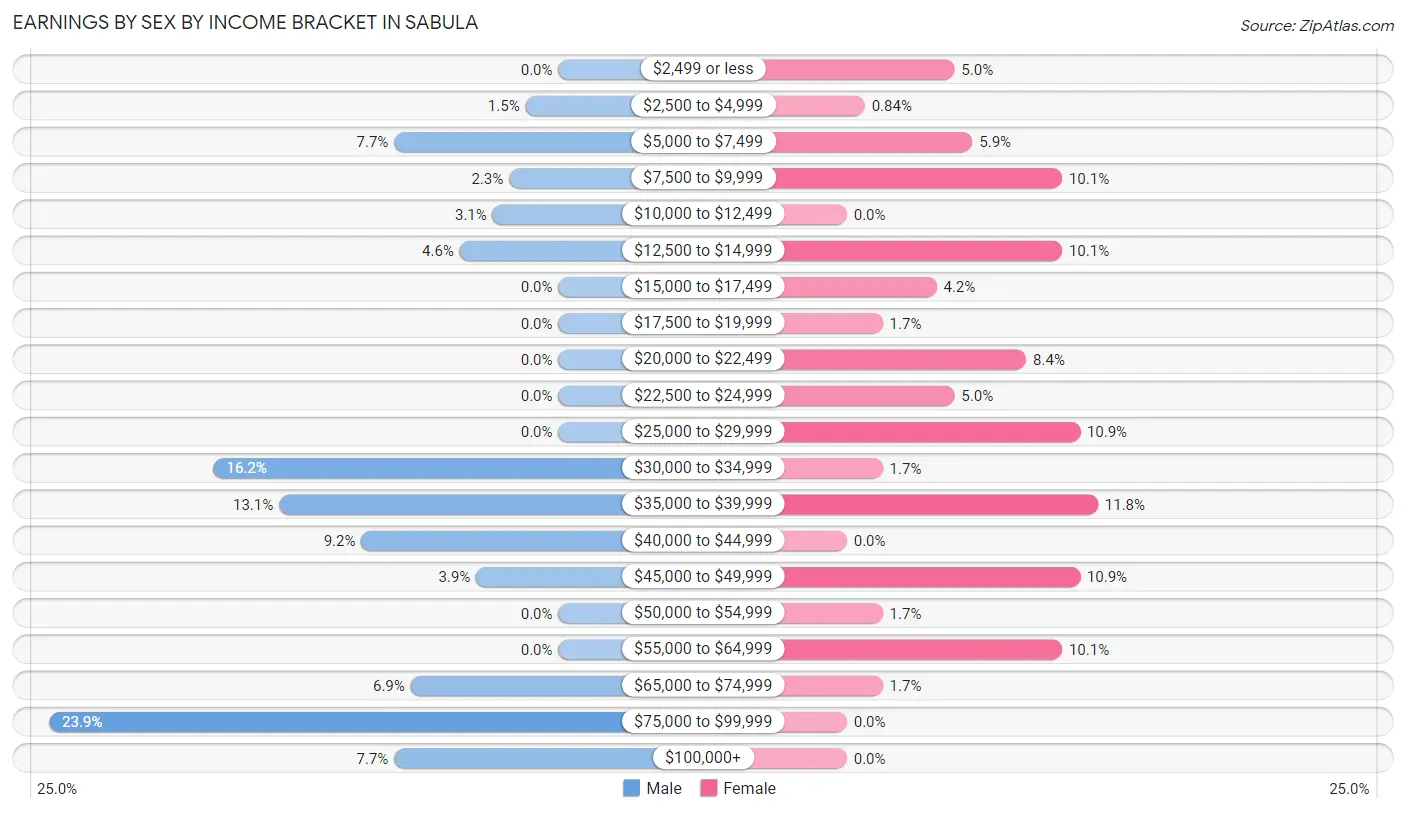
Earnings by Sex by Income Bracket in Sabula
The most common earnings brackets in Sabula are $75,000 to $99,999 for men (31 | 23.8%) and $35,000 to $39,999 for women (14 | 11.8%).
| Income | Male | Female |
| $2,499 or less | 0 (0.0%) | 6 (5.0%) |
| $2,500 to $4,999 | 2 (1.5%) | 1 (0.8%) |
| $5,000 to $7,499 | 10 (7.7%) | 7 (5.9%) |
| $7,500 to $9,999 | 3 (2.3%) | 12 (10.1%) |
| $10,000 to $12,499 | 4 (3.1%) | 0 (0.0%) |
| $12,500 to $14,999 | 6 (4.6%) | 12 (10.1%) |
| $15,000 to $17,499 | 0 (0.0%) | 5 (4.2%) |
| $17,500 to $19,999 | 0 (0.0%) | 2 (1.7%) |
| $20,000 to $22,499 | 0 (0.0%) | 10 (8.4%) |
| $22,500 to $24,999 | 0 (0.0%) | 6 (5.0%) |
| $25,000 to $29,999 | 0 (0.0%) | 13 (10.9%) |
| $30,000 to $34,999 | 21 (16.2%) | 2 (1.7%) |
| $35,000 to $39,999 | 17 (13.1%) | 14 (11.8%) |
| $40,000 to $44,999 | 12 (9.2%) | 0 (0.0%) |
| $45,000 to $49,999 | 5 (3.8%) | 13 (10.9%) |
| $50,000 to $54,999 | 0 (0.0%) | 2 (1.7%) |
| $55,000 to $64,999 | 0 (0.0%) | 12 (10.1%) |
| $65,000 to $74,999 | 9 (6.9%) | 2 (1.7%) |
| $75,000 to $99,999 | 31 (23.8%) | 0 (0.0%) |
| $100,000+ | 10 (7.7%) | 0 (0.0%) |
| Total | 130 (100.0%) | 119 (100.0%) |
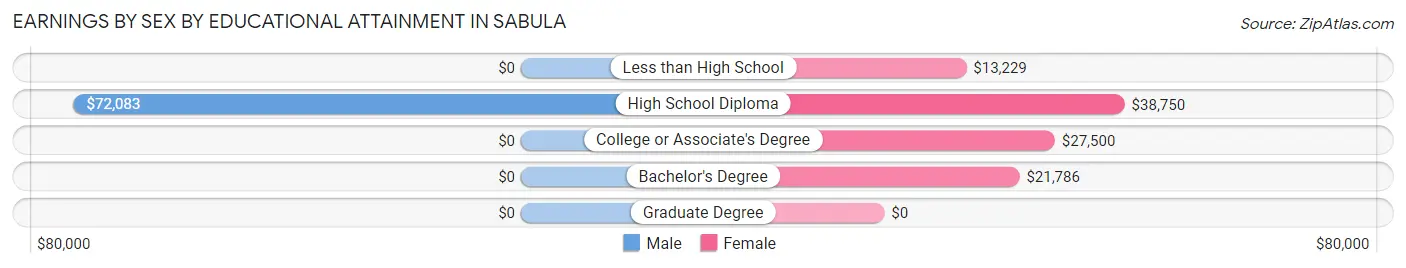
Earnings by Sex by Educational Attainment in Sabula
Average earnings in Sabula are $47,000 for men and $27,955 for women, a difference of 40.5%. Men with an educational attainment of high school diploma enjoy the highest average annual earnings of $72,083, while those with high school diploma education earn the least with $72,083. Women with an educational attainment of high school diploma earn the most with the average annual earnings of $38,750, while those with less than high school education have the smallest earnings of $13,229.
| Educational Attainment | Male Income | Female Income |
| Less than High School | - | - |
| High School Diploma | $72,083 | $38,750 |
| College or Associate's Degree | - | - |
| Bachelor's Degree | - | - |
| Graduate Degree | - | - |
| Total | $47,000 | $27,955 |
Family Income in Sabula
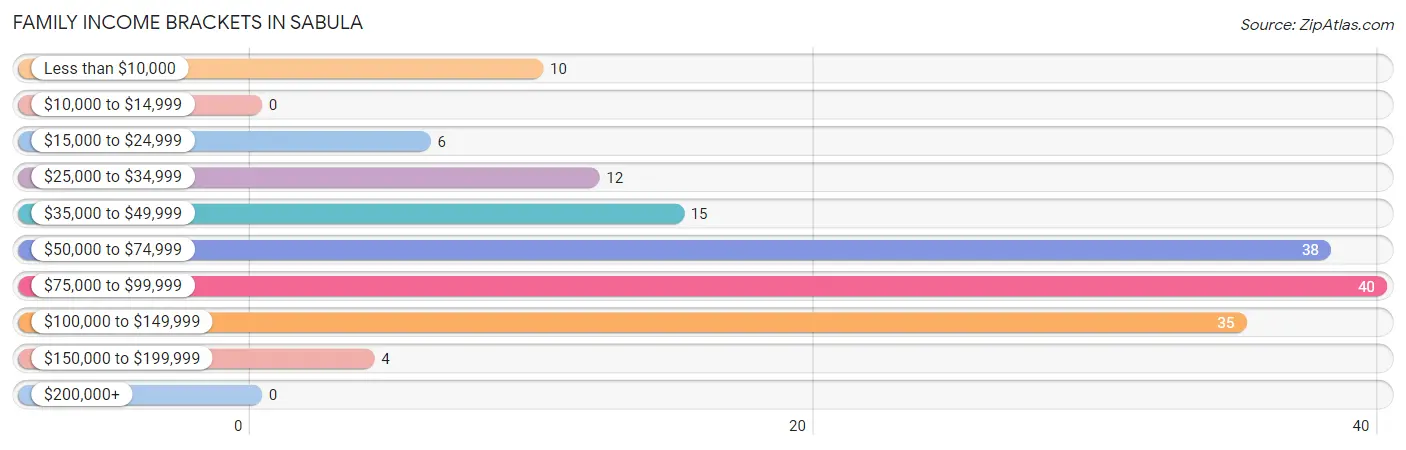
Family Income Brackets in Sabula
According to the Sabula family income data, there are 40 families falling into the $75,000 to $99,999 income range, which is the most common income bracket and makes up 25.0% of all families.
| Income Bracket | # Families | % Families |
| Less than $10,000 | 10 | 6.3% |
| $10,000 to $14,999 | 0 | 0.0% |
| $15,000 to $24,999 | 6 | 3.8% |
| $25,000 to $34,999 | 12 | 7.5% |
| $35,000 to $49,999 | 15 | 9.4% |
| $50,000 to $74,999 | 38 | 23.8% |
| $75,000 to $99,999 | 40 | 25.0% |
| $100,000 to $149,999 | 35 | 21.9% |
| $150,000 to $199,999 | 4 | 2.5% |
| $200,000+ | 0 | 0.0% |
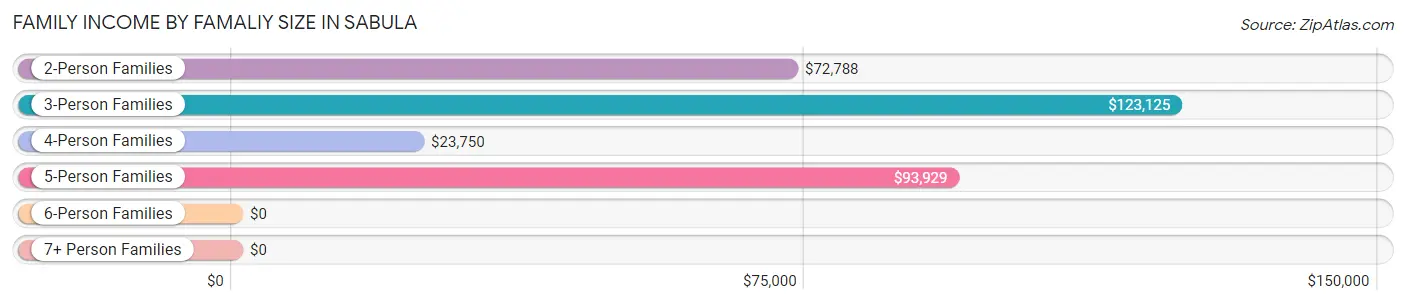
Family Income by Famaliy Size in Sabula
3-person families (31 | 19.4%) account for the highest median family income in Sabula with $123,125 per family, while 3-person families (31 | 19.4%) have the highest median income of $41,042 per family member.
| Income Bracket | # Families | Median Income |
| 2-Person Families | 103 (64.4%) | $72,788 |
| 3-Person Families | 31 (19.4%) | $123,125 |
| 4-Person Families | 9 (5.6%) | $23,750 |
| 5-Person Families | 10 (6.2%) | $93,929 |
| 6-Person Families | 7 (4.4%) | $0 |
| 7+ Person Families | 0 (0.0%) | $0 |
| Total | 160 (100.0%) | $74,821 |
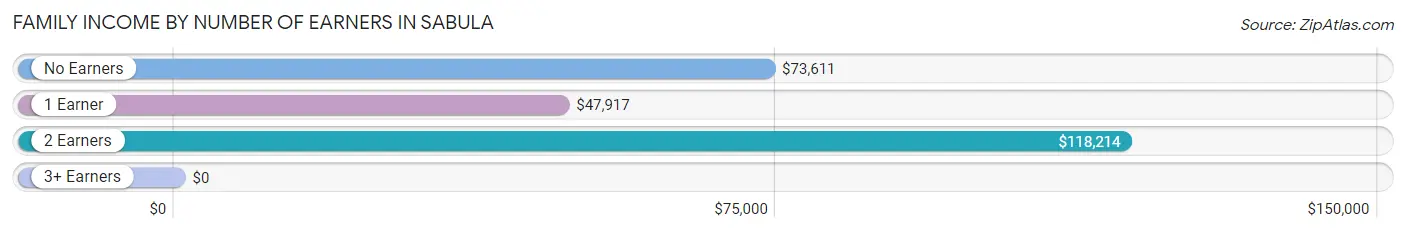
Family Income by Number of Earners in Sabula
| Number of Earners | # Families | Median Income |
| No Earners | 50 (31.2%) | $73,611 |
| 1 Earner | 47 (29.4%) | $47,917 |
| 2 Earners | 54 (33.8%) | $118,214 |
| 3+ Earners | 9 (5.6%) | $0 |
| Total | 160 (100.0%) | $74,821 |
Household Income in Sabula
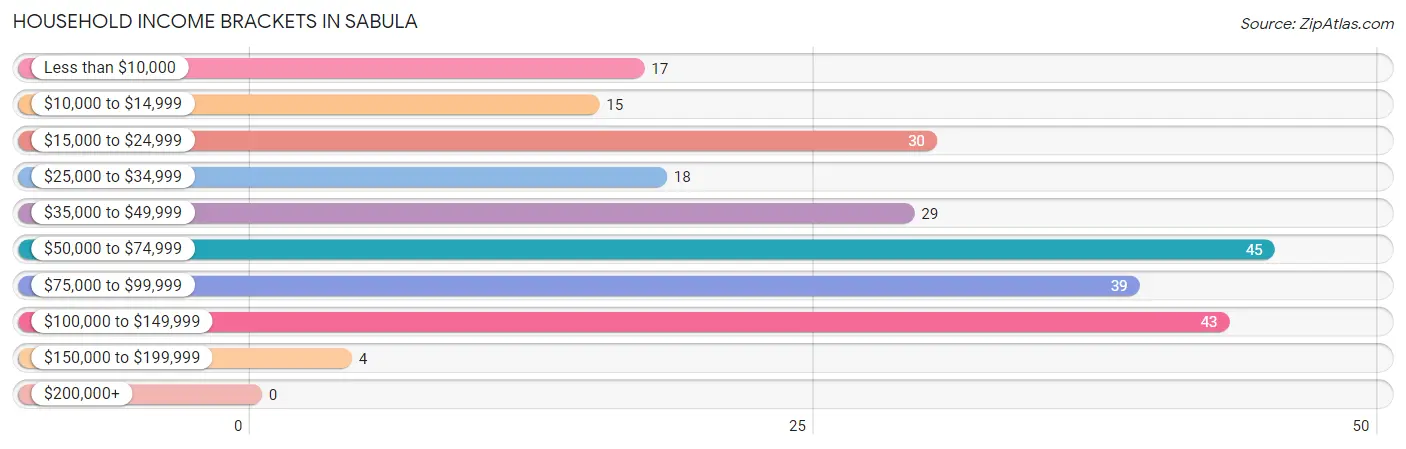
Household Income Brackets in Sabula
With 45 households falling in the category, the $50,000 to $74,999 income range is the most frequent in Sabula, accounting for 18.8% of all households.
| Income Bracket | # Households | % Households |
| Less than $10,000 | 17 | 7.1% |
| $10,000 to $14,999 | 15 | 6.3% |
| $15,000 to $24,999 | 30 | 12.5% |
| $25,000 to $34,999 | 18 | 7.5% |
| $35,000 to $49,999 | 29 | 12.1% |
| $50,000 to $74,999 | 45 | 18.8% |
| $75,000 to $99,999 | 39 | 16.3% |
| $100,000 to $149,999 | 43 | 17.9% |
| $150,000 to $199,999 | 4 | 1.7% |
| $200,000+ | 0 | 0.0% |
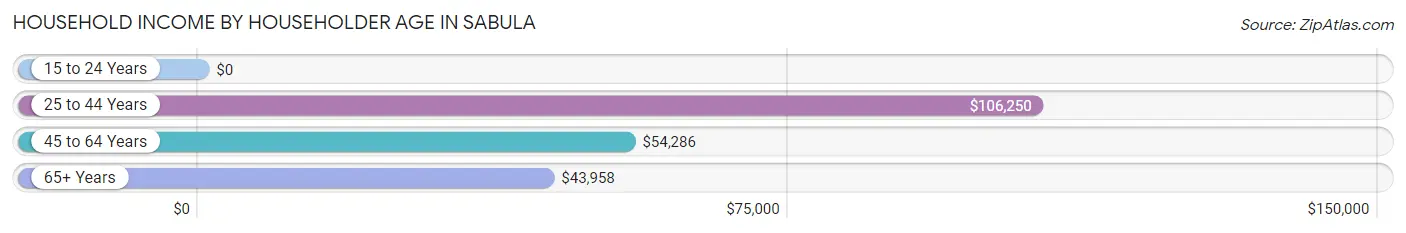
Household Income by Householder Age in Sabula
The median household income in Sabula is $54,375, with the highest median household income of $106,250 found in the 25 to 44 years age bracket for the primary householder. A total of 60 households (25.0%) fall into this category. Meanwhile, the 15 to 24 years age bracket for the primary householder has the lowest median household income of $0, with 6 households (2.5%) in this group.
| Income Bracket | # Households | Median Income |
| 15 to 24 Years | 6 (2.5%) | $0 |
| 25 to 44 Years | 60 (25.0%) | $106,250 |
| 45 to 64 Years | 80 (33.3%) | $54,286 |
| 65+ Years | 94 (39.2%) | $43,958 |
| Total | 240 (100.0%) | $54,375 |
Poverty in Sabula
Income Below Poverty by Sex and Age in Sabula
With 15.5% poverty level for males and 12.6% for females among the residents of Sabula, 5 year old males and 18 to 24 year old females are the most vulnerable to poverty, with 3 males (100.0%) and 8 females (53.3%) in their respective age groups living below the poverty level.
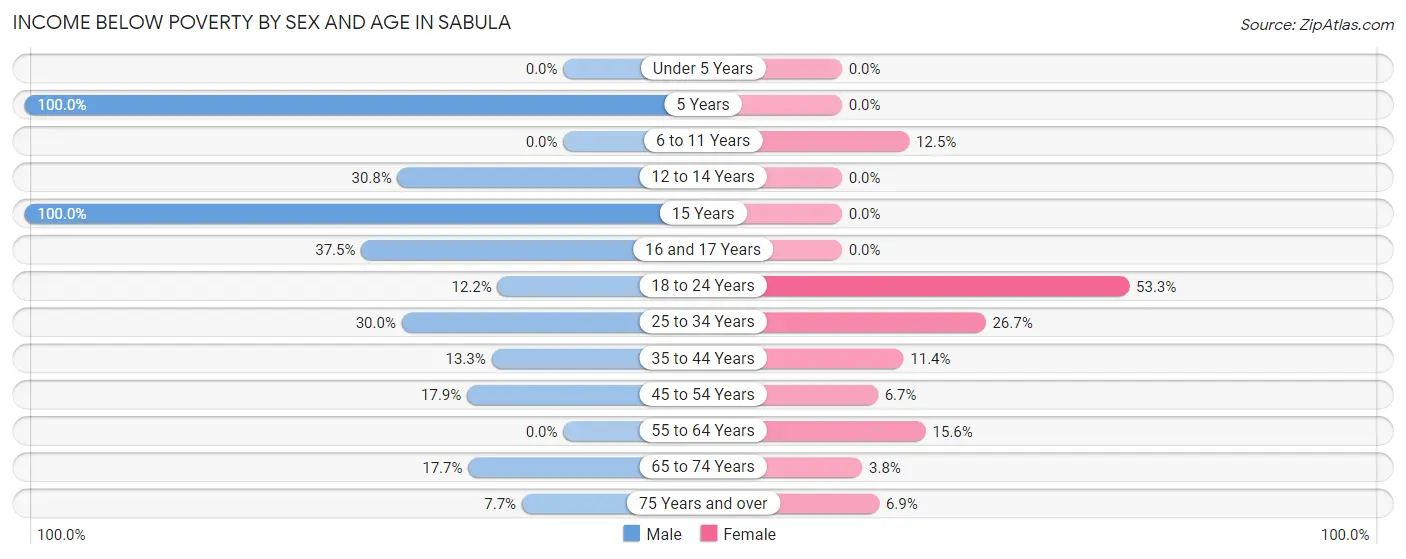
| Age Bracket | Male | Female |
| Under 5 Years | 0 (0.0%) | 0 (0.0%) |
| 5 Years | 3 (100.0%) | 0 (0.0%) |
| 6 to 11 Years | 0 (0.0%) | 3 (12.5%) |
| 12 to 14 Years | 4 (30.8%) | 0 (0.0%) |
| 15 Years | 2 (100.0%) | 0 (0.0%) |
| 16 and 17 Years | 6 (37.5%) | 0 (0.0%) |
| 18 to 24 Years | 5 (12.2%) | 8 (53.3%) |
| 25 to 34 Years | 6 (30.0%) | 4 (26.7%) |
| 35 to 44 Years | 6 (13.3%) | 4 (11.4%) |
| 45 to 54 Years | 5 (17.9%) | 2 (6.7%) |
| 55 to 64 Years | 0 (0.0%) | 7 (15.6%) |
| 65 to 74 Years | 6 (17.6%) | 2 (3.8%) |
| 75 Years and over | 2 (7.7%) | 2 (6.9%) |
| Total | 45 (15.5%) | 32 (12.6%) |
Income Above Poverty by Sex and Age in Sabula
According to the poverty statistics in Sabula, males aged under 5 years and females aged under 5 years are the age groups that are most secure financially, with 100.0% of males and 100.0% of females in these age groups living above the poverty line.
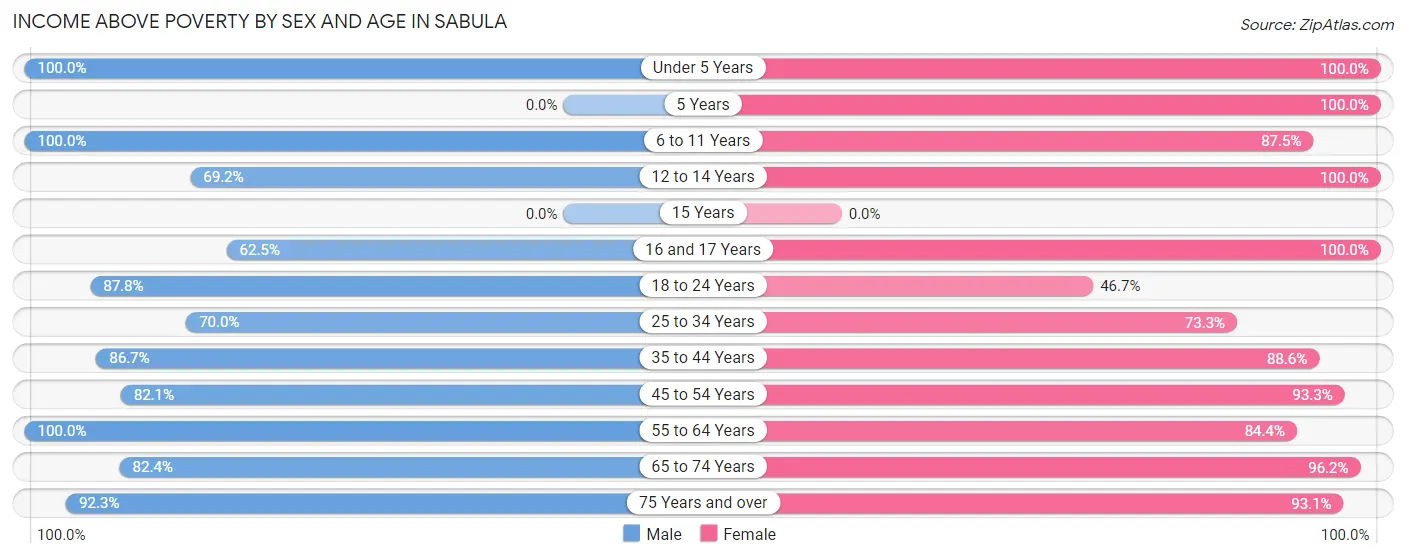
| Age Bracket | Male | Female |
| Under 5 Years | 3 (100.0%) | 3 (100.0%) |
| 5 Years | 0 (0.0%) | 1 (100.0%) |
| 6 to 11 Years | 23 (100.0%) | 21 (87.5%) |
| 12 to 14 Years | 9 (69.2%) | 2 (100.0%) |
| 15 Years | 0 (0.0%) | 0 (0.0%) |
| 16 and 17 Years | 10 (62.5%) | 3 (100.0%) |
| 18 to 24 Years | 36 (87.8%) | 7 (46.7%) |
| 25 to 34 Years | 14 (70.0%) | 11 (73.3%) |
| 35 to 44 Years | 39 (86.7%) | 31 (88.6%) |
| 45 to 54 Years | 23 (82.1%) | 28 (93.3%) |
| 55 to 64 Years | 37 (100.0%) | 38 (84.4%) |
| 65 to 74 Years | 28 (82.4%) | 51 (96.2%) |
| 75 Years and over | 24 (92.3%) | 27 (93.1%) |
| Total | 246 (84.5%) | 223 (87.5%) |
Income Below Poverty Among Married-Couple Families in Sabula
The poverty statistics for married-couple families in Sabula show that 5.8% or 8 of the total 139 families live below the poverty line. Families with no children have the highest poverty rate of 7.8%, comprising of 8 families. On the other hand, families with 1 or 2 children have the lowest poverty rate of 0.0%, which includes 0 families.
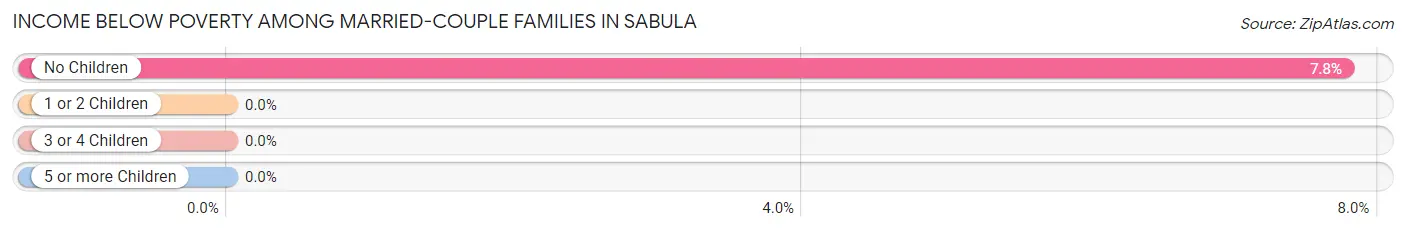
| Children | Above Poverty | Below Poverty |
| No Children | 95 (92.2%) | 8 (7.8%) |
| 1 or 2 Children | 26 (100.0%) | 0 (0.0%) |
| 3 or 4 Children | 10 (100.0%) | 0 (0.0%) |
| 5 or more Children | 0 (0.0%) | 0 (0.0%) |
| Total | 131 (94.2%) | 8 (5.8%) |
Income Below Poverty Among Single-Parent Households in Sabula
According to the poverty data in Sabula, 71.4% or 5 single-father households and 14.3% or 2 single-mother households are living below the poverty line. Among single-father households, those with 1 or 2 children have the highest poverty rate, with 5 households (71.4%) experiencing poverty. Likewise, among single-mother households, those with 3 or 4 children have the highest poverty rate, with 2 households (100.0%) falling below the poverty line.
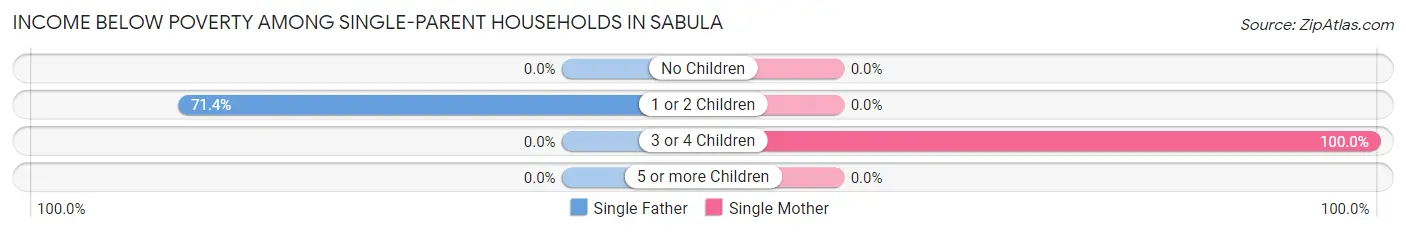
| Children | Single Father | Single Mother |
| No Children | 0 (0.0%) | 0 (0.0%) |
| 1 or 2 Children | 5 (71.4%) | 0 (0.0%) |
| 3 or 4 Children | 0 (0.0%) | 2 (100.0%) |
| 5 or more Children | 0 (0.0%) | 0 (0.0%) |
| Total | 5 (71.4%) | 2 (14.3%) |
Income Below Poverty Among Married-Couple vs Single-Parent Households in Sabula
The poverty data for Sabula shows that 8 of the married-couple family households (5.8%) and 7 of the single-parent households (33.3%) are living below the poverty level. Within the married-couple family households, those with no children have the highest poverty rate, with 8 households (7.8%) falling below the poverty line. Among the single-parent households, those with 3 or 4 children have the highest poverty rate, with 2 household (100.0%) living below poverty.
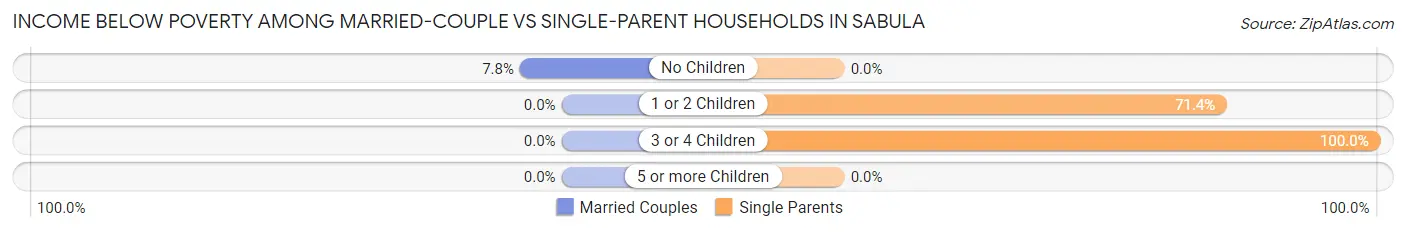
| Children | Married-Couple Families | Single-Parent Households |
| No Children | 8 (7.8%) | 0 (0.0%) |
| 1 or 2 Children | 0 (0.0%) | 5 (71.4%) |
| 3 or 4 Children | 0 (0.0%) | 2 (100.0%) |
| 5 or more Children | 0 (0.0%) | 0 (0.0%) |
| Total | 8 (5.8%) | 7 (33.3%) |
Race in Sabula
The most populous races in Sabula are White / Caucasian (532 | 97.1%), Hispanic or Latino (9 | 1.6%), and Asian (7 | 1.3%).
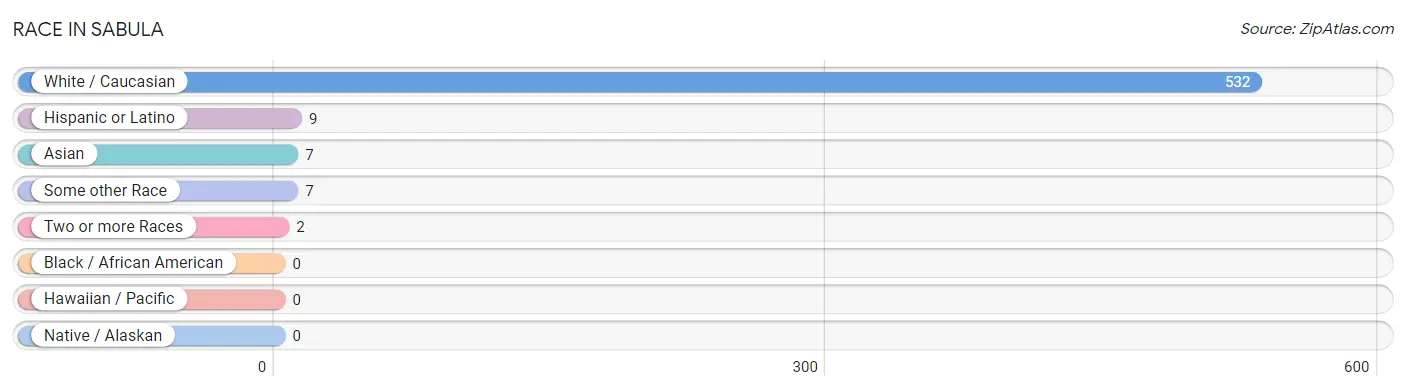
| Race | # Population | % Population |
| Asian | 7 | 1.3% |
| Black / African American | 0 | 0.0% |
| Hawaiian / Pacific | 0 | 0.0% |
| Hispanic or Latino | 9 | 1.6% |
| Native / Alaskan | 0 | 0.0% |
| White / Caucasian | 532 | 97.1% |
| Two or more Races | 2 | 0.4% |
| Some other Race | 7 | 1.3% |
| Total | 548 | 100.0% |
Ancestry in Sabula
The most populous ancestries reported in Sabula are German (205 | 37.4%), Irish (62 | 11.3%), English (49 | 8.9%), American (21 | 3.8%), and Dutch (19 | 3.5%), together accounting for 65.0% of all Sabula residents.
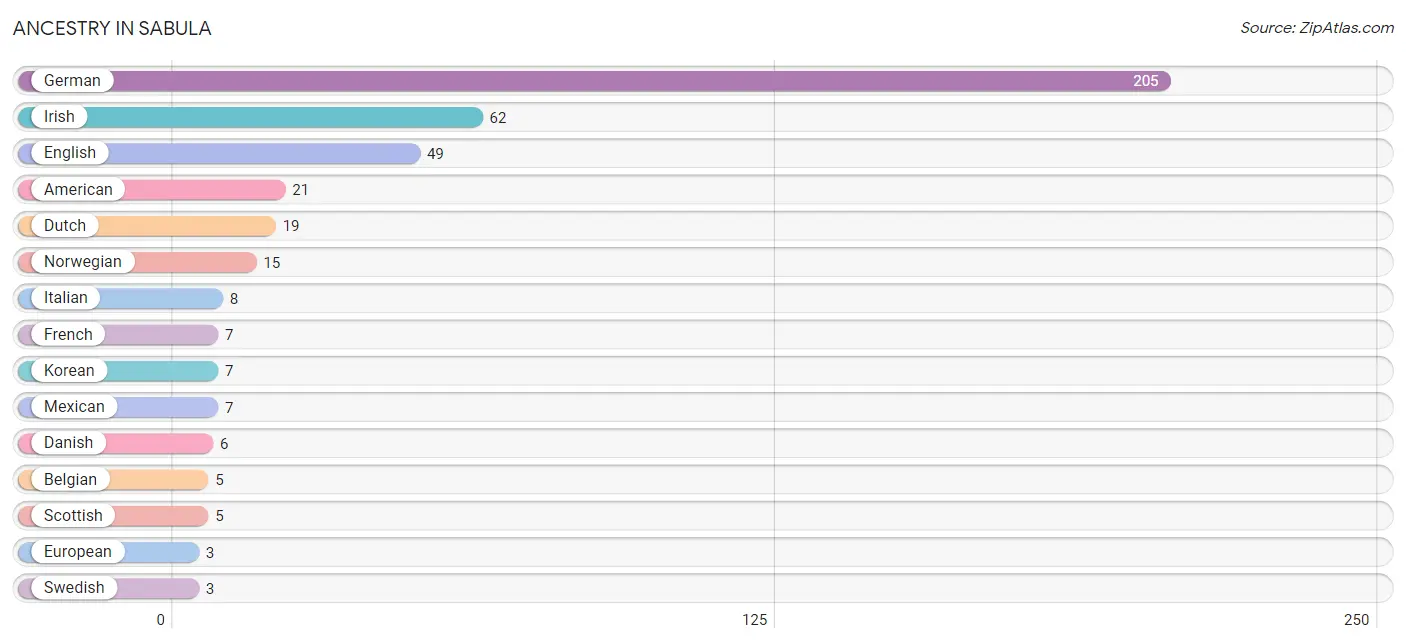
| Ancestry | # Population | % Population |
| American | 21 | 3.8% |
| Belgian | 5 | 0.9% |
| Burmese | 2 | 0.4% |
| Danish | 6 | 1.1% |
| Dutch | 19 | 3.5% |
| English | 49 | 8.9% |
| European | 3 | 0.5% |
| French | 7 | 1.3% |
| French Canadian | 2 | 0.4% |
| German | 205 | 37.4% |
| Irish | 62 | 11.3% |
| Italian | 8 | 1.5% |
| Korean | 7 | 1.3% |
| Mexican | 7 | 1.3% |
| Norwegian | 15 | 2.7% |
| Scottish | 5 | 0.9% |
| Serbian | 2 | 0.4% |
| Swedish | 3 | 0.5% |
| Swiss | 2 | 0.4% | View All 19 Rows |
Immigrants in Sabula
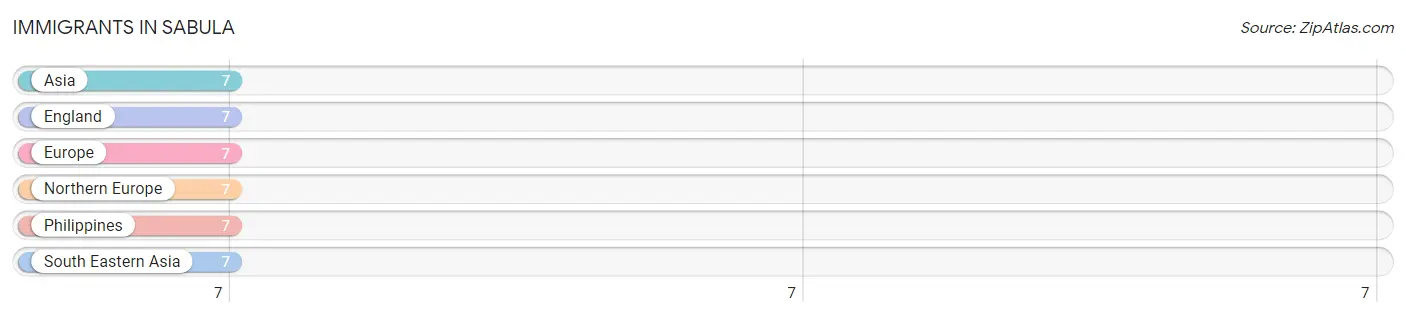
The most numerous immigrant groups reported in Sabula came from Asia (7 | 1.3%), England (7 | 1.3%), Europe (7 | 1.3%), Northern Europe (7 | 1.3%), and Philippines (7 | 1.3%), together accounting for 6.4% of all Sabula residents.
| Immigration Origin | # Population | % Population |
| Asia | 7 | 1.3% |
| England | 7 | 1.3% |
| Europe | 7 | 1.3% |
| Northern Europe | 7 | 1.3% |
| Philippines | 7 | 1.3% |
| South Eastern Asia | 7 | 1.3% | View All 6 Rows |
Sex and Age in Sabula
Sex and Age in Sabula
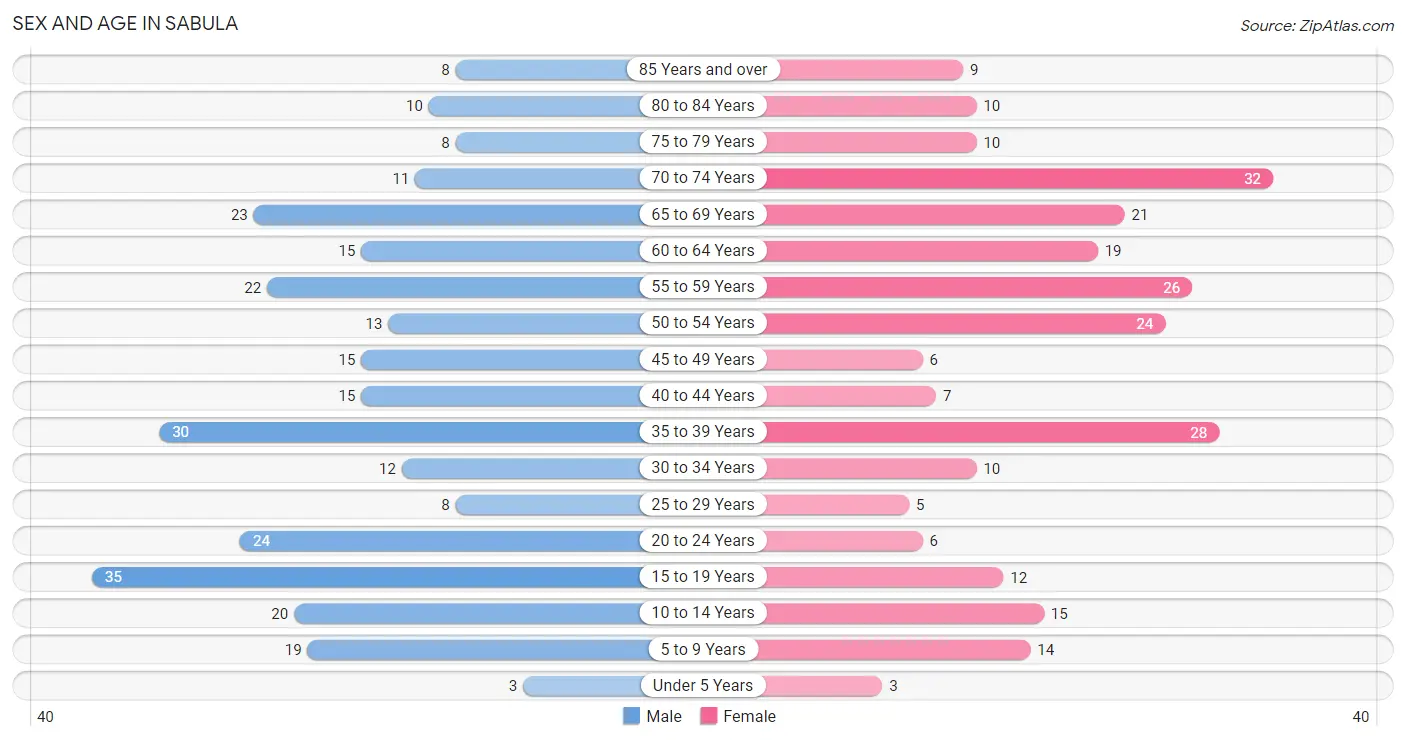
The most populous age groups in Sabula are 15 to 19 Years (35 | 12.0%) for men and 70 to 74 Years (32 | 12.4%) for women.
| Age Bracket | Male | Female |
| Under 5 Years | 3 (1.0%) | 3 (1.2%) |
| 5 to 9 Years | 19 (6.5%) | 14 (5.4%) |
| 10 to 14 Years | 20 (6.9%) | 15 (5.8%) |
| 15 to 19 Years | 35 (12.0%) | 12 (4.7%) |
| 20 to 24 Years | 24 (8.3%) | 6 (2.3%) |
| 25 to 29 Years | 8 (2.8%) | 5 (1.9%) |
| 30 to 34 Years | 12 (4.1%) | 10 (3.9%) |
| 35 to 39 Years | 30 (10.3%) | 28 (10.9%) |
| 40 to 44 Years | 15 (5.1%) | 7 (2.7%) |
| 45 to 49 Years | 15 (5.1%) | 6 (2.3%) |
| 50 to 54 Years | 13 (4.5%) | 24 (9.3%) |
| 55 to 59 Years | 22 (7.6%) | 26 (10.1%) |
| 60 to 64 Years | 15 (5.1%) | 19 (7.4%) |
| 65 to 69 Years | 23 (7.9%) | 21 (8.2%) |
| 70 to 74 Years | 11 (3.8%) | 32 (12.4%) |
| 75 to 79 Years | 8 (2.8%) | 10 (3.9%) |
| 80 to 84 Years | 10 (3.4%) | 10 (3.9%) |
| 85 Years and over | 8 (2.8%) | 9 (3.5%) |
| Total | 291 (100.0%) | 257 (100.0%) |
Families and Households in Sabula
Median Family Size in Sabula
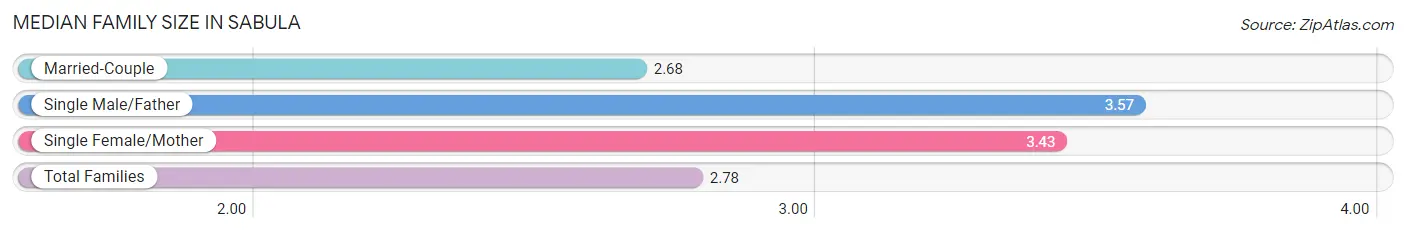
The median family size in Sabula is 2.78 persons per family, with single male/father families (7 | 4.4%) accounting for the largest median family size of 3.57 persons per family. On the other hand, married-couple families (139 | 86.9%) represent the smallest median family size with 2.68 persons per family.
| Family Type | # Families | Family Size |
| Married-Couple | 139 (86.9%) | 2.68 |
| Single Male/Father | 7 (4.4%) | 3.57 |
| Single Female/Mother | 14 (8.7%) | 3.43 |
| Total Families | 160 (100.0%) | 2.78 |
Median Household Size in Sabula
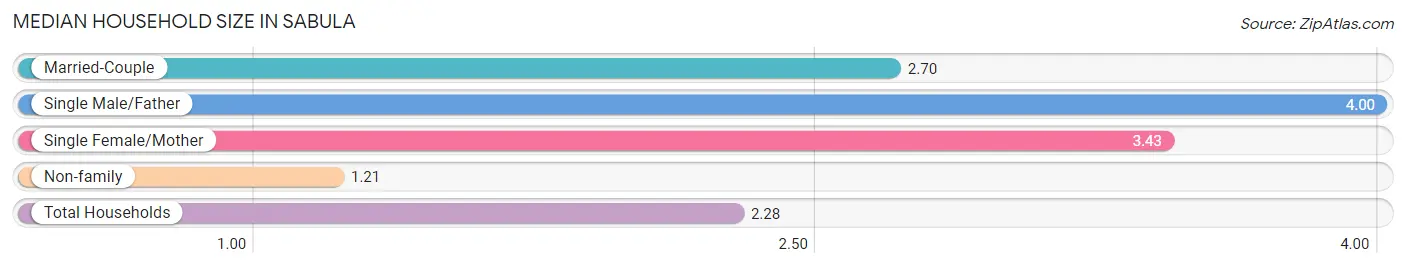
The median household size in Sabula is 2.28 persons per household, with single male/father households (7 | 2.9%) accounting for the largest median household size of 4 persons per household. non-family households (80 | 33.3%) represent the smallest median household size with 1.21 persons per household.
| Household Type | # Households | Household Size |
| Married-Couple | 139 (57.9%) | 2.70 |
| Single Male/Father | 7 (2.9%) | 4.00 |
| Single Female/Mother | 14 (5.8%) | 3.43 |
| Non-family | 80 (33.3%) | 1.21 |
| Total Households | 240 (100.0%) | 2.28 |
Household Size by Marriage Status in Sabula
Out of a total of 240 households in Sabula, 160 (66.7%) are family households, while 80 (33.3%) are nonfamily households. The most numerous type of family households are 2-person households, comprising 103, and the most common type of nonfamily households are 1-person households, comprising 62.
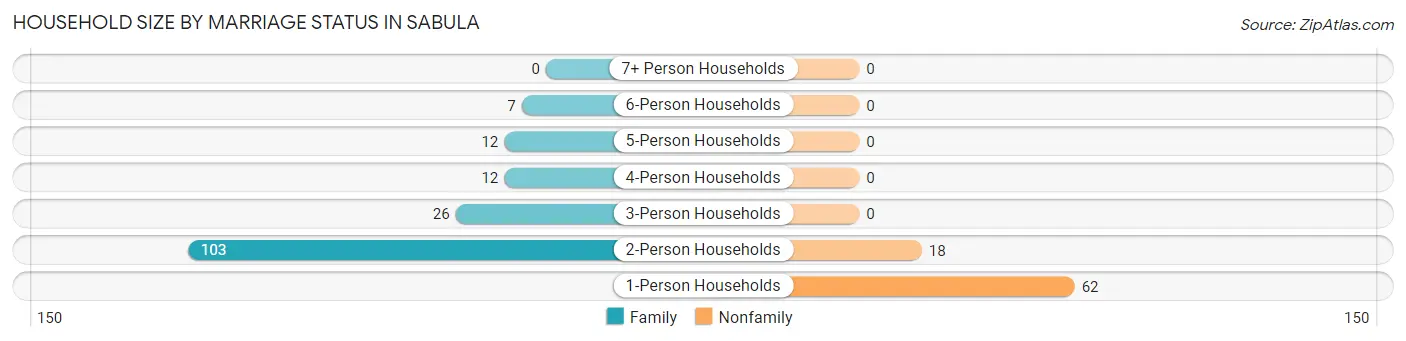
| Household Size | Family Households | Nonfamily Households |
| 1-Person Households | - | 62 (25.8%) |
| 2-Person Households | 103 (42.9%) | 18 (7.5%) |
| 3-Person Households | 26 (10.8%) | 0 (0.0%) |
| 4-Person Households | 12 (5.0%) | 0 (0.0%) |
| 5-Person Households | 12 (5.0%) | 0 (0.0%) |
| 6-Person Households | 7 (2.9%) | 0 (0.0%) |
| 7+ Person Households | 0 (0.0%) | 0 (0.0%) |
| Total | 160 (66.7%) | 80 (33.3%) |
Female Fertility in Sabula
Fertility by Age in Sabula
Average fertility rate in Sabula is 13.0 births per 1,000 women. Women in the age bracket of 20 to 34 years have the highest fertility rate with 48.0 births per 1,000 women. Women in the age bracket of 20 to 34 years acount for 100.0% of all women with births.
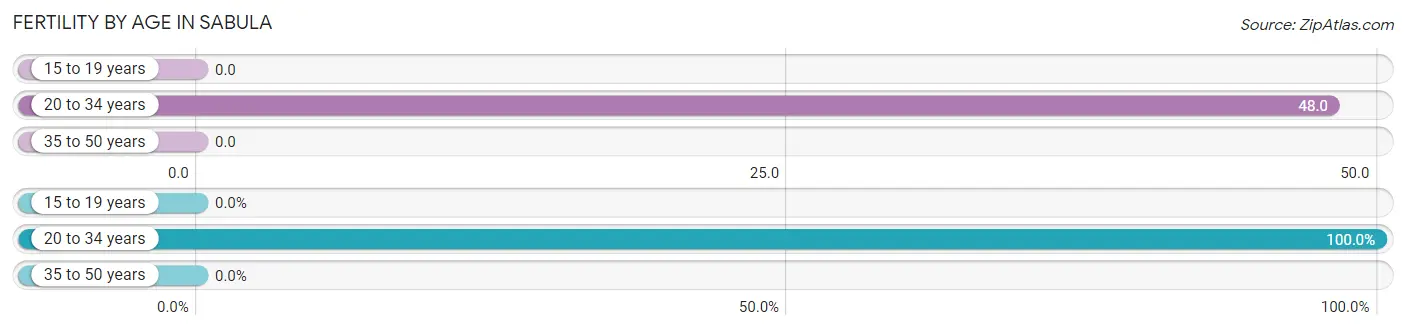
| Age Bracket | Women with Births | Births / 1,000 Women |
| 15 to 19 years | 0 (0.0%) | 0.0 |
| 20 to 34 years | 1 (100.0%) | 48.0 |
| 35 to 50 years | 0 (0.0%) | 0.0 |
| Total | 1 (100.0%) | 13.0 |
Fertility by Age by Marriage Status in Sabula
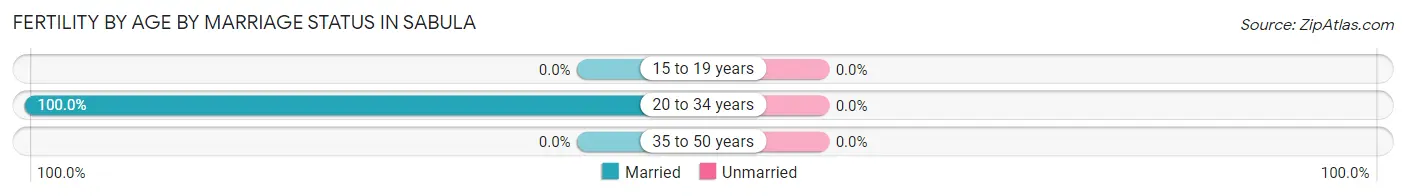
| Age Bracket | Married | Unmarried |
| 15 to 19 years | 0 (0.0%) | 0 (0.0%) |
| 20 to 34 years | 1 (100.0%) | 0 (0.0%) |
| 35 to 50 years | 0 (0.0%) | 0 (0.0%) |
| Total | 1 (100.0%) | 0 (0.0%) |
Fertility by Education in Sabula
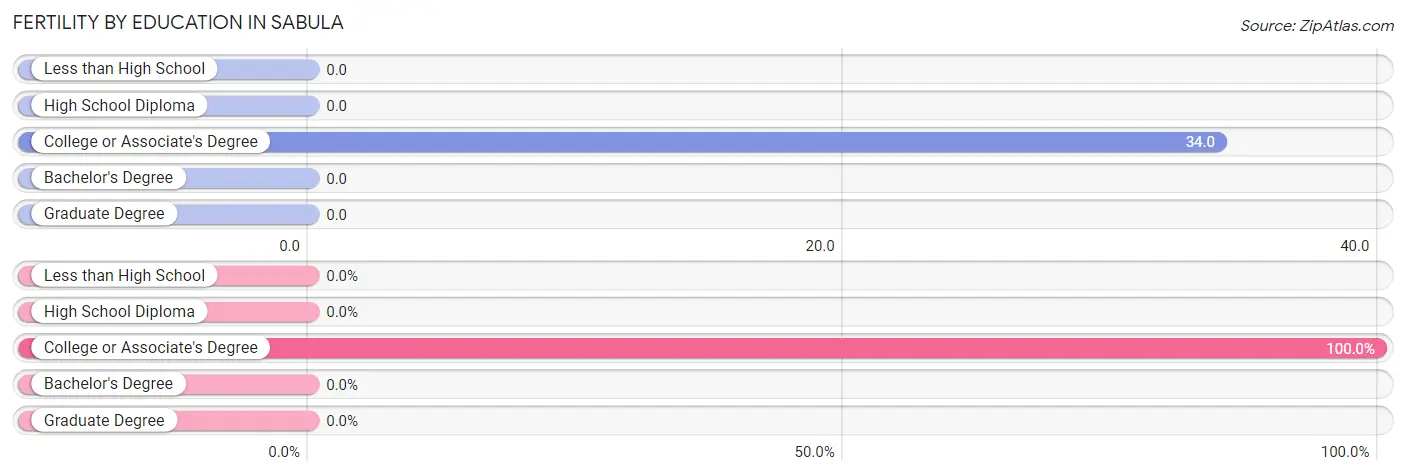
| Educational Attainment | Women with Births | Births / 1,000 Women |
| Less than High School | 0 (0.0%) | 0.0 |
| High School Diploma | 0 (0.0%) | 0.0 |
| College or Associate's Degree | 1 (100.0%) | 34.0 |
| Bachelor's Degree | 0 (0.0%) | 0.0 |
| Graduate Degree | 0 (0.0%) | 0.0 |
| Total | 1 (100.0%) | 13.0 |
Fertility by Education by Marriage Status in Sabula
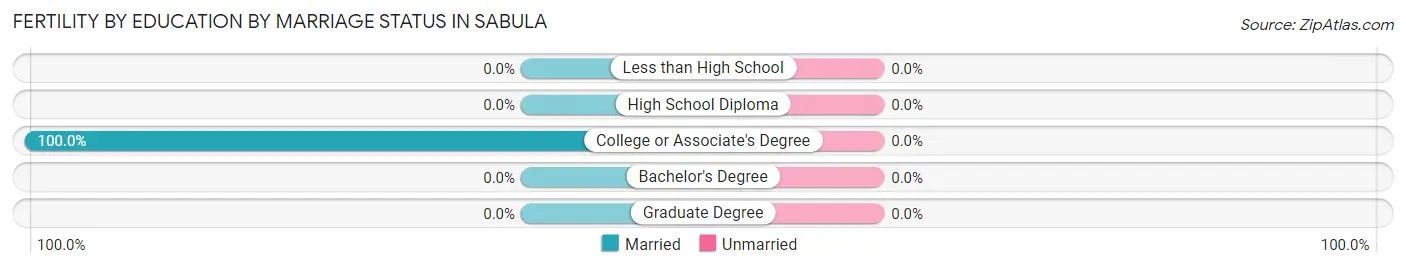
| Educational Attainment | Married | Unmarried |
| Less than High School | 0 (0.0%) | 0 (0.0%) |
| High School Diploma | 0 (0.0%) | 0 (0.0%) |
| College or Associate's Degree | 1 (100.0%) | 0 (0.0%) |
| Bachelor's Degree | 0 (0.0%) | 0 (0.0%) |
| Graduate Degree | 0 (0.0%) | 0 (0.0%) |
| Total | 1 (100.0%) | 0 (0.0%) |
Employment Characteristics in Sabula
Employment by Class of Employer in Sabula
Among the 221 employed individuals in Sabula, private company employees (167 | 75.6%), not-for-profit organizations (18 | 8.1%), and self-employed (incorporated) (16 | 7.2%) make up the most common classes of employment.
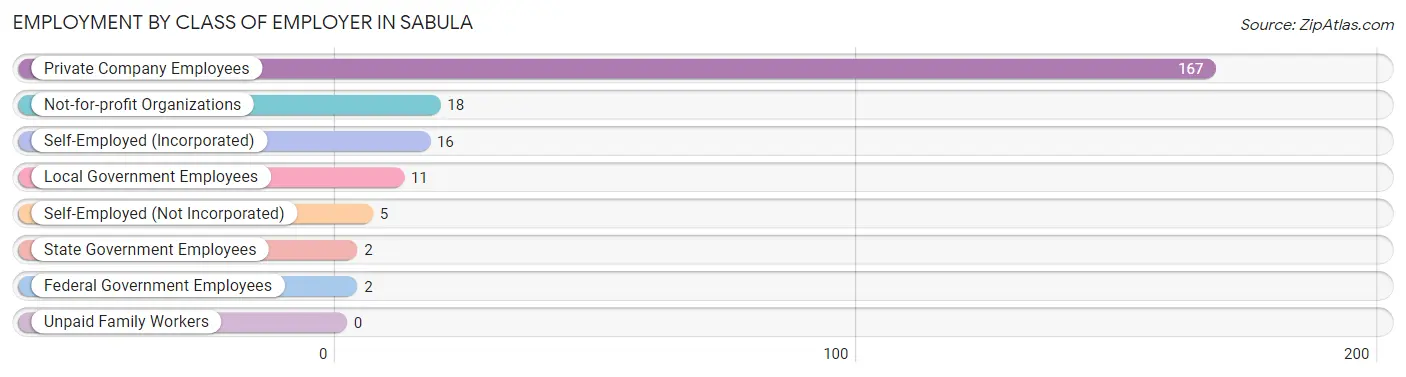
| Employer Class | # Employees | % Employees |
| Private Company Employees | 167 | 75.6% |
| Self-Employed (Incorporated) | 16 | 7.2% |
| Self-Employed (Not Incorporated) | 5 | 2.3% |
| Not-for-profit Organizations | 18 | 8.1% |
| Local Government Employees | 11 | 5.0% |
| State Government Employees | 2 | 0.9% |
| Federal Government Employees | 2 | 0.9% |
| Unpaid Family Workers | 0 | 0.0% |
| Total | 221 | 100.0% |
Employment Status by Age in Sabula
According to the labor force statistics for Sabula, out of the total population over 16 years of age (472), 50.8% or 240 individuals are in the labor force, with 4.6% or 11 of them unemployed. The age group with the highest labor force participation rate is 55 to 59 years, with 79.2% or 38 individuals in the labor force. Within the labor force, the 30 to 34 years age range has the highest percentage of unemployed individuals, with 12.5% or 2 of them being unemployed.
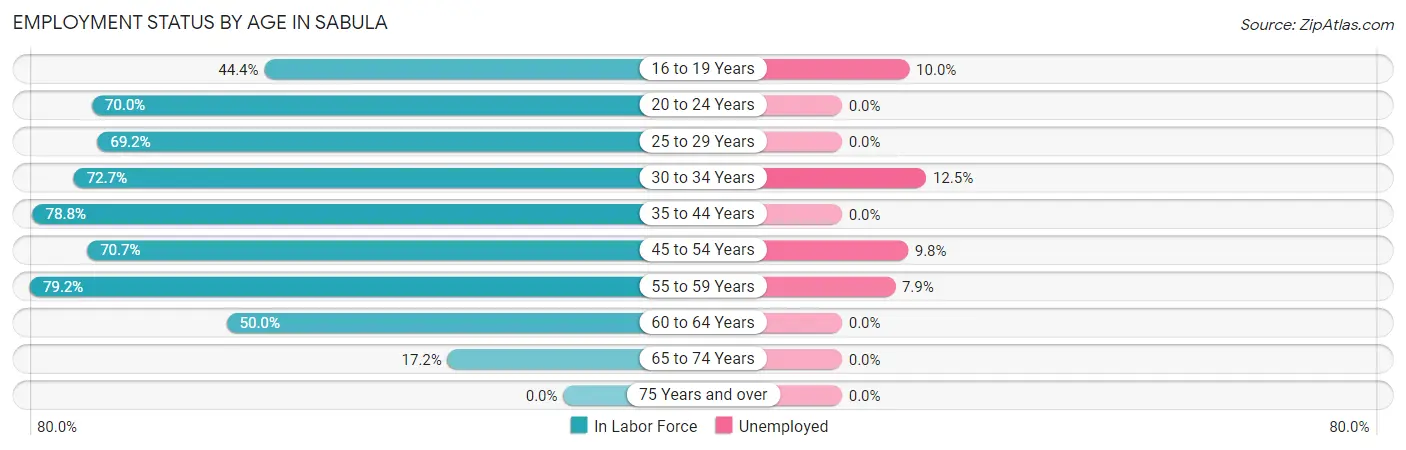
| Age Bracket | In Labor Force | Unemployed |
| 16 to 19 Years | 20 (44.4%) | 2 (10.0%) |
| 20 to 24 Years | 21 (70.0%) | 0 (0.0%) |
| 25 to 29 Years | 9 (69.2%) | 0 (0.0%) |
| 30 to 34 Years | 16 (72.7%) | 2 (12.5%) |
| 35 to 44 Years | 63 (78.8%) | 0 (0.0%) |
| 45 to 54 Years | 41 (70.7%) | 4 (9.8%) |
| 55 to 59 Years | 38 (79.2%) | 3 (7.9%) |
| 60 to 64 Years | 17 (50.0%) | 0 (0.0%) |
| 65 to 74 Years | 15 (17.2%) | 0 (0.0%) |
| 75 Years and over | 0 (0.0%) | 0 (0.0%) |
| Total | 240 (50.8%) | 11 (4.6%) |
Employment Status by Educational Attainment in Sabula
According to labor force statistics for Sabula, 72.2% of individuals (184) out of the total population between 25 and 64 years of age (255) are in the labor force, with 4.9% or 9 of them being unemployed. The group with the highest labor force participation rate are those with the educational attainment of high school diploma, with 83.1% or 118 individuals in the labor force. Within the labor force, individuals with college / associate degree education have the highest percentage of unemployment, with 8.5% or 4 of them being unemployed.
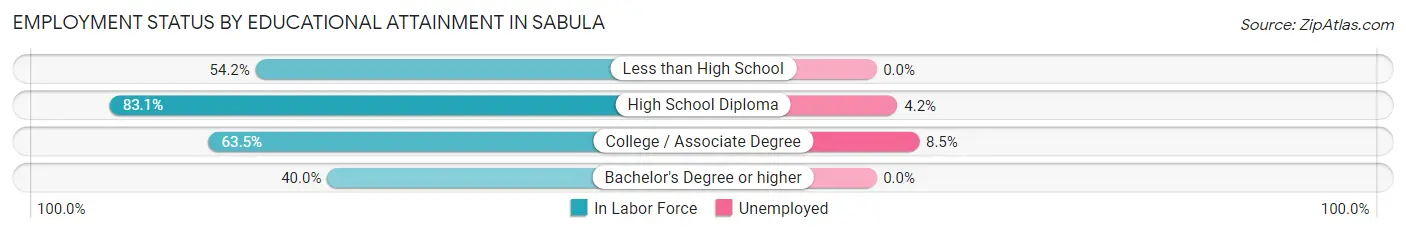
| Educational Attainment | In Labor Force | Unemployed |
| Less than High School | 13 (54.2%) | 0 (0.0%) |
| High School Diploma | 118 (83.1%) | 6 (4.2%) |
| College / Associate Degree | 47 (63.5%) | 6 (8.5%) |
| Bachelor's Degree or higher | 6 (40.0%) | 0 (0.0%) |
| Total | 184 (72.2%) | 12 (4.9%) |
Employment Occupations by Sex in Sabula
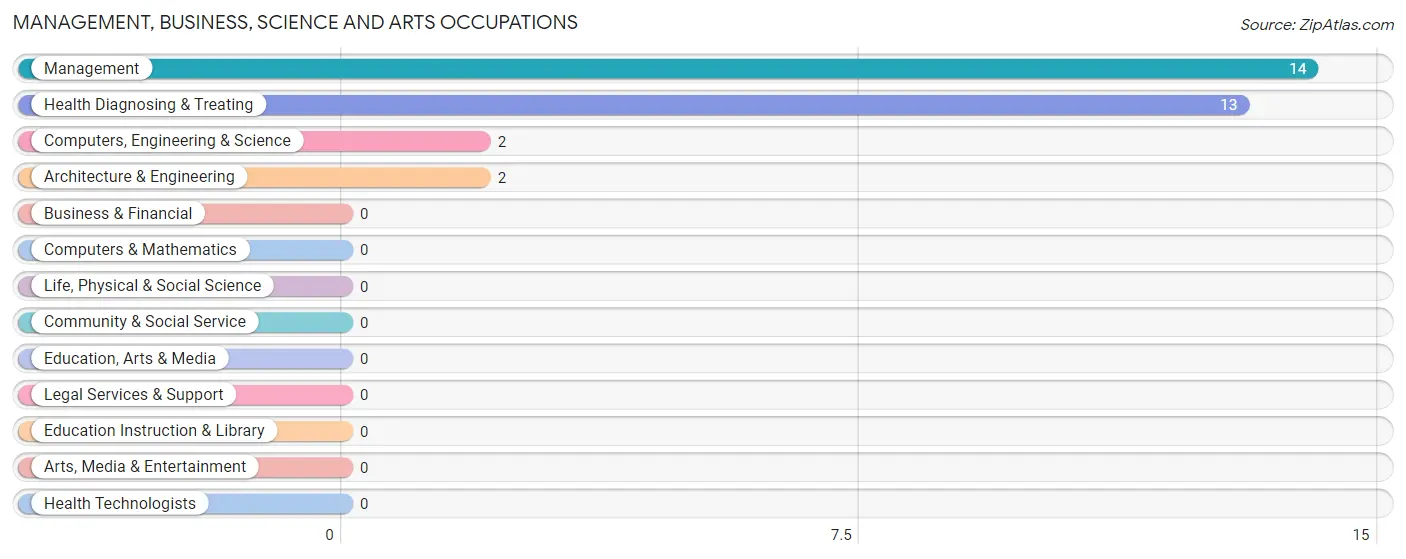
Management, Business, Science and Arts Occupations
The most common Management, Business, Science and Arts occupations in Sabula are Management (14 | 6.1%), Health Diagnosing & Treating (13 | 5.7%), Computers, Engineering & Science (2 | 0.9%), and Architecture & Engineering (2 | 0.9%).
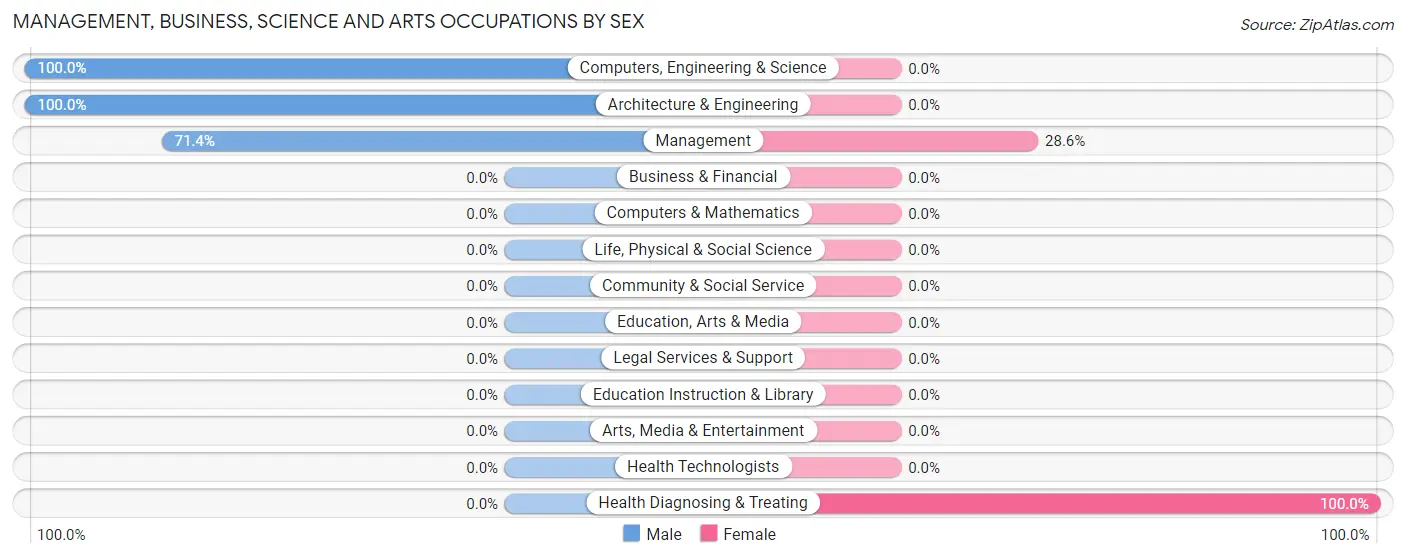
Management, Business, Science and Arts Occupations by Sex
Within the Management, Business, Science and Arts occupations in Sabula, the most male-oriented occupations are Computers, Engineering & Science (100.0%), Architecture & Engineering (100.0%), and Management (71.4%), while the most female-oriented occupations are Health Diagnosing & Treating (100.0%), and Management (28.6%).
| Occupation | Male | Female |
| Management | 10 (71.4%) | 4 (28.6%) |
| Business & Financial | 0 (0.0%) | 0 (0.0%) |
| Computers, Engineering & Science | 2 (100.0%) | 0 (0.0%) |
| Computers & Mathematics | 0 (0.0%) | 0 (0.0%) |
| Architecture & Engineering | 2 (100.0%) | 0 (0.0%) |
| Life, Physical & Social Science | 0 (0.0%) | 0 (0.0%) |
| Community & Social Service | 0 (0.0%) | 0 (0.0%) |
| Education, Arts & Media | 0 (0.0%) | 0 (0.0%) |
| Legal Services & Support | 0 (0.0%) | 0 (0.0%) |
| Education Instruction & Library | 0 (0.0%) | 0 (0.0%) |
| Arts, Media & Entertainment | 0 (0.0%) | 0 (0.0%) |
| Health Diagnosing & Treating | 0 (0.0%) | 13 (100.0%) |
| Health Technologists | 0 (0.0%) | 0 (0.0%) |
| Total (Category) | 12 (41.4%) | 17 (58.6%) |
| Total (Overall) | 123 (53.7%) | 106 (46.3%) |
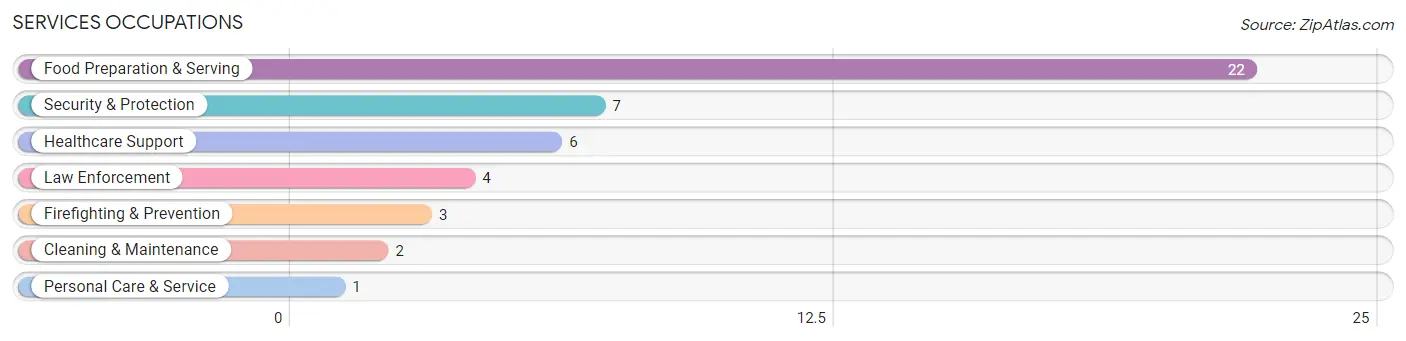
Services Occupations
The most common Services occupations in Sabula are Food Preparation & Serving (22 | 9.6%), Security & Protection (7 | 3.1%), Healthcare Support (6 | 2.6%), Law Enforcement (4 | 1.8%), and Firefighting & Prevention (3 | 1.3%).
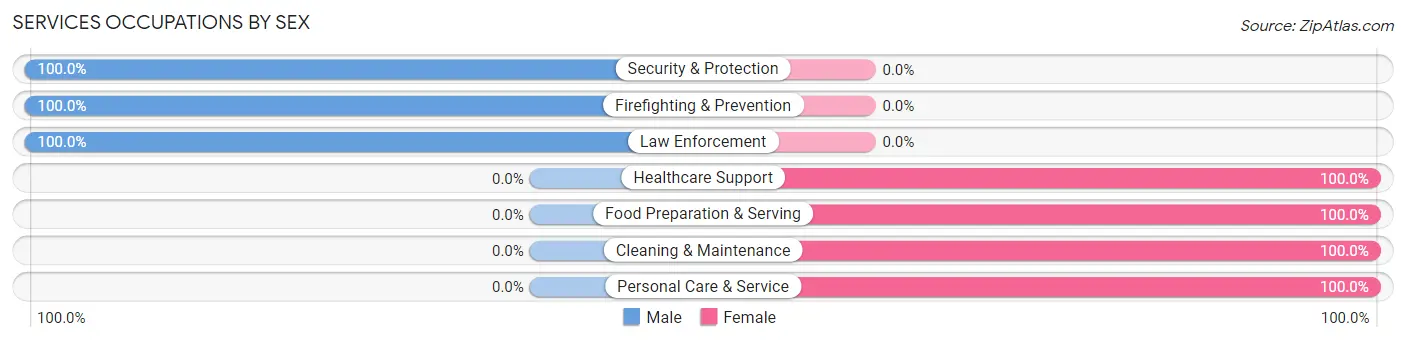
Services Occupations by Sex
Within the Services occupations in Sabula, the most male-oriented occupations are Security & Protection (100.0%), Firefighting & Prevention (100.0%), and Law Enforcement (100.0%), while the most female-oriented occupations are Healthcare Support (100.0%), Food Preparation & Serving (100.0%), and Cleaning & Maintenance (100.0%).
| Occupation | Male | Female |
| Healthcare Support | 0 (0.0%) | 6 (100.0%) |
| Security & Protection | 7 (100.0%) | 0 (0.0%) |
| Firefighting & Prevention | 3 (100.0%) | 0 (0.0%) |
| Law Enforcement | 4 (100.0%) | 0 (0.0%) |
| Food Preparation & Serving | 0 (0.0%) | 22 (100.0%) |
| Cleaning & Maintenance | 0 (0.0%) | 2 (100.0%) |
| Personal Care & Service | 0 (0.0%) | 1 (100.0%) |
| Total (Category) | 7 (18.4%) | 31 (81.6%) |
| Total (Overall) | 123 (53.7%) | 106 (46.3%) |
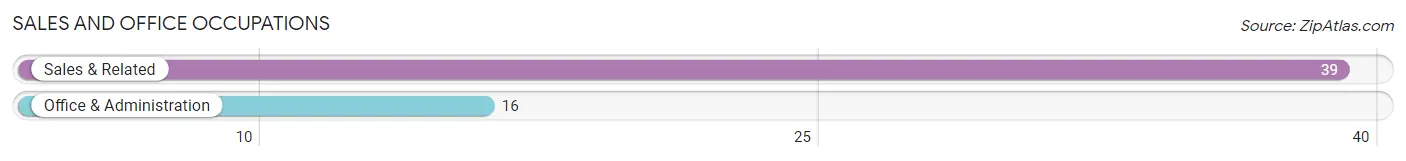
Sales and Office Occupations
The most common Sales and Office occupations in Sabula are Sales & Related (39 | 17.0%), and Office & Administration (16 | 7.0%).
Sales and Office Occupations by Sex
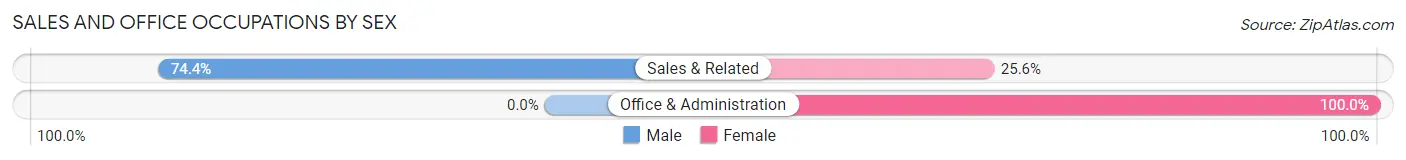
| Occupation | Male | Female |
| Sales & Related | 29 (74.4%) | 10 (25.6%) |
| Office & Administration | 0 (0.0%) | 16 (100.0%) |
| Total (Category) | 29 (52.7%) | 26 (47.3%) |
| Total (Overall) | 123 (53.7%) | 106 (46.3%) |
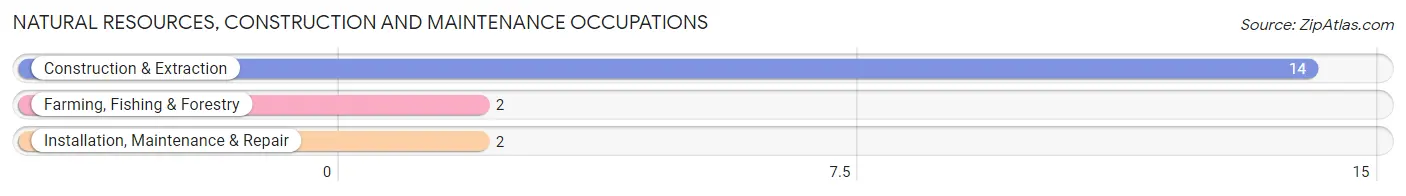
Natural Resources, Construction and Maintenance Occupations
The most common Natural Resources, Construction and Maintenance occupations in Sabula are Construction & Extraction (14 | 6.1%), Farming, Fishing & Forestry (2 | 0.9%), and Installation, Maintenance & Repair (2 | 0.9%).
Natural Resources, Construction and Maintenance Occupations by Sex
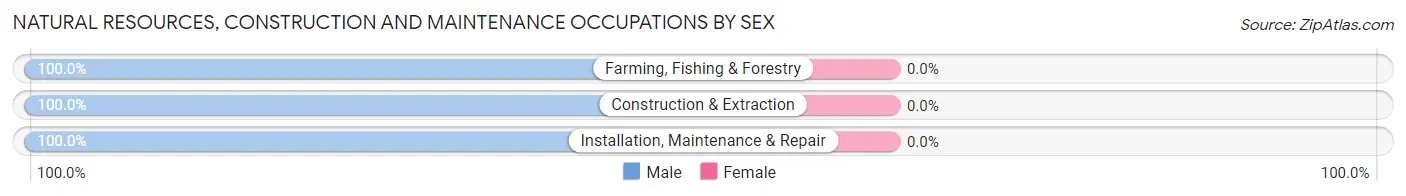
| Occupation | Male | Female |
| Farming, Fishing & Forestry | 2 (100.0%) | 0 (0.0%) |
| Construction & Extraction | 14 (100.0%) | 0 (0.0%) |
| Installation, Maintenance & Repair | 2 (100.0%) | 0 (0.0%) |
| Total (Category) | 18 (100.0%) | 0 (0.0%) |
| Total (Overall) | 123 (53.7%) | 106 (46.3%) |
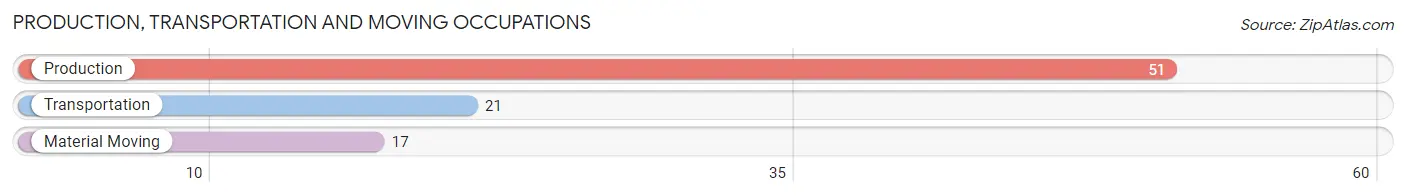
Production, Transportation and Moving Occupations
The most common Production, Transportation and Moving occupations in Sabula are Production (51 | 22.3%), Transportation (21 | 9.2%), and Material Moving (17 | 7.4%).
Production, Transportation and Moving Occupations by Sex
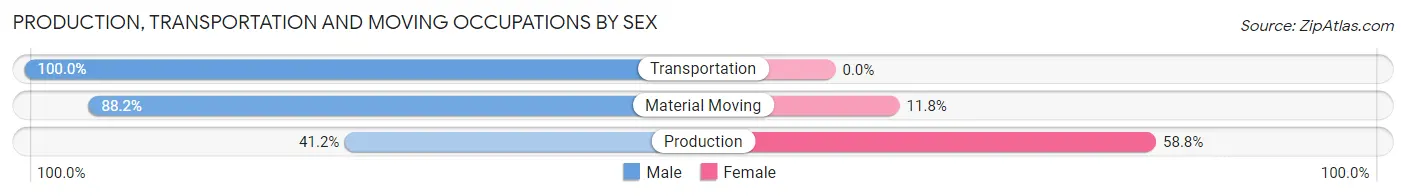
| Occupation | Male | Female |
| Production | 21 (41.2%) | 30 (58.8%) |
| Transportation | 21 (100.0%) | 0 (0.0%) |
| Material Moving | 15 (88.2%) | 2 (11.8%) |
| Total (Category) | 57 (64.0%) | 32 (36.0%) |
| Total (Overall) | 123 (53.7%) | 106 (46.3%) |
Employment Industries by Sex in Sabula
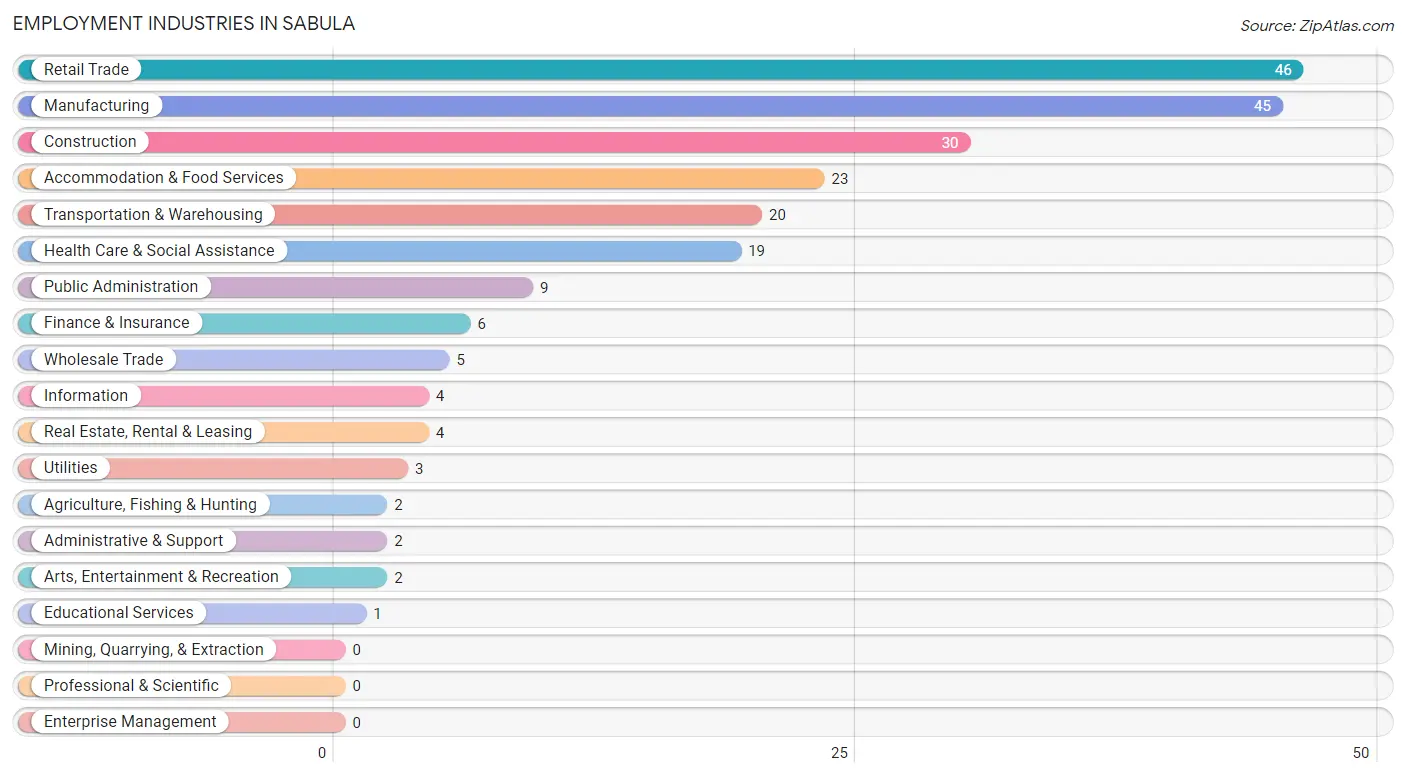
Employment Industries in Sabula
The major employment industries in Sabula include Retail Trade (46 | 20.1%), Manufacturing (45 | 19.7%), Construction (30 | 13.1%), Accommodation & Food Services (23 | 10.0%), and Transportation & Warehousing (20 | 8.7%).
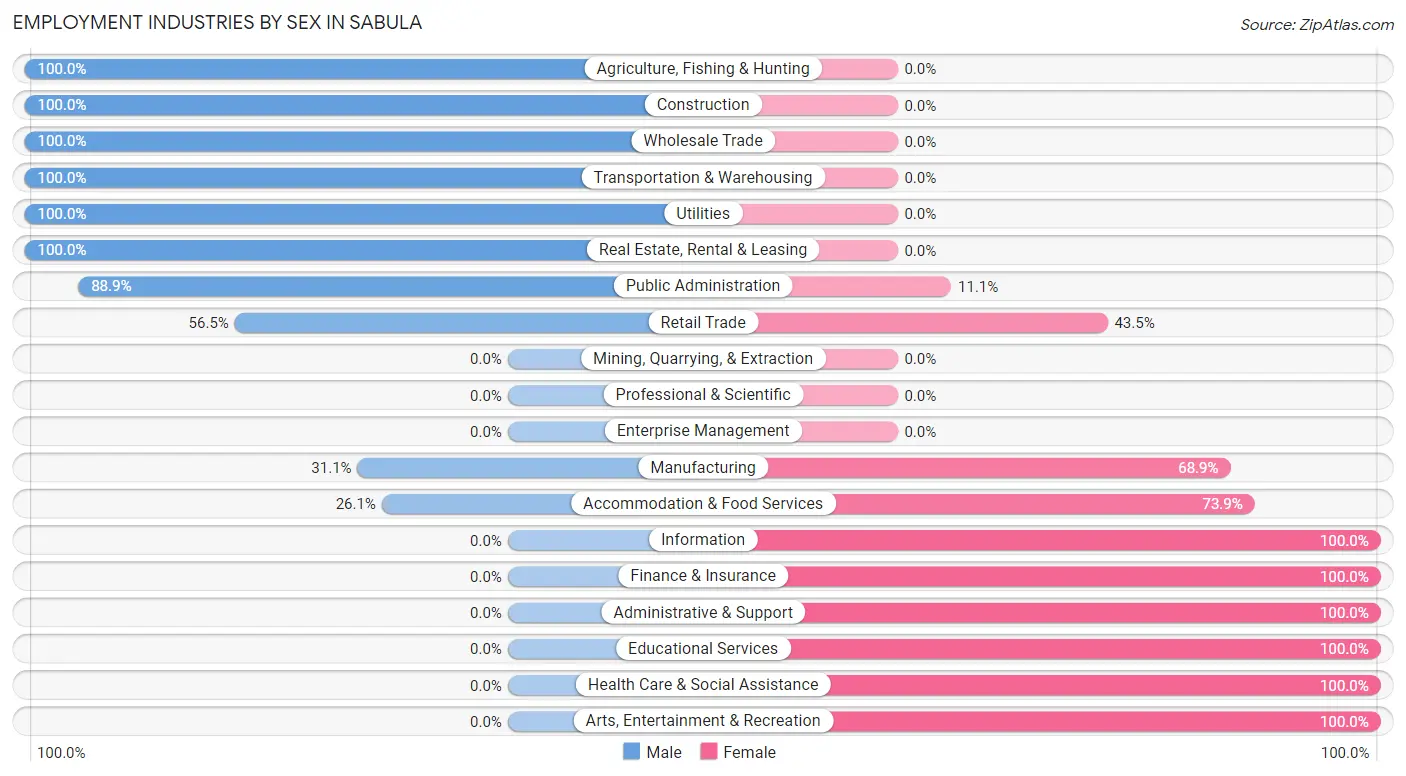
Employment Industries by Sex in Sabula
The Sabula industries that see more men than women are Agriculture, Fishing & Hunting (100.0%), Construction (100.0%), and Wholesale Trade (100.0%), whereas the industries that tend to have a higher number of women are Information (100.0%), Finance & Insurance (100.0%), and Administrative & Support (100.0%).
| Industry | Male | Female |
| Agriculture, Fishing & Hunting | 2 (100.0%) | 0 (0.0%) |
| Mining, Quarrying, & Extraction | 0 (0.0%) | 0 (0.0%) |
| Construction | 30 (100.0%) | 0 (0.0%) |
| Manufacturing | 14 (31.1%) | 31 (68.9%) |
| Wholesale Trade | 5 (100.0%) | 0 (0.0%) |
| Retail Trade | 26 (56.5%) | 20 (43.5%) |
| Transportation & Warehousing | 20 (100.0%) | 0 (0.0%) |
| Utilities | 3 (100.0%) | 0 (0.0%) |
| Information | 0 (0.0%) | 4 (100.0%) |
| Finance & Insurance | 0 (0.0%) | 6 (100.0%) |
| Real Estate, Rental & Leasing | 4 (100.0%) | 0 (0.0%) |
| Professional & Scientific | 0 (0.0%) | 0 (0.0%) |
| Enterprise Management | 0 (0.0%) | 0 (0.0%) |
| Administrative & Support | 0 (0.0%) | 2 (100.0%) |
| Educational Services | 0 (0.0%) | 1 (100.0%) |
| Health Care & Social Assistance | 0 (0.0%) | 19 (100.0%) |
| Arts, Entertainment & Recreation | 0 (0.0%) | 2 (100.0%) |
| Accommodation & Food Services | 6 (26.1%) | 17 (73.9%) |
| Public Administration | 8 (88.9%) | 1 (11.1%) |
| Total | 123 (53.7%) | 106 (46.3%) |
Education in Sabula
School Enrollment in Sabula
The most common levels of schooling among the 132 students in Sabula are high school (42 | 31.8%), elementary school (36 | 27.3%), and middle school (27 | 20.4%).
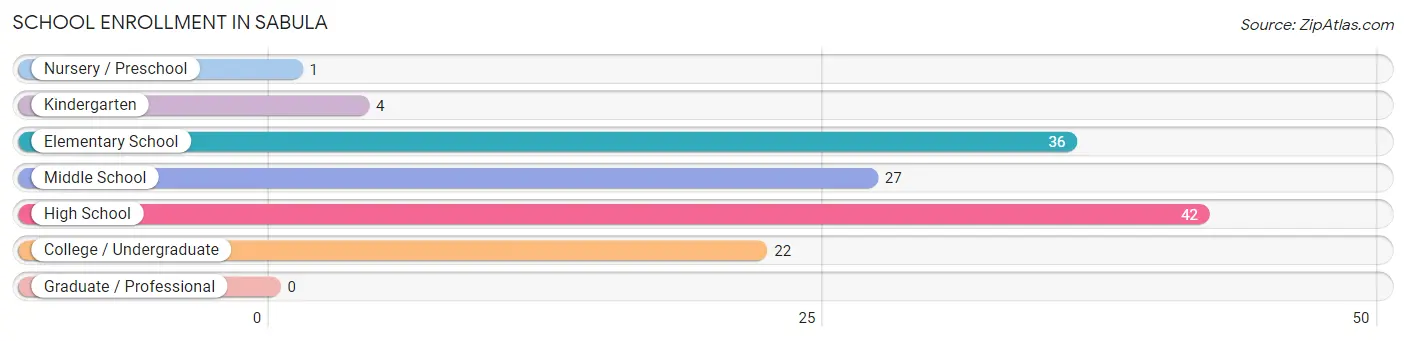
| School Level | # Students | % Students |
| Nursery / Preschool | 1 | 0.8% |
| Kindergarten | 4 | 3.0% |
| Elementary School | 36 | 27.3% |
| Middle School | 27 | 20.4% |
| High School | 42 | 31.8% |
| College / Undergraduate | 22 | 16.7% |
| Graduate / Professional | 0 | 0.0% |
| Total | 132 | 100.0% |
School Enrollment by Age by Funding Source in Sabula
Out of a total of 132 students who are enrolled in schools in Sabula, 6 (4.5%) attend a private institution, while the remaining 126 (95.5%) are enrolled in public schools. The age group of 25 to 34 year olds has the highest likelihood of being enrolled in private schools, with 2 (100.0% in the age bracket) enrolled. Conversely, the age group of 15 to 17 year olds has the lowest likelihood of being enrolled in a private school, with 21 (100.0% in the age bracket) attending a public institution.
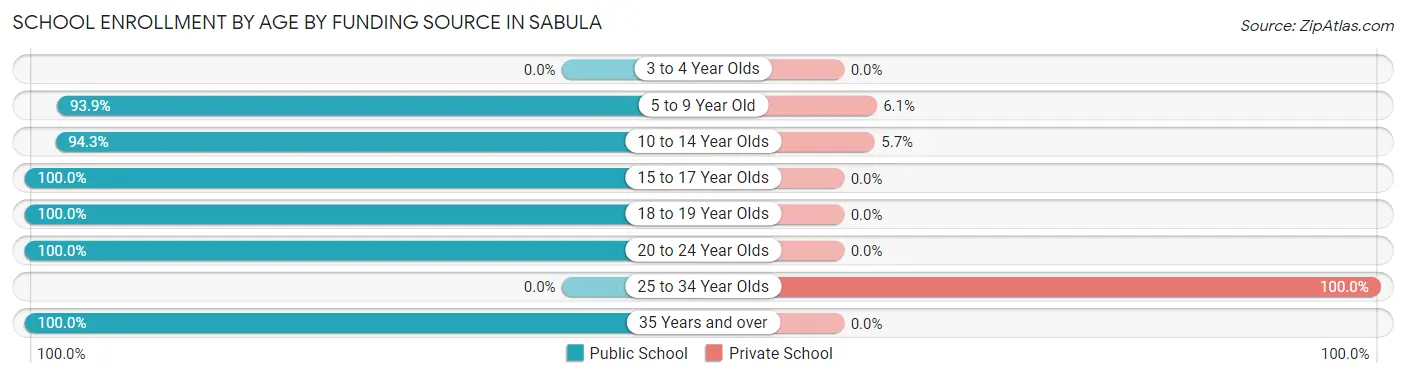
| Age Bracket | Public School | Private School |
| 3 to 4 Year Olds | 0 (0.0%) | 0 (0.0%) |
| 5 to 9 Year Old | 31 (93.9%) | 2 (6.1%) |
| 10 to 14 Year Olds | 33 (94.3%) | 2 (5.7%) |
| 15 to 17 Year Olds | 21 (100.0%) | 0 (0.0%) |
| 18 to 19 Year Olds | 21 (100.0%) | 0 (0.0%) |
| 20 to 24 Year Olds | 6 (100.0%) | 0 (0.0%) |
| 25 to 34 Year Olds | 0 (0.0%) | 2 (100.0%) |
| 35 Years and over | 14 (100.0%) | 0 (0.0%) |
| Total | 126 (95.5%) | 6 (4.5%) |
Educational Attainment by Field of Study in Sabula
Liberal arts & history (10 | 29.4%), science & technology (7 | 20.6%), education (6 | 17.6%), arts & humanities (4 | 11.8%), and business (3 | 8.8%) are the most common fields of study among 34 individuals in Sabula who have obtained a bachelor's degree or higher.
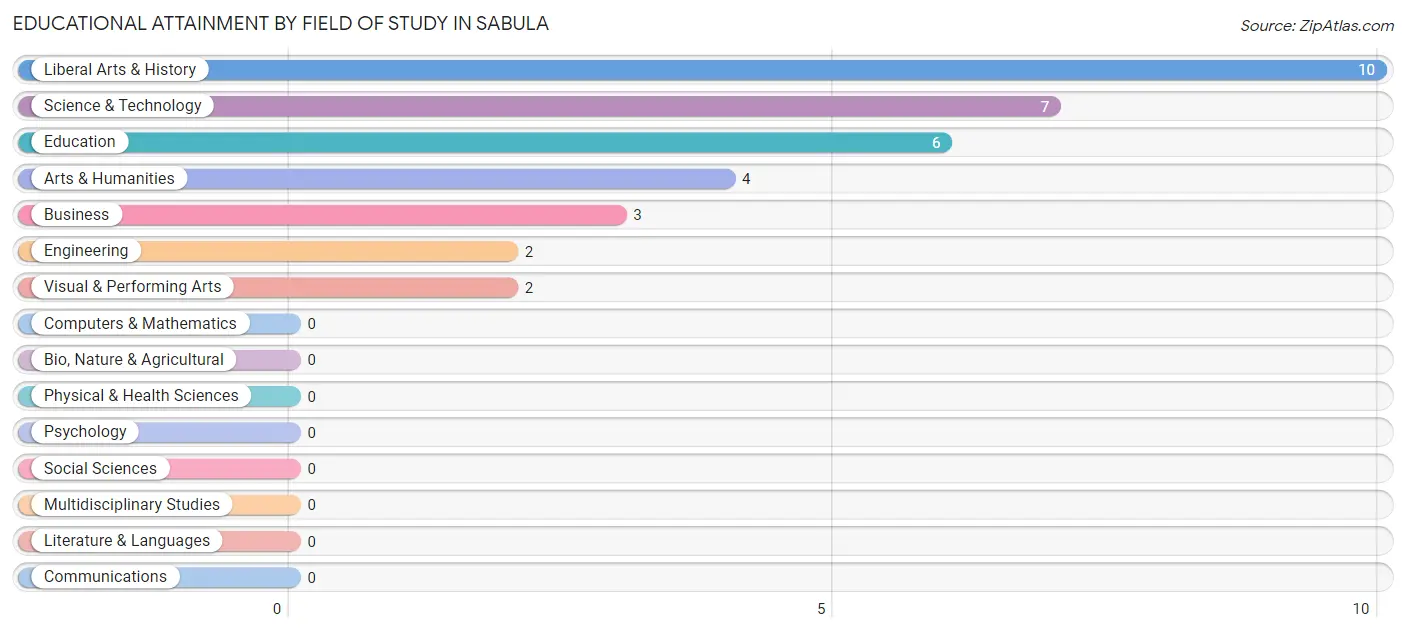
| Field of Study | # Graduates | % Graduates |
| Computers & Mathematics | 0 | 0.0% |
| Bio, Nature & Agricultural | 0 | 0.0% |
| Physical & Health Sciences | 0 | 0.0% |
| Psychology | 0 | 0.0% |
| Social Sciences | 0 | 0.0% |
| Engineering | 2 | 5.9% |
| Multidisciplinary Studies | 0 | 0.0% |
| Science & Technology | 7 | 20.6% |
| Business | 3 | 8.8% |
| Education | 6 | 17.6% |
| Literature & Languages | 0 | 0.0% |
| Liberal Arts & History | 10 | 29.4% |
| Visual & Performing Arts | 2 | 5.9% |
| Communications | 0 | 0.0% |
| Arts & Humanities | 4 | 11.8% |
| Total | 34 | 100.0% |
Transportation & Commute in Sabula
Vehicle Availability by Sex in Sabula
The most prevalent vehicle ownership categories in Sabula are males with 2 vehicles (51, accounting for 43.6%) and females with 2 vehicles (24, making up 49.0%).
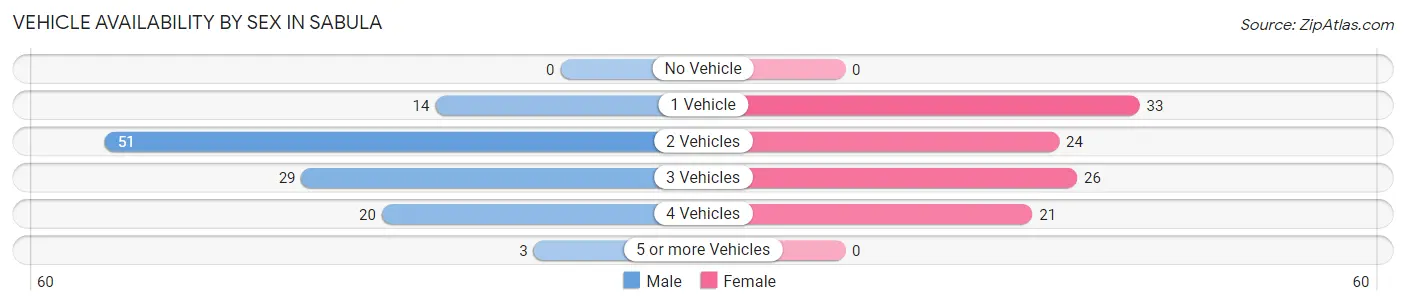
| Vehicles Available | Male | Female |
| No Vehicle | 0 (0.0%) | 0 (0.0%) |
| 1 Vehicle | 14 (12.0%) | 33 (31.7%) |
| 2 Vehicles | 51 (43.6%) | 24 (23.1%) |
| 3 Vehicles | 29 (24.8%) | 26 (25.0%) |
| 4 Vehicles | 20 (17.1%) | 21 (20.2%) |
| 5 or more Vehicles | 3 (2.6%) | 0 (0.0%) |
| Total | 117 (100.0%) | 104 (100.0%) |
Commute Time in Sabula
The most frequently occuring commute durations in Sabula are 30 to 34 minutes (58 commuters, 27.9%), 15 to 19 minutes (30 commuters, 14.4%), and 5 to 9 minutes (28 commuters, 13.5%).
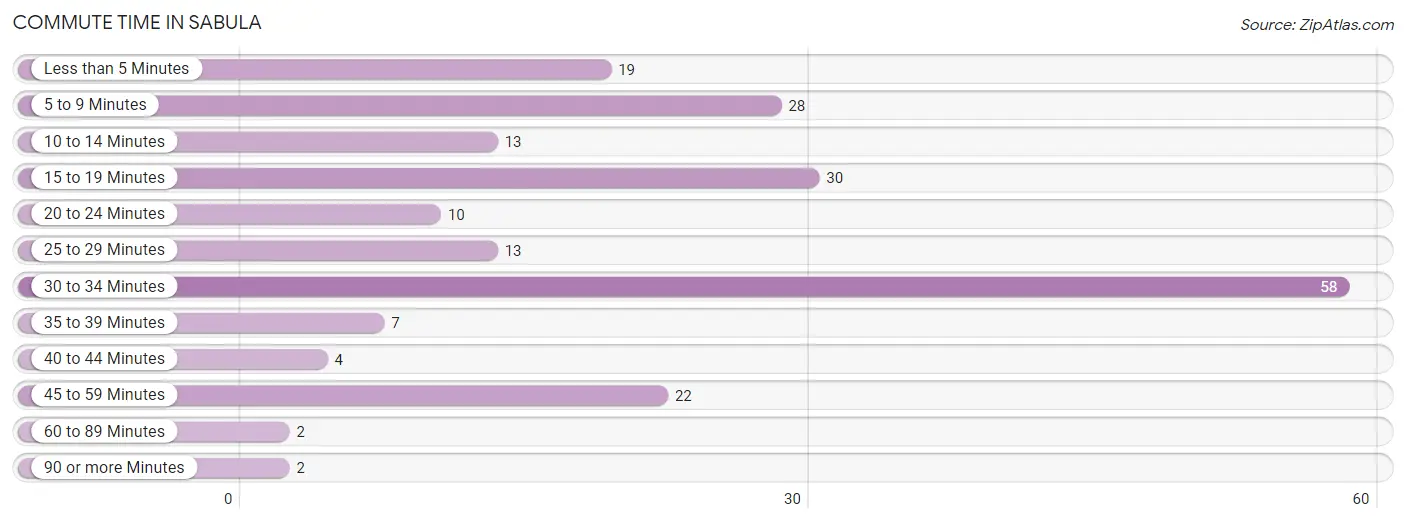
| Commute Time | # Commuters | % Commuters |
| Less than 5 Minutes | 19 | 9.1% |
| 5 to 9 Minutes | 28 | 13.5% |
| 10 to 14 Minutes | 13 | 6.2% |
| 15 to 19 Minutes | 30 | 14.4% |
| 20 to 24 Minutes | 10 | 4.8% |
| 25 to 29 Minutes | 13 | 6.2% |
| 30 to 34 Minutes | 58 | 27.9% |
| 35 to 39 Minutes | 7 | 3.4% |
| 40 to 44 Minutes | 4 | 1.9% |
| 45 to 59 Minutes | 22 | 10.6% |
| 60 to 89 Minutes | 2 | 1.0% |
| 90 or more Minutes | 2 | 1.0% |
Commute Time by Sex in Sabula
The most common commute times in Sabula are 30 to 34 minutes (31 commuters, 27.0%) for males and 30 to 34 minutes (27 commuters, 29.0%) for females.
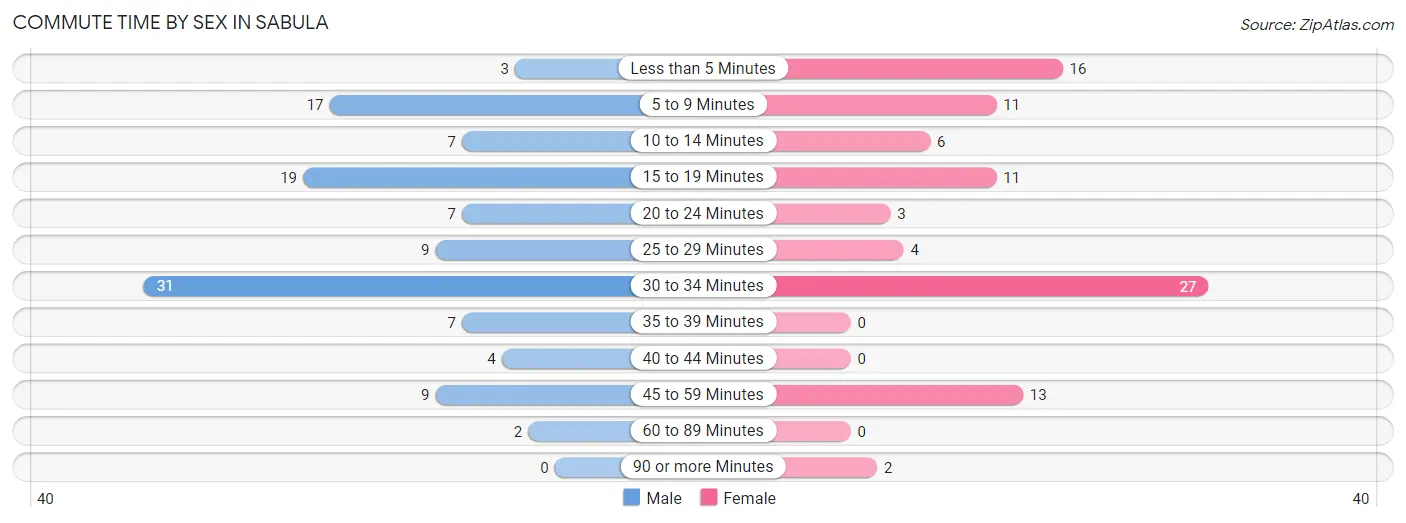
| Commute Time | Male | Female |
| Less than 5 Minutes | 3 (2.6%) | 16 (17.2%) |
| 5 to 9 Minutes | 17 (14.8%) | 11 (11.8%) |
| 10 to 14 Minutes | 7 (6.1%) | 6 (6.5%) |
| 15 to 19 Minutes | 19 (16.5%) | 11 (11.8%) |
| 20 to 24 Minutes | 7 (6.1%) | 3 (3.2%) |
| 25 to 29 Minutes | 9 (7.8%) | 4 (4.3%) |
| 30 to 34 Minutes | 31 (27.0%) | 27 (29.0%) |
| 35 to 39 Minutes | 7 (6.1%) | 0 (0.0%) |
| 40 to 44 Minutes | 4 (3.5%) | 0 (0.0%) |
| 45 to 59 Minutes | 9 (7.8%) | 13 (14.0%) |
| 60 to 89 Minutes | 2 (1.7%) | 0 (0.0%) |
| 90 or more Minutes | 0 (0.0%) | 2 (2.1%) |
Time of Departure to Work by Sex in Sabula
The most frequent times of departure to work in Sabula are 7:00 AM to 7:29 AM (35, 30.4%) for males and 6:30 AM to 6:59 AM (18, 19.4%) for females.
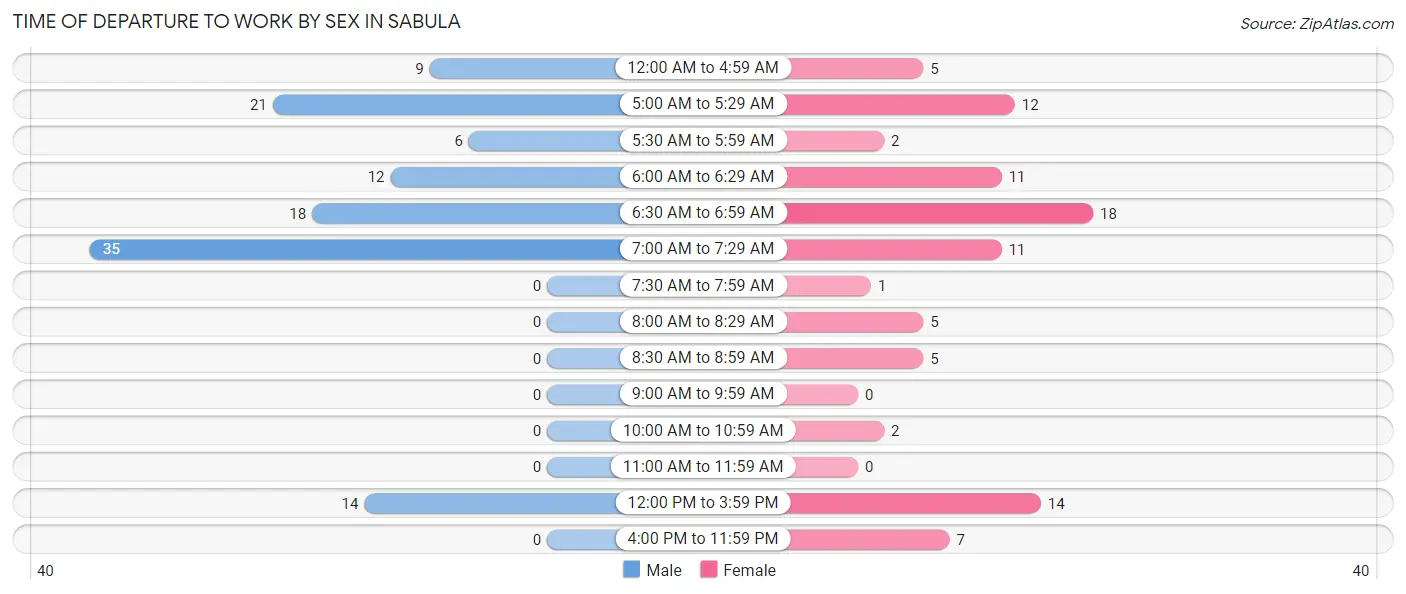
| Time of Departure | Male | Female |
| 12:00 AM to 4:59 AM | 9 (7.8%) | 5 (5.4%) |
| 5:00 AM to 5:29 AM | 21 (18.3%) | 12 (12.9%) |
| 5:30 AM to 5:59 AM | 6 (5.2%) | 2 (2.1%) |
| 6:00 AM to 6:29 AM | 12 (10.4%) | 11 (11.8%) |
| 6:30 AM to 6:59 AM | 18 (15.7%) | 18 (19.4%) |
| 7:00 AM to 7:29 AM | 35 (30.4%) | 11 (11.8%) |
| 7:30 AM to 7:59 AM | 0 (0.0%) | 1 (1.1%) |
| 8:00 AM to 8:29 AM | 0 (0.0%) | 5 (5.4%) |
| 8:30 AM to 8:59 AM | 0 (0.0%) | 5 (5.4%) |
| 9:00 AM to 9:59 AM | 0 (0.0%) | 0 (0.0%) |
| 10:00 AM to 10:59 AM | 0 (0.0%) | 2 (2.1%) |
| 11:00 AM to 11:59 AM | 0 (0.0%) | 0 (0.0%) |
| 12:00 PM to 3:59 PM | 14 (12.2%) | 14 (15.0%) |
| 4:00 PM to 11:59 PM | 0 (0.0%) | 7 (7.5%) |
| Total | 115 (100.0%) | 93 (100.0%) |
Housing Occupancy in Sabula
Occupancy by Ownership in Sabula
Of the total 240 dwellings in Sabula, owner-occupied units account for 204 (85.0%), while renter-occupied units make up 36 (15.0%).
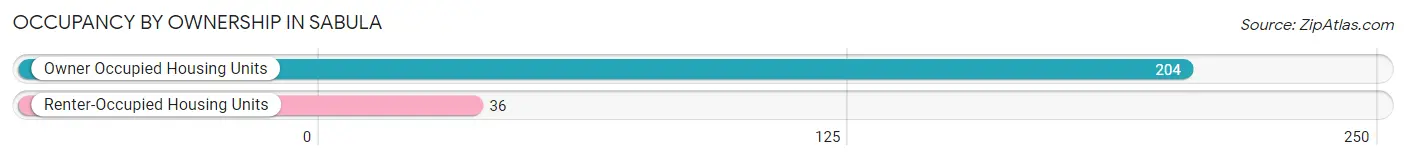
| Occupancy | # Housing Units | % Housing Units |
| Owner Occupied Housing Units | 204 | 85.0% |
| Renter-Occupied Housing Units | 36 | 15.0% |
| Total Occupied Housing Units | 240 | 100.0% |
Occupancy by Household Size in Sabula
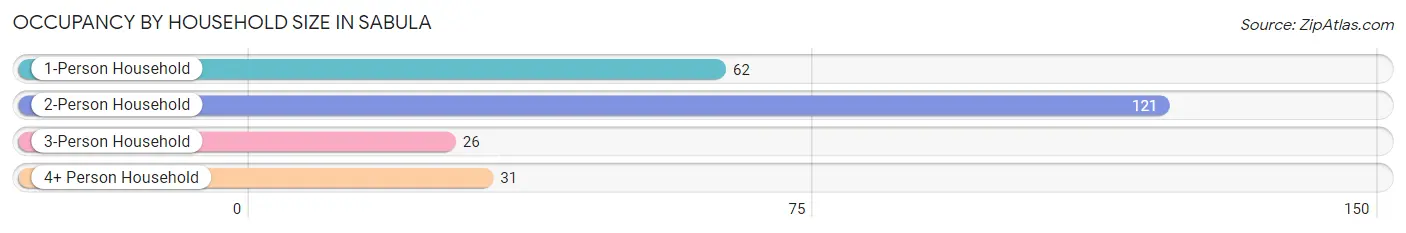
| Household Size | # Housing Units | % Housing Units |
| 1-Person Household | 62 | 25.8% |
| 2-Person Household | 121 | 50.4% |
| 3-Person Household | 26 | 10.8% |
| 4+ Person Household | 31 | 12.9% |
| Total Housing Units | 240 | 100.0% |
Occupancy by Ownership by Household Size in Sabula
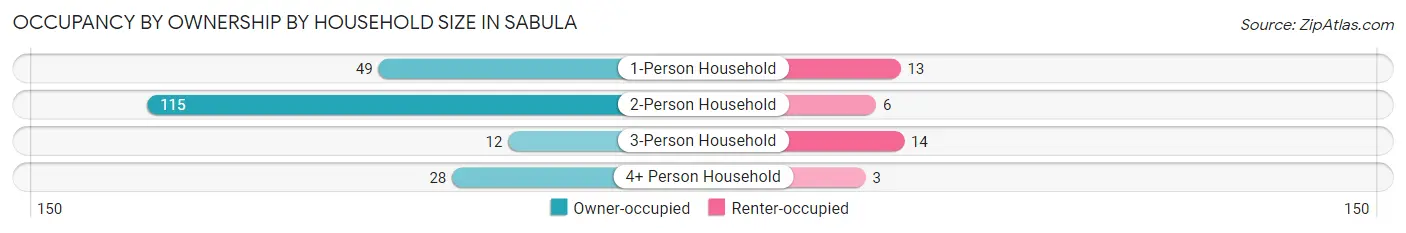
| Household Size | Owner-occupied | Renter-occupied |
| 1-Person Household | 49 (79.0%) | 13 (21.0%) |
| 2-Person Household | 115 (95.0%) | 6 (5.0%) |
| 3-Person Household | 12 (46.2%) | 14 (53.8%) |
| 4+ Person Household | 28 (90.3%) | 3 (9.7%) |
| Total Housing Units | 204 (85.0%) | 36 (15.0%) |
Occupancy by Educational Attainment in Sabula
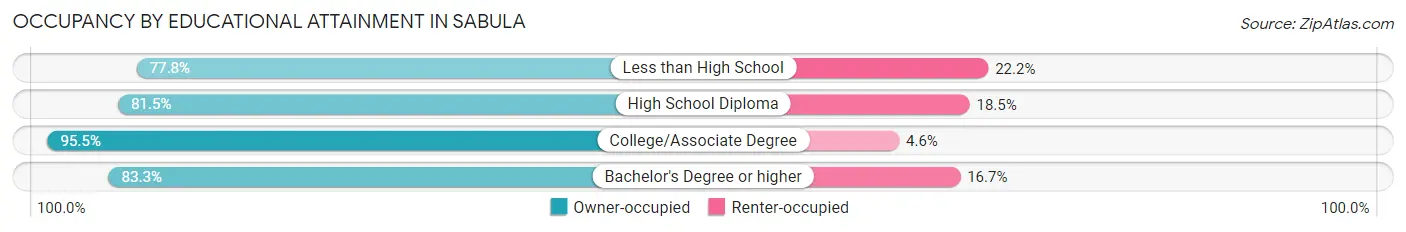
| Household Size | Owner-occupied | Renter-occupied |
| Less than High School | 21 (77.8%) | 6 (22.2%) |
| High School Diploma | 110 (81.5%) | 25 (18.5%) |
| College/Associate Degree | 63 (95.5%) | 3 (4.5%) |
| Bachelor's Degree or higher | 10 (83.3%) | 2 (16.7%) |
Occupancy by Age of Householder in Sabula
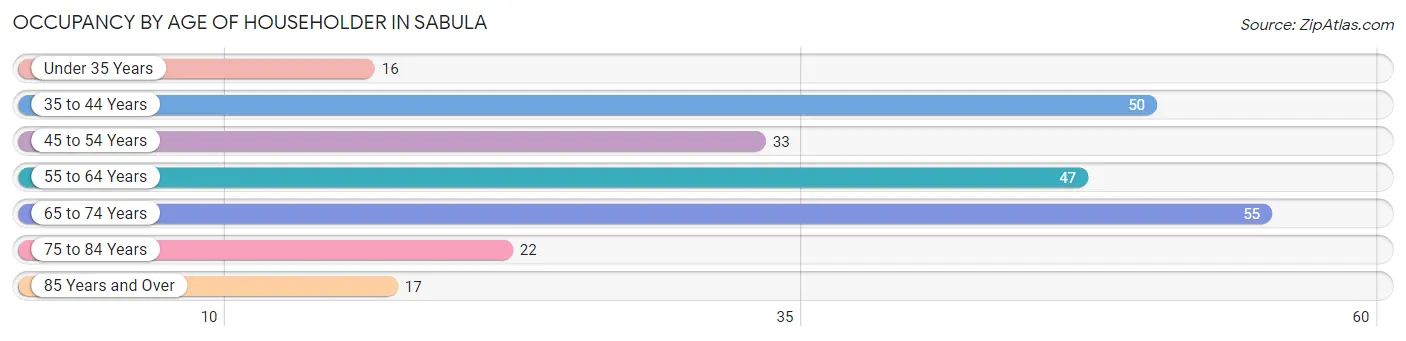
| Age Bracket | # Households | % Households |
| Under 35 Years | 16 | 6.7% |
| 35 to 44 Years | 50 | 20.8% |
| 45 to 54 Years | 33 | 13.8% |
| 55 to 64 Years | 47 | 19.6% |
| 65 to 74 Years | 55 | 22.9% |
| 75 to 84 Years | 22 | 9.2% |
| 85 Years and Over | 17 | 7.1% |
| Total | 240 | 100.0% |
Housing Finances in Sabula
Median Income by Occupancy in Sabula
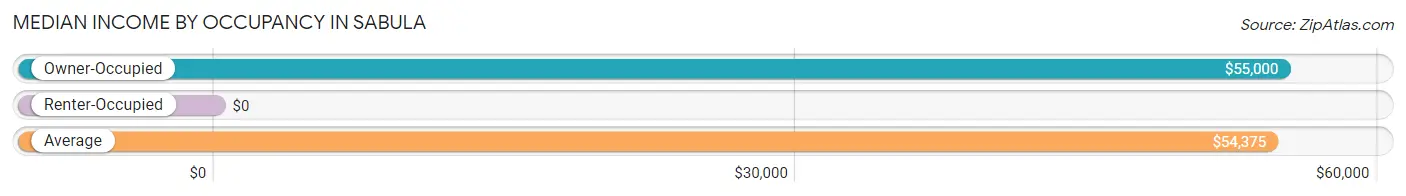
| Occupancy Type | # Households | Median Income |
| Owner-Occupied | 204 (85.0%) | $55,000 |
| Renter-Occupied | 36 (15.0%) | $0 |
| Average | 240 (100.0%) | $54,375 |
Occupancy by Householder Income Bracket in Sabula
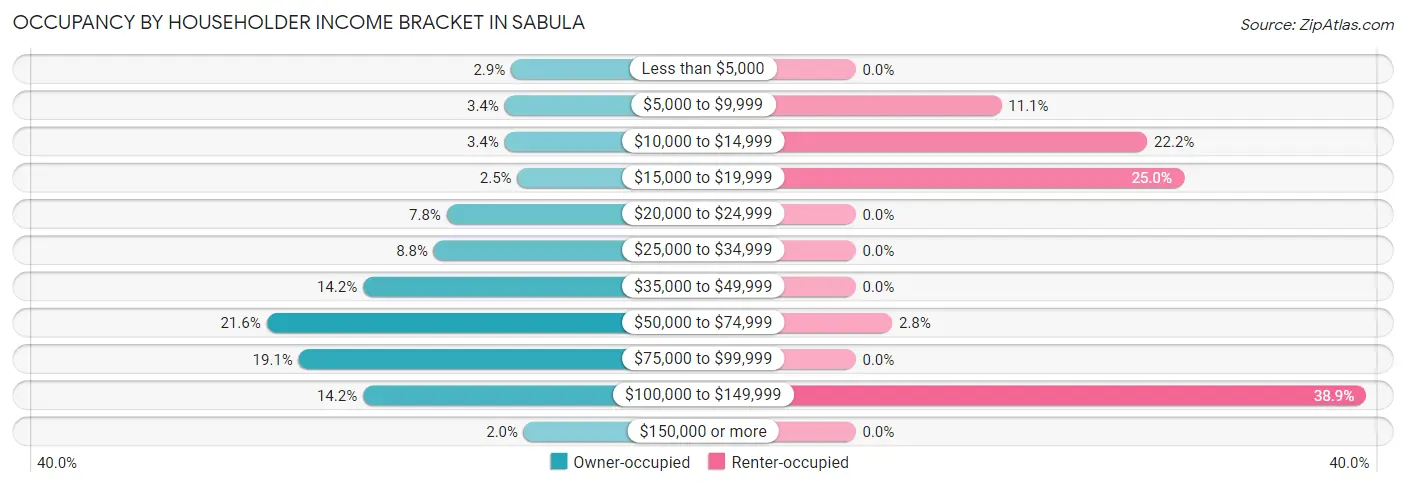
| Income Bracket | Owner-occupied | Renter-occupied |
| Less than $5,000 | 6 (2.9%) | 0 (0.0%) |
| $5,000 to $9,999 | 7 (3.4%) | 4 (11.1%) |
| $10,000 to $14,999 | 7 (3.4%) | 8 (22.2%) |
| $15,000 to $19,999 | 5 (2.5%) | 9 (25.0%) |
| $20,000 to $24,999 | 16 (7.8%) | 0 (0.0%) |
| $25,000 to $34,999 | 18 (8.8%) | 0 (0.0%) |
| $35,000 to $49,999 | 29 (14.2%) | 0 (0.0%) |
| $50,000 to $74,999 | 44 (21.6%) | 1 (2.8%) |
| $75,000 to $99,999 | 39 (19.1%) | 0 (0.0%) |
| $100,000 to $149,999 | 29 (14.2%) | 14 (38.9%) |
| $150,000 or more | 4 (2.0%) | 0 (0.0%) |
| Total | 204 (100.0%) | 36 (100.0%) |
Monthly Housing Cost Tiers in Sabula
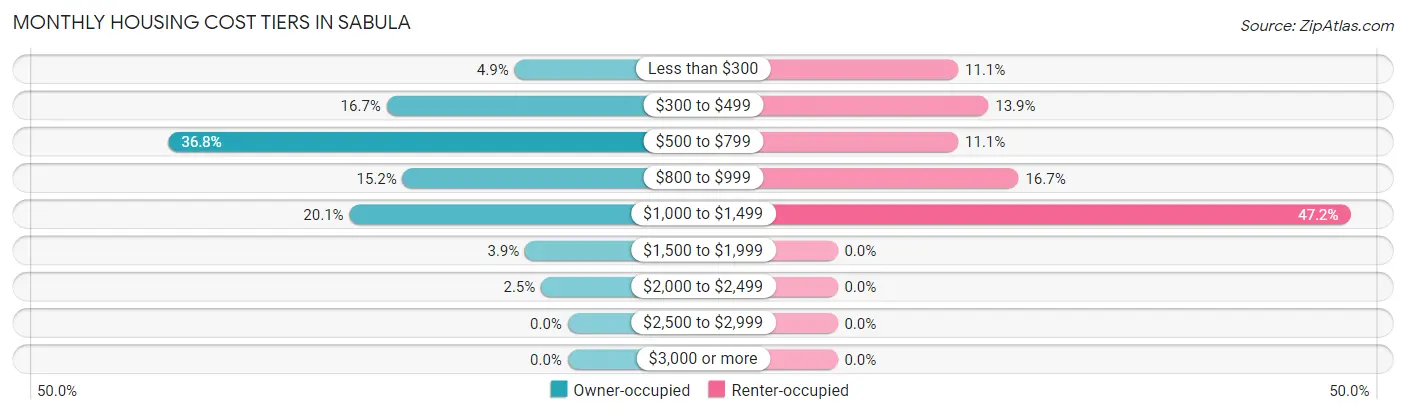
| Monthly Cost | Owner-occupied | Renter-occupied |
| Less than $300 | 10 (4.9%) | 4 (11.1%) |
| $300 to $499 | 34 (16.7%) | 5 (13.9%) |
| $500 to $799 | 75 (36.8%) | 4 (11.1%) |
| $800 to $999 | 31 (15.2%) | 6 (16.7%) |
| $1,000 to $1,499 | 41 (20.1%) | 17 (47.2%) |
| $1,500 to $1,999 | 8 (3.9%) | 0 (0.0%) |
| $2,000 to $2,499 | 5 (2.5%) | 0 (0.0%) |
| $2,500 to $2,999 | 0 (0.0%) | 0 (0.0%) |
| $3,000 or more | 0 (0.0%) | 0 (0.0%) |
| Total | 204 (100.0%) | 36 (100.0%) |
Physical Housing Characteristics in Sabula
Housing Structures in Sabula
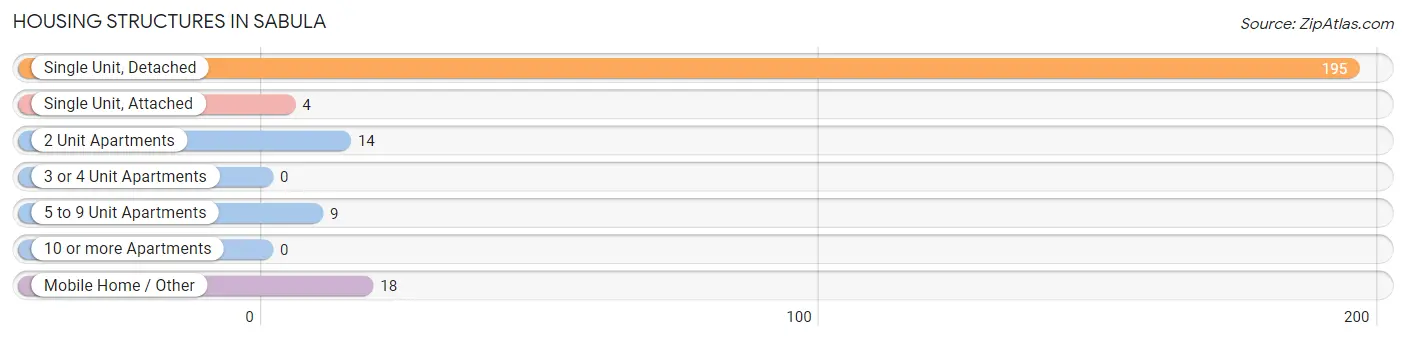
| Structure Type | # Housing Units | % Housing Units |
| Single Unit, Detached | 195 | 81.2% |
| Single Unit, Attached | 4 | 1.7% |
| 2 Unit Apartments | 14 | 5.8% |
| 3 or 4 Unit Apartments | 0 | 0.0% |
| 5 to 9 Unit Apartments | 9 | 3.7% |
| 10 or more Apartments | 0 | 0.0% |
| Mobile Home / Other | 18 | 7.5% |
| Total | 240 | 100.0% |
Housing Structures by Occupancy in Sabula
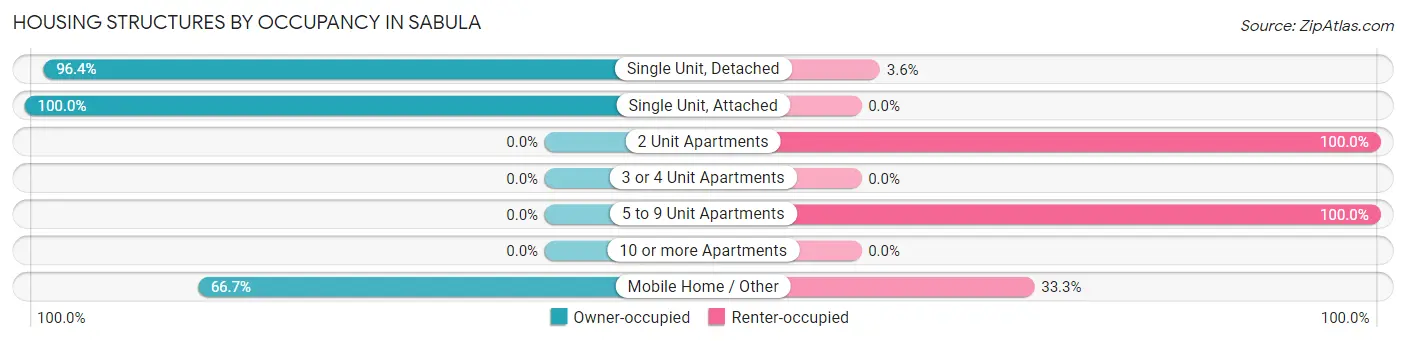
| Structure Type | Owner-occupied | Renter-occupied |
| Single Unit, Detached | 188 (96.4%) | 7 (3.6%) |
| Single Unit, Attached | 4 (100.0%) | 0 (0.0%) |
| 2 Unit Apartments | 0 (0.0%) | 14 (100.0%) |
| 3 or 4 Unit Apartments | 0 (0.0%) | 0 (0.0%) |
| 5 to 9 Unit Apartments | 0 (0.0%) | 9 (100.0%) |
| 10 or more Apartments | 0 (0.0%) | 0 (0.0%) |
| Mobile Home / Other | 12 (66.7%) | 6 (33.3%) |
| Total | 204 (85.0%) | 36 (15.0%) |
Housing Structures by Number of Rooms in Sabula
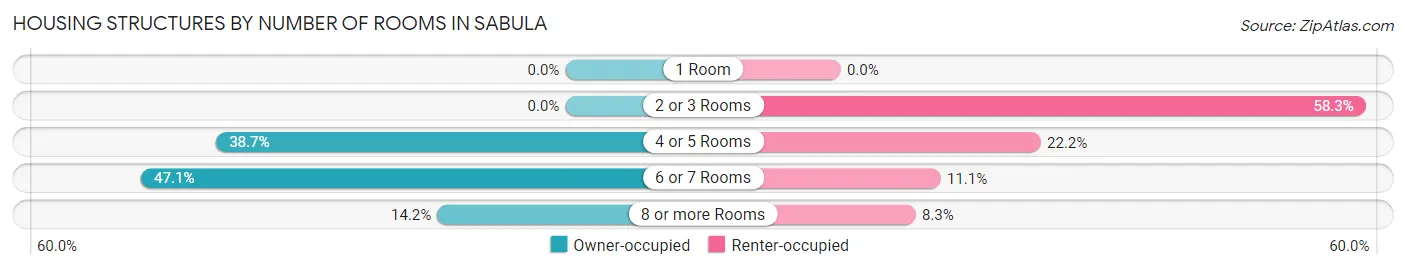
| Number of Rooms | Owner-occupied | Renter-occupied |
| 1 Room | 0 (0.0%) | 0 (0.0%) |
| 2 or 3 Rooms | 0 (0.0%) | 21 (58.3%) |
| 4 or 5 Rooms | 79 (38.7%) | 8 (22.2%) |
| 6 or 7 Rooms | 96 (47.1%) | 4 (11.1%) |
| 8 or more Rooms | 29 (14.2%) | 3 (8.3%) |
| Total | 204 (100.0%) | 36 (100.0%) |
Housing Structure by Heating Type in Sabula
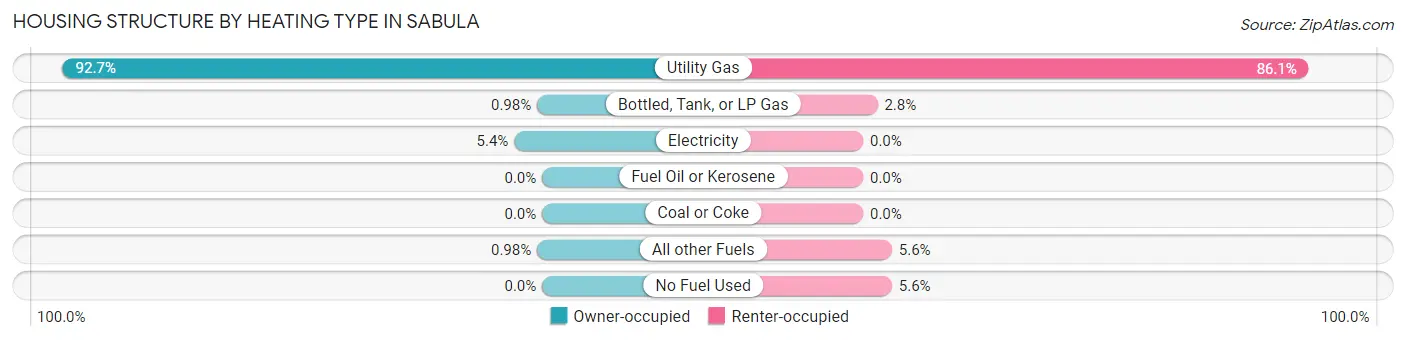
| Heating Type | Owner-occupied | Renter-occupied |
| Utility Gas | 189 (92.6%) | 31 (86.1%) |
| Bottled, Tank, or LP Gas | 2 (1.0%) | 1 (2.8%) |
| Electricity | 11 (5.4%) | 0 (0.0%) |
| Fuel Oil or Kerosene | 0 (0.0%) | 0 (0.0%) |
| Coal or Coke | 0 (0.0%) | 0 (0.0%) |
| All other Fuels | 2 (1.0%) | 2 (5.6%) |
| No Fuel Used | 0 (0.0%) | 2 (5.6%) |
| Total | 204 (100.0%) | 36 (100.0%) |
Household Vehicle Usage in Sabula
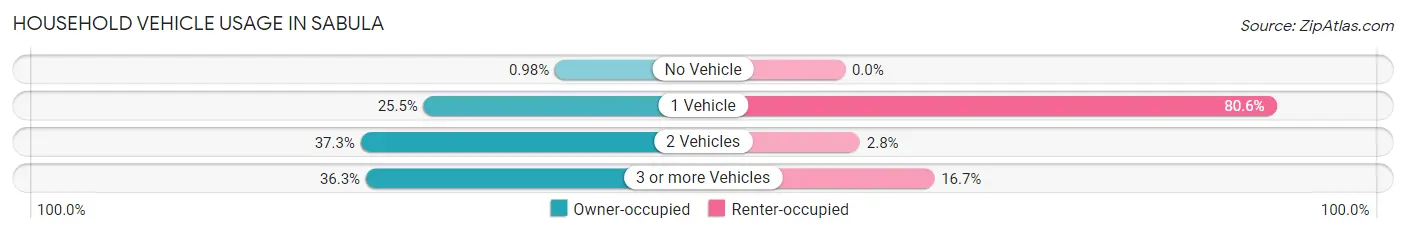
| Vehicles per Household | Owner-occupied | Renter-occupied |
| No Vehicle | 2 (1.0%) | 0 (0.0%) |
| 1 Vehicle | 52 (25.5%) | 29 (80.6%) |
| 2 Vehicles | 76 (37.2%) | 1 (2.8%) |
| 3 or more Vehicles | 74 (36.3%) | 6 (16.7%) |
| Total | 204 (100.0%) | 36 (100.0%) |
Real Estate & Mortgages in Sabula
Real Estate and Mortgage Overview in Sabula
| Characteristic | Without Mortgage | With Mortgage |
| Housing Units | 102 | 102 |
| Median Property Value | $123,500 | $102,100 |
| Median Household Income | $46,667 | $4 |
| Monthly Housing Costs | $521 | $0 |
| Real Estate Taxes | $1,667 | $0 |
Property Value by Mortgage Status in Sabula
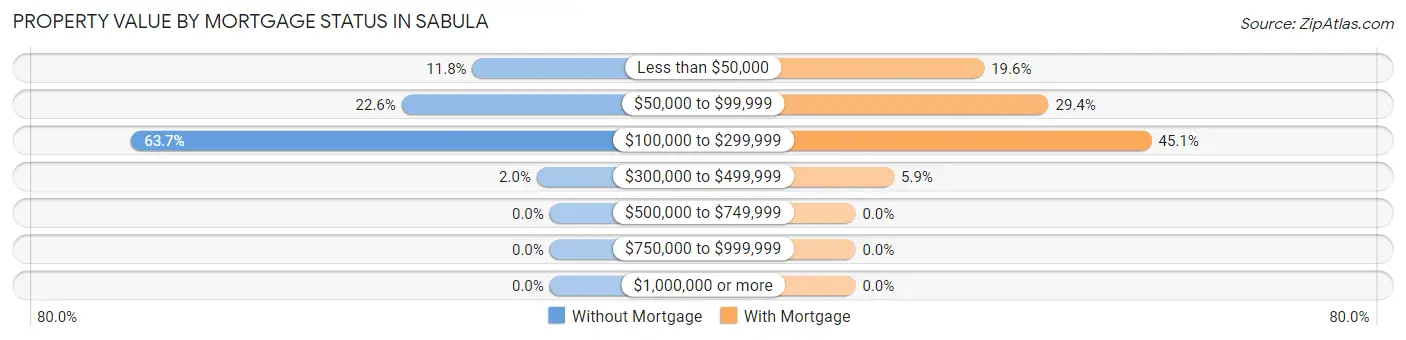
| Property Value | Without Mortgage | With Mortgage |
| Less than $50,000 | 12 (11.8%) | 20 (19.6%) |
| $50,000 to $99,999 | 23 (22.6%) | 30 (29.4%) |
| $100,000 to $299,999 | 65 (63.7%) | 46 (45.1%) |
| $300,000 to $499,999 | 2 (2.0%) | 6 (5.9%) |
| $500,000 to $749,999 | 0 (0.0%) | 0 (0.0%) |
| $750,000 to $999,999 | 0 (0.0%) | 0 (0.0%) |
| $1,000,000 or more | 0 (0.0%) | 0 (0.0%) |
| Total | 102 (100.0%) | 102 (100.0%) |
Household Income by Mortgage Status in Sabula
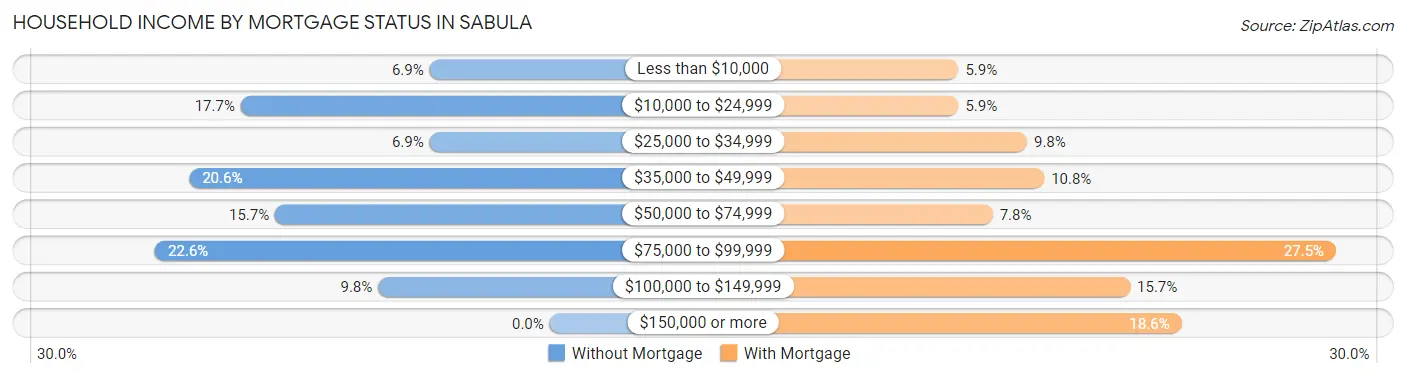
| Household Income | Without Mortgage | With Mortgage |
| Less than $10,000 | 7 (6.9%) | 6 (5.9%) |
| $10,000 to $24,999 | 18 (17.6%) | 6 (5.9%) |
| $25,000 to $34,999 | 7 (6.9%) | 10 (9.8%) |
| $35,000 to $49,999 | 21 (20.6%) | 11 (10.8%) |
| $50,000 to $74,999 | 16 (15.7%) | 8 (7.8%) |
| $75,000 to $99,999 | 23 (22.6%) | 28 (27.5%) |
| $100,000 to $149,999 | 10 (9.8%) | 16 (15.7%) |
| $150,000 or more | 0 (0.0%) | 19 (18.6%) |
| Total | 102 (100.0%) | 102 (100.0%) |
Property Value to Household Income Ratio in Sabula
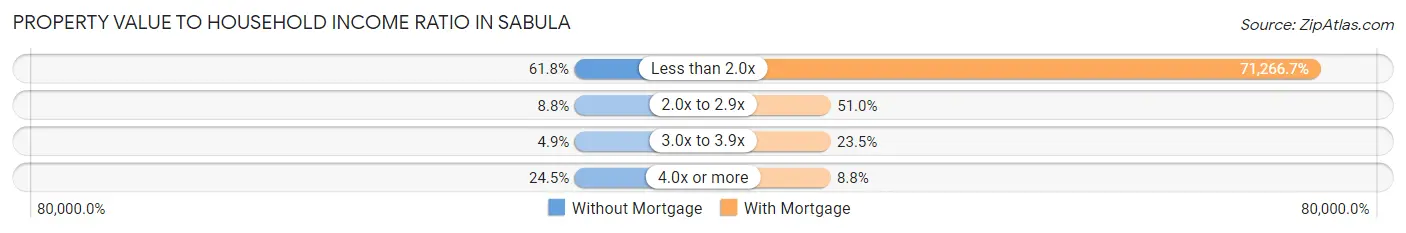
| Value-to-Income Ratio | Without Mortgage | With Mortgage |
| Less than 2.0x | 63 (61.8%) | 72,692 (71,266.7%) |
| 2.0x to 2.9x | 9 (8.8%) | 52 (51.0%) |
| 3.0x to 3.9x | 5 (4.9%) | 24 (23.5%) |
| 4.0x or more | 25 (24.5%) | 9 (8.8%) |
| Total | 102 (100.0%) | 102 (100.0%) |
Real Estate Taxes by Mortgage Status in Sabula
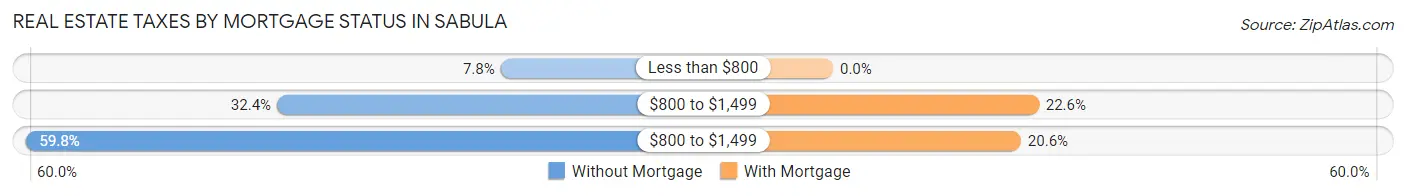
| Property Taxes | Without Mortgage | With Mortgage |
| Less than $800 | 8 (7.8%) | 0 (0.0%) |
| $800 to $1,499 | 33 (32.4%) | 23 (22.6%) |
| $800 to $1,499 | 61 (59.8%) | 21 (20.6%) |
| Total | 102 (100.0%) | 102 (100.0%) |
Health & Disability in Sabula
Health Insurance Coverage by Age in Sabula
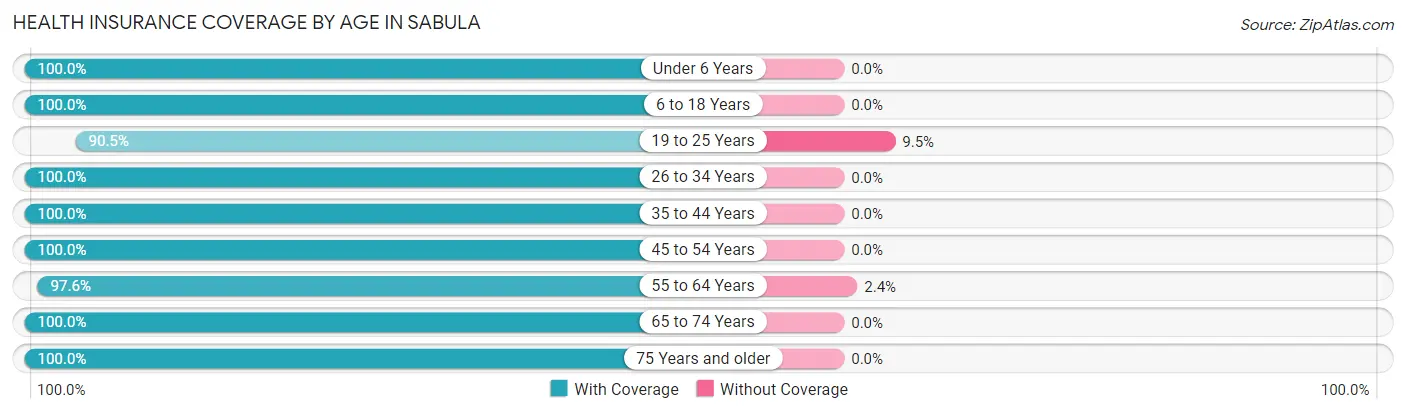
| Age Bracket | With Coverage | Without Coverage |
| Under 6 Years | 10 (100.0%) | 0 (0.0%) |
| 6 to 18 Years | 103 (100.0%) | 0 (0.0%) |
| 19 to 25 Years | 38 (90.5%) | 4 (9.5%) |
| 26 to 34 Years | 31 (100.0%) | 0 (0.0%) |
| 35 to 44 Years | 80 (100.0%) | 0 (0.0%) |
| 45 to 54 Years | 58 (100.0%) | 0 (0.0%) |
| 55 to 64 Years | 80 (97.6%) | 2 (2.4%) |
| 65 to 74 Years | 87 (100.0%) | 0 (0.0%) |
| 75 Years and older | 55 (100.0%) | 0 (0.0%) |
| Total | 542 (98.9%) | 6 (1.1%) |
Health Insurance Coverage by Citizenship Status in Sabula
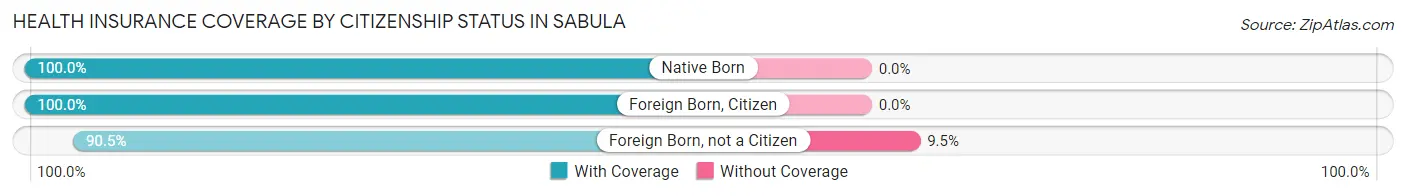
| Citizenship Status | With Coverage | Without Coverage |
| Native Born | 10 (100.0%) | 0 (0.0%) |
| Foreign Born, Citizen | 103 (100.0%) | 0 (0.0%) |
| Foreign Born, not a Citizen | 38 (90.5%) | 4 (9.5%) |
Health Insurance Coverage by Household Income in Sabula
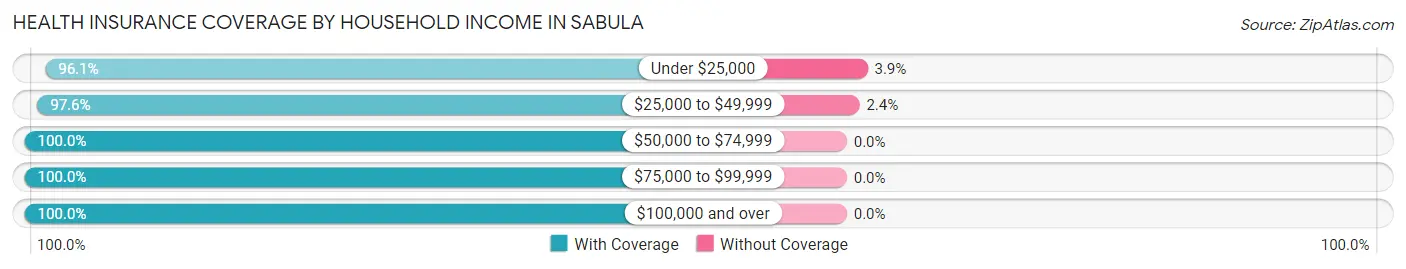
| Household Income | With Coverage | Without Coverage |
| Under $25,000 | 99 (96.1%) | 4 (3.9%) |
| $25,000 to $49,999 | 82 (97.6%) | 2 (2.4%) |
| $50,000 to $74,999 | 98 (100.0%) | 0 (0.0%) |
| $75,000 to $99,999 | 120 (100.0%) | 0 (0.0%) |
| $100,000 and over | 143 (100.0%) | 0 (0.0%) |
Public vs Private Health Insurance Coverage by Age in Sabula
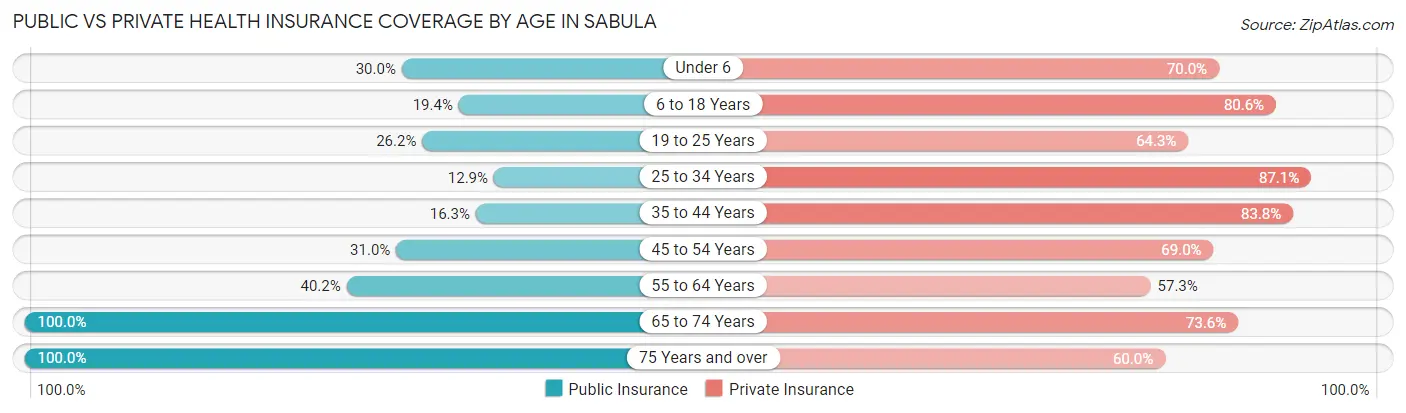
| Age Bracket | Public Insurance | Private Insurance |
| Under 6 | 3 (30.0%) | 7 (70.0%) |
| 6 to 18 Years | 20 (19.4%) | 83 (80.6%) |
| 19 to 25 Years | 11 (26.2%) | 27 (64.3%) |
| 25 to 34 Years | 4 (12.9%) | 27 (87.1%) |
| 35 to 44 Years | 13 (16.3%) | 67 (83.8%) |
| 45 to 54 Years | 18 (31.0%) | 40 (69.0%) |
| 55 to 64 Years | 33 (40.2%) | 47 (57.3%) |
| 65 to 74 Years | 87 (100.0%) | 64 (73.6%) |
| 75 Years and over | 55 (100.0%) | 33 (60.0%) |
| Total | 244 (44.5%) | 395 (72.1%) |
Disability Status by Sex by Age in Sabula
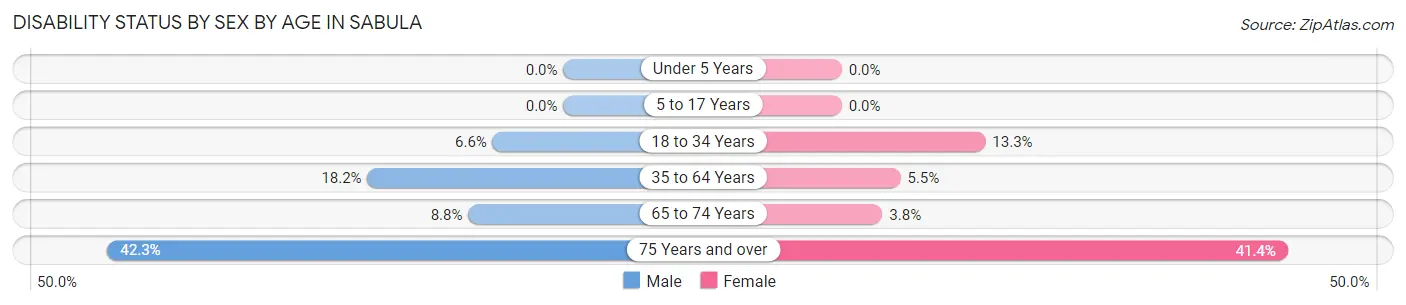
| Age Bracket | Male | Female |
| Under 5 Years | 0 (0.0%) | 0 (0.0%) |
| 5 to 17 Years | 0 (0.0%) | 0 (0.0%) |
| 18 to 34 Years | 4 (6.6%) | 4 (13.3%) |
| 35 to 64 Years | 20 (18.2%) | 6 (5.4%) |
| 65 to 74 Years | 3 (8.8%) | 2 (3.8%) |
| 75 Years and over | 11 (42.3%) | 12 (41.4%) |
Disability Class by Sex by Age in Sabula
Disability Class: Hearing Difficulty
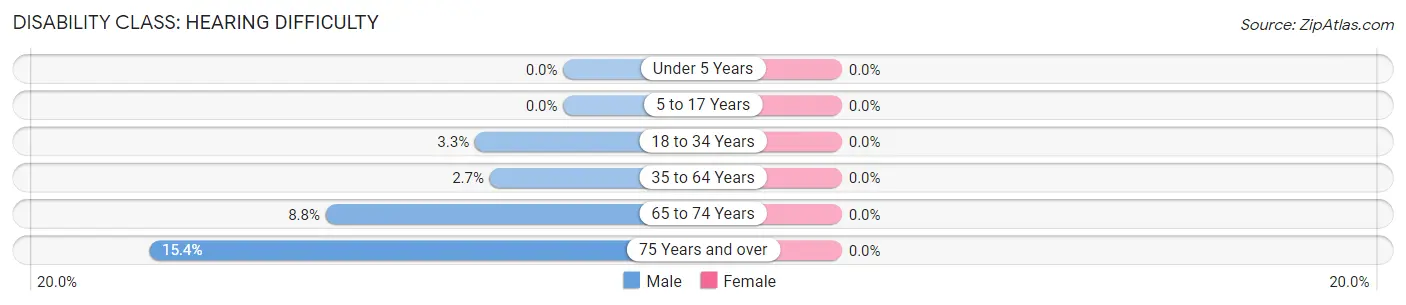
| Age Bracket | Male | Female |
| Under 5 Years | 0 (0.0%) | 0 (0.0%) |
| 5 to 17 Years | 0 (0.0%) | 0 (0.0%) |
| 18 to 34 Years | 2 (3.3%) | 0 (0.0%) |
| 35 to 64 Years | 3 (2.7%) | 0 (0.0%) |
| 65 to 74 Years | 3 (8.8%) | 0 (0.0%) |
| 75 Years and over | 4 (15.4%) | 0 (0.0%) |
Disability Class: Vision Difficulty
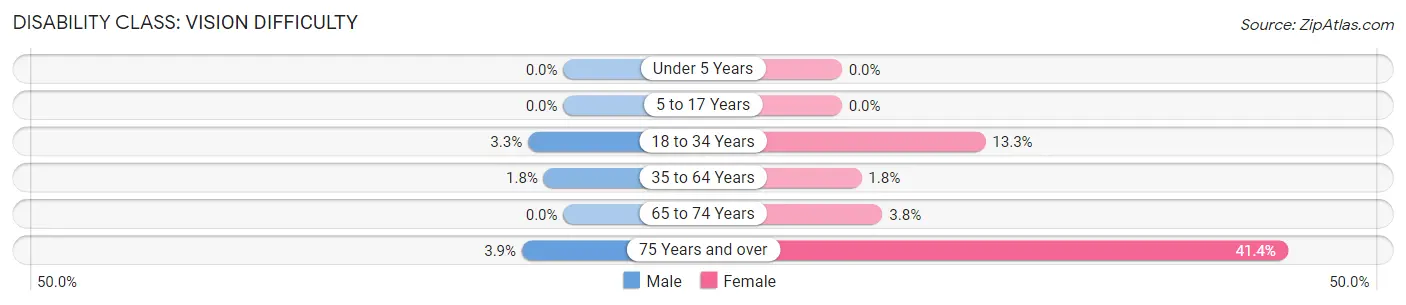
| Age Bracket | Male | Female |
| Under 5 Years | 0 (0.0%) | 0 (0.0%) |
| 5 to 17 Years | 0 (0.0%) | 0 (0.0%) |
| 18 to 34 Years | 2 (3.3%) | 4 (13.3%) |
| 35 to 64 Years | 2 (1.8%) | 2 (1.8%) |
| 65 to 74 Years | 0 (0.0%) | 2 (3.8%) |
| 75 Years and over | 1 (3.8%) | 12 (41.4%) |
Disability Class: Cognitive Difficulty
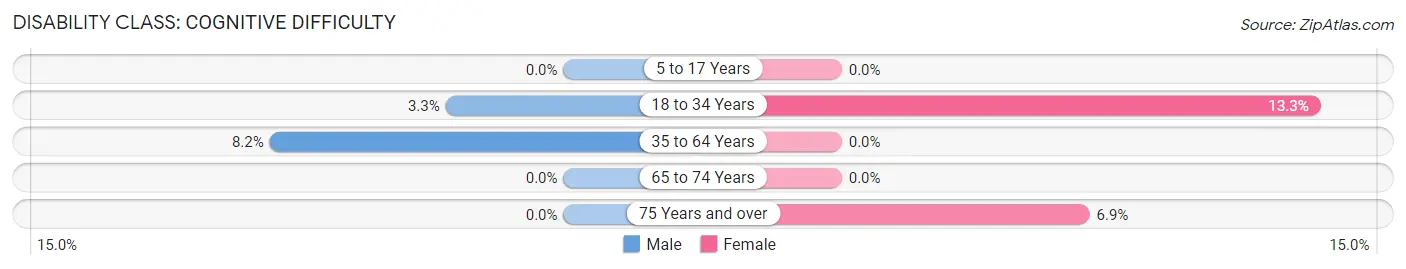
| Age Bracket | Male | Female |
| 5 to 17 Years | 0 (0.0%) | 0 (0.0%) |
| 18 to 34 Years | 2 (3.3%) | 4 (13.3%) |
| 35 to 64 Years | 9 (8.2%) | 0 (0.0%) |
| 65 to 74 Years | 0 (0.0%) | 0 (0.0%) |
| 75 Years and over | 0 (0.0%) | 2 (6.9%) |
Disability Class: Ambulatory Difficulty
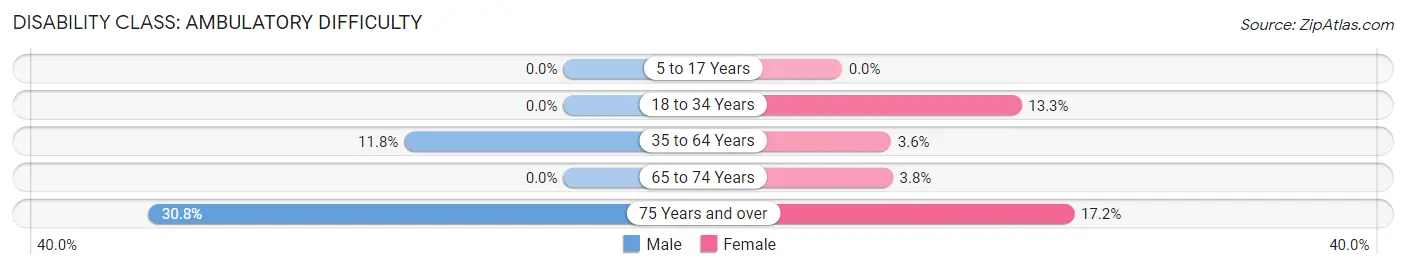
| Age Bracket | Male | Female |
| 5 to 17 Years | 0 (0.0%) | 0 (0.0%) |
| 18 to 34 Years | 0 (0.0%) | 4 (13.3%) |
| 35 to 64 Years | 13 (11.8%) | 4 (3.6%) |
| 65 to 74 Years | 0 (0.0%) | 2 (3.8%) |
| 75 Years and over | 8 (30.8%) | 5 (17.2%) |
Disability Class: Self-Care Difficulty
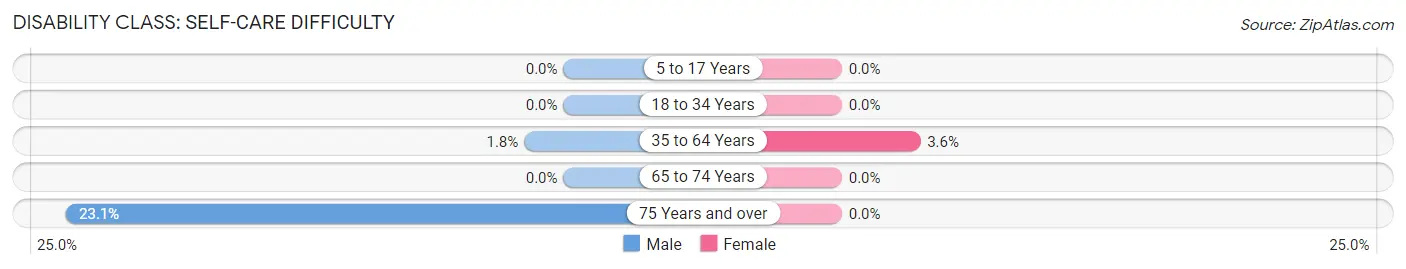
| Age Bracket | Male | Female |
| 5 to 17 Years | 0 (0.0%) | 0 (0.0%) |
| 18 to 34 Years | 0 (0.0%) | 0 (0.0%) |
| 35 to 64 Years | 2 (1.8%) | 4 (3.6%) |
| 65 to 74 Years | 0 (0.0%) | 0 (0.0%) |
| 75 Years and over | 6 (23.1%) | 0 (0.0%) |
Technology Access in Sabula
Computing Device Access in Sabula
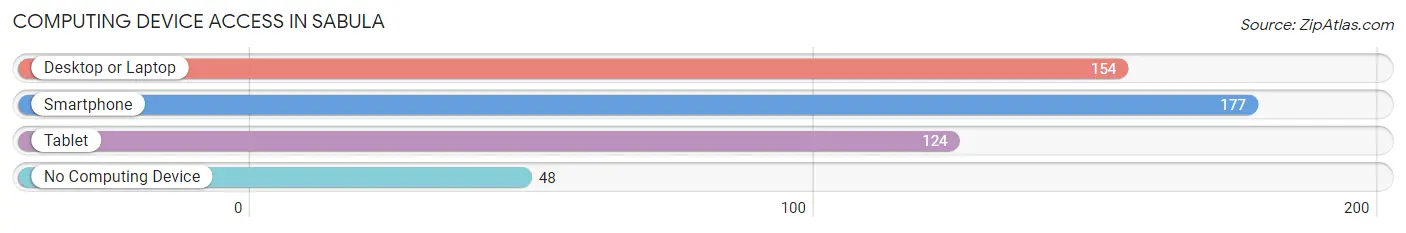
| Device Type | # Households | % Households |
| Desktop or Laptop | 154 | 64.2% |
| Smartphone | 177 | 73.8% |
| Tablet | 124 | 51.7% |
| No Computing Device | 48 | 20.0% |
| Total | 240 | 100.0% |
Internet Access in Sabula
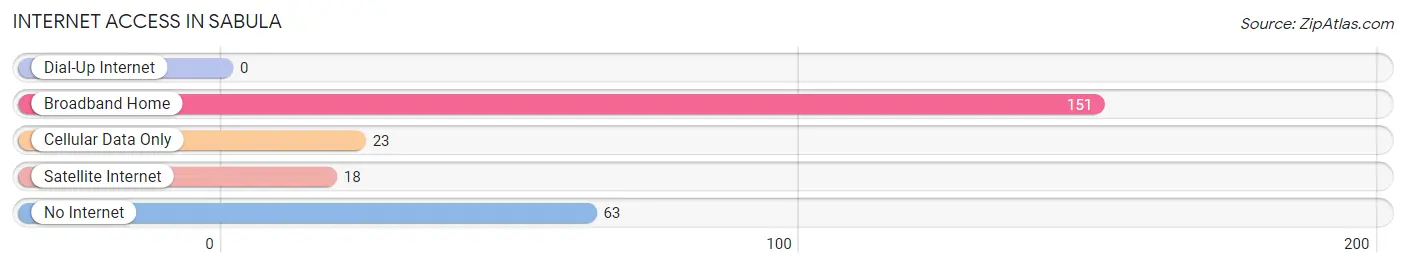
| Internet Type | # Households | % Households |
| Dial-Up Internet | 0 | 0.0% |
| Broadband Home | 151 | 62.9% |
| Cellular Data Only | 23 | 9.6% |
| Satellite Internet | 18 | 7.5% |
| No Internet | 63 | 26.3% |
| Total | 240 | 100.0% |
Sabula Summary
Sabula, Iowa is a small city located in Jackson County, Iowa, United States. It is situated on the banks of the Mississippi River, just across the river from the state of Illinois. The city has a population of approximately 1,000 people, and is the county seat of Jackson County.
History
The area that is now Sabula was first settled in 1837 by a group of settlers from Ohio. The settlement was originally known as “Ohio Town”, but was later renamed Sabula, after the nearby Sabula Creek. The name Sabula is derived from the Native American word for “river”.
The city was officially incorporated in 1851, and was designated as the county seat of Jackson County in 1853. The city was an important port on the Mississippi River, and was a major hub for the lumber industry. The city was also home to a number of manufacturing plants, including a paper mill, a flour mill, and a brickyard.
Geography
Sabula is located in the southeastern corner of Jackson County, Iowa, on the banks of the Mississippi River. The city is situated on a peninsula, surrounded by the river on three sides. The city has a total area of 1.2 square miles, all of which is land.
The city has a humid continental climate, with hot, humid summers and cold, snowy winters. The average annual temperature is around 50°F, and the average annual precipitation is around 36 inches.
Economy
The economy of Sabula is largely based on tourism and agriculture. The city is home to a number of tourist attractions, including the Sabula Historical Museum, the Sabula Railroad Museum, and the Sabula Marina. The city is also home to a number of agricultural businesses, including a dairy farm, a hog farm, and a grain elevator.
Demographics
As of the 2010 census, the population of Sabula was 1,039. The racial makeup of the city was 97.2% White, 0.7% African American, 0.3% Native American, 0.2% Asian, 0.1% Pacific Islander, 0.4% from other races, and 1.1% from two or more races. Hispanic or Latino of any race were 1.2% of the population.
The median income for a household in the city was $37,500, and the median income for a family was $45,000. The per capita income for the city was $18,845. About 11.2% of families and 14.2% of the population were below the poverty line, including 18.2% of those under age 18 and 8.3% of those age 65 or over.
Common Questions
What is Per Capita Income in Sabula?
Per Capita income in Sabula is $28,019.
What is the Median Family Income in Sabula?
Median Family Income in Sabula is $74,821.
What is the Median Household income in Sabula?
Median Household Income in Sabula is $54,375.
What is Income or Wage Gap in Sabula?
Income or Wage Gap in Sabula is 40.1%.
Women in Sabula earn 59.9 cents for every dollar earned by a man.
What is Inequality or Gini Index in Sabula?
Inequality or Gini Index in Sabula is 0.39.
What is the Total Population of Sabula?
Total Population of Sabula is 548.
What is the Total Male Population of Sabula?
Total Male Population of Sabula is 291.
What is the Total Female Population of Sabula?
Total Female Population of Sabula is 257.
What is the Ratio of Males per 100 Females in Sabula?
There are 113.23 Males per 100 Females in Sabula.
What is the Ratio of Females per 100 Males in Sabula?
There are 88.32 Females per 100 Males in Sabula.
What is the Median Population Age in Sabula?
Median Population Age in Sabula is 46.8 Years.
What is the Average Family Size in Sabula
Average Family Size in Sabula is 2.8 People.
What is the Average Household Size in Sabula
Average Household Size in Sabula is 2.3 People.
How Large is the Labor Force in Sabula?
There are 240 People in the Labor Forcein in Sabula.
What is the Percentage of People in the Labor Force in Sabula?
50.8% of People are in the Labor Force in Sabula.
What is the Unemployment Rate in Sabula?
Unemployment Rate in Sabula is 4.6%.