Zip Codes with the Highest Percentage of Local Government Employees in Huntington, WV
RELATED REPORTS & OPTIONS
Local Government Employees
Huntington
Compare Zip Codes
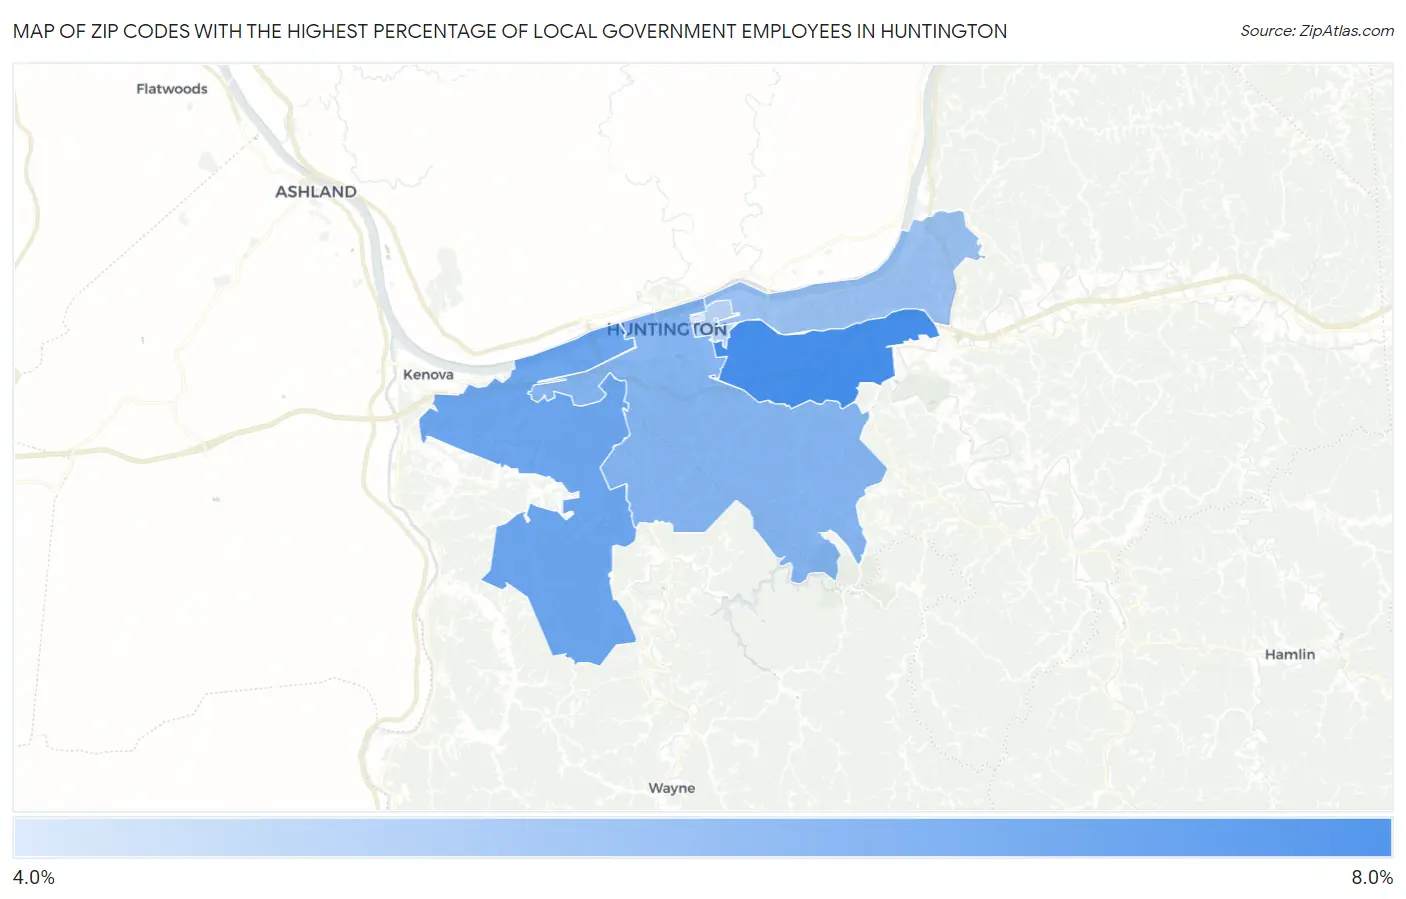
Map of Zip Codes with the Highest Percentage of Local Government Employees in Huntington
4.2%
7.3%
Zip Codes with the Highest Percentage of Local Government Employees in Huntington, WV
| Zip Code | % Local Government Employees | vs State | vs National | |
| 1. | 25705 | 7.3% | 7.5%(-0.153)#249 | 7.2%(+0.070)#15,392 |
| 2. | 25704 | 6.5% | 7.5%(-0.960)#283 | 7.2%(-0.737)#18,158 |
| 3. | 25701 | 6.0% | 7.5%(-1.49)#305 | 7.2%(-1.26)#19,903 |
| 4. | 25702 | 5.6% | 7.5%(-1.88)#319 | 7.2%(-1.66)#21,265 |
| 5. | 25703 | 5.0% | 7.5%(-2.47)#343 | 7.2%(-2.24)#23,104 |
| 6. | 25755 | 4.2% | 7.5%(-3.23)#374 | 7.2%(-3.00)#25,167 |
1
Common Questions
What are the Top 5 Zip Codes with the Highest Percentage of Local Government Employees in Huntington, WV?
Top 5 Zip Codes with the Highest Percentage of Local Government Employees in Huntington, WV are:
What zip code has the Highest Percentage of Local Government Employees in Huntington, WV?
25705 has the Highest Percentage of Local Government Employees in Huntington, WV with 7.3%.
What is the Percentage of Local Government Employees in Huntington, WV?
Percentage of Local Government Employees in Huntington is 6.2%.
What is the Percentage of Local Government Employees in West Virginia?
Percentage of Local Government Employees in West Virginia is 7.5%.
What is the Percentage of Local Government Employees in the United States?
Percentage of Local Government Employees in the United States is 7.2%.