Zip Codes with the Highest Percentage of Population Employed in Food Preparation & Serving in Watertown, WI
RELATED REPORTS & OPTIONS
Food Preparation & Serving
Watertown
Compare Zip Codes
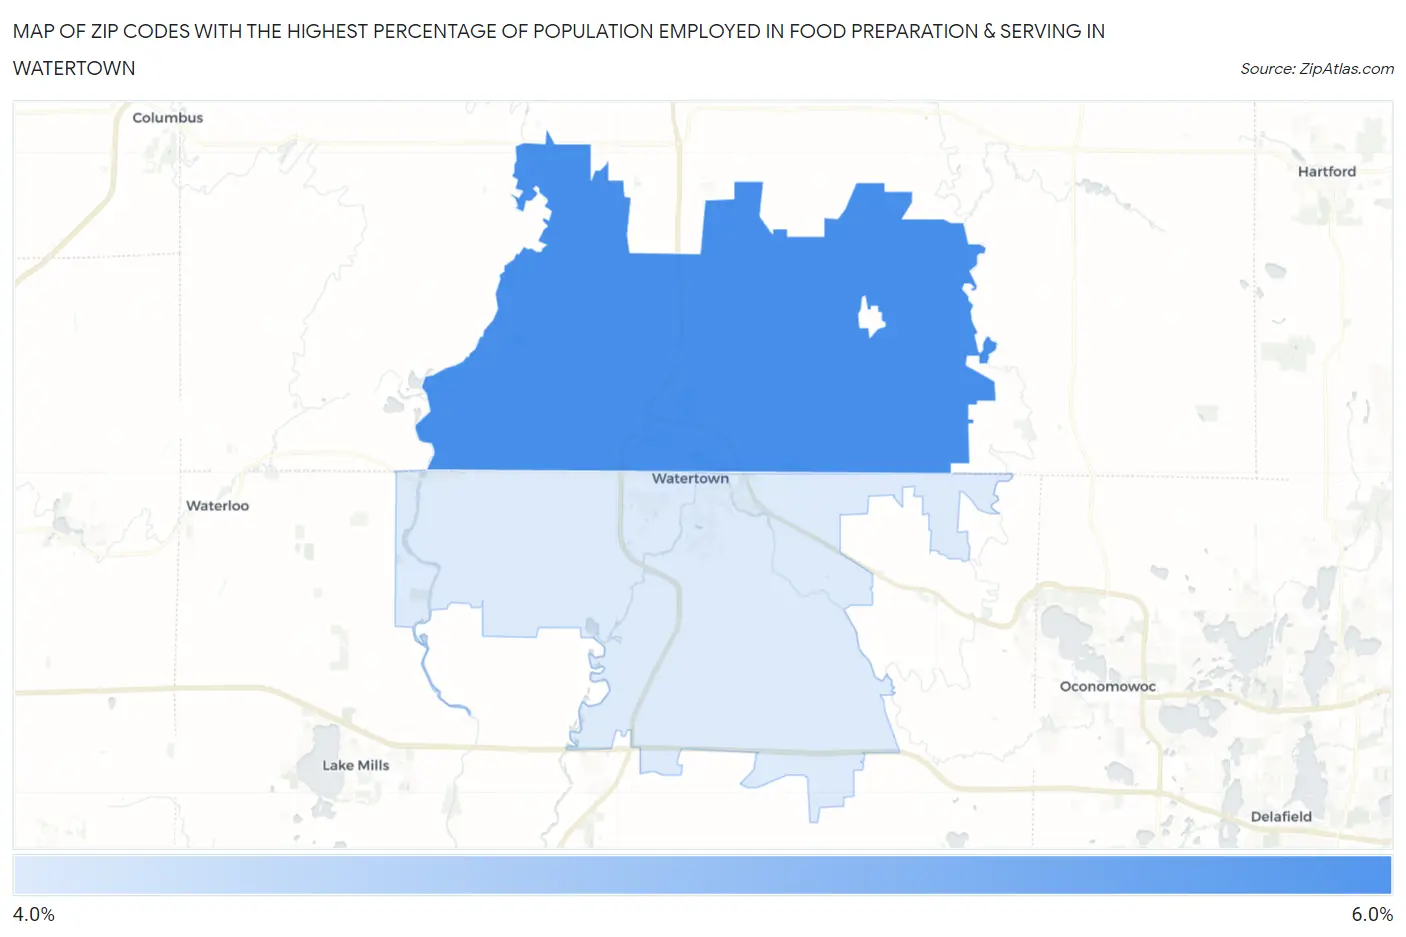
Map of Zip Codes with the Highest Percentage of Population Employed in Food Preparation & Serving in Watertown
4.7%
5.2%
Zip Codes with the Highest Percentage of Population Employed in Food Preparation & Serving in Watertown, WI
| Zip Code | % Employed | vs State | vs National | |
| 1. | 53098 | 5.2% | 5.0%(+0.167)#258 | 5.3%(-0.131)#12,341 |
| 2. | 53094 | 4.7% | 5.0%(-0.249)#313 | 5.3%(-0.548)#14,003 |
1
Common Questions
What are the Top Zip Codes with the Highest Percentage of Population Employed in Food Preparation & Serving in Watertown, WI?
Top Zip Codes with the Highest Percentage of Population Employed in Food Preparation & Serving in Watertown, WI are:
What zip code has the Highest Percentage of Population Employed in Food Preparation & Serving in Watertown, WI?
53098 has the Highest Percentage of Population Employed in Food Preparation & Serving in Watertown, WI with 5.2%.
What is the Percentage of Population Employed in Food Preparation & Serving in Watertown, WI?
Percentage of Population Employed in Food Preparation & Serving in Watertown is 5.5%.
What is the Percentage of Population Employed in Food Preparation & Serving in Wisconsin?
Percentage of Population Employed in Food Preparation & Serving in Wisconsin is 5.0%.
What is the Percentage of Population Employed in Food Preparation & Serving in the United States?
Percentage of Population Employed in Food Preparation & Serving in the United States is 5.3%.