Zip Codes with the Highest Percentage of Population Employed in Food Preparation & Serving in Sheboygan, WI
RELATED REPORTS & OPTIONS
Food Preparation & Serving
Sheboygan
Compare Zip Codes
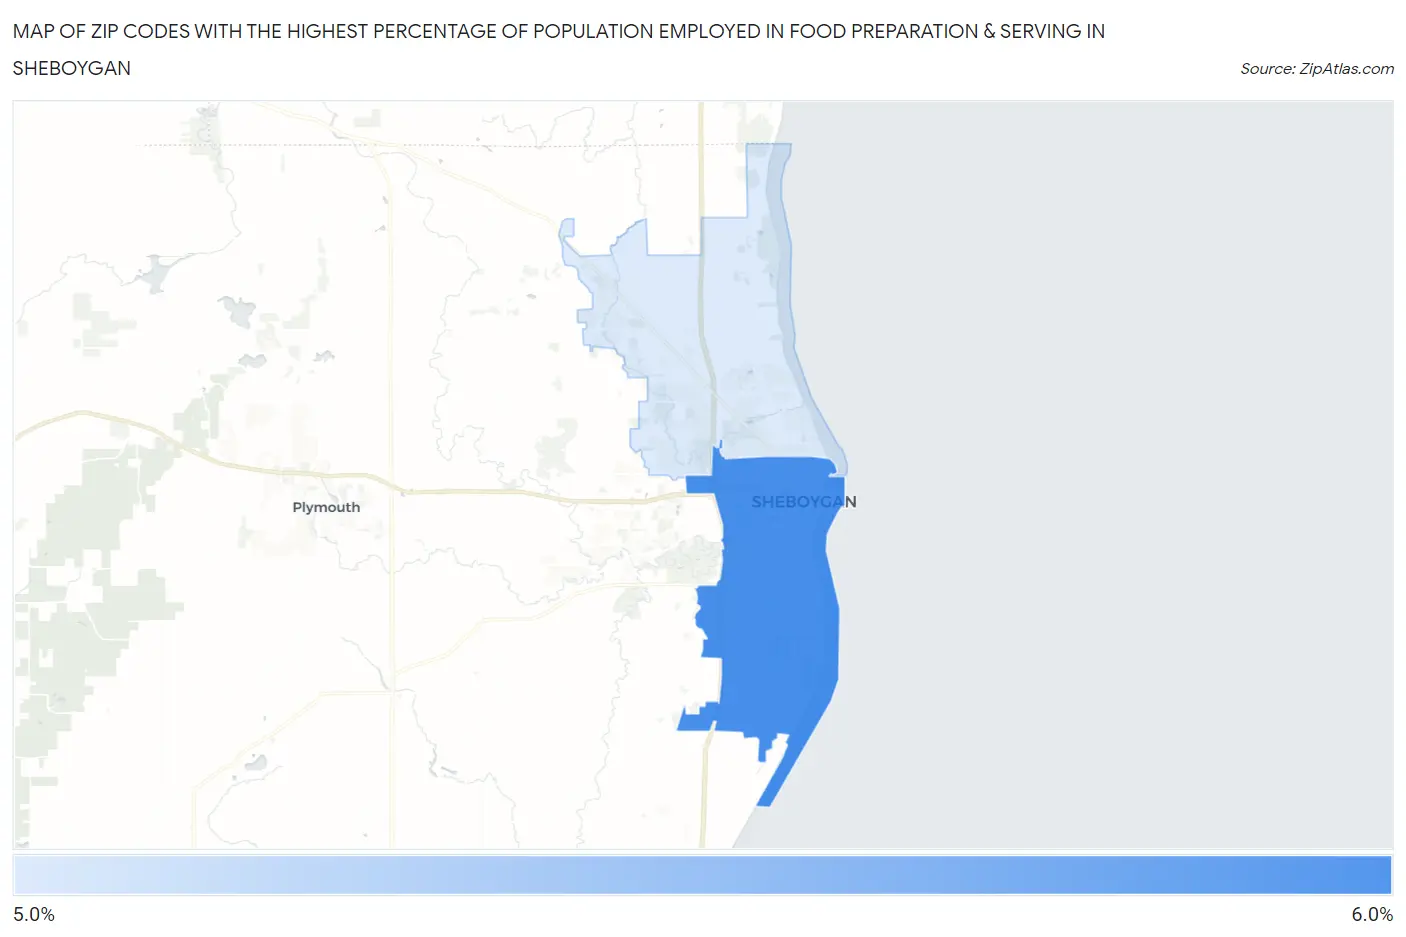
Map of Zip Codes with the Highest Percentage of Population Employed in Food Preparation & Serving in Sheboygan
5.7%
6.0%
Zip Codes with the Highest Percentage of Population Employed in Food Preparation & Serving in Sheboygan, WI
| Zip Code | % Employed | vs State | vs National | |
| 1. | 53081 | 6.0% | 5.0%(+0.967)#157 | 5.3%(+0.669)#9,489 |
| 2. | 53083 | 5.7% | 5.0%(+0.706)#197 | 5.3%(+0.407)#10,374 |
1
Common Questions
What are the Top Zip Codes with the Highest Percentage of Population Employed in Food Preparation & Serving in Sheboygan, WI?
Top Zip Codes with the Highest Percentage of Population Employed in Food Preparation & Serving in Sheboygan, WI are:
What zip code has the Highest Percentage of Population Employed in Food Preparation & Serving in Sheboygan, WI?
53081 has the Highest Percentage of Population Employed in Food Preparation & Serving in Sheboygan, WI with 6.0%.
What is the Percentage of Population Employed in Food Preparation & Serving in Sheboygan, WI?
Percentage of Population Employed in Food Preparation & Serving in Sheboygan is 6.5%.
What is the Percentage of Population Employed in Food Preparation & Serving in Wisconsin?
Percentage of Population Employed in Food Preparation & Serving in Wisconsin is 5.0%.
What is the Percentage of Population Employed in Food Preparation & Serving in the United States?
Percentage of Population Employed in Food Preparation & Serving in the United States is 5.3%.