Zip Codes with the Highest Percentage of Population Employed in Food Preparation & Serving in Kenosha, WI
RELATED REPORTS & OPTIONS
Food Preparation & Serving
Kenosha
Compare Zip Codes
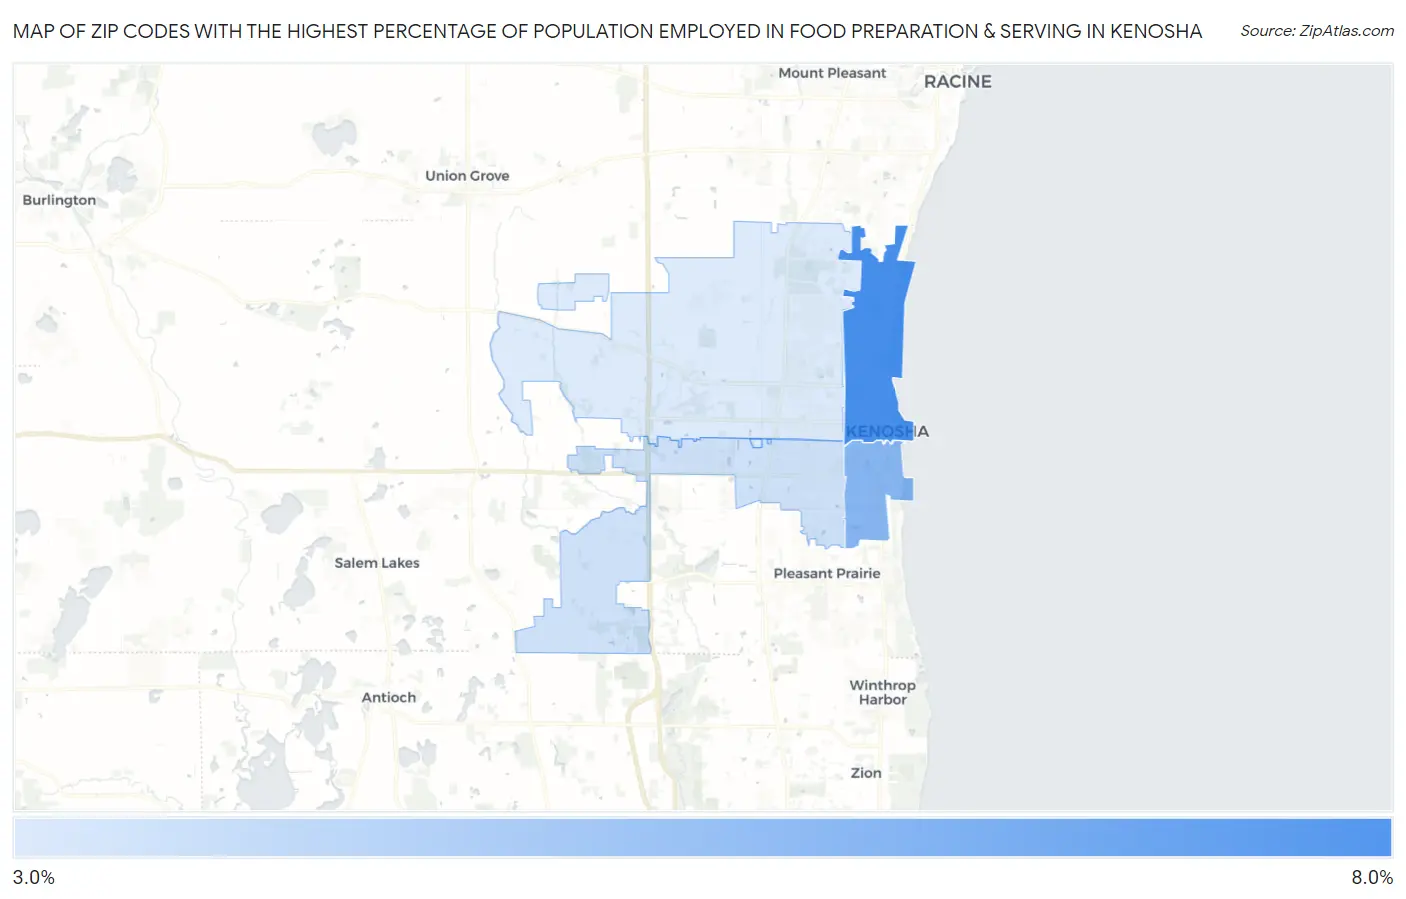
Map of Zip Codes with the Highest Percentage of Population Employed in Food Preparation & Serving in Kenosha
3.8%
8.0%
Zip Codes with the Highest Percentage of Population Employed in Food Preparation & Serving in Kenosha, WI
| Zip Code | % Employed | vs State | vs National | |
| 1. | 53140 | 8.0% | 5.0%(+3.00)#54 | 5.3%(+2.70)#4,747 |
| 2. | 53143 | 6.2% | 5.0%(+1.21)#144 | 5.3%(+0.907)#8,755 |
| 3. | 53142 | 4.2% | 5.0%(-0.797)#393 | 5.3%(-1.10)#16,357 |
| 4. | 53144 | 3.8% | 5.0%(-1.15)#449 | 5.3%(-1.45)#17,796 |
1
Common Questions
What are the Top 3 Zip Codes with the Highest Percentage of Population Employed in Food Preparation & Serving in Kenosha, WI?
Top 3 Zip Codes with the Highest Percentage of Population Employed in Food Preparation & Serving in Kenosha, WI are:
What zip code has the Highest Percentage of Population Employed in Food Preparation & Serving in Kenosha, WI?
53140 has the Highest Percentage of Population Employed in Food Preparation & Serving in Kenosha, WI with 8.0%.
What is the Percentage of Population Employed in Food Preparation & Serving in Kenosha, WI?
Percentage of Population Employed in Food Preparation & Serving in Kenosha is 5.7%.
What is the Percentage of Population Employed in Food Preparation & Serving in Wisconsin?
Percentage of Population Employed in Food Preparation & Serving in Wisconsin is 5.0%.
What is the Percentage of Population Employed in Food Preparation & Serving in the United States?
Percentage of Population Employed in Food Preparation & Serving in the United States is 5.3%.