Zip Codes with the Highest Percentage of Population Employed in Food Preparation & Serving in Waukesha, WI
RELATED REPORTS & OPTIONS
Food Preparation & Serving
Waukesha
Compare Zip Codes
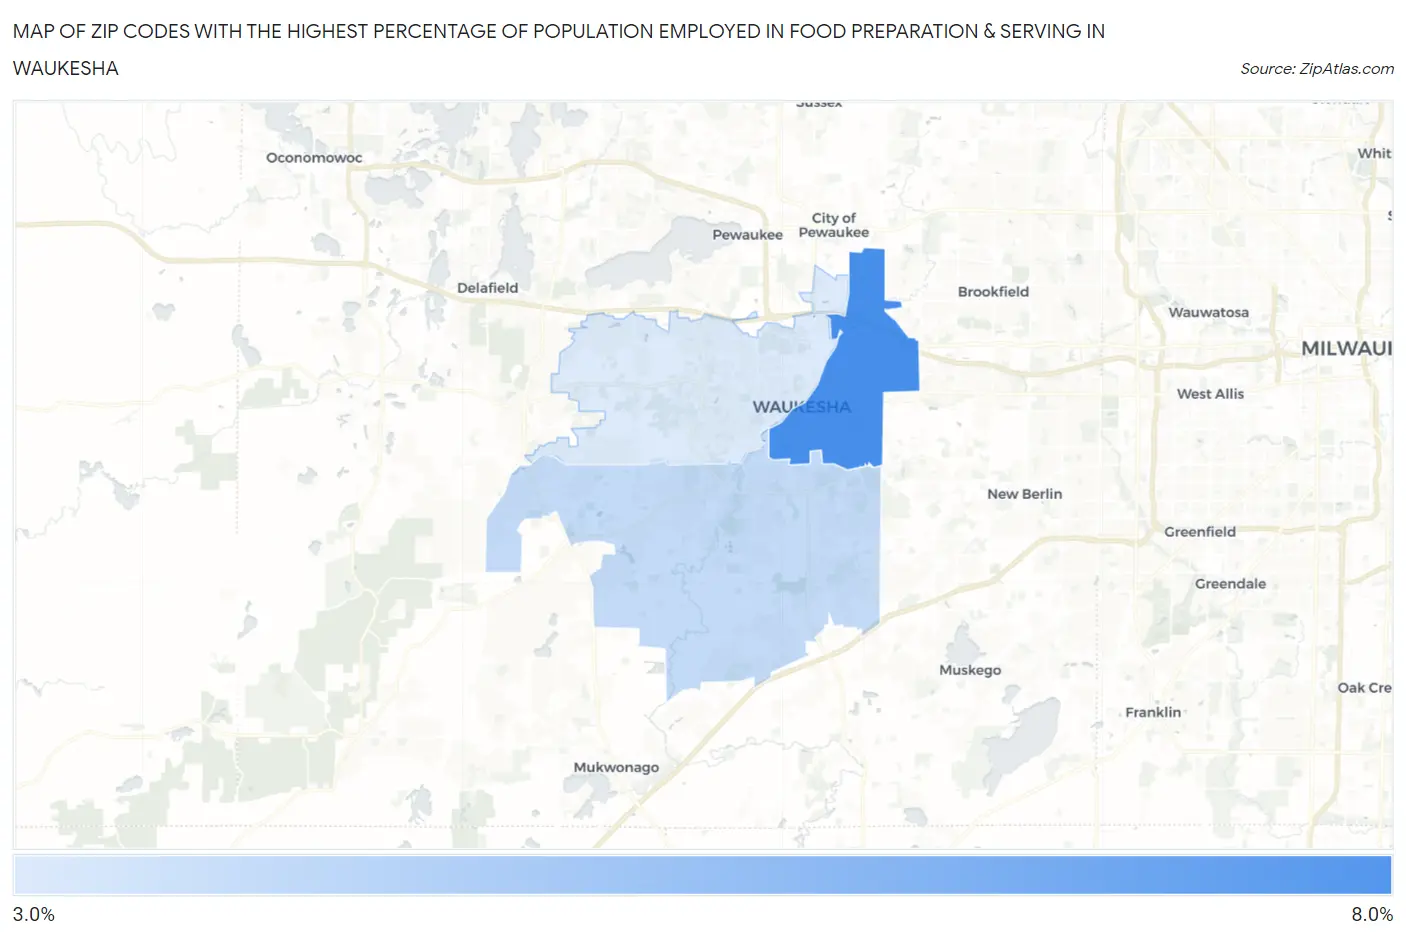
Map of Zip Codes with the Highest Percentage of Population Employed in Food Preparation & Serving in Waukesha
3.6%
6.4%
Zip Codes with the Highest Percentage of Population Employed in Food Preparation & Serving in Waukesha, WI
| Zip Code | % Employed | vs State | vs National | |
| 1. | 53186 | 6.4% | 5.0%(+1.38)#130 | 5.3%(+1.08)#8,241 |
| 2. | 53189 | 4.0% | 5.0%(-0.971)#421 | 5.3%(-1.27)#17,064 |
| 3. | 53188 | 3.6% | 5.0%(-1.43)#491 | 5.3%(-1.73)#18,980 |
1
Common Questions
What are the Top Zip Codes with the Highest Percentage of Population Employed in Food Preparation & Serving in Waukesha, WI?
Top Zip Codes with the Highest Percentage of Population Employed in Food Preparation & Serving in Waukesha, WI are:
What zip code has the Highest Percentage of Population Employed in Food Preparation & Serving in Waukesha, WI?
53186 has the Highest Percentage of Population Employed in Food Preparation & Serving in Waukesha, WI with 6.4%.
What is the Percentage of Population Employed in Food Preparation & Serving in Waukesha, WI?
Percentage of Population Employed in Food Preparation & Serving in Waukesha is 2.8%.
What is the Percentage of Population Employed in Food Preparation & Serving in Wisconsin?
Percentage of Population Employed in Food Preparation & Serving in Wisconsin is 5.0%.
What is the Percentage of Population Employed in Food Preparation & Serving in the United States?
Percentage of Population Employed in Food Preparation & Serving in the United States is 5.3%.