Zip Codes with the Highest Percentage of Population Employed in Food Preparation & Serving in Eau Claire, WI
RELATED REPORTS & OPTIONS
Food Preparation & Serving
Eau Claire
Compare Zip Codes
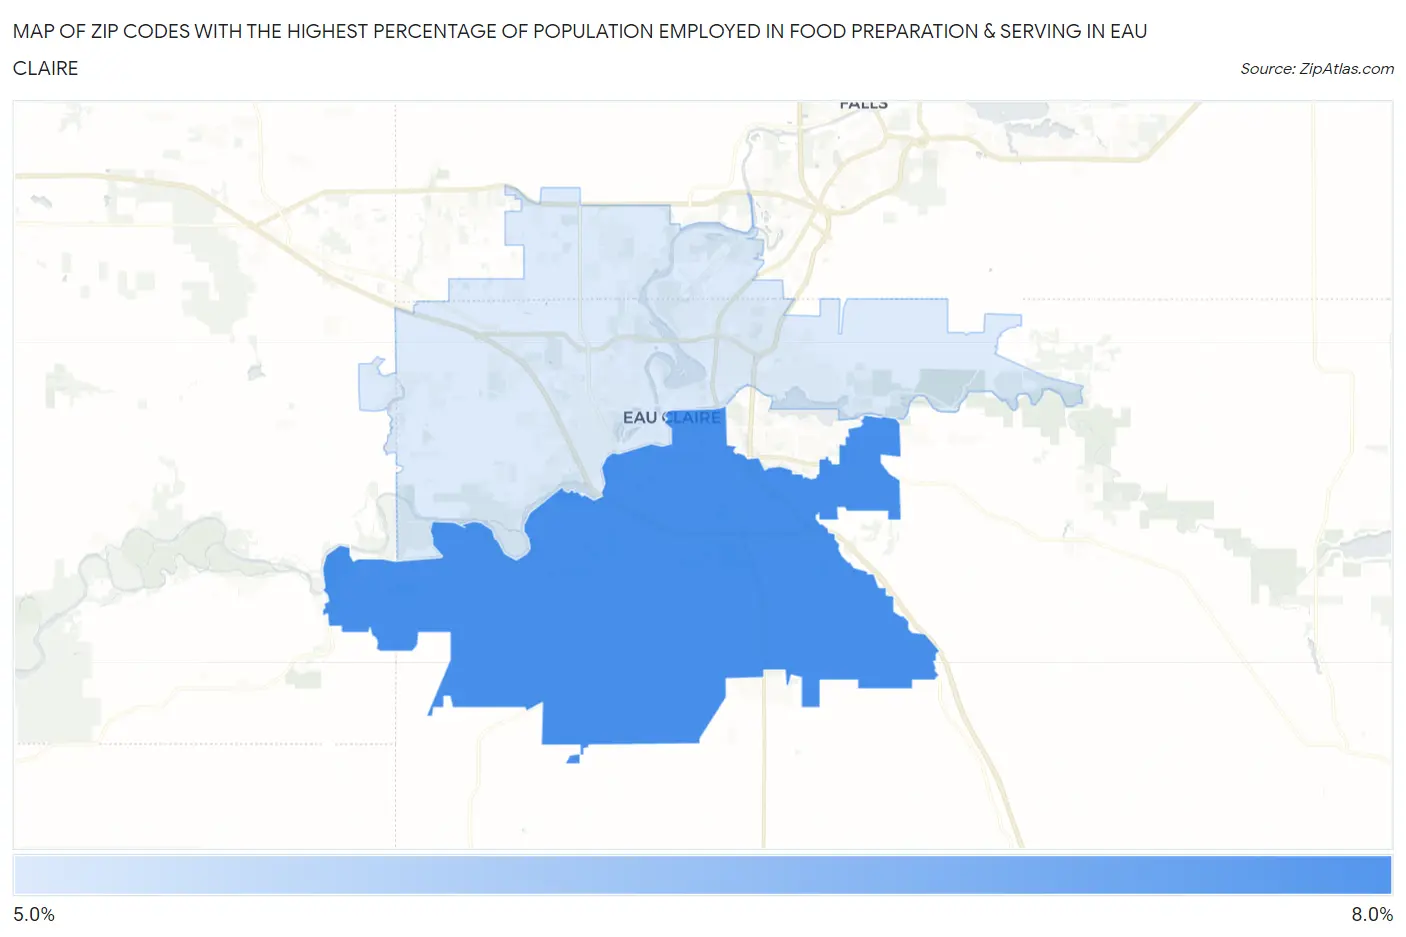
Map of Zip Codes with the Highest Percentage of Population Employed in Food Preparation & Serving in Eau Claire
5.8%
6.2%
Zip Codes with the Highest Percentage of Population Employed in Food Preparation & Serving in Eau Claire, WI
| Zip Code | % Employed | vs State | vs National | |
| 1. | 54701 | 6.2% | 5.0%(+1.25)#140 | 5.3%(+0.949)#8,629 |
| 2. | 54703 | 5.8% | 5.0%(+0.854)#176 | 5.3%(+0.555)#9,896 |
1
Common Questions
What are the Top Zip Codes with the Highest Percentage of Population Employed in Food Preparation & Serving in Eau Claire, WI?
Top Zip Codes with the Highest Percentage of Population Employed in Food Preparation & Serving in Eau Claire, WI are:
What zip code has the Highest Percentage of Population Employed in Food Preparation & Serving in Eau Claire, WI?
54701 has the Highest Percentage of Population Employed in Food Preparation & Serving in Eau Claire, WI with 6.2%.
What is the Percentage of Population Employed in Food Preparation & Serving in Eau Claire, WI?
Percentage of Population Employed in Food Preparation & Serving in Eau Claire is 6.8%.
What is the Percentage of Population Employed in Food Preparation & Serving in Wisconsin?
Percentage of Population Employed in Food Preparation & Serving in Wisconsin is 5.0%.
What is the Percentage of Population Employed in Food Preparation & Serving in the United States?
Percentage of Population Employed in Food Preparation & Serving in the United States is 5.3%.