Zip Codes with the Highest Percentage of Population Employed in Food Preparation & Serving in Stevens Point, WI
RELATED REPORTS & OPTIONS
Food Preparation & Serving
Stevens Point
Compare Zip Codes
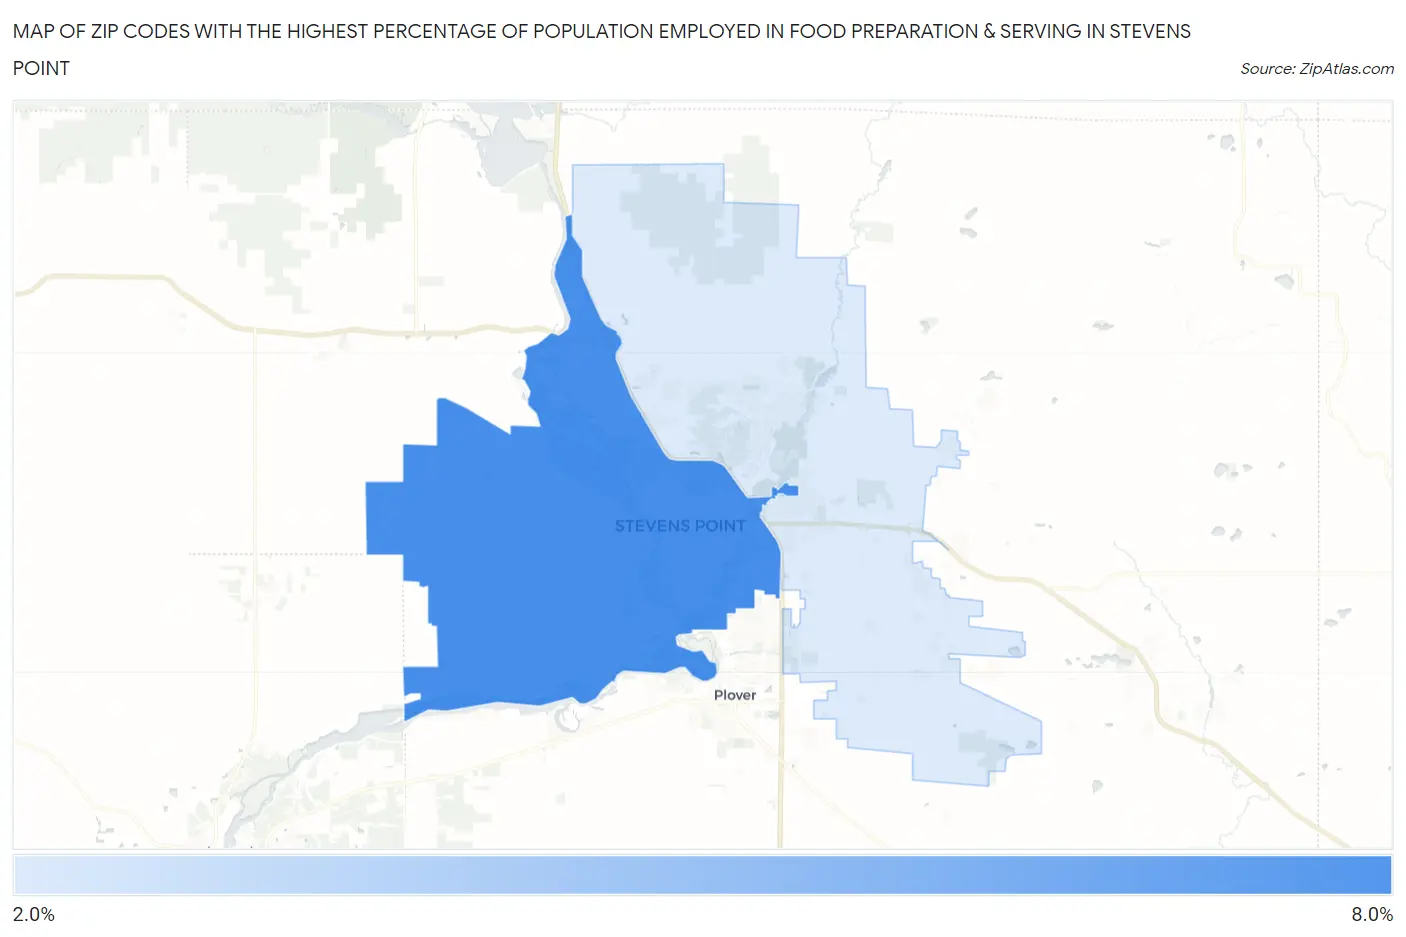
Map of Zip Codes with the Highest Percentage of Population Employed in Food Preparation & Serving in Stevens Point
2.6%
7.6%
Zip Codes with the Highest Percentage of Population Employed in Food Preparation & Serving in Stevens Point, WI
| Zip Code | % Employed | vs State | vs National | |
| 1. | 54481 | 7.6% | 5.0%(+2.65)#66 | 5.3%(+2.35)#5,322 |
| 2. | 54482 | 2.6% | 5.0%(-2.42)#637 | 5.3%(-2.72)#22,886 |
1
Common Questions
What are the Top Zip Codes with the Highest Percentage of Population Employed in Food Preparation & Serving in Stevens Point, WI?
Top Zip Codes with the Highest Percentage of Population Employed in Food Preparation & Serving in Stevens Point, WI are:
What zip code has the Highest Percentage of Population Employed in Food Preparation & Serving in Stevens Point, WI?
54481 has the Highest Percentage of Population Employed in Food Preparation & Serving in Stevens Point, WI with 7.6%.
What is the Percentage of Population Employed in Food Preparation & Serving in Stevens Point, WI?
Percentage of Population Employed in Food Preparation & Serving in Stevens Point is 7.7%.
What is the Percentage of Population Employed in Food Preparation & Serving in Wisconsin?
Percentage of Population Employed in Food Preparation & Serving in Wisconsin is 5.0%.
What is the Percentage of Population Employed in Food Preparation & Serving in the United States?
Percentage of Population Employed in Food Preparation & Serving in the United States is 5.3%.