Zip Codes with the Highest Percentage of Population Employed in Food Preparation & Serving in Mequon, WI
RELATED REPORTS & OPTIONS
Food Preparation & Serving
Mequon
Compare Zip Codes
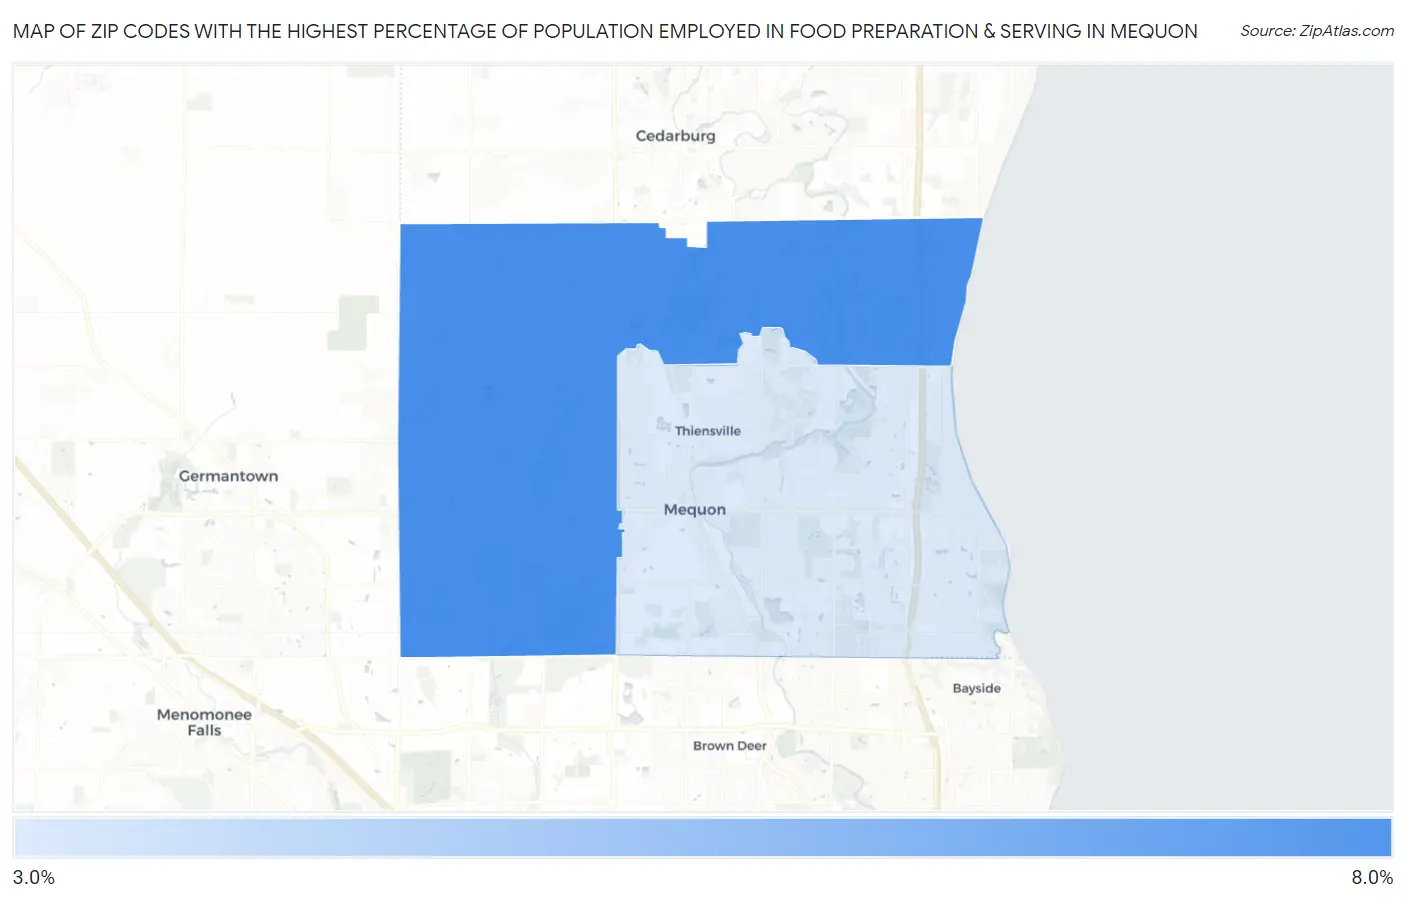
Map of Zip Codes with the Highest Percentage of Population Employed in Food Preparation & Serving in Mequon
3.2%
7.2%
Zip Codes with the Highest Percentage of Population Employed in Food Preparation & Serving in Mequon, WI
| Zip Code | % Employed | vs State | vs National | |
| 1. | 53097 | 7.2% | 5.0%(+2.24)#85 | 5.3%(+1.94)#6,064 |
| 2. | 53092 | 3.2% | 5.0%(-1.84)#563 | 5.3%(-2.14)#20,658 |
1
Common Questions
What are the Top Zip Codes with the Highest Percentage of Population Employed in Food Preparation & Serving in Mequon, WI?
Top Zip Codes with the Highest Percentage of Population Employed in Food Preparation & Serving in Mequon, WI are:
What zip code has the Highest Percentage of Population Employed in Food Preparation & Serving in Mequon, WI?
53097 has the Highest Percentage of Population Employed in Food Preparation & Serving in Mequon, WI with 7.2%.
What is the Percentage of Population Employed in Food Preparation & Serving in Mequon, WI?
Percentage of Population Employed in Food Preparation & Serving in Mequon is 4.2%.
What is the Percentage of Population Employed in Food Preparation & Serving in Wisconsin?
Percentage of Population Employed in Food Preparation & Serving in Wisconsin is 5.0%.
What is the Percentage of Population Employed in Food Preparation & Serving in the United States?
Percentage of Population Employed in Food Preparation & Serving in the United States is 5.3%.