Zip Codes with the Highest Percentage of Population Employed in Health Diagnosing & Treating in Milwaukee, WI
RELATED REPORTS & OPTIONS
Health Diagnosing & Treating
Milwaukee
Compare Zip Codes
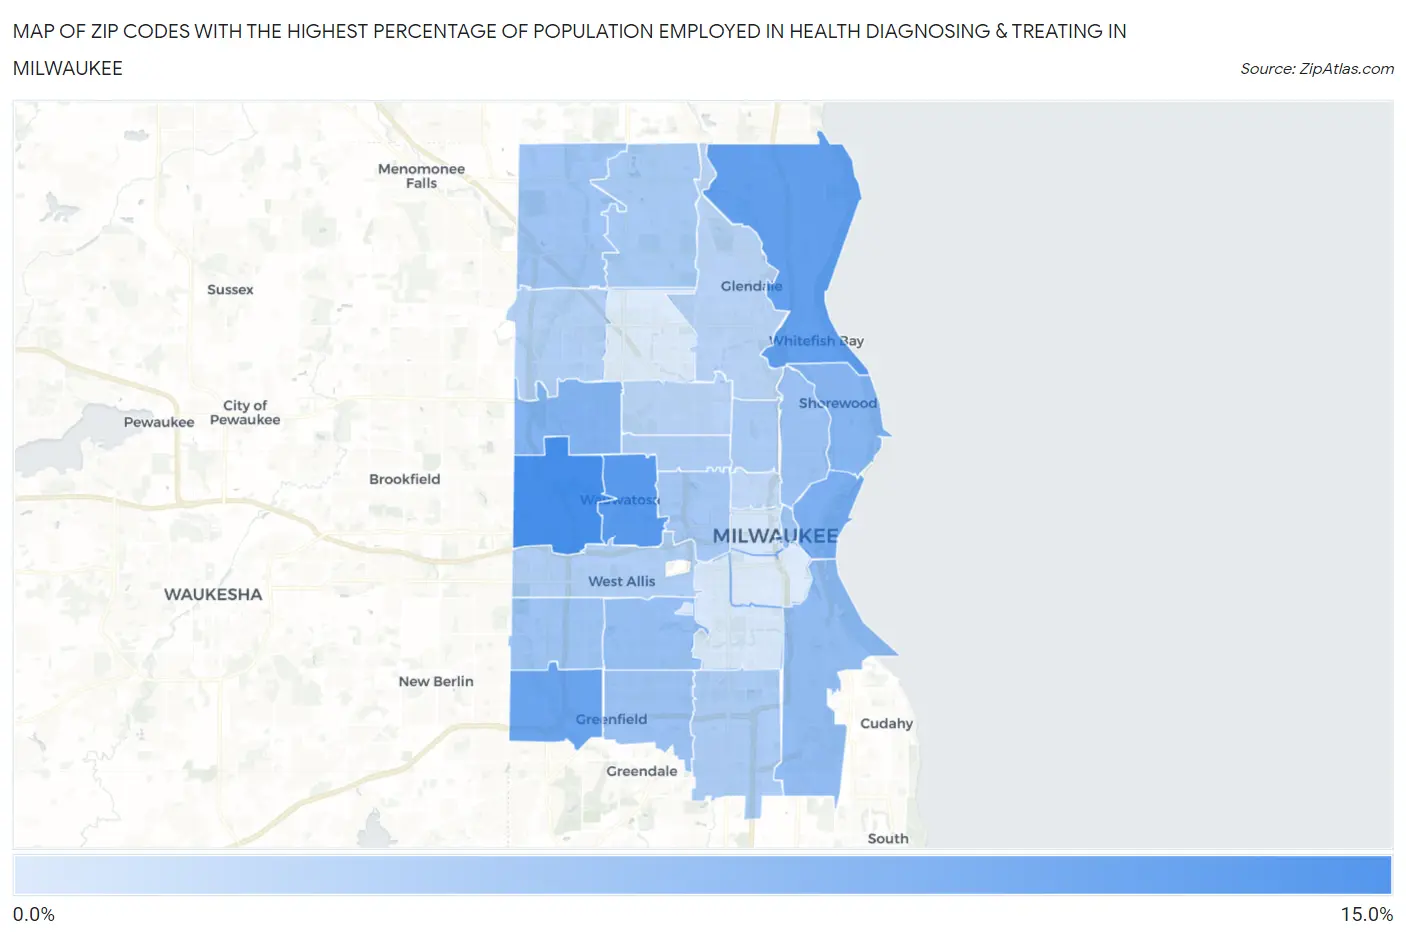
Map of Zip Codes with the Highest Percentage of Population Employed in Health Diagnosing & Treating in Milwaukee
2.3%
11.9%
Zip Codes with the Highest Percentage of Population Employed in Health Diagnosing & Treating in Milwaukee, WI
| Zip Code | % Employed | vs State | vs National | |
| 1. | 53226 | 11.9% | 6.3%(+5.59)#20 | 6.2%(+5.69)#2,260 |
| 2. | 53213 | 10.9% | 6.3%(+4.58)#30 | 6.2%(+4.68)#2,946 |
| 3. | 53217 | 10.1% | 6.3%(+3.81)#40 | 6.2%(+3.90)#3,701 |
| 4. | 53228 | 9.5% | 6.3%(+3.16)#57 | 6.2%(+3.26)#4,538 |
| 5. | 53202 | 8.4% | 6.3%(+2.09)#87 | 6.2%(+2.18)#6,477 |
| 6. | 53222 | 8.0% | 6.3%(+1.61)#106 | 6.2%(+1.71)#7,633 |
| 7. | 53211 | 7.6% | 6.3%(+1.30)#121 | 6.2%(+1.40)#8,397 |
| 8. | 53207 | 7.0% | 6.3%(+0.652)#178 | 6.2%(+0.746)#10,383 |
| 9. | 53219 | 6.7% | 6.3%(+0.336)#209 | 6.2%(+0.431)#11,395 |
| 10. | 53212 | 6.5% | 6.3%(+0.148)#232 | 6.2%(+0.243)#12,069 |
| 11. | 53220 | 6.4% | 6.3%(+0.034)#247 | 6.2%(+0.128)#12,492 |
| 12. | 53227 | 6.2% | 6.3%(-0.090)#257 | 6.2%(+0.005)#12,960 |
| 13. | 53203 | 6.2% | 6.3%(-0.169)#269 | 6.2%(-0.074)#13,265 |
| 14. | 53224 | 6.1% | 6.3%(-0.222)#276 | 6.2%(-0.128)#13,470 |
| 15. | 53208 | 5.8% | 6.3%(-0.507)#312 | 6.2%(-0.413)#14,480 |
| 16. | 53223 | 5.6% | 6.3%(-0.782)#354 | 6.2%(-0.688)#15,553 |
| 17. | 53221 | 5.4% | 6.3%(-0.980)#376 | 6.2%(-0.886)#16,334 |
| 18. | 53206 | 5.3% | 6.3%(-1.08)#393 | 6.2%(-0.987)#16,719 |
| 19. | 53210 | 5.2% | 6.3%(-1.14)#407 | 6.2%(-1.05)#16,939 |
| 20. | 53214 | 5.1% | 6.3%(-1.28)#424 | 6.2%(-1.18)#17,461 |
| 21. | 53225 | 4.9% | 6.3%(-1.47)#447 | 6.2%(-1.37)#18,204 |
| 22. | 53209 | 4.6% | 6.3%(-1.70)#481 | 6.2%(-1.61)#19,111 |
| 23. | 53216 | 4.5% | 6.3%(-1.79)#497 | 6.2%(-1.70)#19,456 |
| 24. | 53205 | 4.0% | 6.3%(-2.29)#569 | 6.2%(-2.20)#21,226 |
| 25. | 53233 | 2.9% | 6.3%(-3.45)#665 | 6.2%(-3.36)#24,616 |
| 26. | 53215 | 2.5% | 6.3%(-3.80)#690 | 6.2%(-3.70)#25,423 |
| 27. | 53218 | 2.3% | 6.3%(-4.01)#703 | 6.2%(-3.92)#25,851 |
| 28. | 53204 | 2.3% | 6.3%(-4.02)#704 | 6.2%(-3.93)#25,894 |
1
Common Questions
What are the Top 10 Zip Codes with the Highest Percentage of Population Employed in Health Diagnosing & Treating in Milwaukee, WI?
Top 10 Zip Codes with the Highest Percentage of Population Employed in Health Diagnosing & Treating in Milwaukee, WI are:
What zip code has the Highest Percentage of Population Employed in Health Diagnosing & Treating in Milwaukee, WI?
53226 has the Highest Percentage of Population Employed in Health Diagnosing & Treating in Milwaukee, WI with 11.9%.
What is the Percentage of Population Employed in Health Diagnosing & Treating in Milwaukee, WI?
Percentage of Population Employed in Health Diagnosing & Treating in Milwaukee is 5.2%.
What is the Percentage of Population Employed in Health Diagnosing & Treating in Wisconsin?
Percentage of Population Employed in Health Diagnosing & Treating in Wisconsin is 6.3%.
What is the Percentage of Population Employed in Health Diagnosing & Treating in the United States?
Percentage of Population Employed in Health Diagnosing & Treating in the United States is 6.2%.