Zip Codes with the Highest Percentage of Population Employed in Architecture & Engineering in Milwaukee, WI
RELATED REPORTS & OPTIONS
Architecture & Engineering
Milwaukee
Compare Zip Codes
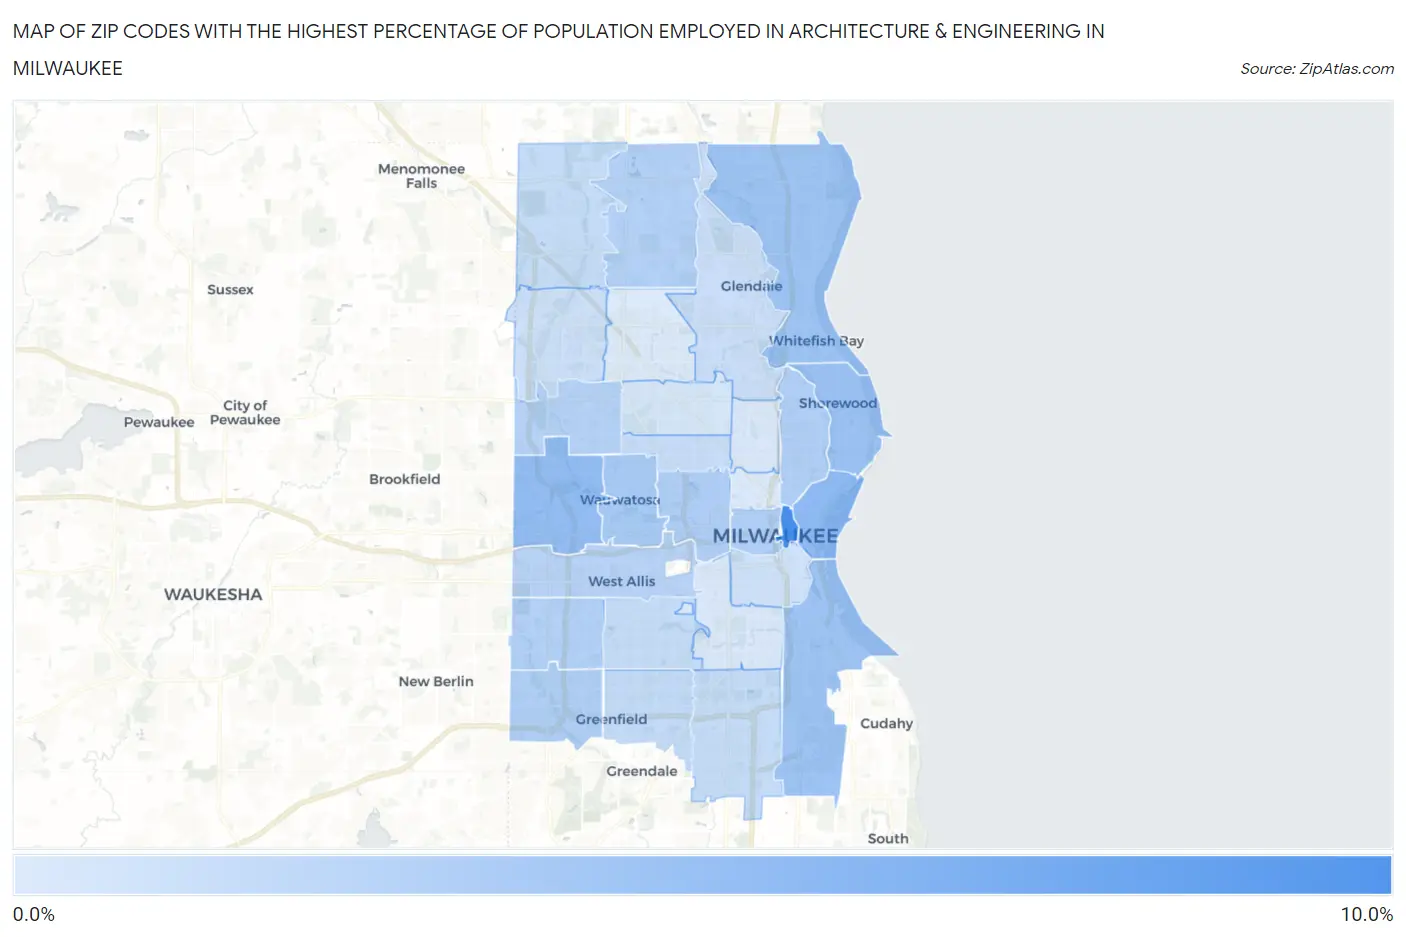
Map of Zip Codes with the Highest Percentage of Population Employed in Architecture & Engineering in Milwaukee
0.20%
8.7%
Zip Codes with the Highest Percentage of Population Employed in Architecture & Engineering in Milwaukee, WI
| Zip Code | % Employed | vs State | vs National | |
| 1. | 53203 | 8.7% | 2.2%(+6.47)#4 | 2.1%(+6.57)#458 |
| 2. | 53202 | 4.5% | 2.2%(+2.27)#30 | 2.1%(+2.37)#2,103 |
| 3. | 53226 | 4.3% | 2.2%(+2.03)#40 | 2.1%(+2.13)#2,398 |
| 4. | 53211 | 3.8% | 2.2%(+1.53)#56 | 2.1%(+1.62)#3,152 |
| 5. | 53207 | 3.6% | 2.2%(+1.39)#62 | 2.1%(+1.49)#3,433 |
| 6. | 53217 | 3.6% | 2.2%(+1.36)#64 | 2.1%(+1.46)#3,501 |
| 7. | 53213 | 3.2% | 2.2%(+0.940)#98 | 2.1%(+1.03)#4,503 |
| 8. | 53208 | 2.7% | 2.2%(+0.442)#156 | 2.1%(+0.536)#6,225 |
| 9. | 53212 | 2.7% | 2.2%(+0.427)#158 | 2.1%(+0.521)#6,284 |
| 10. | 53233 | 2.7% | 2.2%(+0.414)#162 | 2.1%(+0.509)#6,338 |
| 11. | 53228 | 2.6% | 2.2%(+0.388)#164 | 2.1%(+0.482)#6,439 |
| 12. | 53223 | 2.5% | 2.2%(+0.284)#183 | 2.1%(+0.378)#6,875 |
| 13. | 53227 | 2.5% | 2.2%(+0.245)#194 | 2.1%(+0.339)#7,052 |
| 14. | 53222 | 2.3% | 2.2%(+0.055)#222 | 2.1%(+0.150)#7,941 |
| 15. | 53214 | 2.2% | 2.2%(-0.058)#240 | 2.1%(+0.037)#8,558 |
| 16. | 53220 | 1.6% | 2.2%(-0.643)#354 | 2.1%(-0.549)#12,182 |
| 17. | 53221 | 1.5% | 2.2%(-0.741)#382 | 2.1%(-0.647)#12,870 |
| 18. | 53219 | 1.5% | 2.2%(-0.756)#389 | 2.1%(-0.662)#12,979 |
| 19. | 53224 | 1.4% | 2.2%(-0.795)#401 | 2.1%(-0.700)#13,244 |
| 20. | 53210 | 1.3% | 2.2%(-0.903)#437 | 2.1%(-0.809)#14,028 |
| 21. | 53209 | 1.3% | 2.2%(-0.990)#458 | 2.1%(-0.896)#14,653 |
| 22. | 53225 | 1.1% | 2.2%(-1.19)#510 | 2.1%(-1.09)#16,192 |
| 23. | 53204 | 0.97% | 2.2%(-1.27)#529 | 2.1%(-1.18)#16,807 |
| 24. | 53216 | 0.60% | 2.2%(-1.64)#626 | 2.1%(-1.55)#19,606 |
| 25. | 53206 | 0.36% | 2.2%(-1.88)#656 | 2.1%(-1.79)#21,216 |
| 26. | 53215 | 0.30% | 2.2%(-1.94)#665 | 2.1%(-1.85)#21,531 |
| 27. | 53205 | 0.23% | 2.2%(-2.01)#671 | 2.1%(-1.92)#21,905 |
| 28. | 53218 | 0.20% | 2.2%(-2.05)#680 | 2.1%(-1.95)#22,050 |
1
Common Questions
What are the Top 10 Zip Codes with the Highest Percentage of Population Employed in Architecture & Engineering in Milwaukee, WI?
Top 10 Zip Codes with the Highest Percentage of Population Employed in Architecture & Engineering in Milwaukee, WI are:
What zip code has the Highest Percentage of Population Employed in Architecture & Engineering in Milwaukee, WI?
53203 has the Highest Percentage of Population Employed in Architecture & Engineering in Milwaukee, WI with 8.7%.
What is the Percentage of Population Employed in Architecture & Engineering in Milwaukee, WI?
Percentage of Population Employed in Architecture & Engineering in Milwaukee is 1.8%.
What is the Percentage of Population Employed in Architecture & Engineering in Wisconsin?
Percentage of Population Employed in Architecture & Engineering in Wisconsin is 2.2%.
What is the Percentage of Population Employed in Architecture & Engineering in the United States?
Percentage of Population Employed in Architecture & Engineering in the United States is 2.1%.