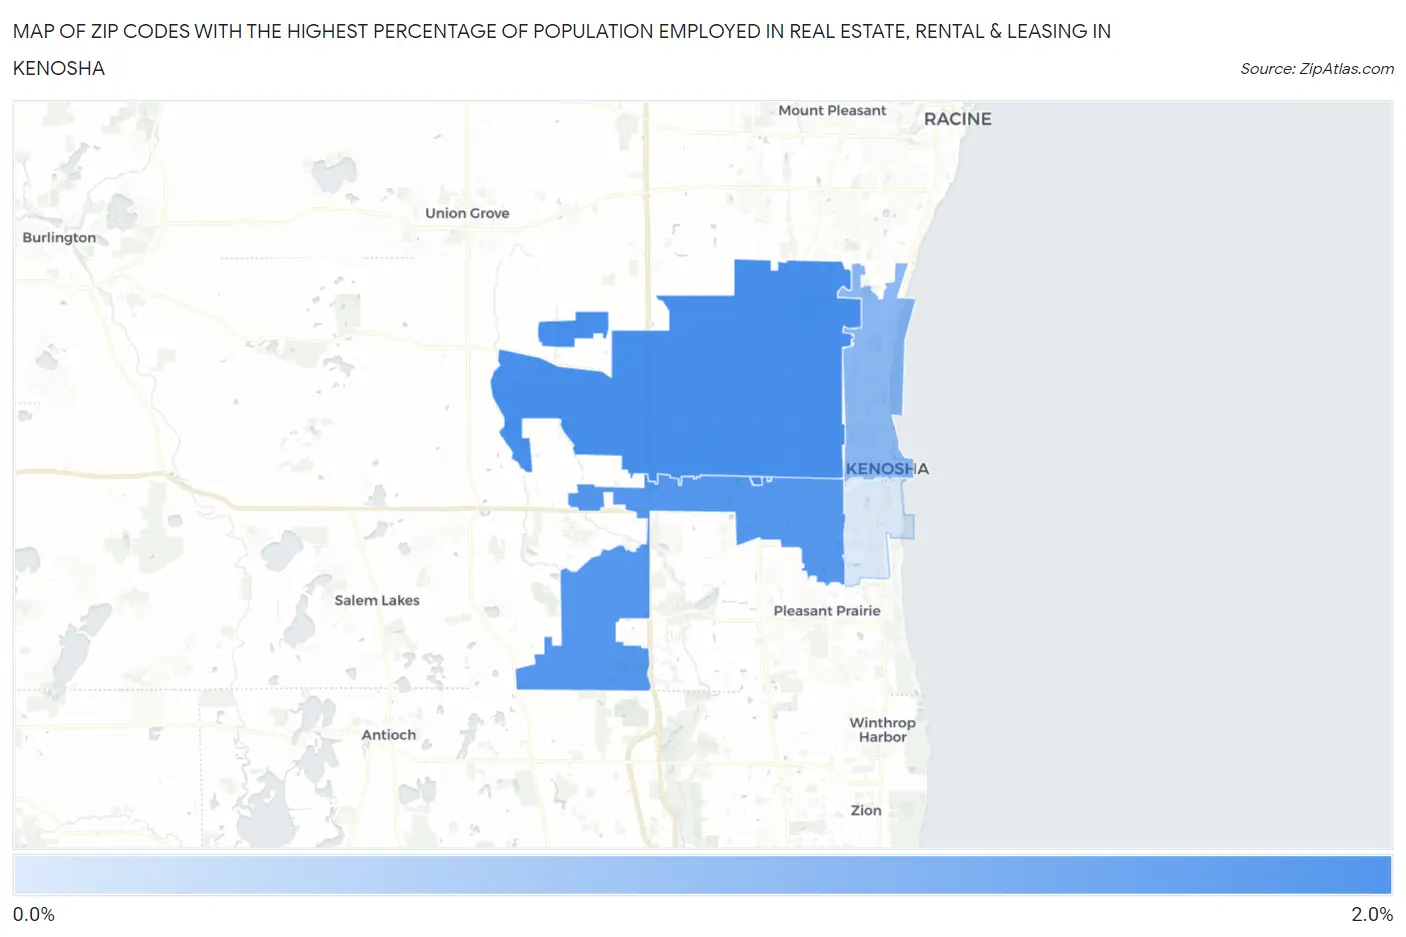
Zip Codes with the Highest Percentage of Population Employed in Real Estate, Rental & Leasing in Kenosha, WI
RELATED REPORTS & OPTIONS
Real Estate, Rental & Leasing
Kenosha
Compare Zip Codes
Map of Zip Codes with the Highest Percentage of Population Employed in Real Estate, Rental & Leasing in Kenosha
0.33%
1.6%
Zip Codes with the Highest Percentage of Population Employed in Real Estate, Rental & Leasing in Kenosha, WI
| Zip Code | % Employed | vs State | vs National | |
| 1. | 53144 | 1.6% | 1.2%(+0.338)#177 | 1.9%(-0.308)#10,557 |
| 2. | 53142 | 1.5% | 1.2%(+0.213)#212 | 1.9%(-0.433)#11,497 |
| 3. | 53140 | 1.0% | 1.2%(-0.222)#321 | 1.9%(-0.868)#14,952 |
| 4. | 53143 | 0.33% | 1.2%(-0.911)#569 | 1.9%(-1.56)#20,243 |
1
Common Questions
What are the Top 3 Zip Codes with the Highest Percentage of Population Employed in Real Estate, Rental & Leasing in Kenosha, WI?
Top 3 Zip Codes with the Highest Percentage of Population Employed in Real Estate, Rental & Leasing in Kenosha, WI are:
What zip code has the Highest Percentage of Population Employed in Real Estate, Rental & Leasing in Kenosha, WI?
53144 has the Highest Percentage of Population Employed in Real Estate, Rental & Leasing in Kenosha, WI with 1.6%.
What is the Percentage of Population Employed in Real Estate, Rental & Leasing in Kenosha, WI?
Percentage of Population Employed in Real Estate, Rental & Leasing in Kenosha is 1.0%.
What is the Percentage of Population Employed in Real Estate, Rental & Leasing in Wisconsin?
Percentage of Population Employed in Real Estate, Rental & Leasing in Wisconsin is 1.2%.
What is the Percentage of Population Employed in Real Estate, Rental & Leasing in the United States?
Percentage of Population Employed in Real Estate, Rental & Leasing in the United States is 1.9%.