Zip Codes with the Highest Percentage of Population Employed in Architecture & Engineering in Eau Claire, WI
RELATED REPORTS & OPTIONS
Architecture & Engineering
Eau Claire
Compare Zip Codes
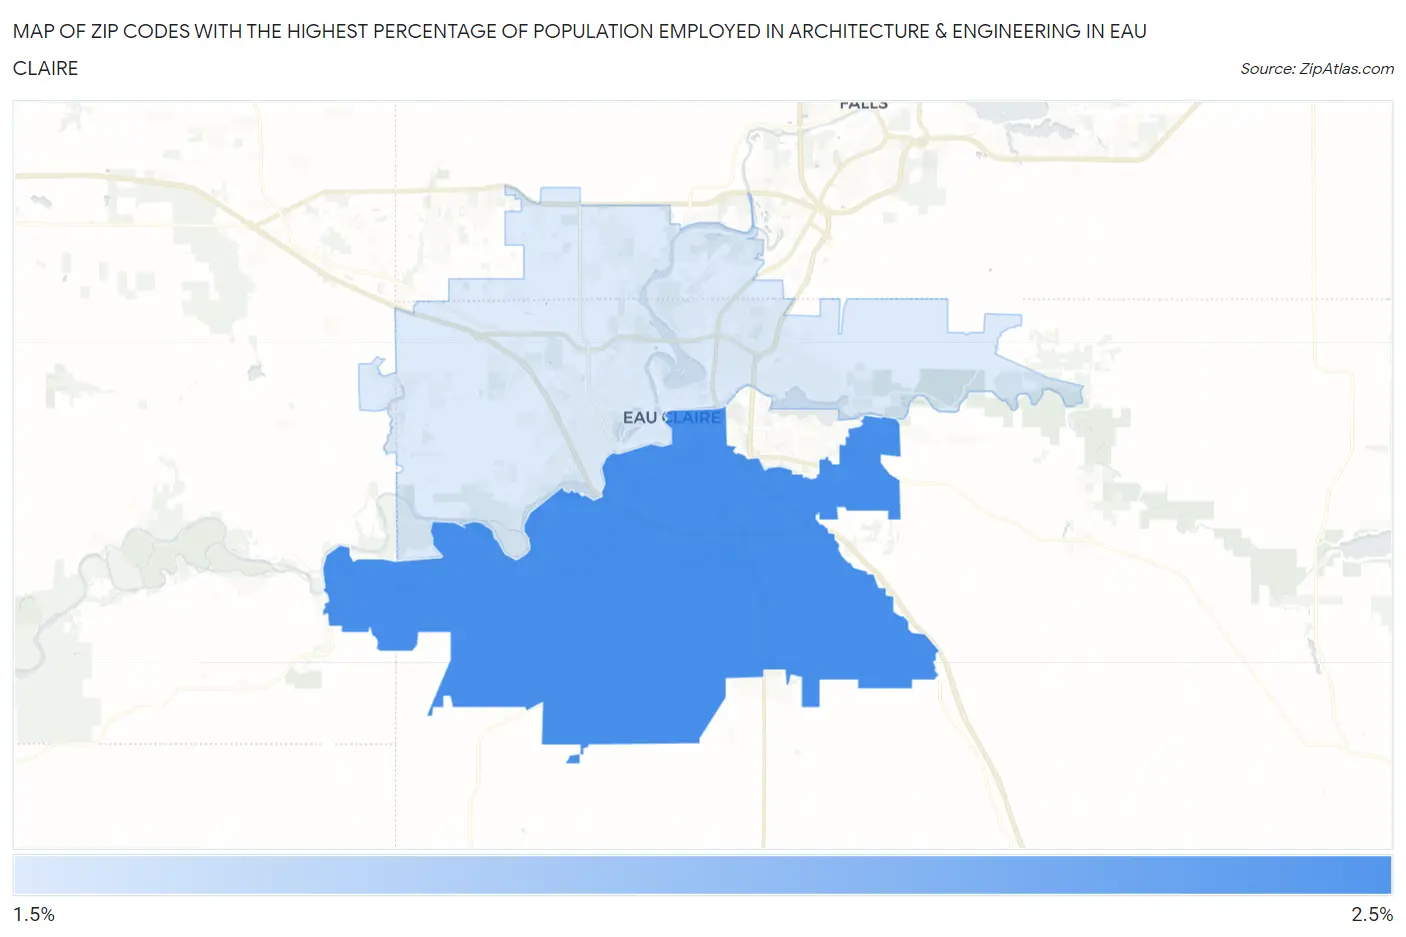
Map of Zip Codes with the Highest Percentage of Population Employed in Architecture & Engineering in Eau Claire
1.8%
2.1%
Zip Codes with the Highest Percentage of Population Employed in Architecture & Engineering in Eau Claire, WI
| Zip Code | % Employed | vs State | vs National | |
| 1. | 54701 | 2.1% | 2.2%(-0.186)#260 | 2.1%(-0.092)#9,281 |
| 2. | 54703 | 1.8% | 2.2%(-0.493)#328 | 2.1%(-0.398)#11,151 |
1
Common Questions
What are the Top Zip Codes with the Highest Percentage of Population Employed in Architecture & Engineering in Eau Claire, WI?
Top Zip Codes with the Highest Percentage of Population Employed in Architecture & Engineering in Eau Claire, WI are:
What zip code has the Highest Percentage of Population Employed in Architecture & Engineering in Eau Claire, WI?
54701 has the Highest Percentage of Population Employed in Architecture & Engineering in Eau Claire, WI with 2.1%.
What is the Percentage of Population Employed in Architecture & Engineering in Eau Claire, WI?
Percentage of Population Employed in Architecture & Engineering in Eau Claire is 1.9%.
What is the Percentage of Population Employed in Architecture & Engineering in Wisconsin?
Percentage of Population Employed in Architecture & Engineering in Wisconsin is 2.2%.
What is the Percentage of Population Employed in Architecture & Engineering in the United States?
Percentage of Population Employed in Architecture & Engineering in the United States is 2.1%.