Zip Codes with the Highest Percentage of Population Employed in Agriculture, Fishing & Hunting in Olympia, WA
RELATED REPORTS & OPTIONS
Agriculture, Fishing & Hunting
Olympia
Compare Zip Codes
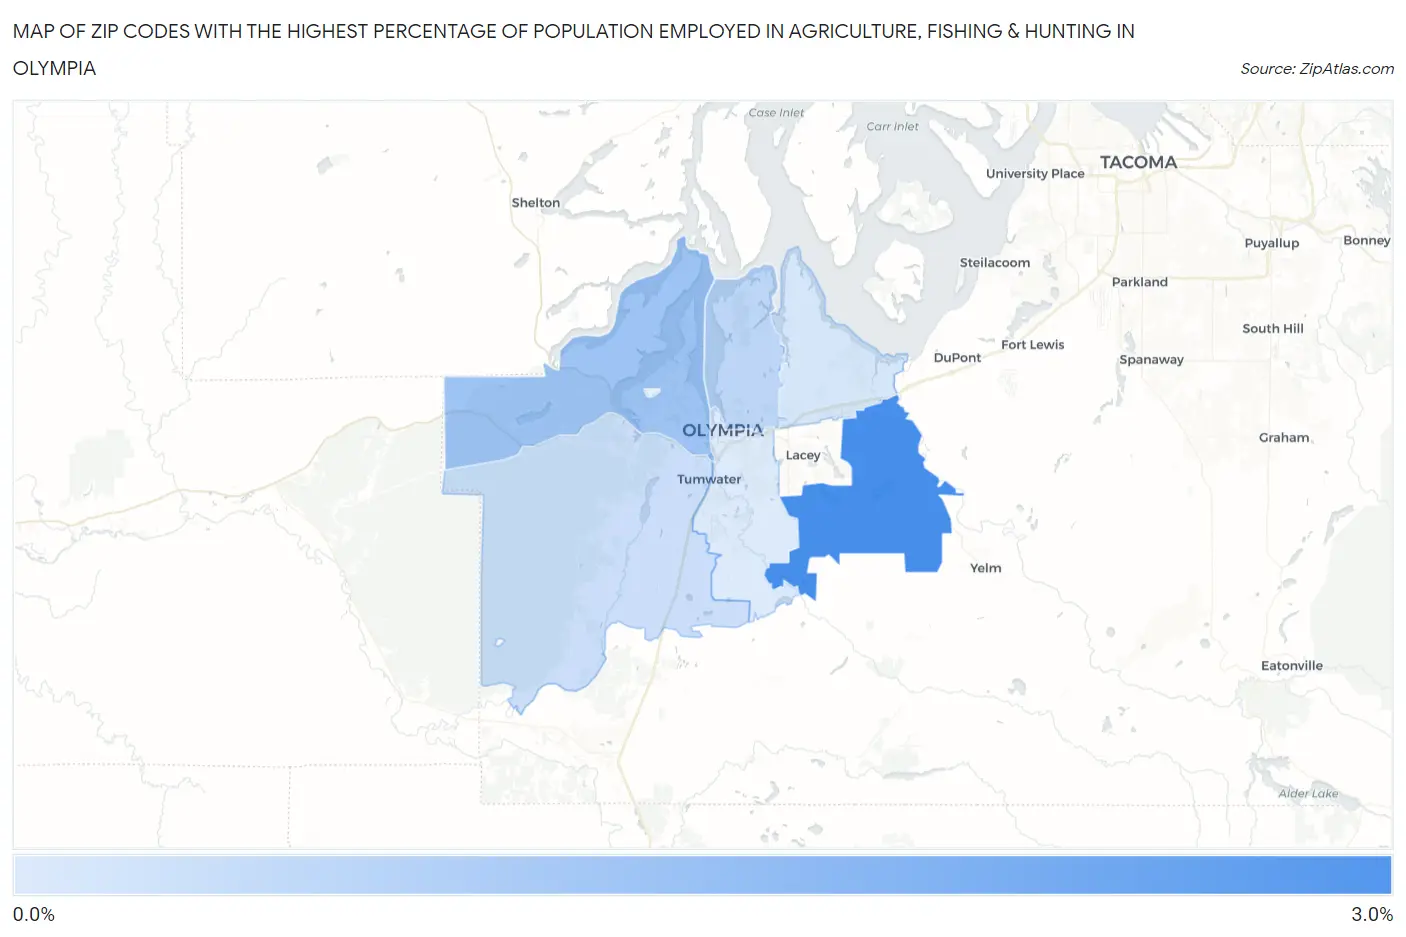
Map of Zip Codes with the Highest Percentage of Population Employed in Agriculture, Fishing & Hunting in Olympia
0.99%
2.9%
Zip Codes with the Highest Percentage of Population Employed in Agriculture, Fishing & Hunting in Olympia, WA
| Zip Code | % Employed | vs State | vs National | |
| 1. | 98513 | 2.9% | 2.4%(+0.484)#257 | 1.2%(+1.68)#10,801 |
| 2. | 98502 | 1.8% | 2.4%(-0.638)#290 | 1.2%(+0.553)#13,495 |
| 3. | 98506 | 1.4% | 2.4%(-1.01)#316 | 1.2%(+0.178)#14,736 |
| 4. | 98512 | 1.2% | 2.4%(-1.18)#324 | 1.2%(+0.008)#15,373 |
| 5. | 98516 | 1.1% | 2.4%(-1.31)#338 | 1.2%(-0.115)#15,864 |
| 6. | 98501 | 0.99% | 2.4%(-1.40)#352 | 1.2%(-0.213)#16,291 |
1
Common Questions
What are the Top 5 Zip Codes with the Highest Percentage of Population Employed in Agriculture, Fishing & Hunting in Olympia, WA?
Top 5 Zip Codes with the Highest Percentage of Population Employed in Agriculture, Fishing & Hunting in Olympia, WA are:
What zip code has the Highest Percentage of Population Employed in Agriculture, Fishing & Hunting in Olympia, WA?
98513 has the Highest Percentage of Population Employed in Agriculture, Fishing & Hunting in Olympia, WA with 2.9%.
What is the Percentage of Population Employed in Agriculture, Fishing & Hunting in Olympia, WA?
Percentage of Population Employed in Agriculture, Fishing & Hunting in Olympia is 1.4%.
What is the Percentage of Population Employed in Agriculture, Fishing & Hunting in Washington?
Percentage of Population Employed in Agriculture, Fishing & Hunting in Washington is 2.4%.
What is the Percentage of Population Employed in Agriculture, Fishing & Hunting in the United States?
Percentage of Population Employed in Agriculture, Fishing & Hunting in the United States is 1.2%.