Zip Codes with the Highest Percentage of Population Employed in Professional & Scientific Services in Georgetown, TX
RELATED REPORTS & OPTIONS
Professional & Scientific Services
Georgetown
Compare Zip Codes
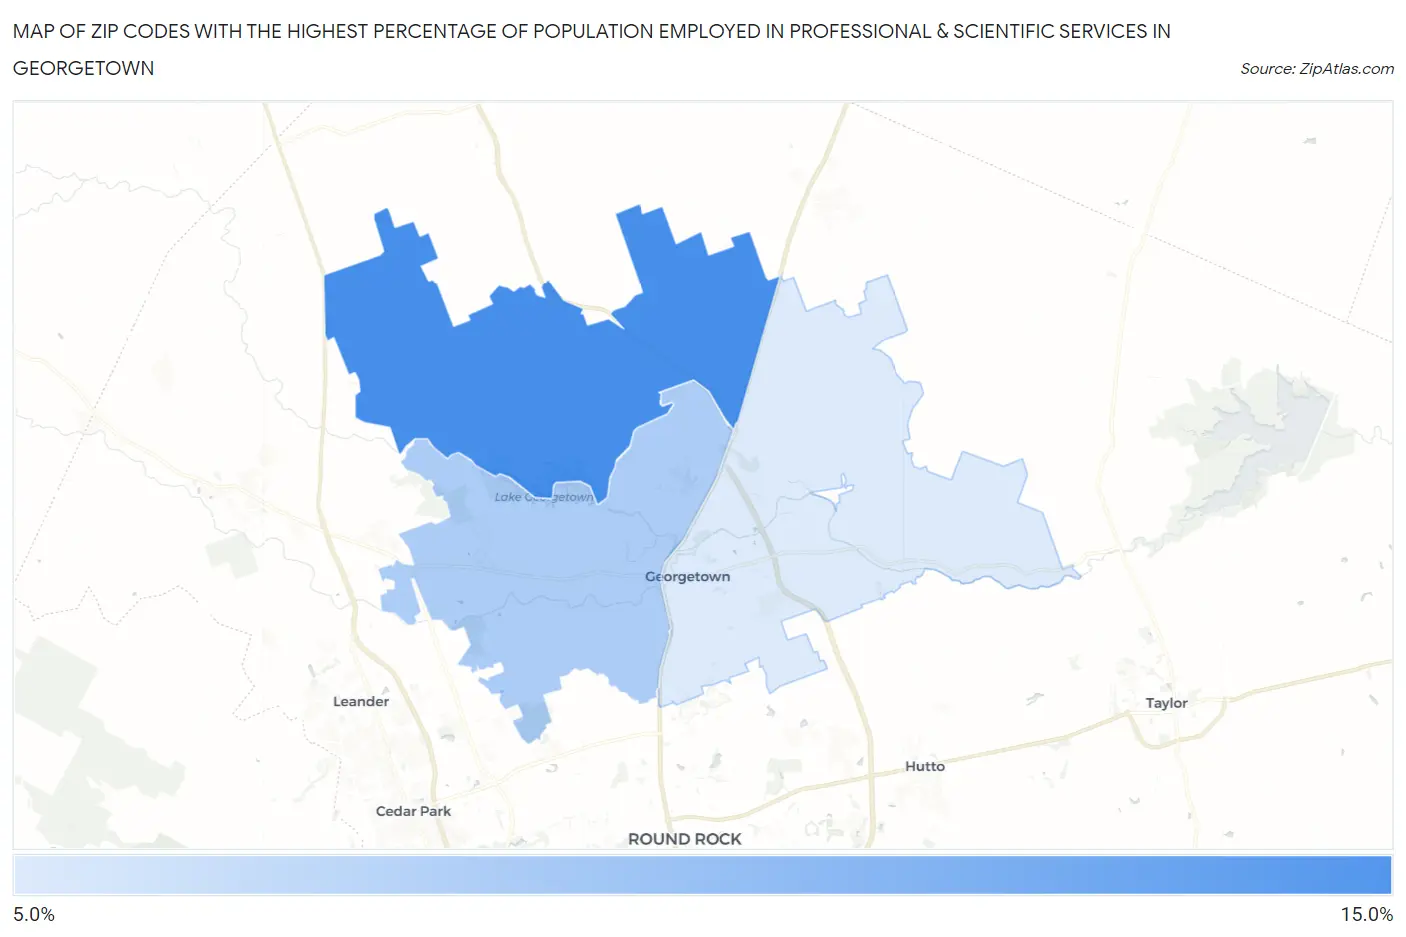
Map of Zip Codes with the Highest Percentage of Population Employed in Professional & Scientific Services in Georgetown
8.7%
14.9%
Zip Codes with the Highest Percentage of Population Employed in Professional & Scientific Services in Georgetown, TX
| Zip Code | % Employed | vs State | vs National | |
| 1. | 78633 | 14.9% | 7.6%(+7.26)#118 | 7.8%(+7.01)#1,958 |
| 2. | 78628 | 10.6% | 7.6%(+3.04)#216 | 7.8%(+2.79)#4,072 |
| 3. | 78626 | 8.7% | 7.6%(+1.13)#295 | 7.8%(+0.882)#5,790 |
1
Common Questions
What are the Top Zip Codes with the Highest Percentage of Population Employed in Professional & Scientific Services in Georgetown, TX?
Top Zip Codes with the Highest Percentage of Population Employed in Professional & Scientific Services in Georgetown, TX are:
What zip code has the Highest Percentage of Population Employed in Professional & Scientific Services in Georgetown, TX?
78633 has the Highest Percentage of Population Employed in Professional & Scientific Services in Georgetown, TX with 14.9%.
What is the Percentage of Population Employed in Professional & Scientific Services in Georgetown, TX?
Percentage of Population Employed in Professional & Scientific Services in Georgetown is 9.3%.
What is the Percentage of Population Employed in Professional & Scientific Services in Texas?
Percentage of Population Employed in Professional & Scientific Services in Texas is 7.6%.
What is the Percentage of Population Employed in Professional & Scientific Services in the United States?
Percentage of Population Employed in Professional & Scientific Services in the United States is 7.8%.